Abstract
We compare the vortex evolutions of eyewall replacement cycles (ERCs) between the sea-surface and the free-atmosphere levels and investigate the asymmetric structure of concentric eyewalls (CEs) by examining a combination of aircraft observations and surface wind fields derived from C-band spaceborne synthetic aperture radar (SAR) images during Hurricane Irma (2017) from 4 September 2017 to 8 September 2017. A total of 116 radial wind profiles measured by an aircraft were collected and showed that ERCs occur at both the sea-surface and the free-atmosphere levels. The outer eyewall was shown to form at the free atmospheric level (~3 km) with a narrow structure at the sea-surface level and an outward tilt with height in the cross-section. In our study, four ERC events were determined from wind profile parameters fitted by a modified Rankine vortex model, which was validated by 328 radial legs collected from six hurricanes. The outer eyewall did not replace the inner eyewall at the sea-surface level in the third ERC, due to the maintenance of a short duration and intense original eyewall. Additionally, Irma’s intensity weakened during the fourth ERC rather than re-intensified, because of the generation of a third wind maximum outside the secondary eyewall. Comparisons of five SAR-derived surface wind fields in Irma and another two hurricane cases illustrated that the location of the secondary eyewall generation is a key point in the interpretation of anomaly intensity changes in the fourth ERC.
1. Introduction
Concentric eyewalls (CEs) are frequently occurring phenomena in intense tropical cyclones (TCs), characterized by quasi-circular convective rings with dual wind maxima in the radial direction, which play an important role in TC intensity and structure [1,2,3,4]. CEs typically accompany eyewall replacement cycles (ERC), leading to dramatic changes in the TC central pressure, precipitation, and wind field [4,5]. The associated rapid precipitation and sudden wind field expansion can cause much stronger storm surges in coastal regions at landfall [6,7]. As a lack of fine-scale observations, the internal dynamics of the CEs and ERC processes are not clear. Thus, it is critical to understand the characteristics and evolution of CEs in order to improve TC intensity prediction [8,9].
During a typical ERC, the preexisting eyewall will decay and contract inwards as the outer eyewall develops, cutting off the heat and moisture flowing into the storm center. As the outer eyewall intensifies, the inner eyewall collapses while the outer eyewall takes over the TC [1,2,5,10]. Based on aircraft observations in 24 ERCs in 14 hurricanes in the Atlantic Basin, classic ERCs are identified into three distinct phases in terms of intensity change: intensification, weakening, and re-intensification [5]. The intensification phase occurs from the time of the first appearance of an outer wind maximum until the time when the inner eyewall reaches its maximum intensity. This phase is also referred to as the secondary eyewall formation (SEF) phase. Thereafter, the inner wind maximum decreases until the outer eyewall intensity exceeds the inner eyewall, which is the so-called weakening phase. The phase that follows is the re-intensification phase, which occurs from the time that the outer wind maximum surpasses the inner wind maximum until the time when the inner eyewall can no longer be detected. However, not all the CEs undergo eyewall replacement. A statistical analysis of passive microwave satellite images of 77 typhoons in the Northwest Pacific allowed a further classification of sea-surface CEs into two categories. These are the CEs where no replacement cycle occurs when the outer eyewall disappears within 20 h and the CEs that are maintained for extended periods. In particular, CEMs (concentric eyewalls maintained) are said to occur when CEs coexist for more than 20 h [11]. The classifications above are associated with the free-atmosphere or the sea-surface levels solely, and comparisons with vortex evolution during the ERC process between the two levels remains unclear.
Studies have focused on the physical mechanism under an axisymmetric vortex framework to explain the secondary eyewall formation (SEF) [12,13,14,15]. These axisymmetric dynamics have demonstrated that the feedback between the outer rainband convection and inner vortex can strengthen the convective activity in the outer rainbands and spin up a secondary wind maximum in the boundary layer. However, the TC rainband is asymmetric in the atmosphere, influenced by environmental vertical wind shear [16,17]. Observations have also confirmed that the secondary eyewall forms under asymmetric dynamics. In observational studies of Hurricanes Rita (2005) and Earl (2010), mesoscale descending inflow (MDI), driven by stratiform precipitation in the downwind areas of the wind shear, induced local convergence regions and intense updrafts between the eyewall and outer rainbands, where secondary eyewalls were generated [18,19,20]. Multiple aircraft observations revealed the role of two ERCs during the rapid intensification of Hurricane Irma (2017) and demonstrated that MDI was the dominant factor that led to SEF in the second ERC events [20]. As aircraft observations tend to sample the storm radially, 2D wind field observations are essential to study the CEs’ asymmetric structure and supply the asymmetric SEF dynamics.
Spaceborne synthetic aperture radar (SAR) can provide high-resolution structural features in TC surface wind fields. C-band cross-polarized SAR signals are sensitive to wind speeds and unsaturated in high wind conditions [21]. Studies have shown that C-band dual-polarized SAR observations can retrieve accurate TC wind fields [22,23,24,25]. The root-mean-square (rms) error is approximately 5 m/s for wind speeds up to 75 m/s compared with collocated stepped-frequency microwave radiometer (SFMR) observations [25]. Studies have shown that SAR-derived wind fields provide a unique opportunity to study surface characteristics of CEs with a high resolution [26,27]. Two consecutive SAR images passing over Hurricane Ike (2008) captured CEs in 2D sea-surface winds and reported that the primary eyewall did not decay, despite the secondary eyewall developed [26]. Using an idealized vortex model, CE structures in Hurricane Bertha (2008), imaged by SAR, confirmed that the axisymmetric dynamics followed the conventional theory [12,13,14,15,27].
In this study, a combination of 116 radial legs measured by reconnaissance aircraft and high-resolution surface wind fields derived from dual-polarization SAR imagery during Hurricane Irma (2017) were used to compare the vortex evolution between the sea-surface and the free-atmosphere levels and to investigate the asymmetric surface structure of CEs from 4 September 2017 to 8 September 2017. The remainder of this paper is organized as follows: Section 2 describes the data sets and model approach. We compare the evolution of the ERC process at the sea-surface level with that at the free-atmosphere level and investigate the asymmetric structure of CEs from Hurricane Irma (2017) in Section 3. Discussion and conclusions are provided in Section 4 and Section 5, respectively.
2. Dataset and Method
2.1. Aircraft Observations
Observations of TCs over the ocean are sparse. Aircraft observations provide important measurements of TC intensity and structure in the inner core over the ocean. The aircraft frequently flies through the storm center to observe wind speed along the track at the flight level. Nowadays, the SFMR onboard aircraft is routinely used to retrieve TC sea-surface wind speed by measuring the surface brightness temperatures from six C-band frequencies between 4.5 and 7.2 GHz. SFMR wind estimates have been validated by Global Positioning System (GPS) dropsondes and in situ instrument measurements and have been shown to have rms errors of less than 4 and 5 m/s [28,29]. The temporal and spatial resolutions along the track are 1 s × 120 m. Therefore, wind speed along the track at the flight level and sea surface can be measured at the same frequency from multiple aircraft missions, which provides measurements needed to compare the ERC process at different altitudes. In total, 444 radial transect legs were collected by National Oceanic and Atmospheric Administration (NOAA) aircraft missions for seven hurricanes, including Hurricanes Diana (1984), Erika (1997), Georges (1998), Floyd (1999), Isidore (2002), Isabel (2003), and Irma (2017). Table 1 lists the Hurricane name, associated intensity category, the approximate start/end time, and the number of the sampled legs. For the first six hurricanes mentioned here, we obtained 328 radial legs for model validation at the flight level only. For Hurricane Irma, we extracted 116 radial legs to compare the vortex evolution of the ERC process at different levels. Figure 1 shows the position of the radial legs with respect to the Best Track data and the sample period during Irma’s lifespan. Because the flight-level altitudes vary from 700 hPa to 850 hPa, we adjusted the flight-level wind speed to a common reference level of 700 hPa (~3 km) using an adjustment factor derived from dropsonde measurements to represent the free-atmosphere level [30]. Thereafter, wind speeds in each radial leg were smoothed using a moving window of 5 s and a spatial resampling at 1 km.

Table 1.
Details of the radial legs collected from multiple aircraft missions.
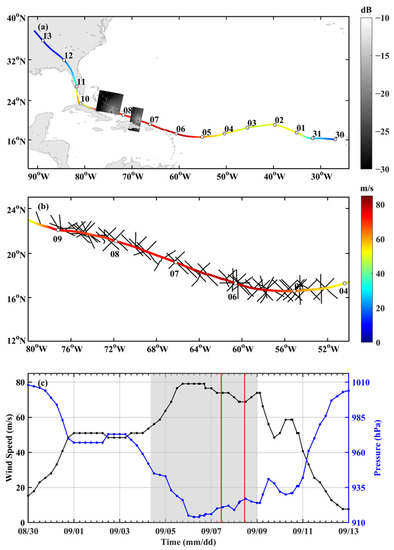
Figure 1.
(a) SAR images over Hurricane Irma (2017) with respect to the best track. The color bars denote σ0 (unit: dB) of the VH-polarization SAR image. RADARSAT-2 Data and Products MacDonald, Dettwiler, and Associates Ltd. (2008–2009). (b) The geolocations of 116 radial legs from 4 to 8 September 2017. The color bar (unit: m/s) denotes the intensity of Irma from the Best Track estimates. (c) The evolution of maximum sustained 10-m winds (m/s; black line) and minimum surface pressure (hPa; blue line) associated with Hurricane Irma (2017). The periods of aircraft observations are shaded in gray. The red vertical lines depict the acquisition times of SAR images.
2.2. C-Band SAR Wind Data
Satellite observations of hurricanes were provided by the operational space component of the European Copernicus program with Sentinel 1-A (S1-A) and by the Canadian Space Agency Hurricane Watch Program with RADARSAT-2 (RS-2). S1-A and RS-2 both carry a C-band SAR, providing dual-polarization (VV + VH) SAR images. In this study, five dual-polarization SAR images of three hurricanes were collected over the Atlantic Basin from 2017 to 2018. The list of hurricanes, intensity categories, and associated SAR observations are given in Table 2. Figure 1 shows the geolocation and acquisition time of Irma imaged by satellite SAR with respect to the Best Track data. The imaging modes are interferometric wide (IW) and extra wide (EW) for S1-A and ScanSAR wide (SCW) for RS-2. The swath width for the IW and EW modes was 250 km and 400 km, respectively; for the SCW mode, the swath width was 500 km. The incidence angles ranged from 17° to 49° depending on the sensor and modes. For S1-A, the spatial resolutions were 5 × 20 m and 20 × 40 m in the range and azimuth directions for the IW and EW modes, respectively, and for the RS-2 SCW mode, these were 163 × 73 m and 78 ×106 m. Studies have shown that dual-polarization SAR data can be used to retrieve high-resolution TC wind speeds and directions [22,23,24,25]. In this study, 3-km resolution TC surface wind fields derived from dual-polarization SAR imagery were used to investigate the surface wind asymmetry of CEs [25].
Table 2.
SAR acquisitions and corresponding hurricane information.
2.3. Model Approach and Validation
Radial wind profiles measured by aircrafts are noisy for the determination of dual wind maxima and locations of concentric eyewalls, especially for the outer eyewall. Therefore, a simple model and continuous analytic function were used to smooth or approximate the “real” wind profiles and give the “best-fit” wind profile, in order to estimate the maximum wind and the radius of maximum wind (RMW). By comparison, more complex equations have recently been developed to account for wind profiles with dual wind maxima [31,32]. Here, to study the evolution of the ERC process, we applied a modified Rankine vortex model suggested in a previous study [5] and further adapted it to wind profiles at the sea-surface level. The modified Rankine vortex model is a composite of two parts, namely a single modified Rankine vortex (SRV) model for wind profiles with a single wind maximum and a double modified Rankine vortex (DRV) model for dual wind maxima. The SRV model is described by Equation (1),
where is the value of the maximum wind at radius , and is a decay parameter. The resolutions of and were 0.5 km and 0.025, respectively. To identify the dual wind maxima in the CE wind profiles, five new parameters were introduced at the basis of the SRV model, named as , , , , and . The DRV model is described by Equation (2),
where , , and represent intensity parameters for the inner wind maximum, outer wind maximum, and wind minimum between the inner and outer eyewalls, respectively. Correspondingly, , , and represent the radii of the inner wind maximum, outer wind maximum, and moat, respectively; is the decay parameter between the inner eyewall to the moat, and is the decay parameter out of the outer eyewall. To avoid complex computation for the DRV model, the resolutions of , , and were reduced to 1 km, whereas and were resolved in increments of 0.1. Thus, the wind profile parameters could be determined with a third-order polynomial “best-fit line” to ensure that all data captured the intensity and structural evolutions. Figure 2 shows the DRV model visualization and “best-fit” wind profiles for Irma between 02:06 to 02:59 UTC, on 8 September, at the free-atmosphere level and sea-surface level. Figure 2b illustrates that the two wind maxima were both well captured at the two levels by the DRV model. Hence, The DRV model can provide fit profiles adequately to the real wind profiles, despite the resolution being reduced.
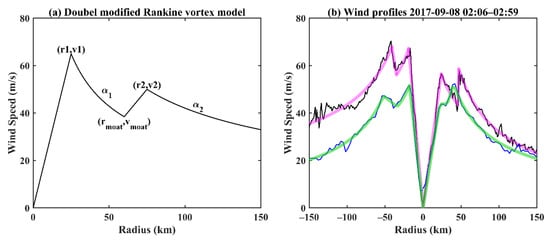
Figure 2.
(a) DRV model visualization labeled with the corresponding eight parameters. (b) An example of wind profiles at the free-atmosphere level (black solid line) and the sea-surface level (blue solid line) with the corresponding parameterized fit (magenta line and green line) employing the DRV model for Hurricane Irma from 02:06 to 02:59 UTC on 8 September 2017.
For model validation, 328 radial legs were collected at the free-atmosphere level from six hurricanes. Geolocations of the validation legs with respect to the Best Track estimates are given in Figure 3, and the validation results are given in Figure 4. Six ERC events were identified as these hurricanes underwent the process of “intensification–weakening–re-intensification”. The start and end times of the six ERC events were consistent with those previously reported [5]. The rms error of the SRV and DRV models were 4.76 m/s and 3.88 m/s, respectively. The modified Rankine vortex model provided the smallest rms error between the parameterized fit and observations for radial wind profiles. Note that when a single wind maximum was fitted with the SRV model, we had to manually identify whether it was the inner or outer wind maximum. At the end of an ERC process, the single wind maximum was always due to the outer eyewall, because the inner eyewall had dissipated.
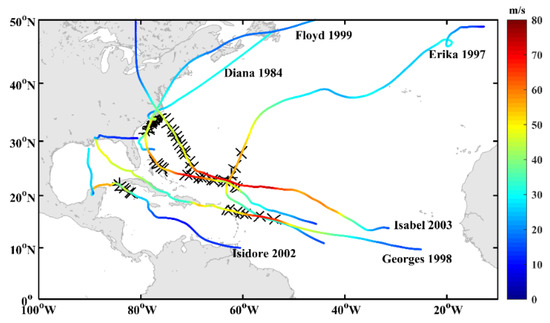
Figure 3.
Geolocations of 328 radial legs for six hurricanes with respect to the Best Track estimates. The black lines denote radial legs measured by multiple aircraft missions, whereas the color bar (unit: m/s) denotes Hurricane intensity from the Best Track data.
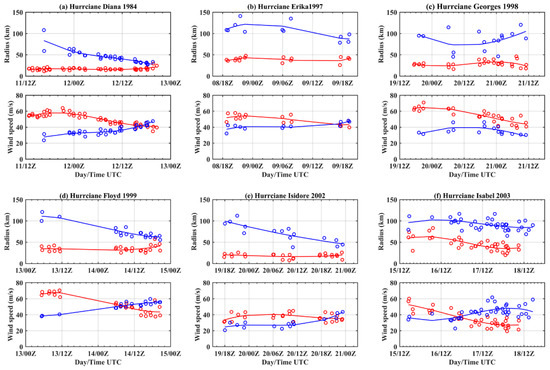
Figure 4.
Model validations from (a) Hurricane Diana (1984), (b) Hurricane Erika (1997), (c) Hurricane Georges (1998), (d) Hurricane Floyd (1999), (e) Hurricane Isidore (2002), and (f) Hurricane Isabel (2003). The top panel in each subfigure denotes the evolution of radii parameters (red circles) and (blue circles). The bottom panel in each subfigure denotes the evolution of intensity parameters (red circles) and (blue circles). Each time series of wind profile parameters are determined using a third-order polynomial best fit approach (solid lines).
3. Results
Figure 5 shows the evolution of wind profile parameters at both the free-atmosphere and the sea-surface levels in Hurricane Irma (2017). At the free-atmosphere level, 113 pairs of (, ) and 98 pairs of (, ) were determined, whereas 111 pairs of (, ) and 63 pairs of (, ) were fitted at the sea-surface level. The number of wind profile parameters (, ) at the sea-surface level was one-third less than that at the free-atmosphere level, especially after 12:00 UTC, 6 September. Until this time, the outer wind maxima at the free-atmosphere were not less than 40 m/s. Thus, surface friction could not explain the missing outer wind maxima at the sea-surface level. The results indicate that a secondary eyewall might have formed from the top level to the surface level. Furthermore, the wind sizes of CEs varied at the two levels. At the sea-surface level, the mean values of (, ) and (, ) were (25 km, 60 m/s) and (44 km, 49 m/s), respectively. At the free-atmosphere level, the mean values of (, ) and (, ) were (27 km, 64 m/s) and (50 km, 56 m/s), respectively. The locations of the inner and outer wind maxima at the sea-surface level were 2 km and 6 km closer to the storm center than at the free-atmosphere level, respectively. This shows that CEs have a narrow appearance at the sea-surface level and tilt outward with height in the cross-section due to the vertical wind shear or the ocean heat content [33]. The intensity differences between the two levels were possibly due to two factors: (1) surface friction decreases the wind speed at the sea-surface level, and (2) precipitation has an effect on the SFMR wind estimates.
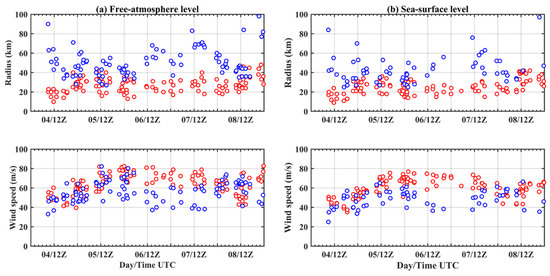
Figure 5.
The evolution of wind profile parameters in Hurricane Irma (2017) at the (a) free-atmosphere level and (b) sea-surface level. The top panel in each subfigure denotes the evolution of radii parameters (red circles) and (blue circles). The bottom panel in each subfigure denotes the evolution of intensity parameters (red circles) and (blue circles).
3.1. ERC Process following the Classic ERC Theory
We identified four ERC events during Hurricane Irma (2017), denoted as ERC01, ERC02, ERC03, and ERC04. Table 3 lists the details of the start/end time, and the durations for the three phases in each ERC process. Four ERC processes varied from hours to days, influencing the intensity and structure of the ERC developments. Figure 6 and Figure 7 illustrate the vortex evolution of CEs during ERC01 and ERC02 at the free-atmosphere and the sea-surface levels. Although these durations were much shorter than the average 36 h for a general ERC, the vortex evolutions of ERC01 and ERC02 exhibited distinct intensity evolutions during the three phases [5] and were consistent with previous conclusions [20], which identified the ERC as a radial outward pulse in the wind profiles.
Table 3.
Start/end time and duration of the three phases of four ERC events.
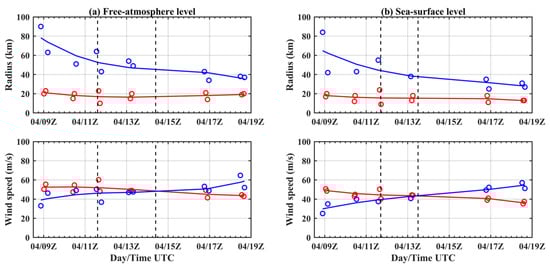
Figure 6.
The evolution of wind profile parameters in ERC01 at the (a) free-atmosphere level and (b) sea-surface level. The top panel in each subfigure denotes the evolution of radii parameters (red circles) and (blue circles). The bottom panel in each subfigure denotes the evolution of intensity parameters (red circles) and (blue circles). Each time series of wind profile parameters was determined with a third-order polynomial best fit (solid lines). Vertical dashed lines separate phases of the ERC in terms of the evolution of intensity parameters.
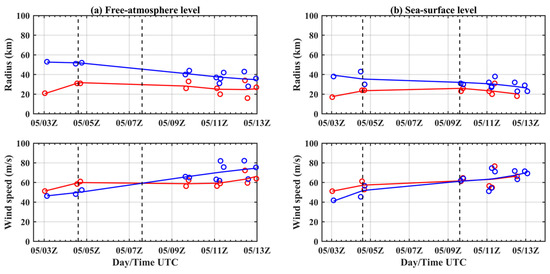
Figure 7.
The same as Figure 6 but for the ERC02 event.
C01 lasted 10 h. The aircraft encountered the first outer wind maximum at approximately 90 km near 09:00 UTC, 4 September (Figure 6a). As the primary eyewall weakened, the outer eyewall contracted and intensified, surpassing the intensity of the inner eyewall at around 17:00 UTC, 4 September. Thereafter, Irma began to re-intensify until 19:00 UTC, 4 September. After ERC01, the former outer eyewall contracted to half of the original radius, with the outer wind maximum far exceeding the inner wind maximum at the initial phase of ERC01 at the two levels (Figure 6). At the sea-surface level, Irma’s intensity increased from 50 m/s to near 60 m/s, and the wind field expanded by a factor of almost two (Figure 6b). To some extent, although each phase’s intensity and duration were different between two levels, the intensity and structure changes were the same in ERC01.
The duration of ERC02 was equal to ERC01. For ERC02, the outer wind maximum first occurred around 55 km at the free-atmosphere level, which was roughly half of the original location in ERC01 (Figure 7a). Irma’s intensity sharply increased from 50 m/s to 80 m/s, reaching its peak value during its lifespan (Figure 1b). The outer eyewall surpassed the original eyewall around 09:30 UTC, 5 September, correlating with observations at the sea-surface level (Figure 7b). Compared with ERC01, Hurricane Irma’s intensity was much stronger in ERC02 than before because the outer eyewall formed closer to the inner eyewall at the same time. Although the breakpoints between the weakening and re-intensification phases suggested by the intensity parameterized fit line were different at the two levels, the first observation of the outer wind maximum exceeded the inner wind maximum at the free-atmosphere level, which was consistent with that at the sea-surface level.
3.2. ERC Process in Contrast to the Classic ERC Theory
The last two ERCs differed from the classic ERC theory [1,2,5,10]. Figure 8 and Figure 9 illustrate the vortex evolution of CEs during ERC03 and ERC04 at the free-atmosphere and the sea-surface levels. ERC03 endured for only 6 h, which was the shortest of the four ERCs. Irma’s intensity during ERC03 hardly re-intensified at the free-atmosphere level (Figure 8a). The outer wind maximum at the start time was near 40 km, with an intensity of around 70 m/s at the free-atmosphere level. The inner wind maximum was 80 m/s and was approximately 20 km from the storm center (Figure 8a). The inner and outer eyewalls were of a high intensity and close to the storm center, meaning that Irma’s intensity was the strongest with a robust inner core. However, the outer eyewall did not replace the inner eyewall in the re-intensification phase at the sea-surface level (Figure 8b). We propose that the original high intensity and the short duration accounted for the fake ERC at the sea-surface level. Figure 9 shows the vortex evolution during ERC04 at the free-atmosphere level and at the sea-surface level. ERC 04 lasted for 30 h with a weakened intensity despite the eyewall replacement occurred The reason behind this development will be discussed in Section 3.3.
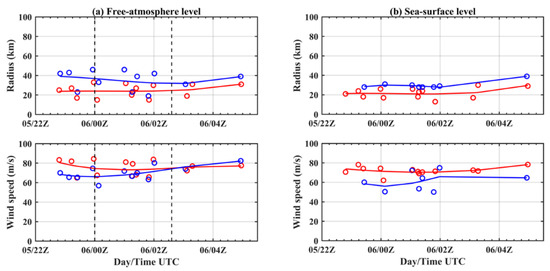
Figure 8.
The same as Figure 6 but for the ERC03 event.
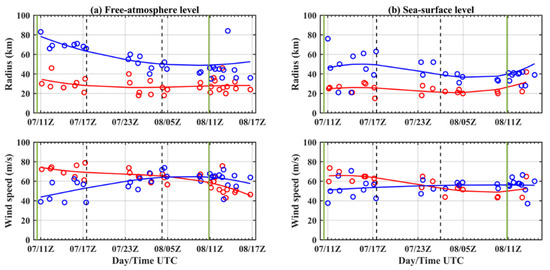
Figure 9.
The same as Figure 6 but for the ERC04 event. The green vertical lines depict the SAR acquisition time.
3.3. Asymmetric CE Surface Wind Structure
SAR images were acquired from C-band Sentinel-1A (S1-A) and one SAR imagery from RADARSAT-2 (RS-2), which passed over Hurricane Irma (2017) at 10:30 UTC on 7 September and 10:54 UTC on 8 September 2017, respectively. These images captured the surface wind fields at the starting and concluding phases of ERC04. Figure 10 shows the VH-polarization SAR sub-image covering Hurricane Irma’s inner core, overlaid with complete wind profiles measured by the SFMR observations closest to the SAR acquisition time. A complete wind profile was obtained by the composite of two radial legs, namely an inbound flight into the storm center and an outbound flight out of the storm center. The complete wind profiles in Figure 10a were measured approximately 1 h and 2 h after the S1-A SAR images, with the +1 h and +2 h profiles, respectively. The +1 h profile was also the first observation detecting two radial wind maxima in ERC04. The complete wind profiles in Figure 10d were measured approximately 1 h before and 0.5 h after the RS-2 SAR image (−1 h and +0.5 h profiles), respectively.
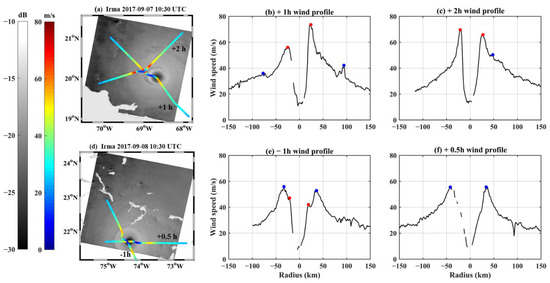
Figure 10.
(a,d) SAR images containing Irma’s inner core overlayed with two complete wind profiles closest to the SAR acquisition times. The color bars denote σ0 (unit: dB) and the sea-surface wind (unit: m/s) derived from SFMR, respectively. (b,c,e,f) Complete wind profiles along the tracks nearest the SAR acquisition times at sea-surface level. The red and blue dots represent the locations of inner and outer eyewalls, respectively. RADARSAT-2 Data and Products MacDonald, Dettwiler, and Associates Ltd. (2008–2009).
As shown in Figure 10a, the moat was obvious and exhibited asymmetry outside the primary eyewall. The asymmetric CE structure was detected by SFMR in the +1 profile, with outer wind maxima generated on both sides (Figure 10b). The outer wind maxima were approximately 36 m/s at a radius of 77 km on the southeast side and around 40 m/s at a radius of 94 km on the northwest side, respectively. The +2 h profile showed a single outer maximum detected on the northeast side, which intensified to 50 m/s as the radius collapsed around 48 km (Figure 10c). The corresponding wind maximum weakened from 73 m/s to 65 m/s. Two complete wind profiles measured at the initial stage demonstrate that the outer eyewall inhibited the development of the inner eyewall, although it did form with asymmetric and nonsystematic characteristics. After almost 24 h, the RS-2 SAR image showed that Irma returned to a much more axisymmetric single eyewall structure with obvious wind field expansion (Figure 10d). The −1 h and +0.5 h profiles revealed that the outer wind maximum surpassed the inner wind maximum in the −1 h profile (Figure 10e) and eventually replaced the inner eyewall to dominate the hurricane mean vortex (Figure 10f). The four wind profiles with SAR images illustrate that the CE vortex evolution was an axisymmetric process during the eyewall replacement.
To study the asymmetric surface structure of CEs, the SAR wind field was divided into four quadrants defined by the direction of the storm motion as left–front (LF), right–front (RF), left–rear (LR), and right–rear (RR) quadrants (Figure 11a and Figure 12a). Thus, we calculated the radial distribution of the wind speed and mean wind profiles for each quadrant (Figure 11b–e). At 10:30 UTC, on 7 September 2017, Irma’s maximum wind was 79.52 m/s with an RMW at 13.61 km. The outer eyewall was in the front of Irma’s propagation associated with the outer wind maximum in the LF and RF quadrants (Figure 11b,c). In the LF quadrant, the inner and outer wind maxima were 72.76 m/s and 54.54 m/s, with RMW values of 16.72 km and 32.80 km, respectively. In the RF quadrant, the inner wind and outer wind maxima were 74 m/s and 59.44 m/s, with an RMW at 17 km and 59.44 km, respectively. As the S1-A image was acquired at the initial stage of ERC04, the outer eyewall was suggested to form in front of the hurricane direction. After 24 h, Irma’s maximum wind decreased to 69.44 m/s, with the RMW expanding to 35.59 km, as imaged by RS-2 imagery (Figure 12a). It should be noticed that there was a new wind maximum generated close to the secondary eyewall in front of Irma’s moving direction (Figure 12b,c). Although the inner wind maximum was not clear in the SAR mean wind profiles (Figure 12), it could be detected by a reconnaissance aircraft until 14:00 UTC, 8 September, at the sea-surface and free-atmosphere levels (Figure 9). Therefore, we identified the new wind maximum as a third wind maximum. The third wind maximum formed as a previous ERC was concluding and was associated with the long-lived CEs structure [5,34,35,36]. In the LF quadrant, the wind maximum in the third eyewall was 38.47 m/s, with an RMW of 53 km. In the RF quadrant, the wind maximum of the third eyewall was 47.54 m/s around the 55 km radial distance. It was suggested that the third eyewall played a role as the former secondary eyewall in the double-eyewall structure, cutting off the radial momentum inflow from the boundary layer and thereby weakening Irma’s intensity. This finding accounts for the intensity changes indicated by aircraft observations in Figure 9 and indicates why Irma’s intensity decreased after ERC04. On the other hand, the model results show that TC asymmetric structure and intensity of the boundary layer was linked to the vertical wind shear and storm motion [37,38]. A full-physics simulation of Hurricane Irma [38] pointed out that the descending inflow with an amplified shear was identified as the conduit through which low-entropy air enters the inner-core TC boundary layer, resulting in storm decay.
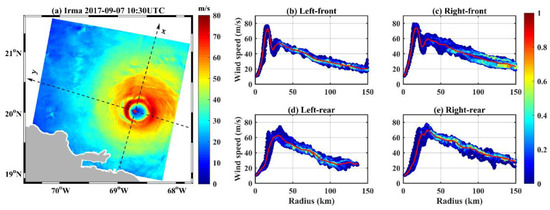
Figure 11.
(a) SAR-derived wind field of Hurricane Irma (2017) using S1-A dual-polarization imagery acquired at 10:30 UTC on 7 September 2017, where the y-axis denotes the moving direction of Irma. (b–e) Wind speed distributions plotted as a function of hurricane radius and the mean wind profiles (red lines) in four TC quadrants, where the color bar denotes the normalized data density averaged in a 1 km × 1 km box. Each colored point is located at the center of the box.
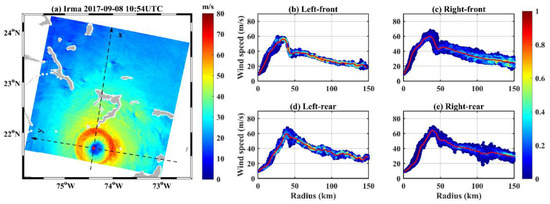
Figure 12.
The same as Figure 11 but for the RS-2 SAR image at 10:54 UTC on 8 September 2017.
4. Discussion
To interpret the third eyewall of Irma during ERC04, we investigated the convective evolution observed from passive microwave radiometer data. Figure 13 depicts storm-centered 85-GHz brightness temperatures from the Advanced Microwave Scanning Radiometer (AMSR-2) over Irma, 5 h before the S1-A SAR image, 7 h after S1-A SAR image, and 4 h before the RS-2 SAR image. The 85-GHz channel is sensitive to frozen hydrometeors, whereby depressed brightness temperatures indicate a greater amount of ice scattering and intense convection. At 05:29 UTC, 7 September (Figure 13a), deep convection started to form outside the primary eyewall from spiral rainbands at around 100 km and contracted inwards to Irma’s center. Subsequently, the characteristics of CEs were recognized as the inner eyewall, surrounded by a quasi-circular ring of intense convection between 60 km and 100 km at 17:51 UTC, 7 September (Figure 13b). Furthermore, the inner eyewall contracted in diameter, with a well-defined moat. Eventually, the inner eyewall almost disappeared and was replaced by the outer eyewall at 06:12 UTC, 8 September, as a broadening wind structure up to 100 km in diameter and outer rainbands organized uniformly. At this point, the eye’s size was 50 km in diameter, nearly twice as large as before (Figure 13c). However, the convection of the outer eyewall in Figure 13c was weaker than the original eyewall in Figure 13a, even though Irma’s mean vortex became axisymmetric, which was in agreement with aircraft observations and the SAR wind field analysis. We speculate that the third wind maximum captured by RS-2 imagery was associated with the most intense convection concentrated on the southeast side of the spiral rainbands, between 100 and 150 km in Figure 13c, which was four hours before the RS-2 acquisition time. The intense convection at the end of the uniform rainbands evolved into a third eyewall at the concluding phase of ERC04 and, in the end, resulted in Irma’s weakened intensity. On the other hand, this explains that the outer eyewall evolved from the outer rainbands, which is consistent with the previous studies [12,13,14,15].
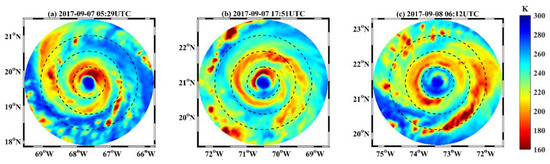
Figure 13.
Storm-centered 85-GHz AMSR-2 imagery of brightness temperature over Irma at (a) 05:29 UTC on 7 September, (b) 17:51 UTC on 7 September, and (c) 06:12 UTC on 8 September. The color bar (unit: K) denotes brightness temperature in the Irma’s inner core. The black dashed circles represent radial rings spaced in 50 km increments.
In addition, two cases of three SAR images in Hurricane Jose (2017) and Hurricane Michael (2018) were further analyzed. Hurricane Jose and Michael were at category 4 and category 5 intensity, which reached the major hurricane. The geolocations of SAR images with respect to the storm tracks are shown in Figure 14. Different from the ERC04 of Irma, the intensity evolutions of these two hurricane cases captured by SAR were consistent with classical ERC theory and the first two ERC events in Irma. The three SAR images of Hurricanes Jose (2017) and Michael (2018) occurred during their re-intensification phases. The SAR-derived wind fields and motion-relative quadrants wind analysis of Hurricanes Jose and Michael are shown in Figure 15, Figure 16 and Figure 17. It illustrates that the characteristics of the secondary eyewall were more apparent on the right side of the storm motion. However, Irma’s secondary eyewall was generated on both left and right sides, especially in the front of the Irma’s moving direction during its weakening phase in ERC04 (Figure 11b,c). Therefore, the generation of the secondary eyewall on the left side or not remained as a key point for the investigation and interpretation of why the ERC04 of Irma was abnormal.
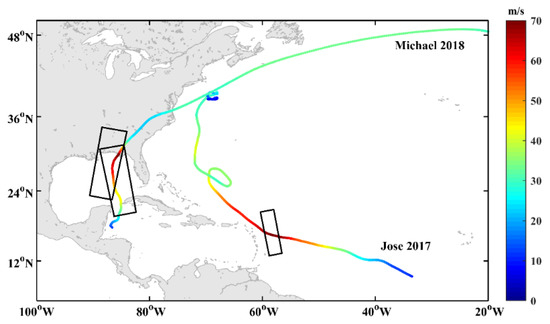
Figure 14.
Geolocations of SAR imagery over Hurricane Jose (2017) at 22:03 UTC on 8 September 2017 and Hurricane Michael (2018) at 23:44 UTC on 9 October and 11:50 UTC on 10 October 2018 with respect to the Best Track estimates. The color bar (unit: m/s) denotes hurricane wind speed.
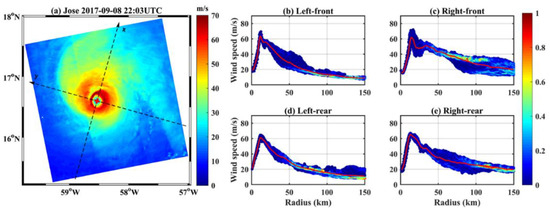
Figure 15.
The same as Figure 11 but for Hurricane Jose at 22:03 UTC on 8 September 2017.
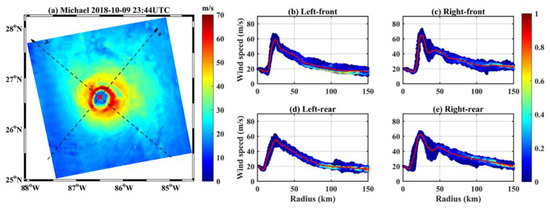
Figure 16.
The same as Figure 11 but for Hurricane Michael at 23:44 UTC on 9 October 2018.
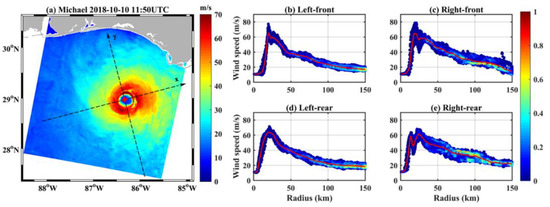
Figure 17.
The same as Figure 11 but for Hurricane Michael at 11:50 UTC on 10 October 2018.
5. Conclusions
In this study, 444 radial legs from a reconnaissance aircraft were collected. A total of 116 radial legs during Hurricane Irma sampled four ERC processes at both the sea-surface and free-atmosphere levels. 328 radial legs during the six other hurricanes were used for model validation only at the free-atmosphere level, the results of which are consistent with previous studies. Two SAR-derived surface wind fields during Irma (2017) and three SAR-derived surface wind fields during Hurricanes Jose (2017) and Michael (2018) were used to investigate the asymmetric CE structure. In terms of detection of the outer wind maximum, there were one-third fewer detections at the sea-surface level than at the free-atmosphere level, indicating that the secondary eyewall might form from the top to the surface level. The locations of the inner and outer wind maxima at the sea-surface level were 2 km and 6 km closer to the storm center than at the free-atmosphere level, respectively, showing that CEs are narrower at the sea-surface level and tilt outward with height.
In Irma, the duration of the four ERC events varied from hours to days. The vortex evolutions of ERC01 and ERC02 were consistent with the classic ERC theory [5]. However, the last two ERC events differed from previous studies [1,2,5,10]. During the ERC03 event, the outer wind maximum surpassed the inner wind maximum at the free-atmosphere level without replacement at the sea-surface level, due to the short duration of ERC03 and the maintenance of an intense original eyewall. Furthermore, Irma did not experience the re-intensification phase in ERC04 at either the free-atmosphere or the sea-surface level. RS-2 SAR imagery captured at the end of the ERC04 revealed a third wind maximum close to the secondary eyewall in front of Irma’s propagation direction at the concluding phase (Figure 12b,c). This was induced by the intense convection at the end of the outer rainbands observed from the microwave satellite imagery (Figure 13c). The third eyewall cut off the radial momentum inflow from the boundary layer and blocked the intensity of the secondary eyewall. This finding explains the abnormal intensity evolution in ERC04 from 1D radial leg observations.
To investigate the surface wind asymmetry of CEs in Irma, we compared two SAR-derived surface wind fields acquired at the starting and concluding phases of ERC04 and divided them into four quadrants, according to the storm moving direction. The vortex evolution of CEs during eyewall replacement was revealed as an axisymmetric process. The outer eyewall developing in front of Irma’s moving direction at the start of the phase supplied the asymmetric SEF dynamics [18,19,20]. The intensity and structure evolution were consistent with the SFMR wind estimates at the sea-surface level near the SAR acquisition time and the convective activity observed from AMSR2 brightness temperature. Irma’s secondary eyewall was generated on both left and right sides, especially in front of the moving direction during the weakening phase of the storm (Figure 11b,c). By comparison, the characteristics of the secondary eyewall were more apparent on the right side of the storm motion in the normal ERC cases (Figure 15, Figure 16 and Figure 17). The location of secondary eyewall would be a key point to investigate and elucidate why Irma was anomalous in ERC04. While SAR observations provide high-resolution measurements of the TC sea surface wind field [39,40,41,42,43,44], our analysis here gave valuable insights into Irma’s sea-surface ERC process. Continued research on the asymmetric structure of CEs and possible internal mechanisms is recommended.
Author Contributions
Conceptualization, G.Z.; methodology, G.Z., H.H. and B.Z.; validation, H.H.; formal analysis, G.Z. and H.H.; investigation, G.Z., H.H., B.Z. and W.P.; resources, G.Z., B.Z. and H.H.; data curation, H.H; writing—original draft preparation, H.H.; writing—review and editing, G.Z., B.Z., C.C., W.P. and Y.L.; visualization, H.H.; supervision, G.Z., B.Z. and W.P.; project administration, B.Z.; funding acquisition, C.C. and B.Z. All authors have read and agreed to the published version of the manuscript.
Funding
This work was supported in part by the National Key Research and Development Program of China under Grant 2019YFC1510100; the National Science Foundation under Grant 42076181 and a Joint Project between the National Science Foundation of China and Russian Science Foundation under Grant 42061134016; and by the Canadian Space Agency, including the Canadian SWOT program, Canada’s Ocean Frontier Institute, and MAXSS (the Maximum eXtreme Satellite Synergy) supported by the European Space Agency.
Data Availability Statement
Aircraft observations are available at https://www.aoml.noaa.gov/data-products/#hurricanedata (accessed on 20 Auguest 2021). AMSR2 Level 1B brightness temperature data can be accessed via https://suzaku.eorc.jaxa.jp (accessed on 30 Auguest 2021). Hurricane Best Track data are available at https://www.nhc.noaa.gov/data/#hurdat (accessed on 8 April 2021).
Acknowledgments
The authors would like to thank the European Space Agency, Paris, France, for providing Sentinel-1A data and the Canadian Space Agency, Longueuil, QC, Canada, for providing the RADARSAT-2 data; NOAA HRD for supplying aircraft observations; JAXA for AMSE-2 data of brightness temperature; and NOAA NHC for hurricane Best Track data (HURDAT2). The authors thank anonymous reviewers for providing helpful comments and suggestions on the manuscript.
Conflicts of Interest
The authors declare no conflict of interest.
References
- Willoughby, H.E.; Clos, J.A.; Shoreibah, M.G. Concentric eye walls, secondary wind maxima, and the evolution of the hurricane vortex. J. Atmos. Sci. 1982, 39, 395. [Google Scholar] [CrossRef]
- Black, M.L.; Willoughby, H.E. The concentric eyewall cycle of Hurricane Gilbert. Mon. Wea. Rev. 1992, 120, 947–957. [Google Scholar] [CrossRef]
- Hawkins, J.D.; Helveston, M. Tropical cyclone multiple eyewall characteristics. In Proceedings of the 26th Conference on Hurricanes and Tropical Meteorology, Miami, FL, USA, 2–5 May 2004. [Google Scholar]
- Kuo, H.C.; Chang, C.P.; Yang, Y.T.; Jiang, H.J. Western North Pacific typhoons with concentric eyewalls. Mon. Wea. Rev. 2009, 137, 3758–3770. [Google Scholar] [CrossRef]
- Sitkowski, M.; Kossin, J.P.; Rozoff, C.M. Intensity and structure changes during hurricane eyewall replacement cycles. Mon. Weather Rev. 2011, 139, 3829–3847. [Google Scholar] [CrossRef]
- Irish, J.L.; Resio, D.T.; Ratcliff, J.J. The influence of storm size on hurricane surge. J. Phys. Oceanogr. 2008, 38, 2003–2013. [Google Scholar] [CrossRef]
- Lin, N.; Lane, P.; Emanuel, K.A.; Sullivan, R.M.; Donnelly, J.P. Heightened hurricane surge risk in northwest Florida revealed from climatological-hydrodynamic modeling and paleorecord reconstruction. J. Geophys. Res. Atmos. 2014, 119, 8606–8623. [Google Scholar] [CrossRef]
- Kossin, J.P.; Sitkowski, M. Predicting hurricane intensity and structure changes associated with eyewall replacement cycles. Wea. Forecast. 2012, 27, 484–488. [Google Scholar] [CrossRef]
- Kossin, J.P.; DeMaria, M. Reducing operational hurricane intensity forecast errors during eyewall replacement cycles. Weather Forecast. 2016, 31, 601–608. [Google Scholar] [CrossRef]
- Shapiro, L.J.; Willoughby, H.E. The response of balanced hurricanes to local sources of heat and momentum. J. Atmos. Sci. 1982, 3, 378–394. [Google Scholar] [CrossRef]
- Yang, Y.T.; Kuo, H.C.; Hendricks, E.A.; Peng, M.S. Structural and intensity changes of concentric eyewall typhoons in the western North Pacific basin. Mon. Weather Rev. 2013, 141, 2632–2648. [Google Scholar] [CrossRef]
- Houze, R.A., Jr.; Chen, S.S.; Smull, B.F.; Lee, W.C.; Bell, M.M. Hurricane intensity and eyewall replacement. Science 2007, 315, 1235–1239. [Google Scholar] [CrossRef] [PubMed]
- Rozoff, C.M.; Nolan, D.S.; Kossin, J.P.; Zhang, F.; Fang, J. The roles of an expanding wind field and inertial stability in tropical cyclone secondary eyewall formation. J. Atmos. Sci. 2012, 69, 2621–2643. [Google Scholar] [CrossRef]
- Kepert, J.D. How does the boundary layer contribute to eyewall replacement cycles in axisymmetric tropical cyclones? J. Atmos. Sci. 2013, 70, 2808–2830. [Google Scholar] [CrossRef]
- Zhu, P.; Zhu, Z.; Gopalakrishnan, S.; Black, R.; Marks, F.D.; Tallapragada, V.; Gao, C. Impact of subgrid-scale processes on eyewall replacement cycle of tropical cyclones in HWRF system. Geophys. Res. Lett. 2015, 42, 10027–10036. [Google Scholar] [CrossRef]
- Uhlhorn, E.W.; Klotz, B.W.; Vukicevic, T.; Reasor, P.D.; Rogers, R.F. Observed hurricane wind speed asymmetries and relationships to motion and environmental shear. Mon. Weather Rev. 2014, 142, 1290–1311. [Google Scholar] [CrossRef]
- Zhang, J.A.; Rogers, R.F.; Reasor, P.D.; Uhlhorn, E.W.; Marks, F.D., Jr. Asymmetric hurricane boundary layer structure from dropsonde composites in relation to the environmental vertical wind shear. Mon. Weather Rev. 2013, 141, 3968–3984. [Google Scholar] [CrossRef]
- Didlake, A.C.; Houze, R.A. Dynamics of the stratiform sector of a tropical cyclone rainband. J. Atmos. Sci. 2013, 70, 1891–1911. [Google Scholar] [CrossRef]
- Didlake, A.C.; Reasor, P.D.; Rogers, R.F.; Lee, W.C. Dynamics of the transition from spiral rainbands to a secondary eyewall in Hurricane Earl (2010). J. Atmos. Sci. 2018, 75, 2909–2929. [Google Scholar] [CrossRef]
- Fischer, M.S.; Rogers, R.F.; Reasor, P.D. The rapid intensification and eyewall replacement cycles of Hurricane Irma (2017). Mon. Weather Rev. 2020, 148, 981–1004. [Google Scholar] [CrossRef]
- Zhang, B.; Perrie, W. Cross-polarized synthetic aperture radar: A new potential measurement technique for hurricanes. Bull. Amer. Meteorol. Soc. 2012, 93, 531–541. [Google Scholar] [CrossRef]
- Zhang, B.; Perrie, W.; Zhang, J.A.; Uhlhorn, E.W.; He, Y. High resolution hurricane vector winds from C-band dual-polarization SAR observations. J. Atmos. Ocean. Technol. 2014, 31, 272–286. [Google Scholar] [CrossRef]
- Mouche, A.A.; Chapron, B.; Zhang, B.; Husson, R. Combined co- and cross-polarized SAR measurements under extreme wind conditions. IEEE Trans. Geosci. Remote Sens. 2017, 55, 6746–6755. [Google Scholar] [CrossRef]
- Zhang, G.; Perrie, W.; Li, X.; Zhang, J.A. A hurricane morphology and sea surface wind vector estimation model based on C-band cross-polarization SAR imagery. IEEE Trans. Geosci. Remote Sens. 2017, 55, 1743–1751. [Google Scholar] [CrossRef]
- Mouche, A.A.; Chapron, B.; Knaff, J.; Zhao, Y.; Zhang, B.; Combot, C. Copolarized and cross-polarized SAR measurements for high-resolution description of major hurricane wind structures: Application to Irma category 5 hurricanes. J. Geophys. Res. 2019, 124, 3905–3922. [Google Scholar] [CrossRef]
- Zhang, G.; Perrie, W. Effects of asymmetric secondary eyewall on tropical cyclone evolution in Hurricane Ike (2008). Geophys. Res. Lett. 2017, 45, 1676–1683. [Google Scholar] [CrossRef]
- Zhang, G.; Perrie, W. Symmetric double-eye structure in hurricane bertha (2008) imaged by SAR. Remote Sens. 2018, 10, 1292. [Google Scholar] [CrossRef]
- Uhlhorn, E.W.; Black, P.G. Verification of remotely sensed sea surface winds in hurricanes. J. Atmos. Ocean. Technol. 2003, 20, 99–116. [Google Scholar] [CrossRef]
- Klotz, B.W.; Uhlhorn, E.W. Improved stepped frequency microwave radiometer tropical cyclone surface winds in heavy precipitation. J. Atmos. Ocean. Technol. 2014, 31, 2392–2408. [Google Scholar] [CrossRef]
- Franklin, J.L.; Black, M.L.; Valde, K. GPS dropwindsonde wind profiles in hurricanes and their operational implications. Weather Forecast. 2003, 18, 32–44. [Google Scholar] [CrossRef]
- Holland, G.J.; Belanger, J.I.; Fritz, A. A revised model for radial profiles of hurricane winds. Mon. Weather Rev. 2010, 138, 4393–4406. [Google Scholar] [CrossRef]
- Wood, V.T.; White, L.W.; Willoughby, H.E.; Jorgensen, D.P. A new parametric tropical cyclone tangential wind profile model. Mon. Weather Rev. 2013, 141, 1884–1909. [Google Scholar] [CrossRef]
- Hazelton, A.T.; Hart, R.E. Hurricane Eyewall Slope as Determined from Airborne Radar Reflectivity Data: Composites and Case Studies. Weather Forecast. 2013, 28, 368–386. [Google Scholar] [CrossRef]
- McNoldy, B.D. Triple eyewall in Hurricane Juliette. Bull. Amer. Meteorol. Soc. 2004, 85, 1663–1666. [Google Scholar] [CrossRef]
- Zhao, K.; Lin, Q.; Lee, W.-C.; Sun, Y.Q.; Zhang, F. Doppler radar analysis of triple eyewalls in typhoon Usagi (2013). Bull. Amer. Meteorol. Soc. 2016, 97, 25–30. [Google Scholar] [CrossRef][Green Version]
- Tsujino, S.; Tsuboki, K.; Kuo, H. Structure and maintenance mechanism of long-lived concentric eyewalls associated with simulated Typhoon Bolaven (2012). J. Atmos. Sci. 2017, 74, 3609–3634. [Google Scholar] [CrossRef]
- Ahern, K.; Bourassa, M.A.; Hart, R.E.; Zhang, J.A.; Rogers, R.F. Observed Kinematic and Thermodynamic Structure in the Hurricane Boundary Layer during Intensity Change. Mon. Weather Rev. 2019, 147, 2765–2785. [Google Scholar] [CrossRef]
- Ahern, K.; Hart, R.E.; Bourassa, M.A. Asymmetric Hurricane Boundary Layer Structure during Storm Decay. Part I: Formation of Descending Inflow. Mon. Weather Rev. 2021, 149, 3851–3874. [Google Scholar] [CrossRef]
- Zhang, G.; Li, X.; Perrie, W.; Zhang, J.A. Tropical cyclone winds and inflow angle asymmetry from SAR imagery. Geophys. Res. Lett. 2021, 48, e2021GL095699. [Google Scholar] [CrossRef]
- Shen, H.; Perrie, W.; He, Y. Evaluation of Hurricane Wind Speed Retrieval from Cross-Dual-Pol SAR. Int. J. Remote Sens. 2016, 37, 599–614. [Google Scholar] [CrossRef]
- Gao, Y.; Sun, J.; Zhang, J.; Guan, C. Extreme Wind Speeds Retrieval Using Sentinel-1 IW Mode SAR Data. Remote Sens. 2021, 13, 1867. [Google Scholar] [CrossRef]
- Gao, Y.; Guan, C.; Sun, J.; Xie, L. A New Hurricane Wind Direction Retrieval Method for SAR Images without Hurricane Eye. J. Atmos. Ocean. Technol. 2018, 35, 2229–2239. [Google Scholar] [CrossRef]
- Zhang, B.; Perrie, W. High Wind Speed Retrieval from Multi-Polarization SAR. In Hurricane Monitoring with Spaceborne Synthetic Aperture Radar; Li, X., Ed.; Springer: Singapore, 2017; pp. 85–98. ISBN 978-981-10-2893-9. [Google Scholar]
- Benassai, G.; Migliaccio, M.; Montuori, A.; Ricchi, A. Wave Simulations Through Sar Cosmo-Skymed Wind Retrieval and Verification with Buoy Data. In Proceedings of the Twenty-Second International Offshore and Polar Engineering Conference, Rhodes, Greece, 17–22 June 2012. [Google Scholar]
Publisher’s Note: MDPI stays neutral with regard to jurisdictional claims in published maps and institutional affiliations. |
© 2022 by the authors. Licensee MDPI, Basel, Switzerland. This article is an open access article distributed under the terms and conditions of the Creative Commons Attribution (CC BY) license (https://creativecommons.org/licenses/by/4.0/).