Abstract
Infrared imaging spectrometry is utilized to detect and identify targets by collecting spectral images. In some cases, the infrared spectral images of dynamic targets need to be detected accurately, such as during remote sensing target tracking and engine tail flame detection applications. However, it is difficult to obtain reliable measurement results when using a traditional infrared imaging spectrometer with a scanning structure because of motion artifacts. This work proposes a snapshot infrared imaging Fourier transform spectrometer (SIIFTS) based on stepped micromirrors and a lens array. Two micromirrors sample the spectral information, and the lens array can realize multi-aperture snapshot imaging. The spectrometer is capable of collecting three-dimensional (3D) datasets during a single measurement period, and its absence of motion artifacts and its ability to work without moving parts is very important for dynamic target detection. The achromatic optical design of the SIIFTS is completed, and two front imaging systems for remote sensing and tail flame detection applications are designed for selection. A SIIFTS prototype was built, and flame detection tests were conducted in a laboratory environment. The experimental results show that the SIIFTS developed here can accurately and stably obtain real-time image and spectral information from dynamic targets.
1. Introduction
Imaging spectrometry can obtain two-dimensional image information and one-dimensional spectral information of a target simultaneously. Since the 1980s, people have paid attention to and have studied the imaging spectrometers. Imaging spectrometers are used in various fields for various applications, such as environmental monitoring [1], resource exploration [2,3], military targets identification [4] and biomedical diagnosis applications [5,6]. The working modes of imaging spectrometers can be divided into two categories. Some imaging spectrometers acquire monochromatic two-dimensional images during a single measurement period on a focal plane array (FPA) and then acquire 3D datasets I (x, y, λ) via wavelength scanning. Others acquire one-dimensional panchromatic image slices during a single measurement period through a slit and then acquire 3D datasets I (x, y, λ) by slit scanning. Either way, in the scanning process that is implemented for the purposes of measuring dynamic targets, motion artifacts will be generated, which are difficult to correct. The scanning also reduces the light collection efficiency of imaging spectrometers [7,8]. These characteristics have seriously restricted the application of dynamic target measurements.
Snapshot imaging spectrometry can obtain complete 3D datasets during a single integration period. It dramatically improves the efficiency of the dynamic target imaging spectrum data measurements. Existing snapshot spectral imaging systems can be divided into the following categories: integral field spectrometry (IFS) [9,10]; computed tomography imaging spectrometry (CTIS) by Okamoto and Yamaguchi, which was first developed in 1991 [11]; multi-aperture filtered camera (MAFC) with filter array, which was developed by Shogenji [12]; coded aperture snapshot spectral imagers (CASSI), which were the first spectral imagers that attempted to take advantage of compressive sensing theory for snapshot measurements [13]; and snapshot hyperspectral imaging Fourier transform spectrometers (SHIFT) [14,15]. Among them, the SHIFT system can measure fast-changing targets without scanning elements or filters, resulting in small errors, strong robustness, good real-time performance and high throughput. The SHIFT system has great potential in many different applications.
In 1994, Akiko Hirai’s team reported the principle of the SHIFT system for the first time. They proposed a multi-imaging Fourier transform spectrometer (MIFTS) in visible light. MIFTS adopted the division of aperture (DoA) method to measure the target’s snapshot interference spectral images. At the same time, an optical path difference correction algorithm was proposed to correct the sampling interval error of the interferogram caused by optical system aberration [16]. In 2010, Michael et al. from the University of Arizona in the United States proposed a SHIFT system, in which the interference images were sampled at equal intervals using a Normaski prism. Compared to MIFTS, SHIFT replaces Michelson interference with a birefringent prism with excellent miniaturization and vibration robustness performance [14,15,17]. In 2014, Bryan et al. combined polarization grating (PG) with Normaski prism to realize a snapshot spatial heterodyne imaging spectrometer [18]. In 2017, they further used PG and a Sarvart plate to build a high-resolution snapshot hyperspectral camera. It is also the first time that a Sarvart plate has been applied to a snapshot imaging spectrometer [19].
The aforementioned snapshot imaging spectrometers based on different structures and methods are all used in visible light. The transmittance curves of prisms make it impossible to apply in the infrared bands, especially in the mid-infrared band. Infrared spectrum detection has demonstrated outstanding advantages in the fields of camouflage target identification, harmful gas monitoring and polluted gas measurements. The mid-wave infrared band covers the characteristic absorption peaks of most important hydrocarbon gases and poisonous or harmful gas molecules. Therefore, with high-speed moving military target-tracking, the tail flame detection of aerospace engines, as well as other applications, there is an urgent need for a snapshot imaging spectrometer to be applicable to the mid-infrared band. With this in mind, this paper proposes a snapshot infrared imaging Fourier transform spectrometer (SIIFTS) based on stepped micromirrors and a lens array for dynamic target detection.
This paper will mainly discuss the optical design of a SIIFTS and the dynamic target detection experiments conducted in a laboratory environment. A SIIFTS has two key characteristics: snapshot spectral images detection and its application in the mid-wave infrared broadband. These two characteristics have created many personalized problems for optical design. These problems include the following: (1) A SIIFTS adopts a lens array to obtain the interference image array. We must ensure that the image units at the edge of the field of view (FOV) experience no vignetting. (2) The design of a mid-wave broad-spectrum infrared system requires achromatization and cold stop matching. (3) The stepped micromirror is the core interference element, and its reflective surface acts as both the image plane of the front imaging system and the object plane of the rear imaging system. The height difference caused by the step structure will be transformed into a defocus distance during the imaging process, so the focal depth of the front imaging system and the field depth of the rear imaging system must be greater than the maximum height difference [20].
In order to solve the above problems, in the second section, we point out the principle and design framework implanted for the SIIFTS developed in this paper and propose the global matching of subsystem methods to be implemented after independent optimization. In the third section, we show the SIIFTS optical design results, and geometric optical and physical optical simulations of the SIIFTS are carried out. In the fourth section, the prototype was built, and flame detection tests were carried out in a laboratory environment.
2. Principle and Design Framework
2.1. SIIFTS Principle
The schematic diagram of the SIIFTS is shown in Figure 1a. The SIIFTS consists of the front imaging system, beam splitter (BS), higher stepped micromirror, lower stepped micromirror, rear imaging system and infrared focal plane array detector (IFPA). The front imaging system with a lens array realizes N × N DoA snapshot imaging, and the target is primarily imaged on the reflective surface of the stepped micromirror in the form of an image array. With the image array, each image unit contains all of the target’s spatial information. The stepped micromirrors include a higher stepped micromirror and a lower stepped micromirror. Their maximum order is N, and the two stepped micromirrors are placed symmetrically with respect to the BS. Their ladder arrangement directions are mutually orthogonal, forming N × N phase modulation units, as shown in Figure 1b [21,22]. The m represents the higher stepped micromirrors’ order, and the n represents the lower stepped micromirrors’ order. The phase modulation unit (m, n) is produced from the mth higher stepped micromirror and the nth lower stepped micromirror. The image units are modulated by the corresponding phase modulation units, which result in the interference image array containing the complete spatial information and spectral information of the target. The rear imaging system re-images the interference image array on the reflective surface to the IFPA.
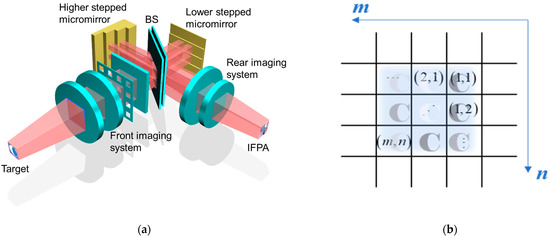
Figure 1.
Explanation of the SIIFTS principle: (a) schematic diagram of the SIIFTS; (b) phase modulation units.
After the image segmentation and image registration of the interference image array, 3D interference intensity datasets I (x, y, Δ (m, n)) are obtained. The Δ (m, n) represents the optical path difference modulated by the phase modulation unit (m, n), where Δ (m, n) = 2(Nn − m)d, and d is the step height of the lower stepped micromirror. We designed the step height of the higher stepped micromirror as Nd, which meets the complementary optical path difference principle. The interference intensity datasets I (x, y, Δ (m, n)) are subjected to discrete Fourier transform, and the spectral datasets B (x, y, υ) can be calculated as follows.
υ is the wavenumber. The main SIIFTS parameters are shown in Table 1. The maximum order N of the stepped micromirror is equal to 8. Each modulation unit corresponds to an imaging channel and a spectral channel. Therefore, both the number of the imaging channel and the number of the spectral channel are equal to N × N = 64. Through narrow-band sampling, the SIIFTS can achieve a high spectral resolution in the mid-wave infrared band [23]. We can set the height d of the lower stepped micromirror to 30 μm and the higher stepped micromirror to 240 μm. The sampling interval equals 2d = 60 μm. The maximum value of the optical path difference is equal to Δ (m, n)max = 2dN2 = 3840 μm, and the spectral resolution is calculated as Δυ = 1/Δ(m, n)max = 2.6 cm−1. The stepped micromirror was manufactured using micro-optic electric-mechanical system (MOEMS) technology [24]. The pictures of the lower stepped micromirror and the higher stepped micromirror are shown in Figure 2a,b).

Table 1.
Main SIIFTS parameters.
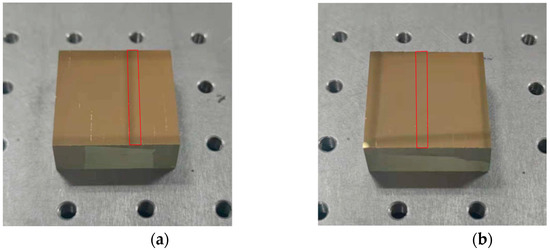
Figure 2.
Pictures of the stepped micromirrors; the red border indicates the direction of the steps: (a) the higher stepped micromirror has a step height of 240 μm; (b) the lower stepped micromirror with a step height of 30 μm.
2.2. Optical Design Framework of the SIIFTS
In order to realize the snapshot imaging spectrum data measurements, we provided the initial layout for the optical design of the SIIFTS in Figure 3. According to Michael et al. in 2012, the remote sensing and near filed target imaging of MIFTS were realized using an afocal telescope and imaging lens with a fiber panel, respectively. In order for the system developed in the present paper to be competent for imaging spectrum data detection in different contexts, such as during the remote sensing and tail flame detection applications mentioned in the abstract, we designed a remote sensing imaging subsystem (RSIS) and a near-field imaging subsystem (NIS) that can be substituted with one another. RSIS is used for remote sensing, and NIS is used for near-field target imaging, such as tail flame detection. Together with the multi-aperture subsystem (MS), these two systems form the front imaging system, which realizes snapshot imaging. The relay subsystem (RS) is designed, that is, the rear imaging system for the re-imaging of the interference image array. IFPA stands for infrared focal plane array and acts as the SIIFTS detector.
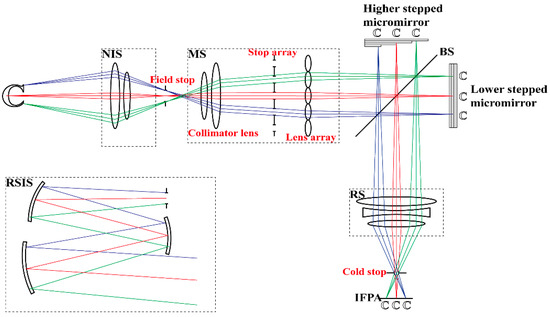
Figure 3.
The initial layout of the optical design for the SIIFTS. NIS, RSIS, MS and RS are the subsystems to be designed in this paper.
After independent optimization, the method global matching subsystem was adopted. The design parameters of each subsystem are inevitably interrelated. Considering the parameters and functional characteristics of subsystems, we followed the optical design framework shown in Figure 4. The IFPA parameters and the stepped micromirrors can be used as the starting point for the initial structure calculation and to determine the spatial resolution and the spectral resolution, respectively. The RS’s object plane is the reflective surface of the stepped micromirror, and the image plane is the IFPA’s focal plane. Therefore, we were first able to determine the design index of the RS according to the IFPA and the stepped micromirror parameters. The MS image plane is also the reflective surface of the stepped micromirror, that is, the RS object plane. Obviously, the MS’s image space number aperture (NA) must be equal to the RS’s object space NA to ensure that the two match perfectly. In addition, both of them adopt a telecentric design, meaning that each imaging channel has no vignetting and little distortion. Additionally, a field stop is located at the image plane position of NIS and RSIS for FOV adjustment. The channels number of the DoA imaging that is calculated as N × N determines the design index of the RS and MS.
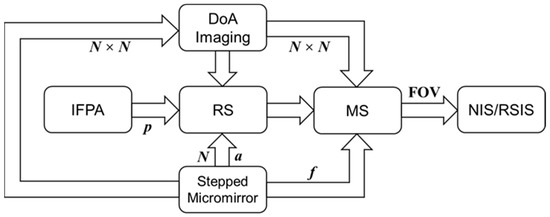
Figure 4.
Design framework for the optical design of the SIIFTS; N represents the stepped micromirrors’ maximum order; p represents a single pixel’s size of the IFPA; a represents a single step’s width, the f represents the focal length, FOV represents the field of view.
According to the above framework, we will design the RS, MS, NIS and RSIS systems in the following sections.
3. Design and Simulation
3.1. The Design of RS
According to the step width and the step orders in Table 1, we determined that the RS’s object space FOV is a rectangular FOV that is 32 mm × 32 mm. In chapter 1, we pointed out that the field depth of the rear imaging system must be greater than the maximum height difference caused by the stepped structure. The schematic diagram of the higher stepped micromirror is shown in Figure 5. It can be seen that the maximum height difference is expressed as d N2 = 1920 μm and that the field depth of RS is 1920 μm. The reference object plane should be set to O, and all of the object planes with the coordinates [−960 μm, 960 μm] must meet the image quality evaluation requirements after RS imaging.
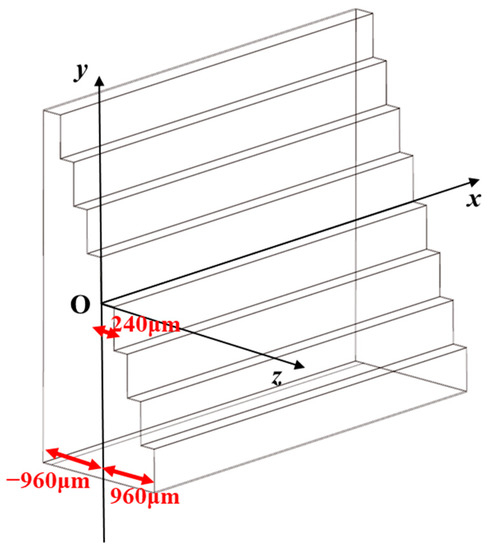
Figure 5.
The schematic diagram of the higher stepped micromirror clearly expresses the maximum height difference caused by the stepped structure.
The other part of the design index is determined by IFPA. The main parameters of IFPA are as follows: the f-number is expressed as F# = 4, the cold stop is expressed as Dcs = 5.1 mm, the number of pixels is 256 × 320, the size of a single pixel is p = 30 μm and the distance from cold stop to the focal plane is fDt = 19.8 mm. Therefore, the size of the RS image plane can be calculated as 7.68 mm × 7.68 mm. In order to suppress the influence of stray light in the mid-wave infrared band, the exit pupil of RS is designed to coincide with the cold stop of the detector, and the exit pupil distance (EXPP) is equal to fDt. The RS’s f-number is also equal to the IFPA’s, which is expressed as F#RS = 4. The RS’s design index is shown in Table 2.
Table 2.
RS design index.
In Table 2, the βRS represents the paraxial magnification of RS, which is calculated as βRS = −7.68 mm/32 mm = −0.24. The NARSO represents the object space NA, which is calculated as NARSO = βRS/2F#RS = 0.03. It is necessary to register each of the pixels from all of the interference image units for accurate spectrum reconstruction. However, when the FOV is large, the RS’ distortion aberration will lead to pixel registration dislocation. It is important that this distortion will be less than 0.1%. Therefore, we adopted a telecentric design to eliminate the RS’s distortion, something that required the entrance pupil distance (ENPP) to be greater than 5 × 103 mm.
A SIIFTS works in the mid-wave infrared broadband, and an achromatic design is needed. We chose germanium and silicon as the design materials, and a refractive diffraction design was used for the second germanium lens. After optimization, the diffraction coefficients were determined to be A1 = −43.749 and A2 = −8.381. In addition, the astigmatic aberration caused by beam splitter and compensation plate was considered. The optimized RS results are shown in Figure 6.
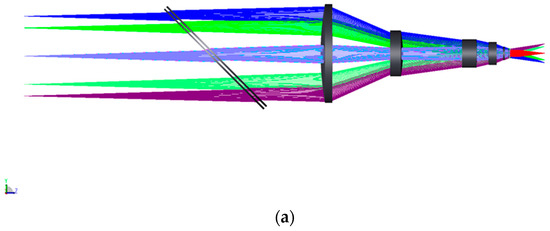
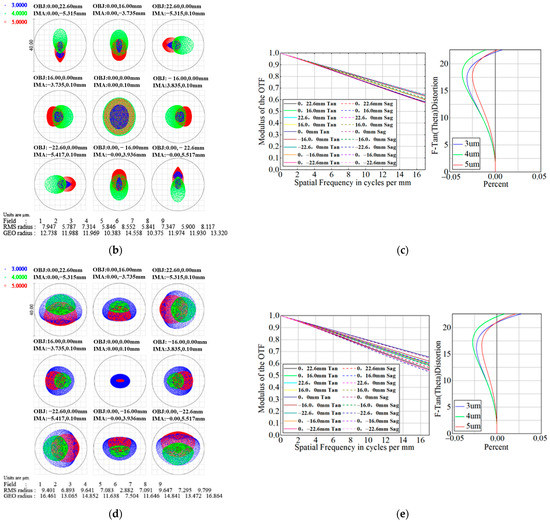
Figure 6.
RS design results: (a) the SR layout; (b) spot diagram at the object field depth of 960 μm; (c) MTF and distortion curve of RS at the object field depth of 960 μm; (d) spot diagram at the object field depth of −960 μm; (e) MTF and distortion curve of RS at the object field depth of −960 μm.
As shown in Figure 6, image quality evaluations were provided for the object plane with coordinates of 960 μm and −960 μm. The root mean square (RMS) radius of the image spots is less than the radius observed for Airy spots, the distortion is less than 0.05%, and the MTF is better than 0.5 at 17 lp. When the βRS = −0.241 and the ENPP = 6.2 × 103 mm.
3.2. The Design of MS
MS consists of a collimator lens, a stop array and a lens array, as shown in Figure 3. It is a relay subsystem that connects the stepped micromirrors with NIS or RSIS and can also realize DoA snapshot imaging. The collimator lens is used to modulate the incident light from each FOV of the target into parallel beams. The stop array is introduced to prevent lens array imaging crosstalk.
The lens array also adopts a telecentric design of the object space that is compatible with RS. Its image space NA should be equal to NARSO, which is expressed as NALAI. The focal depth of the lens array must be greater than the RS’ field depth. The size of the lens array is decided by the size of the stepped micromirrors. The size and shape of the lens units should be the same as that of the phase modulation units mentioned in chapter 2 to ensure the one-by-one correspondence between the imaging channels and the spectral channels. That is, the lens unit is a square micro-lens with a side length of 4 mm. As shown in Figure 3, the focal length of the lens array should be greater than the total length of the stepped micromirrors; otherwise, the subsystem’s layout will conflict with each other. In summary, it was possible to obtain the lens unit design index shown below (Table 3).
Table 3.
Lens unit design index.
In order to improve the spatial resolution and luminous flux, it is necessary to increase the FOV of the incident light beam and the aperture of the stop unit. We fully considered the tradeoff between the FOV of the incident light beam and the aperture of the stop unit in optical design, setting the FOV of the incident light beam to ω0 = 3.6°, and the aperture of the stop unit to 2 mm × 2 mm. The f-number of the lens unit was large, so it was easy to eliminate chromatic aberration. We chose silicon as the design material for the lens array.
Figure 7a is the layout of the combination of the stop unit and the lens unit. The optimized focal length of the lens unit is fLA = 45 mm, and the exit pupil distance is EXPPLA = 1 × 1010 mm. Figure 7b shows the spot diagram, and the focal depth of the lens array was calculated as Δz = 4λ(F#LA)2 = 3980.608 μm, which is greater than the RS’s field depth.
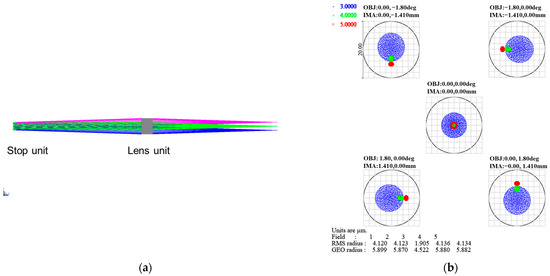
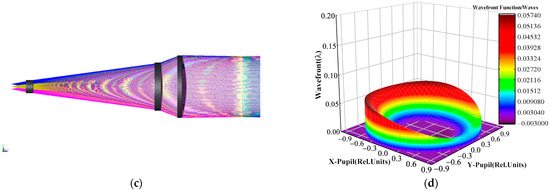
Figure 7.
MS design results: (a) the layout of the lens unit; (b) the full field spot diagram of the lens unit; (c) the layout of the collimator lens; (d) wavefront diagram of the light beam of the collimator lens at edge FOV.
The FOV of the collimator lens is equal to the lens unit’s, which is expressed as ω1 = 3.6°. The effective aperture of the collimator lens is expressed as Dc = × 32 = 45.3 mm. We set the focal length of the collimator lens to fc = 130 mm, and the primary imaging height of NIS or RSIS is calculated as hf = 2fctan (ω1/2) = 8.18 mm, that is, the maximum aperture of field stop is 8.18 mm. The collimator lens uses a combination of different materials, including germanium, silicon and zinc selenide, to achieve an achromatic design.
Figure 7c is the layout of the optimized collimator lens, and Figure 7d shows the wavefront diagram of the light beam of the collimator lens at the edge of the FOV. The RMS wave aberration was 0.0178 λ, less than 0.05 λ. This proves that the collimator lens has good collimation. Additionally, the collimator lens is able to adopt an object space telecentric design whose entrance pupil distance is ENPPc = 1 × 1010 mm, and object space NA is expressed as NAco = 0.189 after optimization. The MS layout was determined by matching the collimator lens and the lens array, as shown in Figure 8.
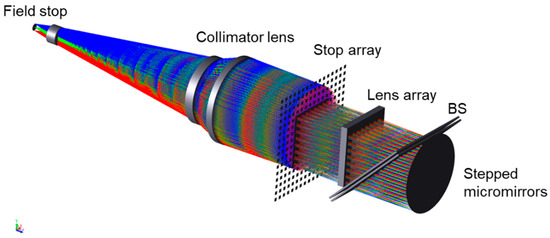
Figure 8.
Determining the MS layout by matching the collimator lens and the lens array.
3.3. The Design of NIS
NIS is utilized for near-field target detection in the SIIFTS. It images the target in the field stop position, which is MS’s object plane. Therefore, NIS adopts a telecentric design of the image space, and its image space NA, which is expressed as NANISI, should be equal to NAco. Assume that its image height is hI. NIS’s design index is shown in Table 4.
Table 4.
NIS design index.
We set the FOV of NIS to hF = 32 mm. The paraxial magnification of NIS was calculated as βNIS = hI/hF = −8.18 mm/32 mm = −0.256. A combination of various elements, such as germanium, silicon and zinc selenide, were used to achieve an achromatic NIS design. The NIS layout is shown in Figure 9a.
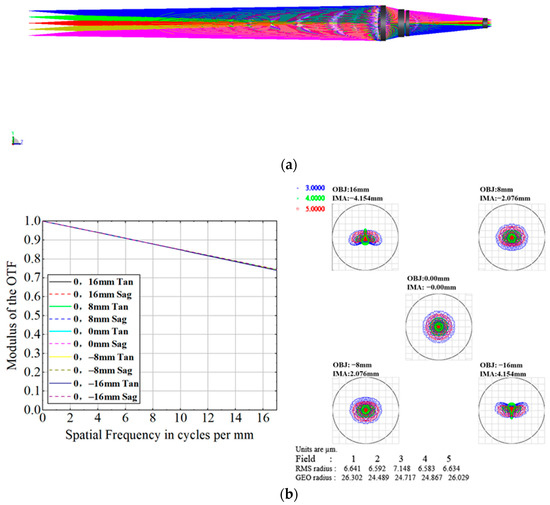
Figure 9.
NIS design results: (a) NIS layout; (b) MTF and full field spot diagram for NIS.
The paraxial magnification optimized NIS is βNIS = −0.259, the image space NA of NIS is NANISI = 0.190 and the exit pupil distance is EXPPNIS = 1 × 104 mm, all of which meet the design index.
3.4. The Design of RSIS
A reflective optical system design is adopted to be the objective lens used for SIIFTS remote sensing applications. The large-aperture reflective telephoto optical system has the advantages of having no chromatic aberration, no secondary spectrum, a wide band range, etc. It is suitable for wide spectrum infrared imaging. The coaxial reflective optical system has the characteristics of central obscuration, a small receiving area and scattered central spot energy, among others, all of which reduce the detection ability. We adopted an off-axis three-mirror design to ensure that the RSIS was achromatic and to improve the luminous flux. Similar to NIS, RSIS is also an image space telecentric system. The image space NA of RSIS expressed as NARSISI should be equal to NANISI and have an image height of hR = hI.
The spatial resolution requirement of the SIIFTS is better than 0.3 m at 2000 m; that is, when the detection distance is H = 2000 m, the spatial resolution R should be less than 0.3 m. The size of a single pixel is p = 30 μm, which corresponds to the height on the focal plane of the RSIS image, and is expressed as dx = 30 μm × βNIS/βRS = 0.032 mm. We set the focal length of RSIS to fRSIS, where H/fRSIS = R/dx and fRSIS = Hdx/R = 2000 m × 0.032 mm/0.3 m = 213 mm; therefore, when the fRSIS > 213 mm, the spatial resolution will be better than 0.3 m at 2000 m. The focal length of RSIS was set to fRSIS = 300 mm. RSIS’s FOV of was calculated as ωRSIS = arctan (hI/2fRSIS) = 0.75°. The design index is shown in Table 5.
Table 5.
RS design index.
The off-axis three-mirror system is based on the coaxial reflective optical system. Figure 10 shows a schematic diagram of the initial structure of a coaxial reflective optical system. The target is located at infinity, and the entrance pupil is on the primary mirror M1, while M2 and M3 are the secondary mirror and the tertiary mirror, respectively. The mirror is usually a quadratic surface, and the quadratic coefficients are e12, e22 and e32. We introduced the follow parameters: an obscuration ratio caused by the secondary mirror of α1 = l2/f1’ ≈ h2/h1, an obscuration ratio caused by the tertiary mirror of α2 = l3/l2′ ≈ h3/h2, a magnification of the secondary mirror is β1 = l2′/l2 = u2/u2’ and a magnification of the tertiary mirror of β2 = l3′/l3 = u3/u3′.
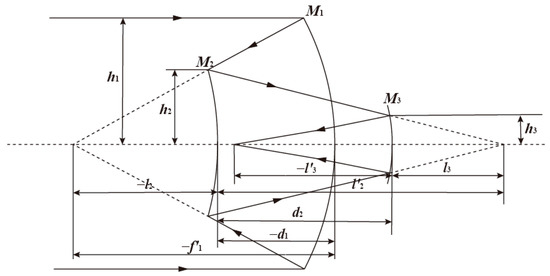
Figure 10.
The schematic diagram of the initial coaxial reflective optical system structure.
For the reflective system, the refractive index is n1 = n2′ = n3 = 1, n1′ = n2 = n3′ = −1, and d1 and d2 are the distances between the primary mirror, and the secondary mirror, and the distances between the secondary mirror and the tertiary mirror, respectively. l3′ is the back intercept, where d1 < 0, d2 > 0, l3′ < 0, f′ is the focal length of the three-mirror off-axis subsystem, that is, f′ = fRSIS. The equation for the d1, d2 and l3′ is as follows:
Assume that the radii of the primary mirror, the secondary mirror and the tertiary mirror are r1, r2 and r3, respectively, as shown below:
The free variables of the three-mirror subsystem include e12, e22, e32, α1, α2, β1 and β2, and the RSIS adopts the telecentric design of image space; that is, the image plane is flat. According to the third-order aberration theory, the spherical aberration SI, the coma SII, the astigmatism SIII, and the field curvature SIV are all equal to 0:
The outline dimensions of the three mirrors can be determined by defining the three independent variables in the seven free variables above. The parameters of the initial structure can be calculated. The image space NA of the off-axis three-mirror subsystem is large. While shortening the lens barrel as much as possible, it is also necessary to ensure that there is no obscuration between the secondary mirror and the tertiary mirror, and the mechanical structure between RSIS and MS should be reasonably designed.
We set the distance between the secondary mirror and the primary mirror to be twice the distance between the secondary mirror and the tertiary mirror and ensured that the back intercept was slightly larger than the distance between the secondary mirror and the tertiary mirror, that is, d2 = −1/2d1, l3′ = −1.2d2, and the focal length was set to d1 = −400 mm, d2 = 200 mm, l3′ = −240 mm, setting the focal length to f′ = −300 mm. According to Formula (2), α1 = 0.4, α2 = 2, β1 = 0.75, β2 = 0.6. The quadratic coefficients e12 = 1.197, e22 = −1.929 and e32 = −0.327 can be obtained by Formulas (3)–(6). The initial structure is shown in Table 6.
Table 6.
Initial structural parameters of RSIS.
The conic parameter is −e2, and we optimized the initial structure and limited the operands, including the NA, focal length and exit pupil distance. The parameters of the optimized RSIS are shown in Table 7.
Table 7.
Structural parameters of optimized RSIS.
Figure 11a shows the FOV distribution, and Figure 11b is the RSIS layout. The MTF of RSIS is shown in Figure 11c, and the MTF of the full FOV is greater than 0.7 at 17 lp. Figure 11d shows that the RMS radius of the image spots is less than 4 μm.
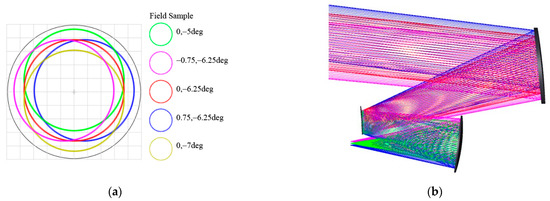
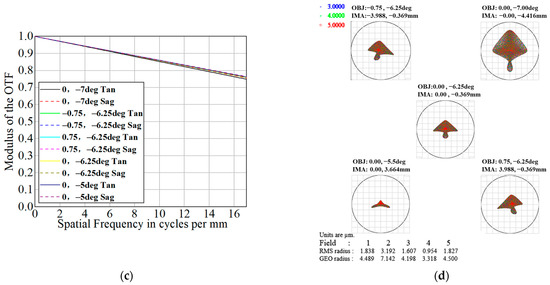
Figure 11.
RSIS design results: (a) RSIS FOV distribution; (b) RSIS layout; (c) MTF of RSIS; (d) the full field spot diagram of RSIS.
3.5. The Simulation of SIIFTS
3.5.1. Geometric Optical Simulation
We also completed a geometric optical simulation of the SIIFTS in ZEMAX. We combined all of the optimized subsystems into a SIIFTS layout applied for near-field target detection, as shown in Figure 12a, and the SIIFTS layout applied for remote sensing, as shown in Figure 12b. We obtained the spot diagram through the geometric optical simulation, as shown in Figure 12c,d. The RMS radii of the image spots are less than 3.84 μm.
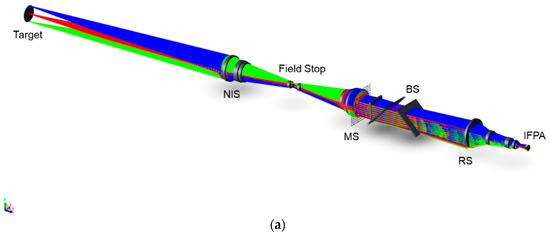
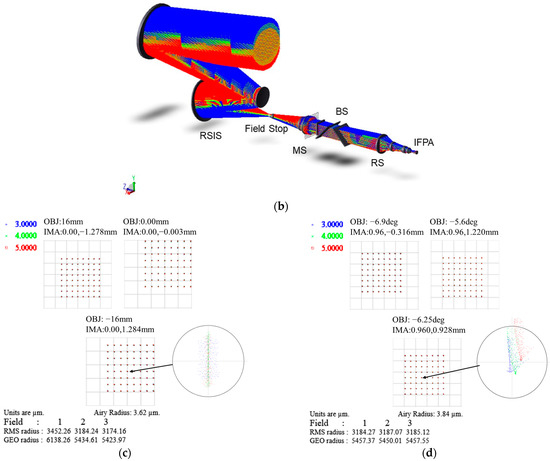
Figure 12.
SIIFTS geometric simulation results: (a) SIIFTS layout applied for near-field target detection; (b) SIIFTS layout applied for remote sensing; (c) full field spot diagram of the geometric simulation determined by near-field target detection; (d) full field spot diagram of geometric simulation carried out during remote sensing.
3.5.2. Physical Optical Simulation
We also carried out a physical optical simulation of the SIIFTS, which verified its image and spectrum reconstruction ability. The light propagation diagram is shown in Figure 13a; the SIIFTS detected the letter “C” and obtained the interference image array. The interference image array with the letter “C” was segmented and registered, and 3D interference intensity datasets I (x, y, Δ (m, n)) were obtained, as shown in Figure 13b.
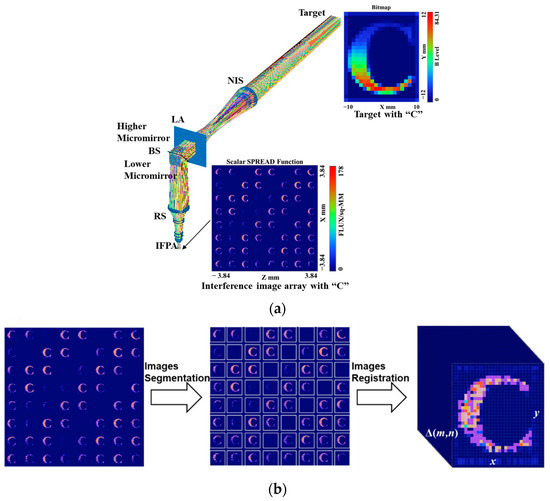
Figure 13.
Physical simulation of SIIFTS: (a) SIIFTS light propagation diagram during physical simulation; (b) the processing of the interference image array from the physical simulation.
Any pixel (x, y) can be chosen to determine the interference intensity sequence shown in Figure 14a, making it easy to obtain a reconstructed (x, y) spectrum according to Formula (1). The reconstructed spectrum is shown by the blue solid line in Figure 14b, while the red dotted line shows the standard spectrum of the letter “C” in the simulation.
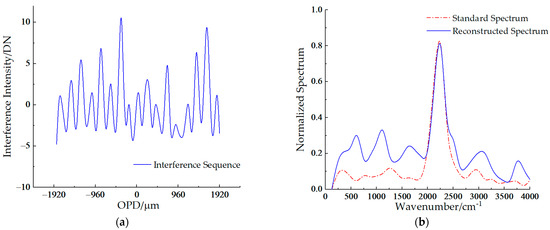
Figure 14.
The reconstructed spectrum of the letter “C” during the physical simulation: (a) the interference sequence of the (x, y); (b) the reconstructed spectrum and the standard spectrum.
Compared to the standard spectrum used during the simulation, the reconstructed spectrum has no peak shift but does have spectral noise. This is due to the crosstalk between adjacent imaging points caused by the discrete sampling of the light source during the simulation. The crosstalk was converted to spectral noise in the frequency domain.
4. Experiment and Discussion
4.1. Experiment Results
After designing the mechanical structure and making any optical adjustments, we built a SIIFTS prototype in a laboratory environment. We choose NIS as the objective lens to be applied during the SIIFTS’s near-field target detection. The designed mechanical structure is shown in Figure 15a, and a picture of the SIIFTS prototype is shown in Figure 15b.
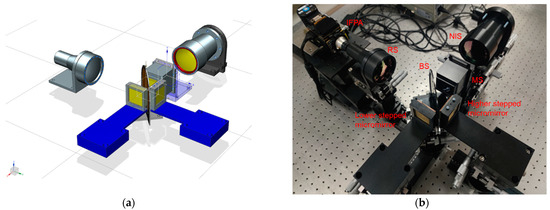
Figure 15.
SIIFTS prototype: (a) the designed mechanical structure of the SIIFTS prototype; (b) a picture of the prototype of SIIFTS in a laboratory environment.
In order to simulate the engine tail flame detection experiment in the laboratory environment, we chose the flame produced from a high-temperature alcohol burner as the dynamic target to be measured. We utilized the SIIFTS prototype to detect the spectral images of the flame from the alcohol burner. Alcohol combustion mainly produces water and carbon dioxide. The characteristic peak observed for carbon dioxide absorption is in the SIIFTS’s effective detection band. Therefore, we took the characteristic absorption peak of carbon dioxide as the standard spectrum.
We located the flame produced from the high-temperature alcohol burner on the NIS object plane. We selected a narrow-band filter with a central wavelength of 2111.72 cm−1 and a bandwidth of 41.88 cm−1 in the SIIFTS to detect the target. After the flame produced from the alcohol burner was detected via snapshot detection, we determined the interference image array as shown in Figure 16a. We segmented and registered the interference image array, and the 3D interference intensity datasets were constructed. The interference intensity sequence of the central pixel is shown in Figure 16b, and the reconstructed spectrum can be easily obtained according to Equation (1) is shown in Figure 16c. It can be seen that the reconstructed spectrum measured by the SIIFTS is almost consistent with the standard spectrum.
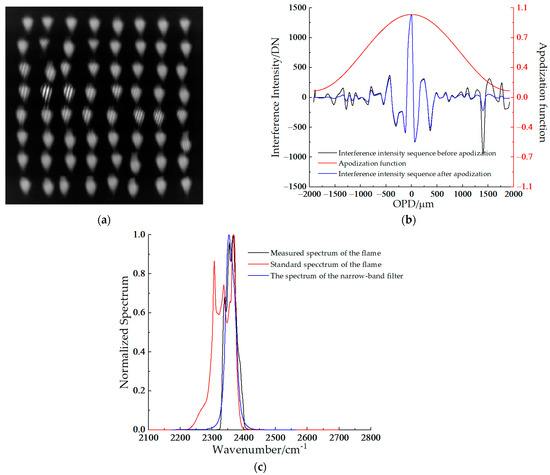
Figure 16.
The detection results of the flame from the alcohol burner measured by SIIFTS: (a) the interference image array of the flame; (b) the interference intensity sequence of the central pixel is obtained after image segmentation and image registration; (c) the reconstructed spectrum is obtained according to the interference intensity sequence.
4.2. Discussion
The interference image array of the flame produced from the alcohol burner is shown in Figure 16a. We can see that several image units are slightly eccentric compared to the ideal imaging positions. The eccentricity results from the lens unit’s tilt, which is caused by limiting the processing precision of the lens array. The eccentricity will cause sampling error in the interference intensity, which is inevitable. However, we have proposed an algorithm to correct this error, but it will not be described in detail in this paper.
The black curve in Figure 16b represents the raw data of the interference intensity sequence of the central pixel. The red curve is the apodization function that is adopted to mitigate side-lobe oscillation. The apodization function is the Happ-Genzel function. We obtained the blue curve after apodization.
There are three spectral curves that can be observed in Figure 16c: the red curve represents the standard spectrum of carbon dioxide, the blue curve represents the spectrum of the narrow-band filter and the black curve represents the spectrum of the reconstructed spectrum of the flame produced from the alcohol burner. The wave numbers of the main peaks of the standard spectrum within the effective bandwidth are 2366.9 cm−1, 2356.5 cm−1 and 2337.5 cm−1, respectively. The wave numbers of the main peaks of the reconstructed spectrum measured by the SIIFTS are 2366.8 cm−1, 2355.8 cm−1 and 2337.9 cm−1. The peak shifts are 0.1 cm−1, 0.7 cm−1 and 0.4 cm−1. They are all less than half of the spectral resolution, which is 2.6 cm−1. This proves that the SIIFTS can accurately and qualitatively identify the target spectrum.
In spectroscopy, the material composition, the reaction species, the reaction rate and other differences between the detection targets can be recognized through spectral properties such as the spectral peak position and the spectral peak intensity. The SIIFTS can detect the transient spectrum of the targets, which means that the SIIFTS has a very high time resolution compared to the imaging spectrometers with a scanning structure. The SIIFTS can sample the images and spectrum within a very short period of time, meaning that it can record and reproduce the moving process of the dynamic targets monitored within a period of time. Nevertheless, imaging spectrometers with a scanning structure cannot do this because when the time interval in which the samples are taken is too long, the spectra and images that are obtained are discontinuous.
For example, during the transient spectrum measurement process using SIIFTS applications such as engine tail flame detection or explosion reactions, the combustion or explosion products were able to be easily recognized by the spectral peak position. The engine combustion efficiency or explosion reaction rate can be obtained by calculating the components of different products based on spectral peak intensity. If necessary, the complete motion process of combustion of explosions can be analyzed by the images and spectra measured at different moments. The experimental results provided in this paper are to recognize the combustion products through the characteristic peaks of the reconstructed spectrum. The SIIFTS can accurately detect the spectral peak position of the detection targets due to the calibration of the spectral wavenumbers.
Additionally, the SIIFTS can obtain high-quality images and spectra from dynamic targets at a certain moment in time, and snapshot imaging is beneficial for solving problems related to motion artifacts. This does not mean that the SIIFTS has the ability to capture any moving target at any speed as the technology currently stands. When the product of the exposure time t and the moving speed v of the target exceeds the sample distance corresponding to the size of half a pixel p, the detection will suffer performance degradation. In this case, a single-exposure detection image will produce motion artifacts, and the crosstalk between adjacent pixels will lead to the inaccurate sampling of the interference intensity sequence, resulting in reconstructed spectrum distortion. For example, when the SIIFTS is applied to remote sensing imaging spectral detection, it is necessary to ensure that t v < 1/2 GSD (ground sample distance) to maintain perfect detection performance. Therefore, there is a speed threshold for the detection of dynamic targets, and it is difficult for the SIIFTS to detect a moving target beyond the speed threshold (the factors affecting the speed threshold include the exposure time, pixel size, optical system, etc.). Of course, compared to the traditional imaging spectrometers with a scanning structure, the threshold speed of the SIIFTS system produced here is increased by more than a thousand times. In future work, we will evaluate the SIIFTS performance in different application scenarios, and we will inevitably include the threshold speed. We will determine the threshold speed when detecting different dynamic targets that directly affect the application range and will further optimize the SIIFTS through experimental analysis.
5. Conclusions
We proposed a novel structure, SIIFTS, based on stepped micromirrors and a lens array. A dynamic target in the mid-wave infrared band was realized using snapshot detection. This method is efficient, stable and free of motion artifacts. We discussed the optical system design of the SIIFTS structure that was proposed, analyzed the unique optical design problems of this structure and designed two interchangeable objective lenses for two types of target detection applications. From the results of the optical simulation, our optical design met the expected requirements. We also built a prototype and detected the spectral images of a high-temperature dynamic target in a laboratory environment. The experimental results show that the SIIFTS can identify dynamic targets accurately and qualitatively. We have achieved satisfactory images and spectra. Future research will focus on improving image resolution and compressing the spectral information obtained from the detection target.
Author Contributions
Conceptualization, Y.C. and J.L. (Jinguang Lv); methodology, Y.C. and J.L. (Jinguang Lv); validation, Y.C. and W.Y.; investigation, Y.C.; resources, Y.Z. and J.T.; writing—original draft preparation, Y.C.; writing—review and editing, J.L. (Jingqiu Liang) and W.W.; supervision, Y.Q.; funding acquisition, C.C. and J.L. (Jingqiu Liang) All authors have read and agreed to the published version of the manuscript.
Funding
This research was funded by the National Natural Science Foundation of China under Grant 61805239, Grant 61627819, Grant 61575193 and 61727818; funded by the Jilin Scientific and Technological Development Program under Grant 20190303063SF, Grant 20180201024GX and Grant 20150520101JH; funded by the Youth Innovation Promotion Association Foundation of the Chinese Academy of Sciences under Grant 2018254 and 61905240; and funded by the National Science and Technology Major Project of China under Grant 2019QZKK020802.
Institutional Review Board Statement
Not applicable.
Informed Consent Statement
Not applicable.
Data Availability Statement
Not applicable.
Acknowledgments
We gratefully acknowledge Jun Ren, Kaifeng Zheng, Baixuan Zhao and Yingze Zhao for useful discussion and help in optical design and experiment.
Conflicts of Interest
The funders had no role in the design of the study; in the collection, analyses, or interpretation of data; in the writing of the manuscript, or in the decision to publish the results.
References
- Shang, S.; Lee, Z.; Lin, G.; Hu, C.; Shi, L.; Zhang, Y.; Li, X.; Wu, J.; Yan, J. Sensing an intense phytoplankton bloom in the western Taiwan Strait from radiometric measurements on a UAV. Remote Sens. Environ. 2017, 198, 85–94. [Google Scholar] [CrossRef]
- Phinn, S.; Roelfsema, C.; Dekker, A.; Brando, V.; Anstee, J. Mapping seagrass species, cover and biomass in shallow waters: An assessment of satellite multi-spectral and airborne hyper-spectral imaging systems in Moreton Bay (Australia). Remote Sens. Environ. 2008, 112, 3413–3425. [Google Scholar] [CrossRef]
- Pope, A.; Rees, W.G. Impact of spatial, spectral, and radiometric properties of multispectral imagers on glacier surface classification. Remote Sens. Environ. 2014, 141, 1–13. [Google Scholar] [CrossRef]
- Bing, Z.; Wei, Y.; Gao, L. Real-time target detection in hyperspectral images based on spatial-spectral information extraction. Eurasip J. Adv. Signal Processing 2012, 2012, 142. [Google Scholar]
- Chen, K.; Yan, R.; Xiang, L.; Xu, K. Excitation spectral microscopy for highly multiplexed fluorescence imaging and quantitative biosensing. Light Sci. Appl. 2021, 10, 97. [Google Scholar] [CrossRef] [PubMed]
- Zimmermann, T.; Rietdorf, J.; Pepperkok, R. Spectral imaging and its applications in live cell microscopy. FEBS Lett. 2003, 546, 87–92. [Google Scholar] [CrossRef]
- Hagen, N.; Kudenov, M.W. Review of snapshot spectral imaging technologies. Opt. Eng. 2013, 52, 090901. [Google Scholar] [CrossRef] [Green Version]
- Tao, C.; Zhu, H.; Sun, P.; Wu, R.; Zheng, Z. Hyperspectral image recovery based on fusion of coded aperture snapshot spectral imaging and RGB images by guided filtering. Opt. Commun. 2020, 458, 124804. [Google Scholar] [CrossRef]
- Barden, S.C.; Arns, J.A.; Colburn, W.S. Volume-Phase Holographic Gratings and Their Potential for Astronomical Applications. In Proceedings of the SPIE—The International Society for Optical Engineering, Kona, HI, USA, 9 July 1998; Volume 3355, pp. 866–876. [Google Scholar]
- Bodkin, A.; Sheinis, A.; Norton, A.; Daly, J.; Roberts, C.; Beaven, S.; Weinheimer, J. Video-rate chemical identification and visualization with snapshot hyperspectral imaging. In Proceedings of the SPIE Defense, Security, and Sensing, Baltimore, MD, USA, 17 May 2012. [Google Scholar]
- Okamoto, T.; Yamaguchi, I. Simultaneous acquisition of spectral image information. Opt. Lett. 1991, 16, 1277–1279. [Google Scholar] [CrossRef] [PubMed]
- Shogenji, R.; Kitamura, Y.; Yamada, K.; Miyatake, S.; Tanida, J. Multispectral imaging using compact compound optics. Opt. Express 2004, 12, 1643–1655. [Google Scholar] [CrossRef] [PubMed]
- Gehm, M.; John, R.; Brady, D.J.; Willett, R.M.; Schulz, T.J. Single-shot compressive spectral imaging with a dual-disperser architecture. Opt. Express 2007, 15, 14013–14027. [Google Scholar] [CrossRef] [PubMed]
- Kudenov, M.W.; Dereniak, E.L. Compact real-time birefringent imaging spectrometer. Opt. Express 2012, 20, 17973–17986. [Google Scholar] [CrossRef] [PubMed]
- Hirai, A.; Inoue, T.; Itoh, K.; Ichioka, Y. Application of Measurement multiple-image fourier of fast phenomena transform spectral imaging to measurement of fast phenomena. Opt. Rev. 1994, 1, 205–207. [Google Scholar] [CrossRef]
- Kudenov, M.W.; Dereniak, E.L. Compact snapshot birefringent imaging Fourier transform spectrometer. In Proceedings of the SPIE—The International Society for Optical Engineering, San Diego, CA, USA, 13 August 2010; Volume 7812. [Google Scholar]
- Maione, B.D.; Luo, D.A.; Kudenov, M.W.; Escuti, M.J.; Miskiewicz, M.N. Birefringent Snapshot Imaging Spatial Heterodyne Spectrometer. In Polarization: Measurement, Analysis, and Remote Sensing XI; International Society for Optics and Photonics: Bellingham, WA, USA, 2014. [Google Scholar]
- Maione, B.; Brickson, L.; Escuti, M.; Kudenov, M. Snapshot imaging spectrometry with a heterodyned Savart plate interferometer. Opt. Eng. 2017, 56, 081806.081801–081806.081811. [Google Scholar] [CrossRef]
- Wang, W.; Liang, J.; Liang, Z.; Lü, J.; Qin, Y.; Tian, C.; Wang, W. Design of spatio-temporally modulated static infrared imaging Fourier transform spectrometer. Opt. Lett. 2014, 39, 4911. [Google Scholar] [CrossRef] [PubMed]
- Chen, Y.; Lv, J.; Zhao, B.; Tao, J.; Qin, Y.; Wang, W.; Liang, J. Medium-wave Infrared Static Fourier Transform Spectrometer Based on Micro-optical Elements. IEEE Access 2021, 9, 89452–89460. [Google Scholar] [CrossRef]
- Gao, J.H.; Liang, J.Q.; Jin-guang, L.; Liang, Z.Z.; Qin, Y.X.; Wang, W.B. A Stepped Mirror Based Temporally and Spatially Modulated Imaging Fourier Transform Spectrometer: Principle and Data Processing. Spectrosc. Spectr. Anal. 2017, 37, 3932. [Google Scholar]
- Lacan, A.; Bréon, F.M.; Rosak, A.; Brachet, F.; Roucayrol, L.; Etcheto, P.; Salaün, Y. A static Fourier transform spectrometer for atmospheric sounding: Concept and experimental implementation. Opt. Express 2010, 18, 8311. [Google Scholar] [CrossRef]
- Zheng, Y.; Liang, J.; Liang, Z. Design and fabrication of step mirrors used in space-modulated Fourier transform infrared spectrometer. Opt. Express 2013, 21, 884–892. [Google Scholar] [CrossRef]
- Zhao, B.; Lv, J.; Ren, J.; Qin, Y.; Tao, J.; Liang, J.; Wang, W. Data processing and performance evaluation of a tempo-spatially mixed modulation imaging Fourier transform spectrometer based on stepped micro-mirror. Opt. Express 2020, 28, 6320–6335. [Google Scholar] [CrossRef] [PubMed]
Publisher’s Note: MDPI stays neutral with regard to jurisdictional claims in published maps and institutional affiliations. |
© 2022 by the authors. Licensee MDPI, Basel, Switzerland. This article is an open access article distributed under the terms and conditions of the Creative Commons Attribution (CC BY) license (https://creativecommons.org/licenses/by/4.0/).