Abstract
Transportation safety has been widely discussed for avoiding forward collisions. The broad concept of remote sensing can be applied to detect the front of vehicles without contact. The traditional Haar features use adjacent rectangular areas for many ordinary vehicle studies to detect the front vehicle images in practice. This paper focused on large vehicles using a front-installed digital video recorder (DVR) with a near-infrared (NIR) camera. The views of large and ordinary vehicles are different; thus, this study used a deep learning method to process progressive improvement in moving vehicle detection. This study proposed a You Only Look Once version 4 (YOLOv4) supplemented with the fence method, called YOLOv4(III), to enhance vehicle detection. This method had high detection accuracy and low false omission rates using the general DVR equipment, and it provided comparison results. There was no need to have a high specification front camera, and the proposed YOLOv4(III) was found to have competitive performance. YOLOv4(III) reduced false detection rates and had a more stable frame per second (FPS) performance than with Haar features. This improved detection method can give an alert for large vehicle drivers to avoid serious collisions, leading to a reduction in the waste of social resources.
1. Introduction
In recent decades, there has been steadily increasing concern about the quality of transport, including driving safety, vehicle pollution reduction, green logistics, and carbon reduction [1,2,3,4]. To construct an intelligent transportation framework in a smart city, transportation management has been extensively applied to large fleets using monitoring devices. Large vehicles (i.e., trucks and big buses) are utilized for long-distance travel, and the issue of forward collision has been discussed for many years. Thus, the technology of vehicle detection and recognition was discussed to assist in driving safety. Broadly speaking, remote sensing refers to a method of measuring foreign objects without contacting the target. A vehicle’s front camera can be considered the most basic remote sensing instrument, and deep learning and machine learning are the subsets of artificial intelligence (AI) that can greatly improve a system’s ability to sense impending collisions. Since large vehicles take longer for breaking response than ordinary cars, an effective detection method can help the drivers of large vehicles have proper real-time responses and warn the drivers immediately before the collision to reduce the probability of traffic accidents.
In previous studies, most research displayed a driving simulator [1,3,5,6]. This paper, on the other hand, provides practical cases. The research question is to solve misjudged detection of moving vehicles from the front at different times of day and on various roads when the large vehicle fleet has limited funds and often chooses cheap front cameras supplemented with a traditional detection approach (i.e., Haar features). Therefore, this research motivation is to enhance the software technique of front-vehicle detection without changing the front camera equipment. This study used front cameras with a sensor that can help determine whether the driver almost hits a vehicle from the front using a deep learning approach. The sensor installed on the large vehicle is an important tool for monitoring the driving procedures. Most accident events pay no attention to the vehicle from the front. Unsafe driving statuses have caused many traffic issues, resulting in severe accidents and injuries. The drivers of large commercial buses must pay attention carefully to the safely conveying passengers. Big bus fleets must reduce the violations since the passengers are on the bus, and drowsy driving can easily cause major traffic accidents, which, in turn, can develop serious traffic jams and waste a lot of social resources for dealing with the road’s clearing and environmental pollution [4,7]. Abnormal driving, rear-end crashes, and carbon emissions are related. When a large vehicle has a vehicle in the front that takes a sudden turn, brakes sharply, and decelerates, energy is consumed in an economically inefficient way [7,8]. The improper driving information for prevention beforehand is necessary, especially on frequent accident road segments. Changing lanes on normal roads occurs more often than on highways. Since large vehicles have a longer response time for brakes than ordinary cars, the large vehicle needs to keep a greater distance when detecting for closing front vehicles. Therefore, detecting the front vehicle can notify the driver to respond more quickly using an image detection method. When the driver is exhausted during a long trip, providing the detection warning is necessary due to reducing awareness and reflexes from fatigue. Abnormal driving can also be alerted in advance. Warning monitoring for truck fleet drivers reduces forward collisions and ensures better driving safety, so traffic accidents are reduced, and social resources are not wasted [4]. Efficient forward collision avoidance can conserve vehicle energy. Moreover, mobile devices can provide rapid identification of driving situations for enhancing safe dispatching work. The image classification technique can be used with the hardware monitoring, and the driving information uploaded to the cloud for management and analysis to assist the system in operation and maintenance.
Resource conservation is to reduce vehicle carbon emissions [3,4]. Large vehicles are a primary resource depletion. Large and small vehicles have different carbon emissions. Taking the speed of 50 kilometers per hour on the highway as an example, the carbon emission of a large bus (except on Highway No. 5) is 371.0016 (g/km), and the carbon emission of small passenger car is 171.5453 (g/km) [9]. The large vehicle has a greater negative impact on the environment. Generally, if a front vehicle is detected and the large vehicle needs to slow down, its repeated decelerating and accelerating arbitrarily on the road, and its related carbon dioxide emissions produced, will affect the environment. Moreover, the monitoring uses sensors to control depletion. Considering the shortage of light sources at night, the camera from our management system can combine with the infrared design that emits red light onto forward objects. By using various sensors to collect large-scale data, the hardware equipment can enhance front-vehicle detection. However, it is expensive to change hardware and not all vehicle companies can or are willing to invest in hardware improvements [2]. Monitoring equipment also increase energy use. The objective is to reduce invisible energy loss and the waste of social resources and achieve resource conservation. The camera should be selected according to the lighting spectrum; therefore, infrared (IR) spectra are typically used for night lighting.
There have been many studies that have explored various types of deep learning methods for vehicle detection. The early warning can avoid the vehicle accidents. Theoretically, the better method is to use high-resolution images. Cheaper digital video recorder (DVR) equipment often causes misjudgments due to various factors. Thus, this paper uses advanced algorithms to improve the traditional vehicle detection. Moreover, large and ordinary vehicles have different detection vision. Traditional methods and image data on the device side are limited from car kits, which cannot be adjusted in the short term. Many sensor devices on the market still have misjudgments in detecting front vehicles. When the original algorithm of the car kits cannot be replaced, the current solution is to use manual methods to perform secondary detection on the problematic images, but manual operation is cumbersome. When detection has many misjudged images, it takes a lot of time to process. Therefore, this research proposed a new method to process misjudged images and improve detection efficiency.
In addition, spatial information technology (SIT) can be used to develop large fleet management in smart transportation. This study also analyzed front vehicle detection, which relies on remote sensing (RS) and SIT to achieve social resource protection. This study used the monitoring driving system to protect the freights in transport. The vehicles installed a global positioning system (GPS) and front DVR camera. Thus, a case study of vehicle detection for a large vehicle fleet is the main research interest in this paper. The contribution of this study is to provide a valuable assistance for helping large vehicle drivers.
This paper is organized as follows. Section 2 provides a literature review of remote sensing using DVR with NIR, region-based and regression-based algorithms, vehicle recognition, vehicle detection, machine learning, and deep learning. In Section 3, we developed a new approach for improving the front-vehicle detection and compare with other methods. Section 4 provides comparison results and analyses. Section 5 shows the discussion, and Section 6 provides the conclusions.
2. Related Works
Transportation is an indispensable infrastructure in human life and social development. Remote sensing techniques have also been widely applied to the intelligent transportation field, such as fleet management, environmental improvement, and major national construction [2,3,4]. For example, Avtar et al. (2020) [5] provided sensor and monitoring applications for socio-economic development on transportation topics. Rear-end avoidance uses an advanced detection method to limit vehicle crashes, thus enhancing socio-economic sustainable development. The previous studies focused on collecting a variety of vehicle sensor data, processing large amounts of complex data for monitoring, and managing resources, improving transportation, and then applying to the monitoring of fleet management. Complete routing planning can improve driving safety [8]. The further sustainable vehicle routing problem (VRP), Green VRP, is the study of the intersection of transportation, energy consumption, and pollution. A state-of-the-art green vehicle routing problem is to overcome pollution in logistics and transport activities [4].
2.1. Front-Vehicle Detection and Driving Situation
The rear-end collision is related to driving behavior. After continuous driving, the large vehicle driver will feel fatigued. Drivers fail to pay attention, and then hit the front vehicle. It is more important to manage driving status when the vehicle is outside. Srinivas and Gajanand [3] reviewed the objective function for cost, time, fuel consumption, and pollution in detail for VRP. Naqvi et al. [1] proposed gaze detection based on near-infrared (NIR) camera sensors for ordinary vehicles for discussing aggressive and normal driving behavior, and their experiment was applied via a driving simulator. Therefore, an advanced algorithm approach can be successfully applied to intelligent transportation.
Many past studies determined whether the vehicle was too close to the front car using its taillight and computed the distance between the two vehicles. Abnormal driving situations are related to forward collision using emotional factors in the driver’s behavior [1]. The advanced driver assistance systems (ADAS) can be a useful system to ensure drivers keep their distance from the front vehicle. Sensors can be used for vehicle speed, acceleration, deceleration, and driving trajectory, and combined with an accelerator, brake lights, and turn signals. Forward collision warning or collision avoidance is to avoid rear-end crashes. Drivers can be notified of upcoming hazards and help drivers respond quickly. Fleet management systems can also provide real-time road condition warnings. It is important to measure the interaction between the driver and the vehicle.
The front camera can be used to monitor the road environment. Land detection can enhance road safety, which can directly or indirectly affect logistics costs. Remote monitoring is the main approach to implement and improve driving on traffic management. With different light conditions, the existing systems often have difficulty detecting the front vehicle. When the system detects proximity to the front vehicle, it will send out a warning message. The imaging quality of the camera affects the interpretation results. The system will issue a warning to remind the driver to monitor operating conditions to ensure safe transportation.
The basic tasks of computer vision consist of vehicle recognition, vehicle detection, semantic segmentation, and target detection. The vehicle image recognition process is to simplify the image information, proceeding from full-color images to obtain the target results, and then make a useful decision. The vehicle recognition algorithm includes recognition and analysis of vehicle trajectory and driving dynamics. Since the shape of a car is symmetrical, the width and height can be computed. The object can be determined to be a car. The weight of parameters can be adjusted by the training algorithm to construct a high accuracy function. Although deep learning can automatically detect image features, it may fall into an infinite adjustment process. Even if a set of parameters is finally identified from the images, it is not guaranteed to be applicable to all other cases [1,3,5]. Moreover, not every company can provide simulation equipment to train truck drivers at a higher cost. Mu et al. [2] described that hardware and software upgrade costs are the main factor that must be considered in the study. The aim of this paper will focus on detection improvement. Therefore, this study proposes a novel approach for improving front-vehicle detection.
2.2. Traditional, Region-Based and Regression-Based Algorithms
Vehicle detection has been discussed for many years. Neural network (NN) was a popular traditional approach to use various images to obtain detection results and usually needed many samples during the training process leading to long training times. Classification is one important method for image processing. Machine learning has two main types of classification that are unsupervised and supervised learning, such as k-means algorithm, decision tree, random forests, support vector machine (SVM), minimum-distance classification, artificial neural networks (ANN), and enhanced decision support system. Machine learning can be applied in intelligent transportation, and supervised learning method carries out the regression analysis and data classification for vehicle detection [3,10]. Therefore, the topic of vehicle detection is continuing past development using machine learning to obtain more robust detection techniques. The new methods were proposed to handle the darker conditions, supplement with assistance, and a warning system to improve the performance. However, most studies have focused on the discussion of public objections and a part of car images [11,12,13,14,15,16]. Yang et al. (2019) [17] used motion characteristics to obtain the front-vehicle detection using a feature-point clustering method. For object detection techniques, the traditional detection is an exhaustive method using sliding windows with classifiers. In the sliding windows method, the entire image is scanned one by one. Different aspect ratios will consume a lot of computing resources. The final step uses classifiers to determine the target of the sliding window. The classifier can be used to detect a vehicle when determining the position; however, it requires many samples and training is time-consuming [10,17,18].
The previous studies applied the Haar feature method, which implements shallow learning in different areas, and improves its various recognition and detection techniques [19,20,21,22,23,24,25,26,27,28,29,30,31]. Haar features have become a popular and effective object detection approach. The detection techniques are applied for transportation and logistics management for general vehicle detection. The vehicle detection was affected by some cases, such as static car images, moving cars, and different light levels [19,24,25]. The ANN method was used to improve car detection [27,28]. Lu et al. [29] pointed out that deep learning can obtain better performance in many object detections, but this learning method consumes many computing resources [29]. Qiu et al. (2021) [32] combined Haar-like features with CNN using fused edge features for vehicle recognition. Most Haar studies using .xml files still focused on the cases of eye, face, human body, and ordinary cars. In practice, Haar features were applied in fleet management systems for detection and provided a valuable service. Feature extraction can be used to convert the vehicle image into a string of numbers, and the distance characteristics are for vehicle classification. The feature components usually included the computation of distance, curvature, and angle between feature points. Therefore, Haar features were adopted in transport management.
The region-based method is to find out the region of a bounding box that may contain the object. Bounding-box regression is using a selective search to approximate the ground truth. The method selects some candidate boxes that can overlap and contain each other so that we can avoid testing all boxes. Since the image sizes of the extracted regions are different, it is necessary to filter the possible regions in advance for each region proposal; however, the image may warp. Honarparvar et al. (2021) [33] verified that regression-based models can obtain better accuracy than region-based models, and they had better performance using the YOLO method. The applications of region-based and regression-based algorithms are described in detail in Section 2.3, which follows.
2.3. Single-Stage and Two-Stage Approaches
The detection algorithms are divided into single-stage and two-stage methods. The approach of convolutional neural network (CNN) has been used for vehicle studies [1,3,18]. The two-stage method uses a selective search to select region proposals, and then perform object recognition, and the method includes Region-based Convolutional Neural Networks (R-CNN), fast R-CNN, and faster R-CNN applied to many research areas [34,35,36,37]. The two-stage method has more advantages in accuracy, but its efficiency is slow. CNN is used to complete the task of determining the vehicle, and the region is added to complete the positioning. Fast R-CNN, which was proposed for improving the drawback of R-CNN, also identifies candidate boxes in the image using the selective search, and it uses Region of Interest (RoI) Pooling to proceed with the bounding box process. The mask R-CNN uses the mask output to find the vehicle contour and obtain the classification results. Fast R-CNN uses region proposal network (RPN) to replace selective search and introduces an anchor box to deal with the change in target shape. Ren et al. (2017) [38] proposed Fast R-CNN to enhance detection quality. Chen et al. (2018) [39] provided an adjusted CNN approach for enhancing highway vehicle detection. Xing et al. (2019) [40] used the CNN model to achieve higher accuracy for deep learning-based driver activity recognition. Insufficient spatial resolution can affect poor image recognition.
The single-stage method includes you only look once (YOLO) and single shot object detector (SSD), which can simultaneously detect the object position and identify the object [41,42,43,44]. According to the development history of YOLO, it has been published to version 5. Redmon et al. (2016) [45] developed the first version of YOLO. YOLOv2 was proposed by Redmon and Farhadi [46], and YOLOv3 was developed in 2018 [47]. This paper applied YOLO that uses the idea of direct regression as a one-stage algorithm, which has only one network model for the whole operation process. YOLO used a regression-based concept for vehicle recognition. YOLO uses the feature of the whole image to predict a location, that is, using the whole image as the input of the network to directly return the target frame of the location and the category of the target at multiple locations of the image. YOLO is an extensive application with OpenCV to deal with streaming videos. Most studies still focused on the discussion of public objections and a part of vehicle images. Guerrieri and Parla (2021) [48] used the YOLOv3 concept for vehicle detection. For object detection, Bochkovskiy et al. (2020) [49] proposed YOLO version 4 (YOLOv4) whose architecture is composed of three parts: Backbone, Neck, and Head. Ryu and Chung (2021) [50] used YOLOv4 to deal with data imbalance and the occluded object problem for vehicle detection. The most recent YOLOv5 seems to have better performance [51], but it lacks rigorous evidence from published papers. Since YOLOv5 was launched recently, there are relatively few available resources, and if it has bugs, it is thus necessary to wait for the updated version to be released before continuing to test, so this study chose the relatively stable previous version to facilitate the research. As stated above, the efficiency of the single-stage is better than the two-stage method; therefore, this paper will employ the YOLOv4 method, for studying and analyzing the front-vehicle detection.
3. Research Methodology
Computer vision and image processing have many techniques, such as recognition and detection. This paper only focused on front-vehicle detection and the concept of remote sensing for fleet management. To integrate remote sensing, machine learning, and deep learning for large vehicle fleet management, the application of image technology for vehicle detection can be enhanced by AI algorithms. Commercial vehicles have more duties. Especially at different times of day and on varying road types, car accidents happen when drivers do not have rapid response and/or maintain sufficient distance to front vehicles. We initially had misjudgment detection problems of large vehicles in practice. Based on the review of several existing methods in [1,2,18], we extended the video and image detection idea and used a single camera-based system that is preferred for large vehicle fleet management. The front camera installed in the large vehicle used a NIR LED lighting system. The detection technique can be affected by different road conditions for delivery. This paper uses the NIR LED lighting system in a DVR image system. The abnormal driving came from car kits on trucks, whereby we can send the images to the main host computer, and then recheck whether it is a false judgment, instead of manual judgment. The single camera-based system is through the lens and infrared light source. The large vehicle driver often delivers freight at night; thus, an NIR camera is a better choice for analyzing detection.
The angle and lights of a large vehicle can affect detection, and most companies do not have much money to pay for the front camera to provide better image quality. In the market, lower-tier DVR are selected under limited budgets. The installed lower-tier DVR performed the inaccuracy detection since the misjudgment happened from car kit. We assumed the DVR camera angle and position were fixed. For the DVR videos fixed on the front of the vehicle, the collected large vehicle data can be considered of use for front-vehicle detection.
When the hardware equipment cannot be changed, the software algorithm can improve detection ability. The vehicle detection technique was based on traditional Haar features extended to vehicle detection. For fleet management, the existing Haar features were used in the car kits for small-scale detection to determine whether there are vehicles and the approximate position of the vehicles within the images. Haar function is trained from a lot of images both positive and negative. Based on the training, it can be used to detect vehicles. They are huge individual .xml files with a lot of feature sets. Haar features used the subtracting concept for black and white regions. In other words, Haar features are pushed into feature templates that have white and black rectangles. The feature value of the template is the sum of white minus black rectangle pixels. Therefore, Haar features are a detection algorithm used to identify objects in an image or video and based on the concepts of features. The traditional bounding box regression uses translation and scale zooming to approximate the ground truth. If the size is too small or the coordinates of the bounding box are not on the right points, the features extracted in the following feature extraction steps will be inaccurate, and the recognition accuracy will decline, resulting in false detection.
To quickly determine the front vehicles, the Haar detection classifier is used to detect the vehicle ahead [31], calculate the sum of pixels of each detection window, then take their difference, and use the difference as the feature for target classification. OpenCV is a popular library in image detection. This paper used python programming and imported the OpenCV library, which has CascadeClassifier with Cars.xml and uses detectMultiScale for front-vehicle detection [52,53]. The traditional Haar rectangle features, which are held by shallow learning can be computed using the integral image.
This paper adopted Darknet from YOLOv4 [54] using deep learning for the study. This paper used CSPDarknet53 with Mish activation for Backbone to feature extraction, PANet plus SPP for Neck, V100 frame per second (FPS) (62@608×608, 83@512×512), and BFLOPs (128.5@608×608). YOLOv4 is an efficient single-stage object detection algorithm and uses one-stage to process many pictures. This study used the collected large vehicle data to test the front-vehicle detection. YOLOv4 consists of a backbone, neck, and head network. For file framework, there are seven documents that are used to deal with front-vehicle detection. Figure 1 shows the detailed document description for large vehicle fleet management. The Videos document is to store videos for testing, and Positive and Negative documents are to store images. Xml is for running Haar features. Three other documents, including Darknet, YOLOv4, and YOLOv4_largevehicle, are used to implement YOLOv4.
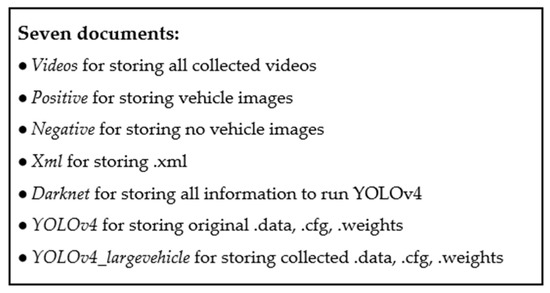
Figure 1.
Data file description.
Shen and Hsu proposed that eight points be used in the process of the projection transformation [18]. Based on this idea, this paper added a fence method that can be used for determination after the YOLOv4 procedure. Fence is used to improve the original Yolov4 method to enhance the accuracy of front-vehicle detection; therefore, this paper adopted the concept of fence with YOLOv4 using the collected large vehicle data for enhancing detection. YOLOv4 is a multi-level feature learning approach. This paper will improve Haar features and the original YOLOv4 approach. This study proposed YOLOv4 with the fence method to improve detection accuracy. Based on Figure 1, this study used four methods for testing the detections. Figure 2 is the flowchart of the improving process, and the detailed four steps are described as follows.
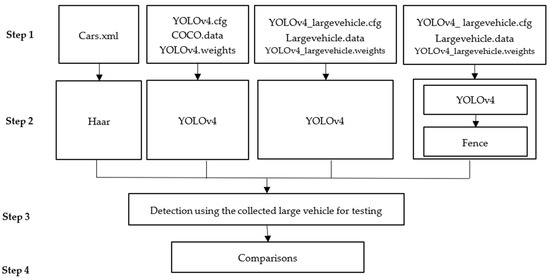
Figure 2.
Flowchart for improving detection accuracy.
Step 1: There are three combinations for four procedures. The Haar features used the trained Cars.xml from Xml document, YOLOv4 had trained cfg, data, weights files in the YOLOv4 document. We had the collected trained cfg, data, weights files in YOLOv4_largevehicle document. Haar features used Cars.xml for front-vehicle detection. The trained original YOLOv4 weights used the MS COCO dataset [54]. The ranges of width and height are determined. This study used the collected large vehicle image data based on the YOLOv4 method for training.
Step 2: There are three YOLOv4-based methods named YOLOv4(I), YOLOv4(II), and YOLOv4(III). YOLOv4(I) is the original YOLOv4. YOLOv4(II) and YOLOv4(III) use the collected large vehicle image data for training. Based on the concept of [2], the fence method can be used to improve the detection. Hence, the proposed YOLOv4(III) denotes YOLOv4 (II) supplemented with the fence method described in Figure 3. The fence is trapezoidal. Since the original car kit equipment cannot be changed, the fence method can be used as a judgment to enhance the detection of whether there is a front vehicle and reduce the misjudgment.
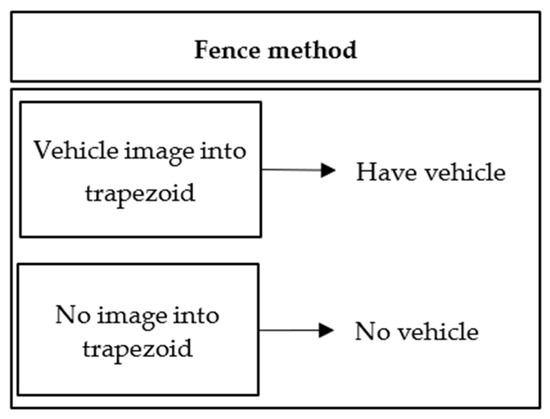
Figure 3.
Fence method process.
Step 3: This step uses testing data from the collected large vehicle videos for testing front-vehicle detection. Positive denotes four methods that detect the front vehicle, and negative denotes four methods that do not detect the front vehicle. Those positive and negative images are produced using the OpenCV package.
Step 4: A comparison of four methods was made to provide guidance for helping large vehicle drivers.
Based on the concept of spatial data structure and polygons [2], the face method is based on the box size determined by , and . The x-coordinate is random sampling from [, ] and y-coordinate is random sampling from [, ]. The point (,) of the vehicle falls within the fence. The rectangle area can be expressed as:
where , , and denote four coordinates. Through setting the value of and , the trapezoid area was determined for large vehicles. The large vehicles take long-term trips from daytime to nighttime. In the night environment, the vehicle characteristics are not obvious due to insufficient light. There is different detection between highway and normal road. The fence method can improve the above situations used as the monitor for the road environment.
Positive denotes the large truck has a front vehicle, and negative denotes none. A confusion matrix is made of predicted outcome and actual conditions including true positive (TP), true negative (TN), false positive (FP), and false negative (FN) [55]. TP denotes the front vehicle too close and detected. TN means that front vehicle is no vehicle and not detected. FP indicates that the front vehicle is no vehicle but detected. FN denotes that the front vehicle is too close but not detected.
Precision has positive and negative formulas and recall also includes positive and negative formulas. The F1 score can be computed by precision and recall. This study also does the comparison of detection time using the FPS formula [56] to evaluate the detection speed. The equations used in this study are listed as follows.
In summary, driving on the roads for long periods can lead to driving attention reduction and the drivers cannot carefully control the vehicle. The proposed front-vehicle detection method can reduce the need for sudden turning, sharp braking, and arbitrarily accelerating/decelerating to reduce carbon emission. Machine and deep learning are expert systems that are knowledge-based intelligent systems. Moreover, there is a difference between indoor simulation and outdoor vehicle driving environments. This study used videos and images from actual outdoor vehicle driving environments; thus, this experiment will be closer to reality. The large vehicles equipped with a front camera used feature extraction to distinguish vehicle and non-vehicle. Ultimately, we proposed a new method to enhance the detection for pursuing low-carbon fleet management and to reduce the waste of social resources.
4. Results
In this section, we demonstrated four approaches for comparisons, including Haar features, YOLOv4(I), YOLOv4(II), and YOLOv4(III). This study used a front-camera device, which is based on 1280(H) × 960(V) with NIR LED lighting installed in front of large vehicles to collect the front-vehicle videos from the car kits. The traditional Haar feature method used the trained Car.xml, and the original YOLOv4 used the test-dev2017 dataset from MS COCO website. In Figure 4, the collected large vehicle data included 1994 images that choose 86.26% for training and 13.74% for validation. The type of front images included a highway truck, highway car, normal truck, normal car, and no-vehicle images, which were available data we collected. Using Haar features, the scopes of x, y, w, and h were adjusted to avoid false detection, and the labeling was used for YOLOv4 before the training process. YOLOv4 has a useful tool, LabelImg [57], to manually annotate the images. The number videos and images continually increases, but we generally did not redo the training model since the training takes time. We proposed that YOLOv4 with the fence method can be used to detect the front vehicle under limited videos or images.
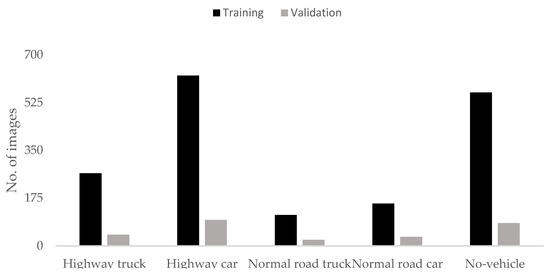
Figure 4.
The collected large vehicle dataset divided into the training and validation.
The placement and angle of the front camera are the main factors affecting the detections since the view of the large vehicles is different to that of the smaller cars. It is difficult to detect vehicles between front-camera angle and light conditions. Thus, this paper added the fence method to improve detection. Figure 5 shows the fence method that can obtain the trapezoid area to detect the front vehicle using Equations (1) and (2). In addition to its own bounding box, we added a trapezoid fence for enhancing detection using the case study of a large truck.
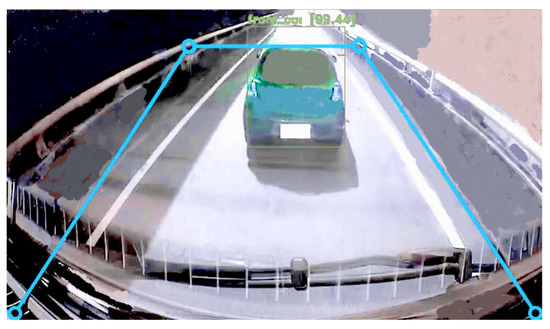
Figure 5.
An example of the trapezoid area.
For the training process, we used a desktop PC running Microsoft Windows 10, with an Intel Core i7-11800H CPU at 2.30 GHZ, 16 GB of RAM, and NVIDIA GeForce RTX 3070 Laptop with a high-performance graphic processing unit (GPU). This study used Python programming language for development. The object detection usually adopts mean average precision (mAP) for measuring the accuracy. The loss function from YOLOv4 definition is the sum of complete intersection over union, confidence, and class losses [54]. Figure 6 showed mAP% is 87.7% in the loss chart for the collected data file (YOLOv4_largevehicle.cfg) and the average loss is 0.1823 using max 2000 batches.
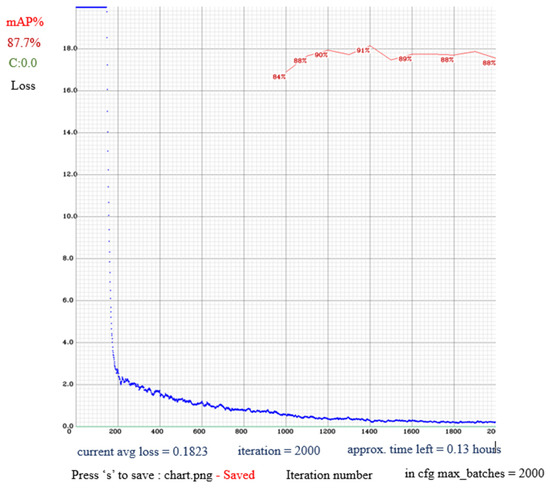
Figure 6.
mAP% in the loss chart.
We sampled 10 large vehicles, which had 191 videos for sample testing from the fleet management system, and these videos were used for front-vehicle detection. Table 1 shows the driving video data that included four different time types on both highway and normal roads.

Table 1.
The collected 191 videos were divided into time and road types for testing.
The collected 191 videos were from large trucks, as shown in Figure 7. The negative (no front vehicle or NoVehicle) data are more than positive (have front vehicle or HaveVehicle) data, especially on the highways. Generally, there are many traffic lights on normal roads. The videos of large trucks have a lot of chances to have front vehicles. Since the highway samples had 119 non-front vehicles, their s were zeros. The working time of large trucks is different to that of ordinary vehicles, and most of the driving time is concentrated in the morning. Early morning had fewer front vehicles. Unlike ordinary vehicles, a very serious accident will result from being hit by a large vehicle. Drivers usually stay away from large vehicles. Fewer vehicles drive in front of large vehicles, especially on the highway. The drivers seem to stay away from large vehicles to keep a greater distance for safety. We observed detailed road and time factors for discussion using a classification method based on supervised learning. This study can use a decision tree to obtain the relation of front vehicles between road type and time. Decision tree is a popular tool from machine learning for classification. This study used R programming [58] and employed Recursive Partitioning and Regression Trees (rpart) [59] from the Classification and Regression Trees (CART) algorithm, and the toolkit partykit [60] can be used for displaying CART tree visualization. For verifying the study, Figure 8 shows the result from 191 videos using the rpart and partykit packages, of which the highway and early morning on normal roads had high non-vehicle rates.
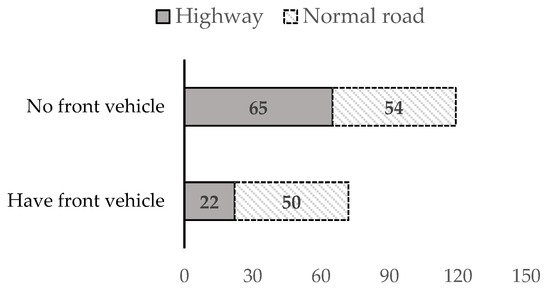
Figure 7.
Numbers of videos.
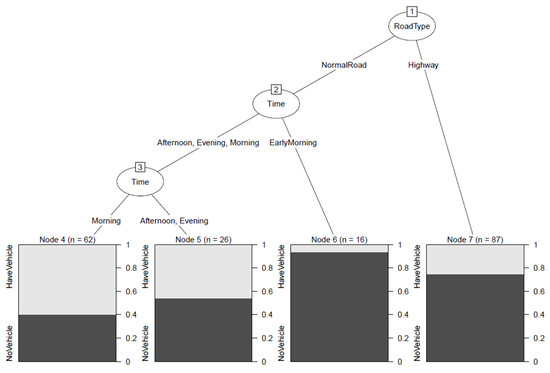
Figure 8.
Decision tree from 191 videos.
This paper also adopted random forests, which is a classifier that combines multiple decision trees to make predictions, and the result was obtained using randomForest package [61]. Out-of-bag (OOB) score is used to validate the model. In Figure 9, the OOB error rate is 0.3141. Based on Figure 7, HaveVehicle had higher errors since this study did not have much collected positive data. Therefore, the result showed that random forests obtained large errors under limited data. Since decision tree and random forests belong to shallow learning, this study will use deep learning to handle complex classification and detection problems.
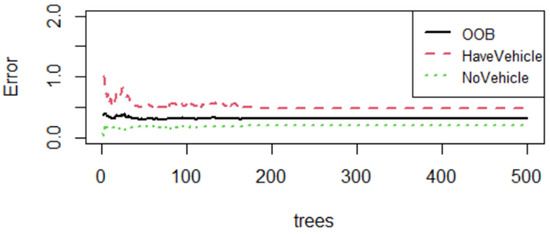
Figure 9.
Error rates using random forest from 191 videos.
This paper used three YOLOv4-based models, called YOLOv4(I), YOLOv4(II), and YOLOv4(III). There are 191 videos in total, and this study chose 8 videos of accuracy rates that were less than 70% based on Haar features (Haar) for comparing three YOLOv4 improvements. For accuracy rate, Table 2 shows that the YOLOv4 supplemented with the fence (YOLOv4(III)) method had the highest accuracy rates. YOLOv4(III) with the fence method performed better on average than YOLOv4(II). Table 2 shows that YOLOv4(I) in Run 7 was not better than Haar, and YOLOv4(II) in Run 3 was not better than YOLOv4(I). Based on Table 2, this study also considered that the results of false omission rate were for comparisons. For false omission rate, Table 3 shows that the YOLOv4(II) and YOLOv4(III) methods had lower false omission rates than Haar and YOLOv4(I). Therefore, our proposed YOLOv4(III) had higher average accuracy rates and lower false omission rates. Based on the Table 2 and Table 3 results, this study only focused on the proposed YOLOv4(III) for the discussion and compared with Haar; thus, Table 4 summarizes the average accuracy of Haar and YOLOv4(III) using the 191 videos. YOLOv4(III) had higher average accuracy than Haar, and the standard deviation (Stdev) of YOLOv4(III) was slightly lower than that of Haar.
Table 2.
Accuracy rate.
Table 3.
False omission rate.
Table 4.
Summary of average accuracy using 191 videos.
Based on the equations from [55], the performance of precision, recall, and F1 was shown in Table 5 and Figure 9. Some s and s are zeros; thus, some results denoted the errors when the number was divided by zero. There are 119 s at zero, and the precision and recall of positive are zero. For the other 72 videos, we obtained the precision and recall values of Haar and YOLOv4(III). We listed the 13 of positive precision, recall and F1 for comparison in Table 5. YOLOv4(III) had larger precision, recall, and F1. For negative cases, YOLOv4(III) performance of precision and F1 with 191 videos were better as shown in Figure 10.
Table 5.
Precision, recall, and F1 for positive performance.
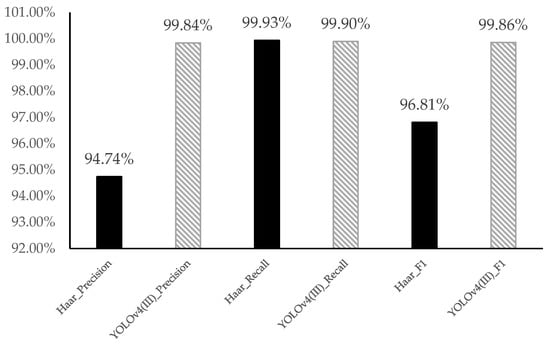
Figure 10.
Negative performance for the average of precision, recall, and F1 with 191 videos.
For the output of FPS equation [56], the elapsed time of YOLOv4 was longest. The result showed one run of frame number and elapsed time from 191 videos and summarized the average values in Table 6. The Haar technique’s frame number was slightly greater than YOLOv4(III), and its elapsed time was shorter. To observe the elapsed time in this experiment, Haar generally takes less time.
Table 6.
Average of frame number and elapsed time with one run.
Comparing Haar with YOLOv4(III) for the FPS in Table 7, we expanded the test runs; therefore, this study added other five runs, . There are 191 videos for each run. For example, the average of Best FPS denotes
Table 7.
Adding 5 other runs for FPS.
Table 7 shows that Haar had higher FPS and standard deviation (Stdev). Two methods of Stdev had large differences. Most FPSs of YOLOv4(III) are less than that of Haar. Table 7 shows that the FPS results of Haar are unstable, whereas the YOLOv4(III) has stable FPS performance.
According to the average cases of Haar and YOLOv4(III), this study tested the two samples for variances [62], as shown in Table 8. We assumed the null hypothesis was in effect: variances of two populations are equal. Table 8 shows that the p-value of the two samples for variances test was 0.000, which is statistically significant at a p < 0.05 level. Therefore, the variances were unequal.
Table 8.
Two samples for variances using their average cases.
Consequently, the p-value of the independent t test was 0.000, which is statistically significant at a p < 0.05 level, as shown in Table 9. Therefore, the proposed YOLOv4(III) can have the small standard deviations of FPS and it is more stable.
Table 9.
Independent sample test using 191 videos.
Since Haar caused some errors, this study could make additional improvements. We proposed a detection model based on YOLOv4 using the fence method, and the experimental results showed that our proposed approach can significantly improve performance.
5. Discussion
This paper focused on the front-vehicle detection study of accuracy and stable FPS using confusion matrix and statistical analysis. The proposed YOLOv4(III) can improve the detection to reduce misjudgment using a large vehicle fleet case. Based on the description in Section 2, the efficiency of the single-stage is better than the two-stage method. Overall, the elapsed time of YOLOv4(III) was not the best in the study. Therefore, YOLOv4(III) can be improved to make better performance.
Some limitations of this paper describe as follows. The limited adjustments can be from the car kits, such as parameters and iteration settings. Although OpenCV and Darknet are open sources, it is not easy to integrate software and car kits, and some compatibility issues regularly needed to be overcome. In addition, camera angle is an important factor that can affect detection, but the car kits are installed by different operators. For the collected data, this study ignored the angle problems.
Moreover, this paper only considered highways and normal roads. Real traffic is more complicated. For example, an intersection is a big challenge and can affect YOLOv4(III) detection performance. Sometimes adding various video or image data for training the model is not necessarily proportional to obtaining better detection results and the process can take time. In this study, the proposed YOLOv4(III) is able to use limited sources to enhance detection performance.
6. Conclusions
Large vehicle driving is a long-time working task. For analyzing collected data, most front vehicles stayed away from the large vehicles by keeping a greater distance. Moreover, providing an improved front-vehicle detection approach can reduce need for sudden turning, sharp braking, collisions, and the wasting of social resources in large vehicle fleets. This paper improves the front-vehicle detection performance using large vehicle cases. The proposed YOLOv4(III) uses collected large vehicle data with a fence method based on the concept of spatial polygons, thereby enhancing the front vehicle detection, and reducing incorrect detections for higher detection accuracy. Thus, on the technical side, this study effectively reduced misjudgments. On the application side, this study can provide the drivers with more reaction time. Although the FPS of YOLOv4(III) took more time than traditional Haar features, the resulting benefits were high. The proposed YOLOv4(III) had higher accuracy, precision, recall, and F1 score than previous methods. The performance of YOLOv4(III) was better than the three other methods to enhance the front-vehicle detection. Using statistical analysis, Haar features had the higher FPS, but the YOLOv4(III) method had stable FPS performance. The proposed YOLOv4(III) had competitive performance metrics. Finally, this study provides a usable solution for enhancing front-vehicle detection in practice and reducing large vehicle carbon emissions.
For future studies, traffic signs can affect driving safety; thus, sign detection can be considered using YOLO detection. Front-vehicle and sign detections can be combined in large vehicle applications to enhance the YOLOv4(III) approach to handle big video and image data in fleet management systems and give alerts to drivers to maintain distance and appropriate speed, thereby reducing fuel consumption and invisible carbon emissions. Kasper-Eulaers et al. [63] applied YOLOv5 to handle static heavy goods vehicles; thus, this future paper will use YOLOv5 for handling more moving vehicle detections. More mathematical methods will be used to evaluate and measure performance.
Author Contributions
Conceptualization, C.-Y.M. and C.-F.C.; methodology, P.K.; software, S.-C.C.; validation, P.K., C.-F.C. and S.-C.C.; formal analysis, P.K.; investigation, C.-Y.M.; data curation, C.-Y.M.; writing—original draft preparation, C.-F.C.; writing—review and editing, P.K.; visualization, P.K. and S.-C.C.; supervision, C.-Y.M. All authors have read and agreed to the published version of the manuscript.
Funding
This research received no external funding. The APC was funded by SkyEyes GPS Technology Co., Ltd.
Institutional Review Board Statement
Not applicable.
Informed Consent Statement
Not applicable.
Data Availability Statement
Not applicable.
Acknowledgments
We thank Ting-An Lin for optimizing the coding and Jay Reed Poggenpohl for proofreading this paper.
Conflicts of Interest
The authors declare no conflict of interest.
References
- Naqvi, R.A.; Arsalan, M.; Rehman, A.; Rehman, A.U.; Loh, W.-K.; Paul, A. Deep Learning-Based Drivers Emotion Classification System in Time Series Data for Remote Applications. Remote Sens. 2020, 12, 587. [Google Scholar] [CrossRef] [Green Version]
- Mu, C.-Y.; Chou, T.-Y.; Hoang, T.V.; Kung, P.; Fang, Y.-M.; Chen, M.-H.; Yeh, M.-L. Development of Multilayer-Based Map Matching to Enhance Performance in Large Truck Fleet Dispatching. ISPRS Int. J. Geo-Inf. 2021, 10, 79. [Google Scholar] [CrossRef]
- Zhao, Z.M.; Chou, T.Y.; Yan, T.L. Spatial Information Technique Theorem and Its Application-Technical Application, 1st ed.; Scholars Publisher: Taipei, Taiwan, 2015. [Google Scholar]
- Asghari, M.; Mirzapour Al-e-hashem, S.M.J. Green Vehicle Routing Problem: A State-of-the-Art Review. Int. J. Prod. Econ. 2021, 231, 107899. [Google Scholar] [CrossRef]
- Avtar, R.; Komolafe, A.A.; Kouser, A.; Singh, D.; Yunus, A.P.; Dou, J.; Kumar, P.; Gupta, R.D.; Johnson, B.A.; Thu Minh, H.V.; et al. Assessing Sustainable Development Prospects Through Remote Sensing: A Review. Remote Sens. Appl. Soc. Environ. 2020, 20, 100402. [Google Scholar] [CrossRef]
- Liu, J.G.; Mason, P.J. Image Processing and GIS for Remote Sensing: Techniques and Applications, 2nd ed.; Wiley-Blackwell: Hoboken, NJ, USA, 2016. [Google Scholar]
- Crainic, T.G.; Ricciardi, N.; Storchi, G. Models for Evaluating and Planning City Logistics Systems. Transp. Sci. 2009, 43, 432–454. [Google Scholar] [CrossRef] [Green Version]
- Srivatsa Srinivas, S.; Gajanand, M.S. Vehicle Routing Problem and Driver Behavior: A Review and Framework for Analysis. Transp. Rev. 2017, 37, 590–611. [Google Scholar] [CrossRef]
- National Development Council (Open Data Platform). Available online: https://data.gov.tw/dataset/33217 (accessed on 10 March 2022).
- Yang, Z.; Pun-Cheng, L.S.C. Vehicle Detection in Intelligent Transportation Systems and its Applications under Varying Environments: A review. Image Vis. Comput. 2018, 69, 143–154. [Google Scholar] [CrossRef]
- Kim, G.; Cho, J.S. Vision-based vehicle detection and inter-vehicle distance estimation. In Proceedings of the 2012 12th International Conference on Control, Automation and Systems, Jeju, Korea, 17–21 October 2012; pp. 625–629. [Google Scholar]
- Sivaraman, S.; Trivedi, M.M. Vehicle detection by independent parts for urban driver assistance. IEEE Trans. Intell. Transp. Syst. 2013, 14, 1597–1608. [Google Scholar] [CrossRef]
- Nguyen, V.D.; Van Nguyen, H.; Tran, D.T.; Lee, S.J.; Jeon, J.W. Learning framework for robust obstacle detection, recognition, and tracking. IEEE Trans. Intell. Transp. Syst. 2016, 18, 1633–1646. [Google Scholar] [CrossRef]
- Bautista, C.M.; Dy, C.A.; Mañalac, M.I.; Orbe, R.A.; Cordel, M. Convolutional neural network for vehicle detection in low resolution traffic videos. In Proceedings of the 2016 IEEE Region 10 Symposium (TENSYMP), Bali, Indonesia, 9–11 May 2016; pp. 277–281. [Google Scholar]
- Kuang, H.; Chen, L.; Gu, F.; Chen, J.; Chan, L.; Yan, H. Combining region-of-interest extraction and image enhancement for nighttime vehicle detection. IEEE Intell. Syst. 2016, 31, 57–65. [Google Scholar] [CrossRef]
- Kortli, Y.; Marzougui, M.; Atri, M. High-reliability vehicle detection and lane collision warning system. Int. J. Wirel. Microw. Technol. 2018, 8, 1–14. [Google Scholar] [CrossRef]
- Yang, B.; Zhang, S.; Tian, Y.; Li, B. Front-Vehicle Detection in Video Images Based on Temporal and Spatial Characteristics. Sensors 2019, 19, 1728. [Google Scholar] [CrossRef] [Green Version]
- Shen, C.-H.; Hsu, T.-J. Research on Vehicle Trajectory Prediction and Warning Based on Mixed Neural Networks. Appl. Sci. 2021, 11, 7. [Google Scholar] [CrossRef]
- Han, S.J.; Han, Y.J.; Hahn, H.S. Vehicle Detection Method using Harr-like Feature on Real Time System, World Academy of Science. Eng. Technol. 2009, 59, 455–459. [Google Scholar]
- Sivaraman, S.; Trivedi, M.M. A General Active-Learning Framework for On-Road Vehicle Recognition and Tracking. IEEE Trans. Intell. Transp. Syst. 2010, 11, 267–276. [Google Scholar] [CrossRef] [Green Version]
- Hota, R.N.; Jonna, K.; Krishna, P.R. On-road vehicle detection by cascaded classifiers. In Proceedings of the Third Annual ACM Bangalore Conference on—COMPUTE ‘10, Bangalore, India, 22–23 January 2010. [Google Scholar]
- Sivaraman, S.; Trivedi, M.M. Active learning for on-road vehicle detection: A comparative study. Mach. Vis. Appl. 2011, 25, 599–611. [Google Scholar] [CrossRef]
- Kim, G.; Cho, J.-S. Vision-based vehicle detection and inter-vehicle distance estimation for driver alarm system. Opt. Rev. 2012, 19, 388–393. [Google Scholar] [CrossRef]
- Park, K.-Y.; Hwang, S.-Y. An improved Haar-like feature for efficient object detection. Pattern Recognit. Lett. 2014, 42, 148–153. [Google Scholar] [CrossRef]
- Rezaei, M.; Terauchi, M.; Klette, R. Robust Vehicle Detection and Distance Estimation Under Challenging Lighting Conditions. IEEE Trans. Intell. Transp. Syst. 2015, 16, 2723–2743. [Google Scholar] [CrossRef]
- Virumandi, P.; Adithya, R.; Ponnambalam, P.; Athanesious, J.; Vaidehi, V. Detection of vehicle in pedestrian pathway using defined range approach. In Proceedings of the 2015 Seventh International Conference on Advanced Computing (ICoAC), Chennai, India, 15–17 December 2015. [Google Scholar]
- Mohamed, A.; Issam, A.; Mohamed, B.; Abdellatif, B. Real-time Detection of Vehicles Using the Haar-like Features and Artificial Neuron Networks. Procedia Comput. Sci. 2015, 73, 24–31. [Google Scholar] [CrossRef] [Green Version]
- Naba, A.; Pratama, B.M.; Nadhir, A.; Harsono, H. Haar-like feature based real-time neuro car detection system. In Proceedings of the 2016 International Seminar on Sensors, Instrumentation, Measurement and Metrology (ISSIMM), Malang, Indonesia, 10–11 August 2016. [Google Scholar]
- Lu, K.; Li, J.; Zhou, L.; Hu, X.; An, X.; He, H. Generalized Haar Filter-Based Object Detection for Car Sharing Services. IEEE Trans. Autom. Sci. Eng. 2018, 15, 1448–1458. [Google Scholar] [CrossRef]
- Zhou, W.; Chen, Y.; Liang, S. Sparse Haar-Like Feature and Image Similarity-Based Detection Algorithm for Circular Hole of Engine Cylinder Head. Appl. Sci. 2018, 8, 2006. [Google Scholar] [CrossRef] [Green Version]
- Phuc, L.T.H.; Jeon, H.; Truong, N.T.N.; Hak, J.J. Applying the Haar-cascade Algorithm for Detecting Safety Equipment in Safety Management Systems for Multiple Working Environments. Electronics 2019, 8, 1079. [Google Scholar] [CrossRef] [Green Version]
- Qiu, L.; Zhang, D.; Tian, Y.; Al-Nabhan, N. Deep Learning-Based Algorithm for Vehicle Detection in Intelligent Transportation Systems. J. Supercomput. 2021, 77, 11083–11098. [Google Scholar] [CrossRef]
- Honarparvar, S.; Saeedi, S.; Liang, S.; Squires, J. Design and Development of an Internet of Smart Cameras Solution for Complex Event Detection in COVID-19 Risk Behaviour Recognition. ISPRS Int. J. Geo-Inf. 2021, 10, 81. [Google Scholar] [CrossRef]
- Zhang, S.; Wu, R.; Xu, K.; Wang, J.; Sun, W. R-CNN-Based Ship Detection from High Resolution Remote Sensing Imagery. Remote Sens. 2019, 11, 631. [Google Scholar] [CrossRef] [Green Version]
- Carvalho, O.L.F.D.; de Carvalho Júnior, O.A.; Albuquerque, A.O.D.; Bem, P.P.D.; Silva, C.R.; Ferreira, P.H.G.; Moura, R.D.S.D.; Gomes, R.A.T.; Guimarães, R.F.; Borges, D.L. Instance Segmentation for Large, Multi-Channel Remote Sensing Imagery Using Mask-RCNN and a Mosaicking Approach. Remote Sens. 2021, 13, 39. [Google Scholar] [CrossRef]
- Wu, Q.; Feng, D.; Cao, C.; Zeng, X.; Feng, Z.; Wu, J.; Huang, Z. Improved Mask R-CNN for Aircraft Detection in Remote Sensing Images. Sensors 2021, 21, 2618. [Google Scholar] [CrossRef]
- Ren, C.; Jung, H.; Lee, S.; Jeong, D. Coastal Waste Detection Based on Deep Convolutional Neural Networks. Sensors 2021, 21, 7269. [Google Scholar] [CrossRef]
- Ren, S.; He, K.; Girshick, R.B.; Sun, J. Faster R-CNN: Towards Real-Time Object Detection with Region Proposal Networks. IEEE Trans. Pattern Anal. Mach. Intell. 2017, 39, 1137–1149. [Google Scholar] [CrossRef] [Green Version]
- Chen, L.; Ye, F.; Ruan, Y.; Fan, H.; Chen, Q. An Algorithm for Highway Vehicle Detection Based on Convolutional Neural Network. J. Image Video Proc. 2018, 2018, 109. [Google Scholar] [CrossRef] [Green Version]
- Xing, Y.; Lv, C.; Wang, H.; Cao, D.; Velenis, E.; Wang, F.-Y. Driver Activity Recognition for Intelligent Vehicles: A Deep Learning Approach. IEEE Trans. Veh. Technol. 2019, 68, 5379–5390. [Google Scholar] [CrossRef] [Green Version]
- Alganci, U.; Soydas, M.; Sertel, E. Comparative Research on Deep Learning Approaches for Airplane Detection from Very High-Resolution Satellite Images. Remote Sens. 2020, 12, 458. [Google Scholar] [CrossRef] [Green Version]
- Magalhães, S.A.; Castro, L.; Moreira, G.; dos Santos, F.N.; Cunha, M.; Dias, J.; Moreira, A.P. Evaluating the Single-Shot MultiBox Detector and YOLO Deep Learning Models for the Detection of Tomatoes in a Greenhouse. Sensors 2021, 21, 3569. [Google Scholar] [CrossRef] [PubMed]
- Yu, J.; Choi, H. YOLO MDE: Object Detection with Monocular Depth Estimation. Electronics 2022, 11, 76. [Google Scholar] [CrossRef]
- Vajgl, M.; Hurtik, P.; Nejezchleba, T. Dist-YOLO: Fast Object Detection with Distance Estimation. Appl. Sci. 2022, 12, 1354. [Google Scholar] [CrossRef]
- Redmon, J.; Divvala, S.; Girshick, R.; Farhadi, A. You only look once: Unified, real-time object detection. In Proceedings of the IEEE Conference on Computer Vision and Pattern Recognition, Las Vegas, NV, USA, 27–30 June 2016; pp. 779–788. [Google Scholar]
- Redmon, J.; Farhadi, A. YOLO9000: Better, faster, stronger. arXiv 2016, arXiv:1612.08242394. [Google Scholar]
- Redmon, J.; Farhadi, A. Yolov3: An incremental improvement. arXiv 2018, arXiv:1804.02767. [Google Scholar]
- Guerrieri, M.; Parla, G. Deep Learning and YOLOv3 Systems for Automatic Traffic Data Measurement by Moving Car Observer Technique. Infrastructures 2021, 6, 134. [Google Scholar] [CrossRef]
- Bochkovskiy, A.; Wang, C.-Y.; Liao, H.Y.M. Yolov4: Optimal Speed and Accuracy of Object Detection. arXiv 2020, arXiv:2004.10934. [Google Scholar]
- Ryu, S.-E.; Chung, K.-Y. Detection Model of Occluded Object Based on YOLO Using Hard-Example Mining and Augmentation Policy Optimization. Appl. Sci. 2021, 11, 7093. [Google Scholar] [CrossRef]
- YOLOv5 Documentation. Available online: https://docs.ultralytics.com/ (accessed on 10 March 2022).
- Cars.xml. Available online: https://gist.github.com/199995/37e1e0af2bf8965e8058a9dfa3285bc6 (accessed on 10 March 2022).
- OpenCV. Available online: https://docs.opencv.org/3.4/d1/de5/classcv_1_1CascadeClassifier.html (accessed on 10 March 2022).
- Darknet. Available online: https://github.com/AlexeyAB/darknet (accessed on 10 March 2022).
- Deng, X.; Liu, Q.; Deng, Y.; Mahadevan, S. An improved method to construct basic probability assignment based on the confusion matrix for classification problem. Inf. Sci. 2016, 340, 250–261. [Google Scholar] [CrossRef]
- Etoh, T.G.; Son, D.V.T.; Yamada, T.; Charbon, E. Toward One Giga Frames per Second—Evolution of in Situ Storage Image Sensors. Sensors 2013, 13, 4640–4658. [Google Scholar] [CrossRef] [PubMed] [Green Version]
- Tzutalin/labelImg. Available online: https://github.com/tzutalin/labelImg (accessed on 10 March 2022).
- R. Available online: https://www.r-project.org/ (accessed on 10 March 2022).
- rpart. Available online: https://cran.r-project.org/web/packages/rpart/rpart.pdf (accessed on 10 March 2022).
- partykit. Available online: https://cran.r-project.org/web/packages/partykit/partykit.pdf (accessed on 10 March 2022).
- randomForest. Available online: https://cran.r-project.org/web/packages/randomForest/randomForest.pdf (accessed on 10 March 2022).
- Ott, L.; Longnecker, M. An Introduction to Statistical Methods and Data Analysis, 7th ed.; Cengage Learning: Boston, MA, USA, 2015. [Google Scholar]
- Kasper-Eulaers, M.; Hahn, N.; Berger, S.; Sebulonsen, T.; Myrland, Ø.; Kummervold, P.E. Short Communication: Detecting Heavy Goods Vehicles in Rest Areas in Winter Conditions Using YOLOv5. Algorithms 2021, 14, 114. [Google Scholar] [CrossRef]
Publisher’s Note: MDPI stays neutral with regard to jurisdictional claims in published maps and institutional affiliations. |
© 2022 by the authors. Licensee MDPI, Basel, Switzerland. This article is an open access article distributed under the terms and conditions of the Creative Commons Attribution (CC BY) license (https://creativecommons.org/licenses/by/4.0/).