Abstract
The 2021 Maduo earthquake occurred in the interior of the Bayan Har block of the Tibetan Plateau. We used space-born radar interferometry to study the coseismic deformation of this earthquake. Sentinel-1 InSAR observations along ascending and descending orbits provide the coseismic deformation. Pixel offset tracking method is used to complement InSAR observations near the rupture zone. The surface trace of the ruptured fault can be clearly mapped by InSAR observations. We constructed a three-dimensional coseismic slip model constrained by interferograms and pixel offset tracking in the form of a geodetic inverse problem. The coseismic slip model demonstrates that: (1) the Maduo earthquake was a left-lateral strike-slip event with moment magnitude of 7.4; (2) the peak slip is approximately 8 m and is located at a depth of 4 km; (3) a ‘shallow slip deficit’ of the Maduo earthquake is observed; (4) the ruptured faults are found to be dipping northward with a high dipping angle (80 degrees). This study has important implications on earthquake hazard evaluation of the Bayan Har block.
1. Introduction
On 21 May 2021 (UTC) a M7.3 earthquake stroke Maduo county, Qinghai province, China. From the information provided by U.S. Geological Survey, the Maduo earthquake occurred on a left-lateral strike-slip fault in the Bayan Har block of the Tibetan Plateau. The Tibetan Plateau forms as the India plate moves northward and collides with the Eurasian plate []. The Maduo earthquake occurred inside the Bayan Har block, which is a major tectonic block of the eastern Tibetan Plateau []. The Bayan Har block moves eastward relative to the fixed south China block []. At the northern boundary of the Bayan Har block lies the Kunlun fault [,,,] and at the southern boundary lies the Xianshuihe fault [,,,]. Both Kunlun fault and Xianshuihe fault are large left-lateral strike-slip faults. At the eastern boundary of the Bayan Har block lies the Longmenshan fault, which is a major thrust fault in the region [,] (Figure 1).
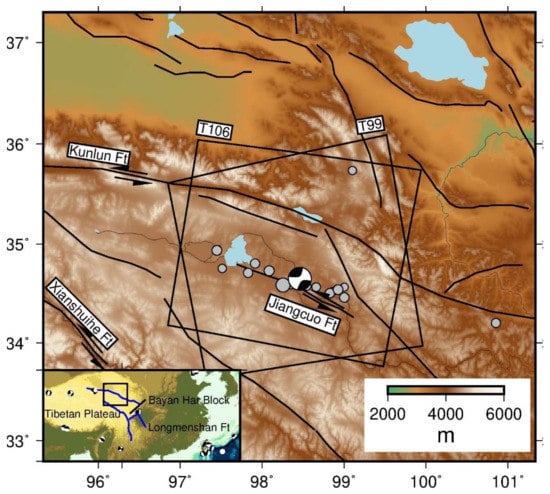
Figure 1.
Topographic map of the study region. Black bounding box marks the footprint of the Sentinel-1 InSAR imagery. Gray circles are significant aftershocks of the Maduo earthquake. Beach ball marks the focal mechanism of the Maduo earthquake. Black lines are active faults in this region. Sense of fault movement is marked by black arrows.
The focal mechanism of the Maduo earthquake suggests the coseismic slip involves both left-lateral strike-slip and normal slip []. According to the U. S. Geological Survey (USGS), the depth of this earthquake is located at 10 km in the upper crust. The aftershock distribution suggests that the Maduo earthquake ruptured in the northwest and southeast direction [] (Figure 1).
Interferometric synthetic aperture radar (InSAR) on board satellites can image the surface deformation from earthquakes []. The Maduo earthquake has been well imaged by multiple satellites, e.g., Sentinel-1 and ALOS-2 [,,]. Although the Maduo earthquake has been well studied by several research groups [,,], there are still some questions that remain to be addressed. Firstly, there is a discrepancy in the fault geometry from previous work. Reference [] prefers a vertically-dipping fault while [] favors a model with northward dipping fault. It is not clear which model is correct. Secondly, the details of the coseismic slip distribution differ between previous studies [,] though the general features of the coseismic slip models are similar. Reference [] found the peak coseismic slip is 6 m and [] found the peak slip to be 5 m. Thirdly, previous work has not compared the coseismic slip models with surface offset data from geological investigations. In this paper, we used the Sentinel-1 data from both the ascending and descending orbits to investigate in detail the fault geometry and the coseismic fault slip distribution of the Maduo earthquake and we compared our results with a recent geological field study.
2. Materials and Methods
The footprints of the Sentinel-1 satellite are shown in Figure 1. The Sentinel-1A and Sentinel-1B satellites are launched by European Space Agency (ESA) in 2014 and 2016 respectively. We used the Terrain Observation by Progressive Scans (TOPS) mode in the data processing []. The track number of the ascending data is 99 and the track number of the descending data is 106. The acquisition dates of both tracks are 20 May 2021 and 26 May 2021.
We processed the Sentinel-1 TOPS data with GMTSAR software [,]. The processing procedure follows the standard two-pass interferometry steps. The topographic phase is corrected using a Shuttle Radar Topography Mission (SRTM) Digital Elevation Model (DEM). The resolution of the DEM is 90 m. Phase unwrapping is carried out using SNAPHU software []. The interferograms are filtered using a Gaussian filter with 200 m wavelength. In addition, the phase is filtered using an adaptive filter [] to improve the signal-to-noise ratio of the result. The interferometric phase is decorrelated near the rupture zone due to both the intense ground shaking and the high coseismic strain release. Thus, we performed a cross-correlation analysis of the single look complex (SLC) images to derive pixel offset in the range direction. Azimuth pixel offset is also derived, but the noise level is high mainly due to the large pixel size along azimuth (~13 m) in TOPS data. We only used the range pixel offset results in this paper.
The interferometric phase of the Sentinel-1 data is shown in Figure 2. Figure 2 also shows the line-of-sight (LOS) displacement between 20 May 2021 and 26 May 2021, which is presumably the coseismic displacement caused by the Maduo earthquake. The image on 20 May 2021 is acquired by Sentinel-1A and the image on 26 May 2021 is acquired by Sentinel-1B. In Figure 2, the red color means that the ground is moving towards the satellite and the blue color means that the ground is moving away from the satellite. In Figure 2, it can be seen that the coseismic displacement in the LOS direction reaches approximately 1 m on either side of the rupture zone. The general trend of the LOS displacement agrees with the left-lateral strike-slip faulting. Figure 3 shows the range pixel offset result for both the ascending and descending orbits. The amplitude of the range pixel offset is from approximately −1 m to 1 m. The pixel offset performs better than radar interferometry in the decorrelation zone near the fault, making it complementary to the phase measurement (Figure 2 and Figure 3).
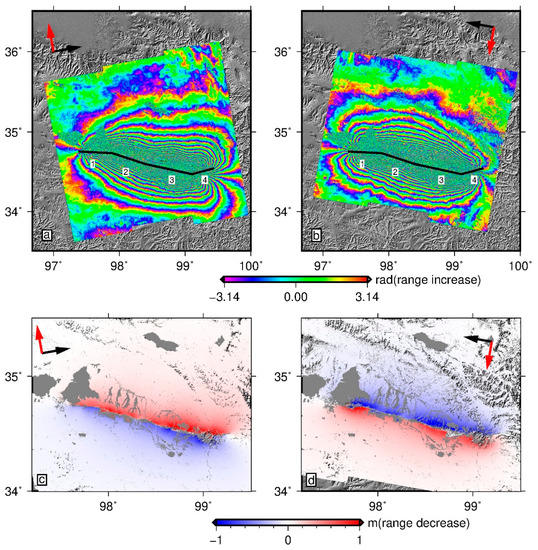
Figure 2.
(a,b) are coseismic interferograms of the Maduo earthquake along ascending and descending orbits, respectively. Black lines are the fault trace of the coseismic slip model. The fault model is indexed from 1 to 4. (c,d) are LOS displacement converted from the interferograms. Red arrows mark the flight direction of the Sentinel-1 satellite. Black arrows mark the look direction of the satellite. In (c,d) Red color means that the ground moves toward the satellite. Blue color means that the ground moves away from the satellite.
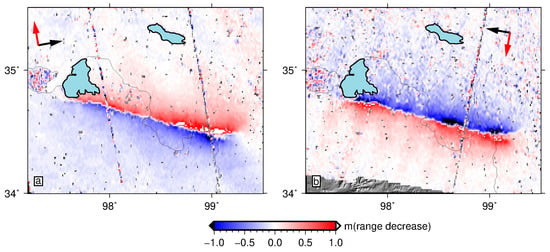
Figure 3.
(a,b) are range pixel offset result of the Maduo earthquake along the ascending and descending orbits, respectively. Red color means that the ground moves toward the satellite. Blue color means that the ground moves away from the satellite. Red arrow marks the flight direction of the Sentinel-1 satellite. Black arrow marks the look direction of the satellite.
Next, we constructed a coseismic slip model from the phase and pixel offset measurements (Figure 4). Our model is assumed to be in an elastic half-space []. The fault traces are shown in Figure 2. The fault model consists of four fault segments. These segments can be termed as the western segment, central western segment, central eastern segment, and the eastern segment (indexed from 1 to 4). The fault geometry is created from the LOS displacement map. The fault segments are located at the interface where LOS displacement changes the sign from one side to the other side of the fault. To determine the dipping angles of the faults, we ran a series of inversions. We tried a range of dipping angles while keeping the other parameters unchanged, and we found that a northward dipping angles (~80 degrees) gave the smallest misfit. Thus, the fault segment is assumed to be dipping toward north with high dipping angles (~80 degrees). The fault model extends from the surface of the half-space to a depth of 20 km as we assume that majority of the coseismic slip occurred in the upper crust, from 0 to 20 km depth. All of the fault planes are discretized into small rectangular fault patches. The size of these small patches increases from shallow to deep to accommodate the decreasing resolution of the coseismic slip model.
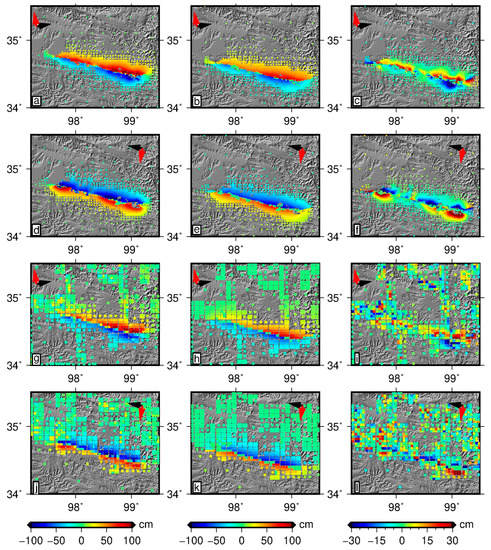
Figure 4.
(a–c) are data, model prediction, and residuals of the ascending LOS displacement. (d–f) are data, model prediction, and residuals of the descending LOS displacement. (g–i) are data, model prediction, and residuals of the range pixel offset along ascending orbits. (j–l) are data, model prediction, and residuals of the range pixel offset along descending orbits. Red color means that the ground moves toward the satellite. Blue color means that the ground moves away from the satellite. Red arrows mark the flight direction of the Sentinel-1 satellite. Black arrows mark the look direction of the satellite.
The surface deformation measurements, including the phase and pixel offset data, are used to invert for the coseismic slip model. There will be a redundancy of phase measurement if the image is sampled at every observation location. We sampled the phase and pixel offset measurements, employing a quad-tree algorithm []. The algorithm is designed to sample densely near the rupture zone where coseismic strain release is highest and sample less densely away from the rupture zone. For pixel offset, there are some redundancies left in the sampling mainly because of the artificial high strain created from the stronger noise in the data. Figure 4 shows the sampled data points from the phase and pixel offset measurements.
Geodetic inversion is used to construct the coseismic slip model []. We impose a non-negative constraints on fault strike direction of coseismic slip: the model can only be left-lateral strike-slip faulting. The slip along the fault dip direction is free to move in either normal slip or thrust slip directions. In the inversion, the fault dip is deemed as a fixed parameter and we do not invert for the fault dip angle. A smoothing constraint is imposed onto the coseismic slip distribution. The smoothness constraint minimizes the first derivative of slip []. We attempted a range of smoothing weights and inspected the model RMS misfit. The best-fit model is chosen based on a number of simulations to obtain the smoothest model that does not degrade the fit to the data. The interferometric phase might contain a linear ramp representing the long wavelength atmospheric error, so we estimated and removed a linear trend as part of the geodetic inversion.
3. Results
Figure 5 shows the final coseismic slip model constrained by the Sentinel-1 InSAR data. This model identified six coseismic fault slip patches of the Maduo earthquake. Each slip patch has different slip pattern and slip magnitude. The maximum slip patch is approximately 8 m and is located at the eastern section of the fault. This high slip of 8 m is a well-resolved feature in the coseismic slip model. We attempted to change the smoothness constraint in the inversion and observe the variations in the coseismic slip model. A lower smoothness results in an increase in the coseismic slip and a higher smoothness results in an decrease of coseismic slip. Figure 4 shows the observation data, model prediction, and residuals (e.g., data minus prediction) of the coseismic slip model. We can see that the model prediction matches the data very well. The residuals are randomly distributed and close to zero. The seismic moment released is equivalent to a moment magnitude 7.4 earthquake, assuming the shear modulus to be 30 GPa. This moment magnitude is in excellent agreement with the result published in USGS. The variance reduction of the inversion reaches 97%.
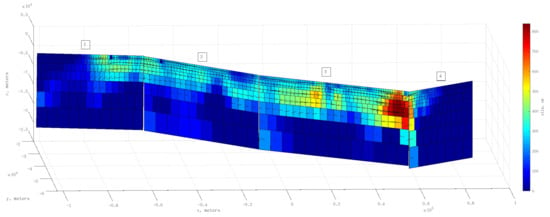
Figure 5.
Coseismic slip model of the Maduo earthquake in a 3D perspective. The color shows the magnitude of slip. The arrows show the direction of slip on the fault planes. The fault model is divided into four fault segments and indexed from 1 to 4 (see Figure 2).
4. Discussion
Previous studies have found that in crustal earthquakes the coseismic slip at shallower depth (0–2 km) is systematically smaller than the slip at deeper depth (4–10 km). This characteristic of earthquakes is termed the ‘shallow slip deficit’ []. This phenomenon has been found in many significant earthquakes. For the Maduo earthquake, we demonstrate how the coseismic slip changes with depth in Figure 6. First, we calculated the average magnitude of total slip at each depth layer in the coseismic fault model and we plotted them as a function of depth. On average, the slip at 0–2 km depth is much smaller than the slip at 4–6 km depth. Possible explanations include: (1) an artifact in the geodetic inversion due to insufficient resolution close to the fault []; (2) compensation from interseismic fault creep and postseismic afterslip []; (3) distributed and inelastic off-fault deformation []. Reference [] has observed a similar ‘shallow slip deficit’ in their study of the Maduo earthquake, so it is unlikely that the ‘shallow slip deficit’ is caused by artifacts in the geodetic inversion. They attributed it to distinct friction properties of the seismogenic zone, i.e., velocity weakening versus velocity strengthening. They also observed that aftershocks occurred mainly below the depth of coseismic slip. To investigate further the cause and mechanism of ‘shallow slip deficit’ one would need to study the interseismic and postseismic deformation of the seismogenic fault of the Maduo earthquake in future [].
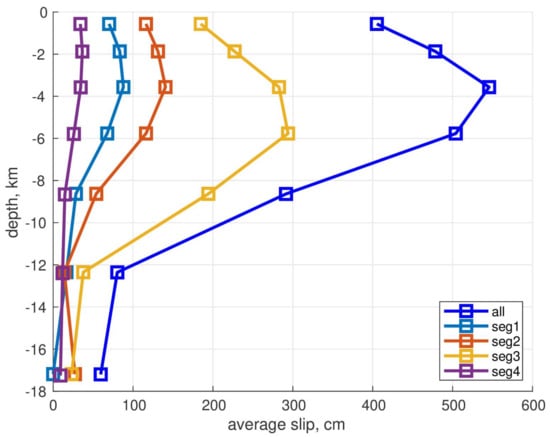
Figure 6.
Slip versus depth plot, showing the depth distribution of the averaged coseismic slip.
One interesting feature of the Maduo earthquake is that it occurred inside the Bayan Har block rather than on the boundaries of a tectonic block. Previous significant earthquakes like the 1997 Manyi earthquake, 2001 Kokoxili earthquake, 2008 Mw7.9 Wenchuan earthquake, 2010 Yushu earthquake, 2013 Lushan earthquake, 2017 Jiuzhaigou earthquake all occurred on the boundaries of blocks. Apparently, the Maduo earthquake occurred on a secondary fault that is sub-parallel to the Kunlun fault. An aftershock study [] shows that the corresponding seismogenic fault is called the Kunlunshankou-Jiangcuo fault. The Maduo earthquake has risen questions on the seismic hazard evaluation. It is generally assumed that at the interior of a tectonic block the strain accumulation is low, thus it is unlikely to host large earthquakes. This viewpoint has been challenged by the occurrence of the Maduo earthquake. Intra-block earthquakes might occur along zones of weakness where stress and strain concentrate. We suspect that the Maduo earthquake occurred along a such weakness zone of the Bayan Har block. Further investigations on how strain is accumulating inside tectonic blocks and how it is released in the form of earthquakes need to address this issue.
To validate our coseismic slip model, we compared it with the published slip models constrained mainly by InSAR observations [,,]. In general, we found that our model and previous InSAR-based models are similar, but the details of the models are different. Both the published models and our model indicate the coseismic slip concentrated in the shallow upper crust (0–15 km) and there are several large asperities on the faults. The largest coseismic slip appears to be located in the eastern segment of the seismogenic fault. There is a difference in the magnitude of the largest slip patch. References [,] found the largest slip is about 5–6 m but our slip inversion yields a large slip of about 8 m. We checked the residuals (Figure 4) along the fault and we did not find anomalies near the largest slip patch. We suspect that the differences in the coseismic slip model could stem from non-uniqueness in the geodetic inversion. In addition, the details in the fault geometry (dipping angles and fault segmentation), smoothness weighting, inversion constraints, and inversion schemes are all different for different InSAR studies. For the fault geometry, we prefer a northward dipping fault rather than a vertical fault. We compared our slip model with the rupture process constrained using teleseismic body waves (http://www.cea-igp.ac.cn/kydt/278249.html accessed on 23 May 2021). Seismic rupture model indicates the earthquake ruptured bi-laterally and the largest slip occurred to the east of the epicenter, which is in good agreement with the InSAR-based models. However, the seismic model shows that the magnitude of the largest slip patch is around 1.5 m, much lower than the slip magnitude of the InSAR-based models.
Detailed geological field investigation showed that the coseismic surface ruptures of the Maduo earthquake consist of a series of shear cracks, tension cracks, push-ups, and collapses []. It is found that the surface rupture zone is 151 km in length. We measured the surface rupture length from the unwrapped phase and found that it is 140 km long approximately, in good agreement with the geological record. Reference [] found that the largest coseismic left-lateral offset was 2.9 m along the western segment, and it decreases to 1.9 m along the central western segment and 1.8 m along the eastern segment. We compared these fault offsets with the shallowest slip patches of our coseismic slip model (Figure 5) and found that they are consistent to first order. A major difference between our model and the geological field investigation is the location of the largest fault slip. Reference [] indicated that the largest slip occurred in the western segment (e.g., segment 1 in our model) but we found that the largest slip occurred at the junction between the central eastern segment and the eastern segment (e.g., segment 3 and segment 4 in our model). This difference emphasizes the variability of the coseismic slip distribution: the coseismic slip seen at the surface of the earth is not necessarily equal to the coseismic slip at depth. The geological record only measured the slip distribution at the surface of the earth, but InSAR can be used to infer coseismic slip deeper in the earth’s crust.
5. Conclusions
In summary, we can draw the following conclusions: (1) we derived coseismic displacement of the 2021 Maduo earthquake by processing InSAR observations from C-band Sentinel-1 data along both the ascending and descending orbits. The interferometric phase and range pixel offset data completely cover the fault area that hosts the Maduo earthquake. Multiple looking geometry from InSAR helps in resolving horizontal and vertical deformation of the earthquake. InSAR shows that the Maduo earthquake is dominated by left-lateral strike-slip faulting with relative LOS displacement of 2 m approximately; (2) InSAR facilitates mapping the surface trace of the earthquake faulting. The length of the surface rupture is found to be more than 140 km using InSAR observations. This is consistent with the ground truth geological observations []. The averaged coseismic slip at surface of the earth is approximately 2 m; (3) Coseismic slip modeling found that the slip reaches 8 m at a depth of 4 km located to the east of hypocenter. The maximum moment release is located at the junction between fault segment 3 and fault segment 4 (Figure 5), where the fault strike changes significantly. There is an apparent ‘shallow slip deficit’ of the Maduo earthquake; (4) InSAR technology provide an alternative tool to the ground truth geological observation in the study of the Maduo earthquake. The fault displacement measured from geological observation [] is precise at discrete locations, while the fault slip measured from InSAR covers the whole fault with high resolution and moderate precision. In this respect, InSAR is highly complementary to the ground truth geological observations in the field.
Author Contributions
Conceptualization, X.T.; Methodology, X.T.; Software, X.X.; Validation, X.T.; Formal analysis, X.T.; Investigation, X.T.; Resources, X.T.; Data curation, X.T.; Writing—original draft preparation, X.T.; Writing—review and editing, X.X. and S.C.; Visualization, X.T.; Supervision, S.C.; Project administration, X.T.; Funding acquisition, X.T. All authors have read and agreed to the published version of the manuscript.
Funding
This research is funded by the Special Fund of the Institute of Geophysics, China Earthquake Administration (grant no. 0420906).
Institutional Review Board Statement
Not applicable.
Informed Consent Statement
Not applicable.
Data Availability Statement
Sentinel-1 data were provided by European Space Agency (ESA)/Copernicus and accessed from Alaska Satellite Facility.
Acknowledgments
The figures in this study were generated using the public domain generic mapping tools (GMT) software [].
Conflicts of Interest
The authors declare no conflict of interest. The funders had no role in the design of the study; in the collection, analyses, or interpretation of data; in the writing of the manuscript, or in the decision to publish the results.
References
- Tapponnier, P.; Xu, Z.; Roger, F.; Meyer, B.; Arnaud, N.; Wittlinger, G.; Yang, J. Oblique stepwise rise and growth of the Tibet Plateau. Science 2001, 294, 1671–1677. [Google Scholar] [CrossRef] [PubMed]
- Qu, W.; Lu, Z.; Zhang, Q.; Hao, M.; Wang, Q.; Qu, F.; Zhu, W. Present-day crustal deformation characteristics of the southeastern Tibetan Plateau and surrounding areas by using GPS analysis. J. Asian Earth Sci. 2018, 163, 22–31. [Google Scholar] [CrossRef]
- Wang, M.; Shen, Z.K. Present-Day Crustal Deformation of Continental China Derived from GPS and Its Tectonic Implications. J. Geophys. Res. Solid Earth 2020, 125, e2019JB018774. [Google Scholar] [CrossRef] [Green Version]
- Van der Woerd, J.; Ryerson, F.J.; Tapponnier, P.; Gaudemer, Y.; Finkel, R.; Meriaux, A.S.; Caffee, M.; Guoguang, Z.; Qunlu, H. Holocene left-slip rate determined by cosmogenic surface dating on the Xidatan segment of the Kunlun fault (Qinghai, China). Geology 1998, 26, 695–698. [Google Scholar] [CrossRef] [Green Version]
- Van der Woerd, J.; Ryerson, F.J.; Tapponnier, P.; Meriaux, A.S.; Gaudemer, Y.; Meyer, B.; Finkel, R.C.; Caffee, M.W.; Guoguang, Z.; Xu, Z. Uniform slip-rate along the Kunlun Fault: Implications for seismic behaviour and large-scale tectonics. Geophys. Res. Lett. 2000, 27, 2353–2356. [Google Scholar] [CrossRef] [Green Version]
- Der Woerd, J.V.; Tapponnier, P.; Ryerson, F.J.; Meriaux, A.-S.; Meyer, B.; Gaudemer, Y.; Finkel, R.C.; Caffee, M.W.; Guoguan, Z.; Xu, Z. Uniform postglacial slip-rate along the central 600 km of the Kunlun Fault (Tibet), from 26Al, 10Be, and 14C dating of riser offsets, and climatic origin of the regional morphology. Geophys. J. Int. 2002, 148, 356–388. [Google Scholar] [CrossRef]
- Diao, F.; Xiong, X.; Wang, R.; Walter, T.R.; Wang, Y.; Wang, K. Slip Rate Variation along the Kunlun Fault (Tibet): Results from New GPS Observations and a Viscoelastic Earthquake-Cycle Deformation Model. Geophys. Res. Lett. 2019, 46, 2524–2533. [Google Scholar] [CrossRef]
- Ji, L.; Zhang, W.; Liu, C.; Zhu, L.; Xu, J.; Xu, X. Characterizing interseismic deformation of the Xianshuihe fault, eastern Tibetan Plateau, using Sentinel-1 SAR images. Adv. Space Res. 2020, 66, 378–394. [Google Scholar] [CrossRef]
- Yan, B.; Lin, A. Systematic deflection and offset of the Yangtze River drainage system along the strike-slip Ganzi-Yushu-Xianshuihe Fault Zone, Tibetan Plateau. J. Geodyn. 2015, 87, 13–25. [Google Scholar] [CrossRef]
- Wang, H.; Wright, T.J.; Biggs, J. Interseismic slip rate of the northwestern Xianshuihe fault from InSAR data. Geophys. Res. Lett. 2009, 36, L03302. [Google Scholar] [CrossRef]
- Chevalier, M.-L.; Leloup, P.H.; Replumaz, A.; Pan, J.; Métois, M.; Li, H. Temporally constant slip rate along the Ganzi fault, NW Xianshuihe fault system, eastern Tibet. GSA Bull. 2017, 130, 396–410. [Google Scholar] [CrossRef]
- Li, Z.; Li, W.; Li, T.; Xu, Y.; Su, P.; Guo, P.; Sun, Y.; Ha, G.; Chen, G.; Yao, Z.; et al. Seismogenic fault and coseismic surface deformation of the Maduo Ms7.4 earthquake in Qinghai, China: A quick report. Seismol. Geol. 2021, 43, 722–737. (In Chinese) [Google Scholar]
- Wang, W.; Fang, L.; Wu, J.; Tu, H.; Zhang, L. Aftershock sequence relocation of the 2021 Ms7.4 Maduo Earthquake, Qinghai, China. Sci. China Earth Sci. 2021, 64, 1371–1380. [Google Scholar] [CrossRef]
- Massonnet, D.; Feigl, K.L. Radar interferometry and its application to changes in the earth’s surface. Rev. Geophys. 1998, 36, 441–500. [Google Scholar] [CrossRef] [Green Version]
- Liu, J.H.; Hu, J.; Li, Z.W.; Ma, Z.F.; Wu, L.X.; Jiang, W.P.; Feng, G.C.; Zhu, J.J. Complete three-dimensional coseismic displacements due to the 2021 Maduo earthquake in Qinghai Province, China from Sentinel-1 and ALOS-2 SAR images. Sci. China Earth Sci. 2021; in press. [Google Scholar] [CrossRef]
- Chen, H.; Qu, C.; Zhao, D.; Ma, C.; Shan, X. Rupture Kinematics and Coseismic Slip Model of the 2021Mw 7.3 Maduo (China) Earthquake:Implications for the Seismic Hazard of the Kunlun Fault. Remote Sens. 2021, 13, 3327. [Google Scholar] [CrossRef]
- Zhan, Y.; Liang, M.; Sun, X.; Huang, F.; Zhao, L.; Gong, Y.; Han, J.; Li, C.; Zhang, P.; Zhang, H. Deep structure and seismogenic pattern of the 2021.5.22 Madoi (Qinghai) MS7.4 earthquake. Chin. J. Geophys. 2021, 64, 2232–2252. (In Chinese) [Google Scholar]
- Prats-Iraola, P.; Scheiber, R.; Marotti, L.; Wollstadt, S.; Reigber, A. TOPS Interferometry with TerraSAR-X. IEEE Trans. Geosci. Remote Sens. 2012, 50, 3179–3188. [Google Scholar] [CrossRef] [Green Version]
- Sandwell, D.; Mellors, R.; Tong, X.; Wei, M. and Wessel, P. Open radar interferometry software for mapping surface deformation. EOS Trans. Amer. Geophys. Union 2011, 92, 234. [Google Scholar] [CrossRef] [Green Version]
- Xu, X.; Sandwell, D.T.; Tymofyeyeva, E.; González-Ortega, A.; Tong, X. Tectonic and Anthropogenic Deformation at the Cerro Prieto Geothermal Step-Over Revealed by Sentinel-1A InSAR. IEEE Trans. Geosci. Remote Sens. 2017, 55, 5284–5292. [Google Scholar] [CrossRef]
- Chen, C.W.; Zebker, H.A. Two-dimensional phase unwrapping with use of statistical models for cost functions in nonlinear optimization. J. Opt. Soc. Am. A 2001, 18, 338–351. [Google Scholar] [CrossRef] [Green Version]
- Goldstein, R.M.; Werner, C.L. Radar interferogram filtering for geophysical applications. Geophys. Res. Lett. 1998, 25, 4035–4038. [Google Scholar] [CrossRef] [Green Version]
- Okada, Y. Surface deformation due to shear and tensile faults in a half-space. Bull. Seismol. Soc. Am. 1985, 75, 1135–1154. [Google Scholar] [CrossRef]
- Fialko, Y. Probing the mechanical properties of seismically active crust with space geodesy: Study of the coseismic deformation due to the 1992 M w 7.3 Landers (southern California) earthquake. J. Geophys. Res. 2004, 109, B03307. [Google Scholar] [CrossRef]
- Xu, X.; Tong, X.; Sandwell, D.T.; Milliner, C.W.D.; Dolan, J.F.; Hollingsworth, J.; Leprince, S.; Ayoub, F. Refining the shallow slip deficit. Geophys. J. Int. 2016, 204, 1867–1886. [Google Scholar] [CrossRef] [Green Version]
- Tong, X.; Sandwell, D.T.; Fialko, Y. Coseismic slip model of the 2008 Wenchuan earthquake derived from joint inversion of interferometric synthetic aperture radar, GPS, and field data. J. Geophys. Res. 2010, 115, B04314. [Google Scholar] [CrossRef] [Green Version]
- Fialko, Y.; Sandwell, D.; Simons, M.; Rosen, P. Three-dimensional deformation caused by the Bam, Iran, earthquake and the origin of shallow slip deficit. Nature 2005, 435, 295–299. [Google Scholar] [CrossRef]
- Tse, S.T.; Rice, J.R. Crustal earthquake instability in relation to the depth variation of frictional slip properties. J. Geophys. Res. 1986, 91, 9452–9472. [Google Scholar] [CrossRef] [Green Version]
- Kaneko, Y.; Fialko, Y. Shallow slip deficit due to large strike-slip earthquakes in dynamic rupture simulations with elasto-plastic off-fault response. Geophys. J. Int. 2011, 186, 1389–1403. [Google Scholar]
- Jin, Z.; Fialko, Y. Coseismic and Early Postseismic Deformation Due to the 2021 M7.4 Maduo (China) Earthquake. Geophys. Res. Lett. 2021, 48, e2021GL095213. [Google Scholar] [CrossRef]
- Pan, J.; Bai, M.; Li, C.; Liu, F.; Li, H.; Liu, D.; Marie-Luce, C.; Wu, K.; Wang, P.; Lu, H.; et al. Coseismic surface rupture and seismogenic structure of the 2021-05-22 Maduo (Qinghai) Ms 7.4 earthquake. Acta Geologica Sinica 2021, 95, 1655–1670. (In Chinese) [Google Scholar]
- Wessel, P.; Smith, W.H.F.; Scharroo, R.; Luis, J.; Wobbe, F. Generic Mapping Tools: Improved Version Released. Eos Trans. Am. Geophys. Union 2013, 94, 409–410. [Google Scholar] [CrossRef] [Green Version]
Publisher’s Note: MDPI stays neutral with regard to jurisdictional claims in published maps and institutional affiliations. |
© 2022 by the authors. Licensee MDPI, Basel, Switzerland. This article is an open access article distributed under the terms and conditions of the Creative Commons Attribution (CC BY) license (https://creativecommons.org/licenses/by/4.0/).