Article

Effects of Forest Fire Prevention Policies on Probability and Drivers of Forest Fires in the Boreal Forests of China during Different Periods

1
College of Forestry, Inner Mongolia Agricultural University, Hohhot 010019, China
2
Forest Ecosystem National Observation and Research Station of Daxing’an Mountains, Genhe 022350, China
3
Key Laboratory of Poyang Lake Wetland and Watershed Research, Ministry of Education, Jiangxi Normal University, Nanchang 330022, China
4
Key Laboratory of Natural Disaster Monitoring, Early Warning and Assessment of Jiangxi Province, Jiangxi Normal University, Nanchang 330022, China
*
Author to whom correspondence should be addressed.
Remote Sens. 2022, 14(22), 5724; https://doi.org/10.3390/rs14225724
Submission received: 2 October 2022 / Revised: 30 October 2022 / Accepted: 5 November 2022 / Published: 12 November 2022

Abstract

:
Fire prevention policies during different periods may lead to changes in the drivers of forest fires. Here, we use historical fire data and apply the boosted regression tree (BRT) model to analyze the spatial patterns and drivers of forest fires in the boreal forests of China from 1981 to 2020 (40 years). We divided the fire data into four periods using the old and new Chinese Forest Fire Regulations as a dividing line. Our objectives here were: to explore the influence of key historical events on the drivers of forest fires in northern China, establish a probability model of forest fire occurrence, and draw a probability map of forest fire occurrence and a fire risk zone map, so as to interpret the differences in the drivers of forest fires and fire risk changes over different periods. The results show that: (1) The model results from 1981 to 2020 (all years) did not improve between 2009 and 2020 (the most recent period), indicating the importance of choosing the appropriate modeling time series length and incorporating key historical events in future forest fire modeling; (2) Climate factors are a dominant factor affecting the occurrence of forest fires during different periods. In contrast with previous research, we found that here, it is particularly important to pay attention to the relevant indicators of the autumn fire prevention period (average surface temperature, sunshine hours) in the year before the fire occurrence. In addition, the altitude and the location of watchtowers were considered to have a significant effect on the occurrence of forest fires in the study area. (3) The medium and high fire risk areas in our three chosen time periods (1981–14 March 1988; 15 March 1988–2008; 2009–2020) have changed significantly. Fire risks were higher in the east and southeast areas of the study area in all periods. The northern primeval forest area had fewer medium-risk areas before the new and old regulations were formulated, but the medium-risk areas increased significantly after the old regulations were revised. Our study will help understand the drivers and fire risk distribution of forest fires in the boreal forests of China under the influence of history and will help decision-makers optimize fire management strategies to reduce potential fire risks.

Graphical Abstract

1. Introduction

The boreal forest (45°–70°N) represents over 25% of the world’s forest surface [1] and is one of the largest forest biomes in the world, with its carbon content in forest vegetation, soil, and forest wetlands exceeding 700 Pg [2]; these forests provide important natural and economic resources for Arctic countries. These forests provide important cultural and commercial resources for Arctic countries. China’s boreal forests are found in the southernmost biomes of the global boreal zone, primarily in the Daxing’an Mountains region of northeastern China, and are important to China’s national forest resources [3,4]. Forests in northern China are widely distributed and are frequently affected by forest fires [5,6,7].
An important aspect of the study of forest fires is understanding the formation mechanisms of forest fires. Meteorology, vegetation, topography, human activities, and socioeconomic conditions can all play a role in the ignition and spread of forest fires [8,9,10,11,12,13]. Several studies which employ forest fire prediction models have been conducted in the boreal forests of China, most of which focus on, e.g., comparisons of the drivers of forest fire occurrence between different geographical zones [14], comparisons of the drivers of forest fire occurrence between different temperature zones [15], or comparisons between the environmental zones classified according to different scientific needs [16]. These studies select fire point data within a certain period of time for modeling. However, other studies have shown that forest fire prevention policies and measures in different periods also have an important impact on the occurrence and patterns of forest fires [17,18]. For example, changes in forest fire management policies have increased the risk of forest fires in the western United States, and fire dynamics, which are typically considered high frequency and low intensity, have changed significantly [19,20]. When we only consider factors such as meteorology, vegetation, topography, or different regions (such as geographical regions and temperature zones), we tend to ignore the impact of fire management policies on the drivers of forest fires in fire modeling. Thus, a question worth considering is whether different forest fire management policies will change the effect of fire modeling in conventional/routine/regular periods and if these changes result in changes to the driving factors and modeling accuracy.
The largest forest fire ever recorded in China occurred in the Daxing’an Mountains on 6 May 1987, burning 1.33 million hm2 of the forest, causing 213 deaths, and leading to more than 50,000 people being displaced [21]. After this fire, China’s forest fire prevention work has been highly valued and continuously strengthened, and the number of forest fires and burned areas in northern China has reduced significantly. In recent decades, an active forest fire prevention policy in China has led to changes in forest fire cycles, which in turn, has led to changes in the forest structure and combustibles [22]. On 15 March 1988, China formulated and implemented the Forest Fire Prevention Regulations (hereinafter referred to as “the regulations”). Since then, China has attached great importance to forest fire prevention and control and has increased its investment in forest fire management [23]. At the end of 2008, the regulations were revised and were formally implemented in 2009. The main difference between the new and old regulations is that the old regulations have fewer preventive measures, incomplete provisions on legal liability, and light penalties. The new regulations increased the corresponding legal responsibilities and increased the penalties for preventive measures, including supervision and management measures, requiring the strict implementation of fire source control, the strengthening of fire prevention through both publicity and education, and the importance of paying more attention to the construction of forest fire prevention personnel and increasing investment in fire prevention funds. The forest fire prevention measures stipulated in the old regulations are still effective, while the revision of the new regulations adapts to the new environment and pays more attention to the control of fire sources [24].
The boreal forest In the Daxing’an Mountains in Inner Mongolia accounts for more than 55% of the entire Daxing’an Mountains area, with a forest area of 8.39 million hm2 and a timber volume of 760 million m3, accounting for 4% and 5% of China, respectively [25,26]. In the past, the Daxing’an Mountains in Inner Mongolia have experienced a high rate of forest fires. From the time that the People’s Republic of China was established until the 1980s, the Chinese government invested a significant amount of both human and material resources in fire prevention campaigns, the creation of fire prevention measures, and specialized firefighting teams. However, the momentum of forest fires has not yet been significantly reduced. There were 1344 forest fires from 1962 to 1980, with an affected forest area of 1.24 million hm2 [27]. Here, we employ a boosted regression tree (BRT) model, which is very adaptable and does not rely on assumptions about the response-predictor relationship made a priori. In conventional linear regression models, it is difficult to deduce such assumptions [28]. Our objective here was to assess the impact of forest fire policies on the probability and drivers of forest fires in northern China during different periods based on historical fire data using GIS and remote sensing data. We used historical fire data from 1981 to 2020 (40 years), and took the regulations that had significantly changed China’s forest fire prevention and control policies as a historical demarcation line to clarify the following questions: (1) What is the difference between the modeling accuracy in different periods before and after the revision of the regulations? (2) Are there differences in the drivers that play a primary role in different periods? Are any of these drivers different from the findings of previous studies? (3) How does the probability of forest fire occurrence change during different periods? What is the pattern of change in medium and high fire risk areas in different periods?

2. Materials and Methods

2.1. Study Area

The Daxing’an Mountains of Inner Mongolia are located in northeastern China with a total area of approximately 17.73 million hm2 and an altitude range from 425 m to 1760 m asl (Figure 1). It has a temperate continental climate with long, cold winters (more than 9 months), short warm summers (less than 1 month), and a short frost-free period (only 70 to 100 days). The vegetation is dominated by Larix gmelinii, which accounts for approximately 60% of the total forest land, and the substrate is primarily brown coniferous forest soil. Betula platyphylla, Populus davidiana, and Pinus sylvestris var.mongolia, are among other places [4]. There are two phases to the fire prevention season in the study area: the annual spring fire prevention season, which runs from 15 March to 15 June; as well as the annual fall fire prevention season, which runs from 15 September to 15 November [9].

2.2. Data Source and Preprocessing

2.2.1. Forest Fire Records

Forest fire data is provided by the Inner Mongolia Forestry and Grassland Bureau, which includes important details about each forest fire, such as its geographic location, duration, scale, cause, number of casualties, and more. In 2021, China launched the first nationwide survey and assessment of forest and grassland fire risks. Data and access to historical fires are important elements of the survey, and our data access originated from this survey. China has written data acquisition and disposal processes into law; both the old and new “Forest Fire Prevention Regulations” stipulate the standards and methods of post-disaster fire investigation, which can ensure the maximum reliability and consistency of data. Before 1990, the location of the fire was determined by the person in charge of the forest farm, who identified each fire through fixed observation points in the forest combined with a comprehensive method of a forest resource distribution map. Since 1990, the global positioning system (GPS) has been used to record the fire location. A total of 2552 fires were recorded from 1981 to 2020, of which 211 had no geographic coordinate information. We did not consider the fires without a geographic location. According to China’s “Forest Fire Prevention Regulations”, fires are classified into four categories: (1) General forest fires: the affected forest area is less than 1 hm2. (2) Larger forest fires: the affected forest area is more than 1 hm2 and less than 100 hm2. (3) Major forest fires: the affected forest area is more than 100 hm2 and less than 1000 hm2. (4) Especially major forest fires: the affected forest area is more than 1000 hm2. Figure 2 shows the location of the fire points at different levels.

2.2.2. Climate Data

Climate is considered to be the main cause of forest fires, so the occurrence of fire can be mitigated by controlling the moisture content of combustibles and understanding the changes in meteorological elements [29]. Climate factors in the fire prevention period in the year before the fire occurrence can significantly affect future fire occurrence [30]. The dependent variable in previous studies was the average value of the meteorological elements across all the fire prevention periods in a given year; the meteorological elements across all fire prevention periods in a given year were not refined [13,31,32]. In our work, we used indicators, such as the average temperature, average surface air temperature, average humidity, and accumulated sunshine hours during the spring and autumn fire prevention periods of the year before the fire occurred.
In addition to climate factors, many fire prediction studies have considered the meteorological impact on the daily and monthly scales of fire occurrence [33,34]. On the daily scale, we selected the average temperature (°C), maximum temperature (°C), daily temperature range (°C), average relative humidity (%), average surface air temperature (°C), maximum surface air temperature (°C), minimum relative humidity (%), average wind speed (m/s), sunshine hours, and accumulated precipitation (mm/24 h). On the monthly scale, we selected the monthly average temperature (°C), monthly average relative humidity (%), monthly average surface temperature (°C), monthly accumulated sunshine hours, and monthly average precipitation (mm) of the month when the fire occurred, see Table 1 for details. The daily meteorological data are from the National Tibetan Plateau Data Center (daily meteorological dataset of basic meteorological elements of China National Surface Weather Station (V3.0) (1951–2010)) (http://data.tpdc.ac.cn/en/data/52c77e9c-df4a-4e27-8e97-d363fdfce10a/, accessed on 1 May 2022); Greenhouse Data Sharing Platform, China (http://data.sheshiyuanyi.com/, accessed on 1 October 2021).
We used ArcGIS10.7 to match the sample points and the nearest weather stations (12 in the study area and 2 outside the study area, but that were close to the study area, for a total of 14 national-level weather stations (Figure 1b). We used spatial connection tools to match the fire points and non-fire points to the weather stations and finally matched the meteorological data in a SQL Server database according to the weather stations and dates corresponding to the sample points.

2.2.3. Vegetation

The type of vegetation can be a predisposing factor for the ignition and spread of forest fires [35,36]. We used data from the Aerospace Information Research Institute, Chinese Academy of Sciences (https://data.casearth.cn/en/sdo/detail/614c68e908415d75145c0d85, accessed on 1 April 2022) downloaded 1985–2020 (every 5 years) for the global 30 m surface coverage fine classification products, which have altogether 30 types of surface cover classifications, among which the vegetation types in our study area are: 11—herbaceous cover, 20—irrigated cropland, 62—closed deciduous broadleaved forest (fc > 0.4), 72—closed evergreen needle-leaved forest (fc > 0.4), 81—open deciduous needle-leaved forest (0.15< fc < 0.4), 82—closed deciduous needle-leaved forest (fc > 0.4), 120—shrubland, 121—evergreen shrubland, 122—deciduous shrubland, 130—grassland. The land use types in the study area at 5-year intervals are shown in Appendix A, Table A1. We selected random points in the years close to the surface classification data and extracted their corresponding vegetation types when establishing the random points, screened the random points within the forest range, and randomly selected random points until there were enough numbers for modeling; this was conducted to ensure that the random points were located within the forest range. We used ArcGIS10.7 to extract the forest types of each fire point and the random points that were close to the years of the surface classification coverage data. (For example: for 1981–14 June 1987, we used the 1985 surface classification coverage data; for 15 June 1987–14 June 1992, we used the 1990 surface classification coverage data; for 15 June 1992–14 June 1997, we used the 1995 surface classification coverage data).
Many researchers have proposed using the change in the normalized difference vegetation index (NDVI) to assess the effect of vegetation on fire because the occurrence of fire is closely linked to the condition of the vegetation at a particular time [37,38,39]. We used the 1982–2020 China monthly NDVI dataset from the National Earth System Science Data Center (http://www.geodata.cn/data/datadetails.html?dataguid=239118756960240&docId=0, accessed on 1 April 2022) with a resolution of 5 km and used ArcGIS10.7 to extract the monthly NDVI corresponding to each fire point and random point. The 5 km resolution data started in 1982, so for the NDVI data for July–December 1981, we used the GIMMS (global inventory modeling and mapping studies) NDVI 3g v1.0 data downloaded from the National Aeronautics and Space Administration (https://www.nasa.gov/nex, accessed on 1 April 2022), with a temporal resolution of 15d and a spatial resolution of 8 km. The monthly maximum value was synthesized using the R language, and the first few months of July 1981 were replaced with data from the same month in 1982.

2.2.4. Topographic Data

DEM (digital elevation model) data were obtained from the GDEMV2 30M digital elevation data of the Computer Network Information Center of the Chinese Academy of Sciences, Geospatial Data Cloud (http://www.gscloud.cn, accessed on 19 April 2022). The DEM was processed by spatial correction splicing, editing, and resampling. The Surface tool in the Spatial Analyst toolkit in ArcGIS10.7 software was used to extract the slope and aspect data of the study area, and then we calculated the aspect index according to [36]:
Aspect   index   =   cos ( θ   ×   2   ×   PI / 360 )
where θ is the ArcGIS “Aspect” function’s aspect, which is a number between 0 and 360. The aspect index was between −1 and 1, with higher values indicating more potential solar radiation. Finally, the “Extract” tool was used to extract the altitude, slope, and direction of the sample points.

2.2.5. Infrastructure

The impact of human infrastructure on forest fires has been widely studied [34,37,38,39]; however, its impact on forest fires should be comprehensively considered when studying the drivers of forest fires. Guo et al. (2016) added variables such as the fire control station and fireline length to study the drivers of forest fires in the Daxing’an Mountains of Heilongjiang, China [40]. In our treatment, the distance between the watchtower and the fire point was treated as the dependent variable since the watchtower is an important forest fire prevention management platform to detect fires and report an early warning.
The fire watchtower data (including the name, latitude, and longitude of the watchtower) was provided by the Forestry and Grassland Bureau of Inner Mongolia Autonomous Region. We retrieved the distance from the fire point to the nearest railway, highway, residential area, and other variables from the 1:250,000 digital line graph (DLG) of the National Catalog Service for Geographic Information, China (https://www.webmap.cn/commres.do?method=result25W, accessed on 5 April 2022). The distribution of infrastructure is shown in Figure 1b.

2.2.6. Demographic and Socioeconomic Data

Both the population density and the GDP per capita are important indicators that can reflect socioeconomic factors. These two indicators have been widely used in the past to predict forest fires [31,41,42]. Official raster datasets are typically used to quantify the population density and GDP per capita, and the missing years are calculated using the official average growth rate [40,43]. The use of local statistical yearbooks in the study area can better reflect socioeconomic factors [34,40]. Since our fire dataset belongs to a long time series, and the raster data of socioeconomic factors were generally established after 2000, we used the statistical yearbook (1981–2008 [44]; 2009–2018) by the Inner Mongolia Bureau of Statistics (http://tj.nmg.gov.cn/tjyw/jpsj/index_1.html, accessed on 20 April 2022)) to obtain the population density and GDP per capita of the Daxing’an Mountains in Inner Mongolia at the county level (13 counties in total) from 1981 to 2020. Details can be found in Table 1.

2.3. Models and Computing Procedures

We focused on the differences in fire prevention policies in different periods. All modeling and analyses were carried out according to different periods separated by the time of the new and old regulations.

2.3.1. Statistics on the Number, Area, and Causes of Forest Fires

We divided the number, area, and causes of the forest fires in 40 years into 3 parts (1981–14 March 1988; 15 March 1988–2008; 2009–2020) for statistical purposes.

2.3.2. Models and Identification of Significant Variables

The boosted regression tree (BRT) method combines the advantages of regression tree algorithms and boosting methods [45] to automatically handle interaction effects between the factor variables and adapt to complex nonlinear relationships, which can boost the model’s stability and accuracy. The regression tree algorithm cuts the dataset into multiple sub-datasets that are easy to model by recursion and then uses linear regression to model the sub-datasets. The enhancement algorithm first constructs a series of prediction functions and then combines each function sequence into a prediction function, according to certain rules, to improve the accuracy of weak classification algorithms. The principle of the BRT algorithm is as follows [46]:
First, the relationship between the independent variable x and the dependent variable y, which is initialized to 0, was characterized using the f(x) function:
f 0 x = 0
where m is the fitted sequence value, and the total number of fitted regression trees is n. When m = 1:n, we first calculated the residual r of all the observation data:
r   = L ( y , f ( x ) ) f ( x ) f ( x ) = f m 1 ( x )
Second, the least squares regression tree was used to fit the residual r to estimate the value of βb (x; γm), where βb (x; γm) represents the information of a single tree, where the value of b is related to the chosen calculation method; the optional methods included the polynomial and regression tree among other approaches. β is the estimated parameter set of the chosen calculation method, and γm represents the partition variable, tree node value, and prediction value. We then calculated βm by calculating the minimum value of the loss equation L, where βm represents the weight of each tree node and determines the combination mode of each tree:
L ( y , f m     1 ( x ) + β b ( x ; γ m ) )
Finally, we updated the function based on the iteration result:
f m x = f m     1 x   +   β m b ( x ; γ m )
After all tree loops were updated, we calculated the final functional relation:
f x = m f m ( x )  
We built the BRT model in R studio 4.1.3 using the “gbm” package.
The BRT model required the target variable to be binary, so the known fire point was assigned a value of 1, and the random points created in the study area were assigned a value of 0 using Arcgis10.7 (random points are usually created at a ratio close to or more than fire points to prevent the excessive separation and dispersion of data). Our study used a ratio of fire points: random points = 1:1.5 [33]. We then selected the time of random points according to the time distribution probability of actual fires when creating random points. For example, there were 55 fires during the period of 1981–14 March 1988; thus, 83 random points were created based on a ratio of 1.5 times that of the actual fire points, and the random points of all the months were summed to form complete random points. We then assigned random dates to the non-fire points in Excel (random dates were also obtained according to the time distribution of the actual fires) and ensured that the generation of random points was completely random in time and space. To prevent the created random points from overlapping or being adjacent to the known fire points, the minimum allowable distance between any two random points was set to 1 km. We set up 886 random points at a ratio of 1:1.5 for 586 fire points during the period of 1981–14 March 1988. Similarly, we set up 1979 random points for 1319 fire points during the period of March 15, 1988–2008, and 654 random points for 436 fire points during the period of 2009–2020. Finally, all fire points were mixed with random points to obtain a complete set of 2341 fire points and 3519 random points. The samples in different periods were divided into 70% training samples and 30% test samples during modeling, and five intermediate models were established by repeating the sample division five times to eliminate the impact of sample distribution on the model results.
In the BRT model, we used the “summary” function to obtain the relative influence (Rel.inf) of the variables.

2.3.3. Model Evaluation Methods

The ROC (receiver operating characteristic) curve generated a set of sensitivity and specificity values by setting a variety of distinct critical values for continuous variables. We specified an abscissa to draw curves after using the sensitivity as an ordinate. An evaluation metric known as the area under the curve (AUC) was used to assess the model prediction’s accuracy. When the AUC is larger, the model performs better. AUC values between 0.5 and 0.7 denoted a poor fit, 0.7 and 0.9 denoted a moderate fit, and greater than 0.9 denoted a very good fit [47]. The cut-off point was a threshold to determine the accuracy of the model prediction and was calculated based on the sensitivity and specificity of the ROC, estimated using the Yueden index [41], and if the model’s predicted likelihood was greater than the threshold, a fire occurred. Otherwise, the case was recorded as having no fire [48].

2.3.4. Fire Ignition Probability Maps

We used the BRT model to draw the probability map of fire occurrence in each of the four periods using kriging in the ArcGIS environment (1981–14 March 1988 ((hereafter referred to as Period 1)); 15 March 1988–2008 ((hereinafter referred to as Period 2)); 2009–2020 ((hereinafter referred to as Period 3)); 1981–2020 ((hereinafter referred to as all years)). The likelihood ranged from 0 to 1. The likelihood of fire increased with the grid value. The probability of forest fires referred to locations where a fire was likely to start and from where it could easily spread to other areas. The anticipation of factors influencing the occurrence of fire and understanding the dynamic behavior of fire are critical aspects of fire management. A precise evaluation of forest fire problems and decisions on solution methods can only be satisfactorily made when a fire risk zone map is available [49]. Thus, in essence, the forest fire probability map and the fire risk zoning map present the same information to the outside world, except that the fire risk zoning map is more specific and lists specific subzones. Based on the probability map of fire occurrence and the Yueden index, we classified the fire risk area map for different periods into three fire risk levels: low, medium, and high.

2.3.5. Kernel Density Analysis

Kernel density analysis was used to study the spatial distribution density of point-like elements in the region to reflect the spatial cohesion of the elements and was determined through [34]:
f h x = 1 n h i = 1 n x x i h
where fh(x) is the kernel density function, x − xi denotes the distance from x to xi, h denotes the bandwidth and is always greater than 0; the larger the value of fh(x), the denser the distribution of fire points.
We divided the fires during different periods into natural factors (lightning fires), human factors (including smoking, production and living, and paper burning), and invasive factors (foreign and out-of-province burning) and conducted a kernel density analysis of fires caused by different factors, respectively.

3. Results

We mapped the probability of fire occurrence based on the model and compared the driving factors for four distinct time periods. In the modeling, the samples from different periods were divided into 70% training samples and 30% test samples. This division was performed five times to build five intermediate models, so the sample distribution did not affect the results of the models.

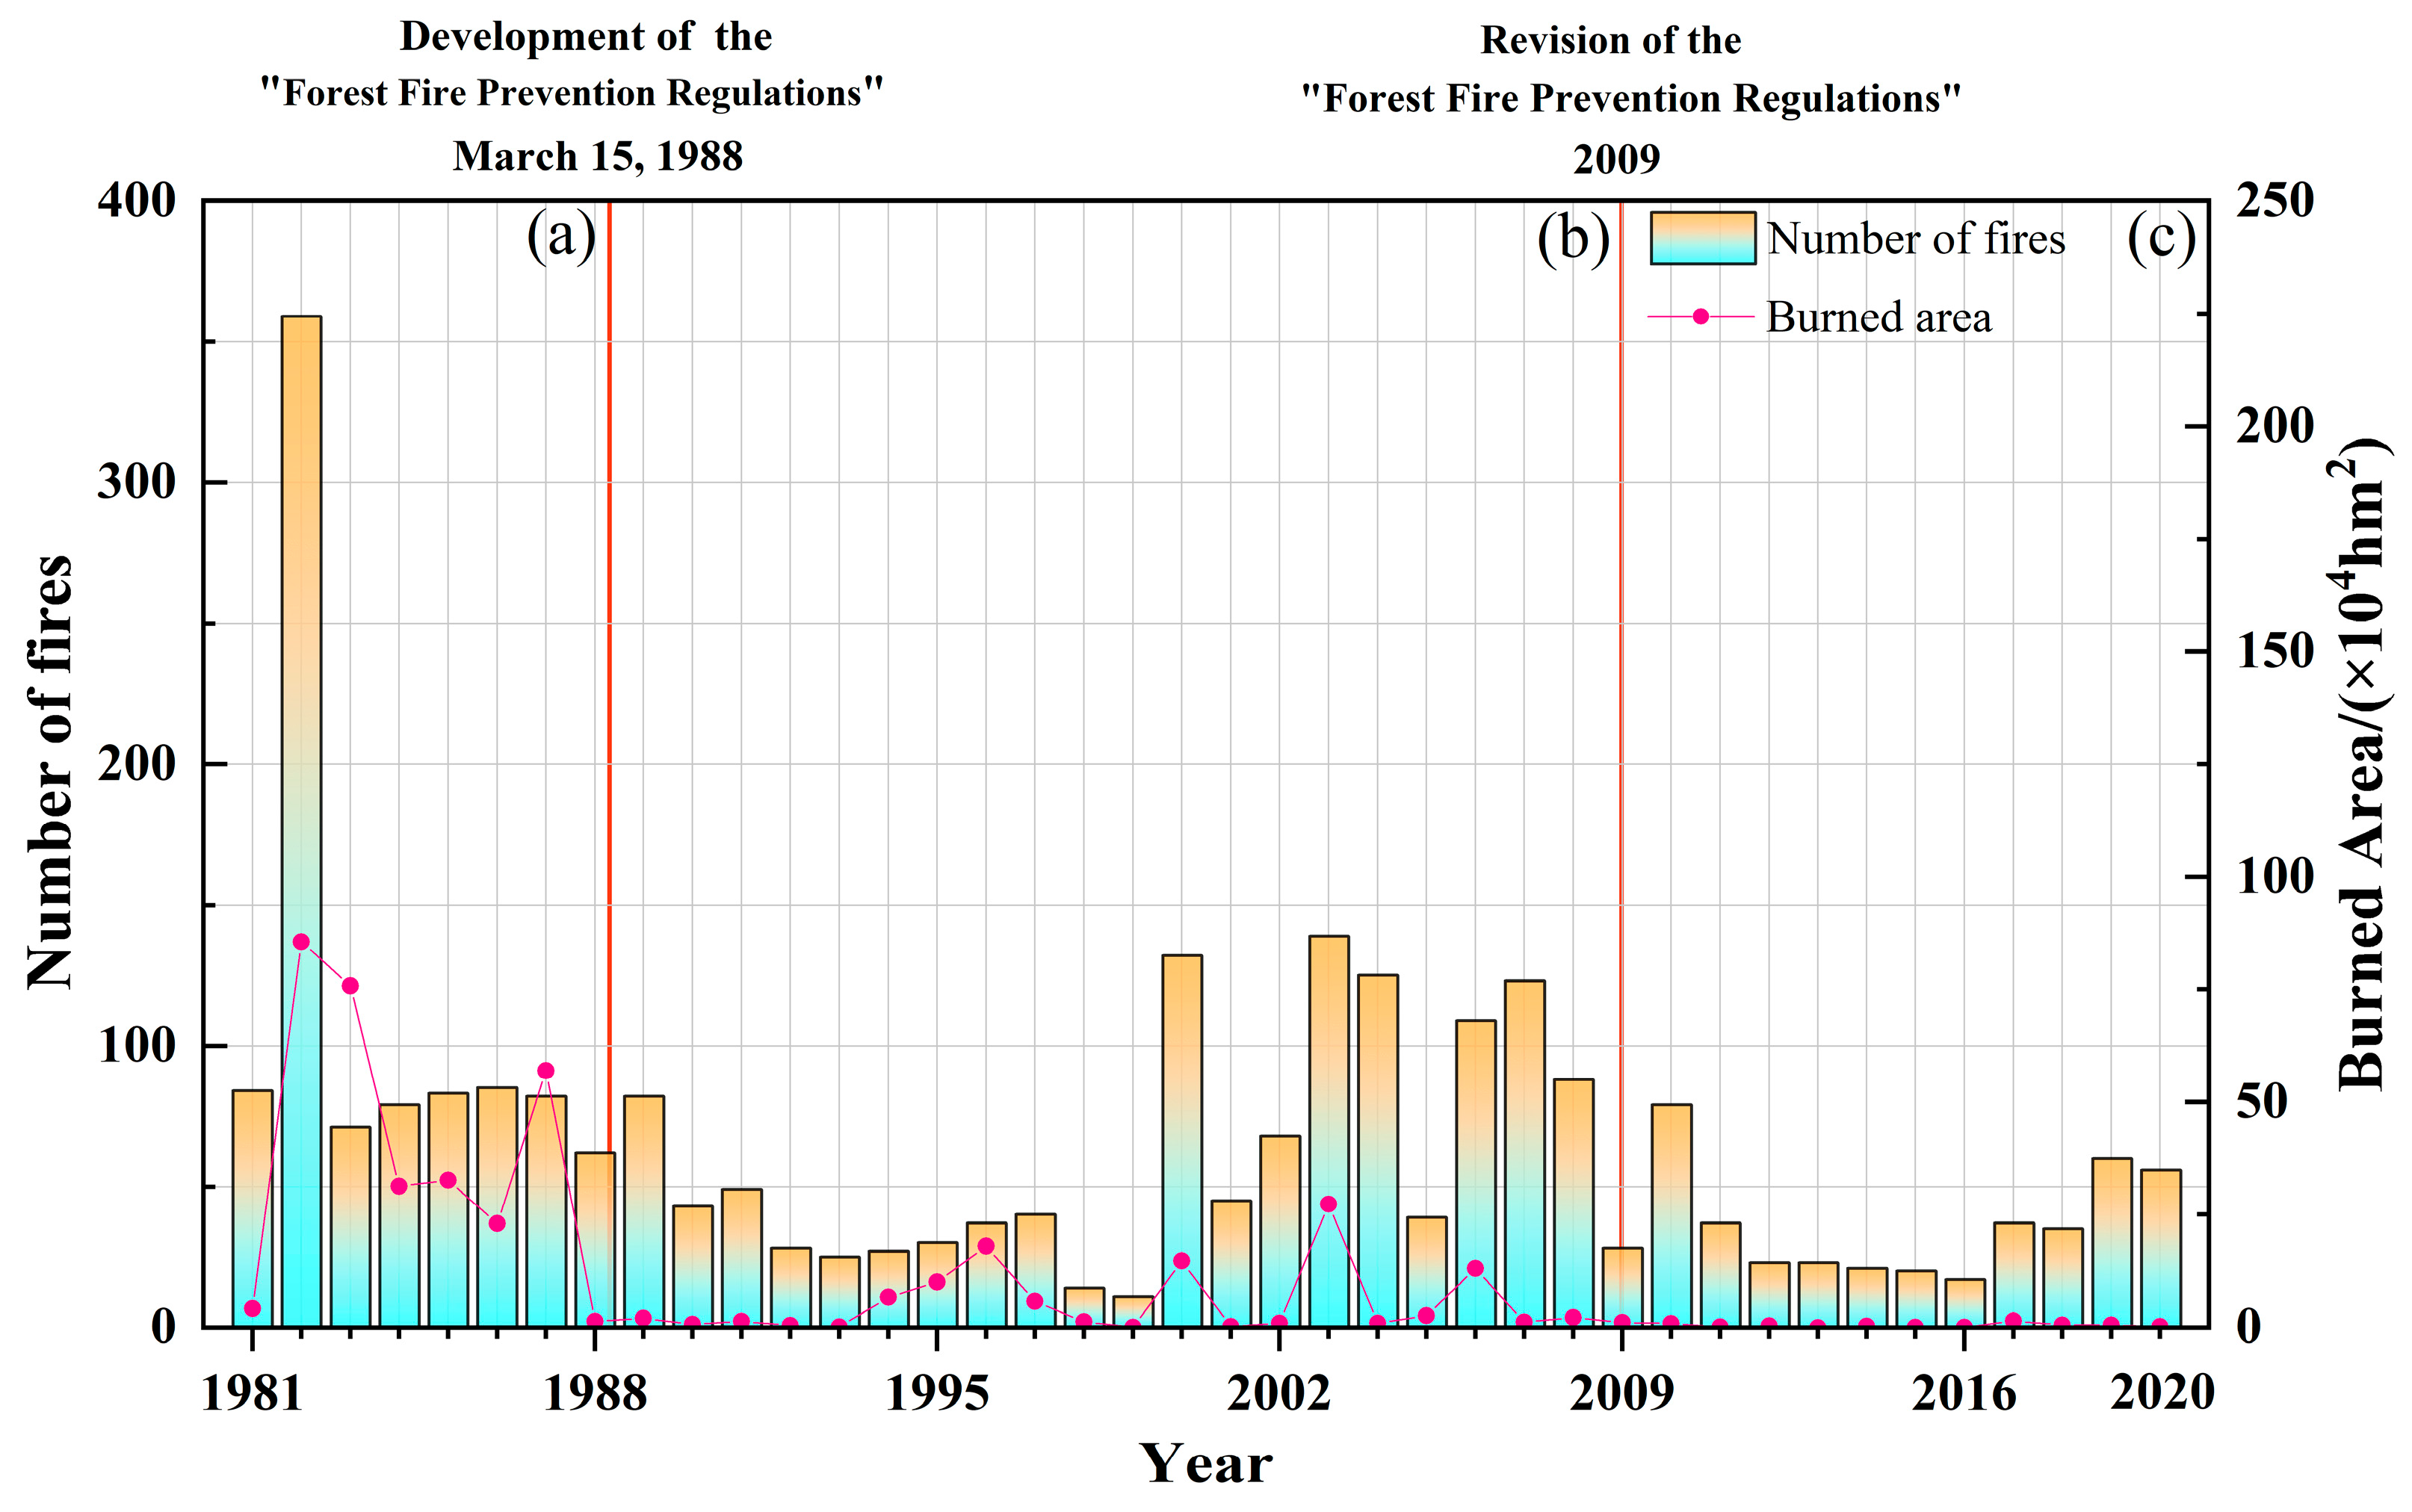
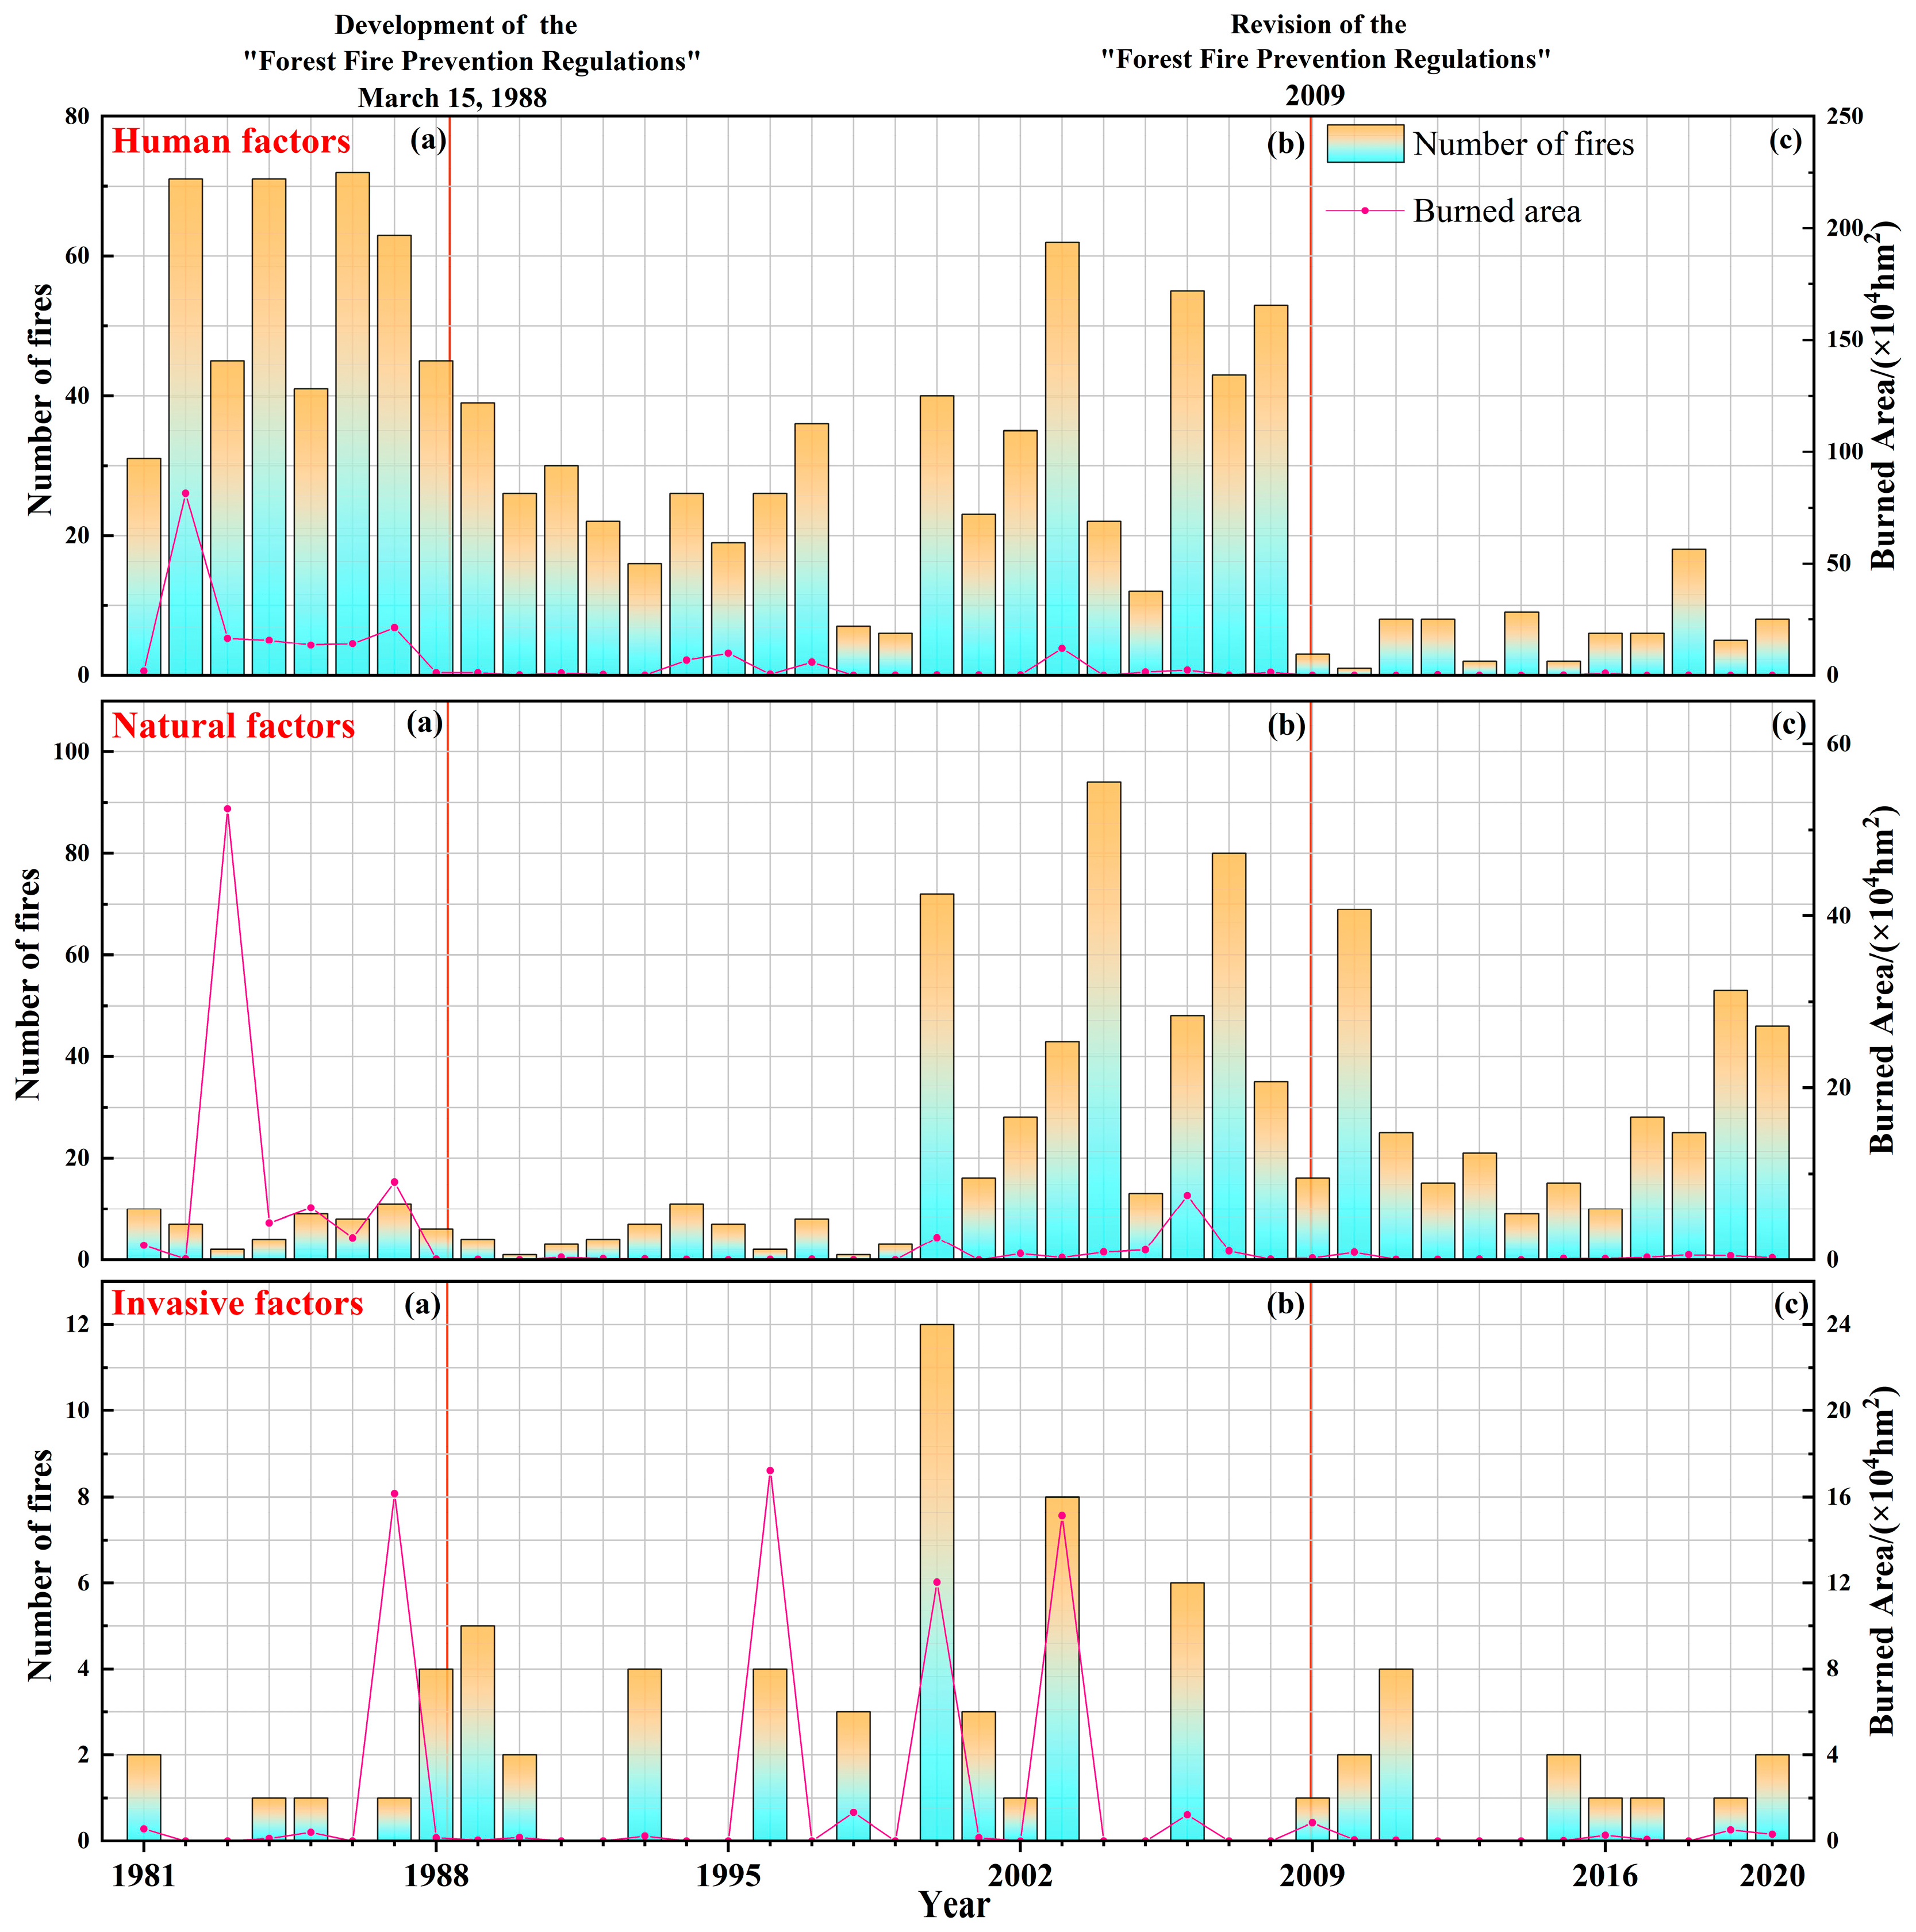
3.1. Statistical of Forest Fire Data

There has been an overall decrease over the past 40 years, although there have been fluctuations in the number of fires and the area of fires from 2001 to 2008 (Figure 3). We classified the causes of fires into three categories: natural factors (lightning fires), human factors (smoking, production and living, paper burning, etc.), and invasive factors (foreign burn-in, burn-in in other provinces and cities). From Figure 4 and Table 2, we can see that the number of man-made fires before 15 March 1988, the number of fires, and the fire area was large; however, after the development of the “regulations” and amendments, the situation has improved. The number of lightning fires increased significantly, from 7.28 per year in Period 1 to 23.14 in Period 2 and 27.66 in Period 3.

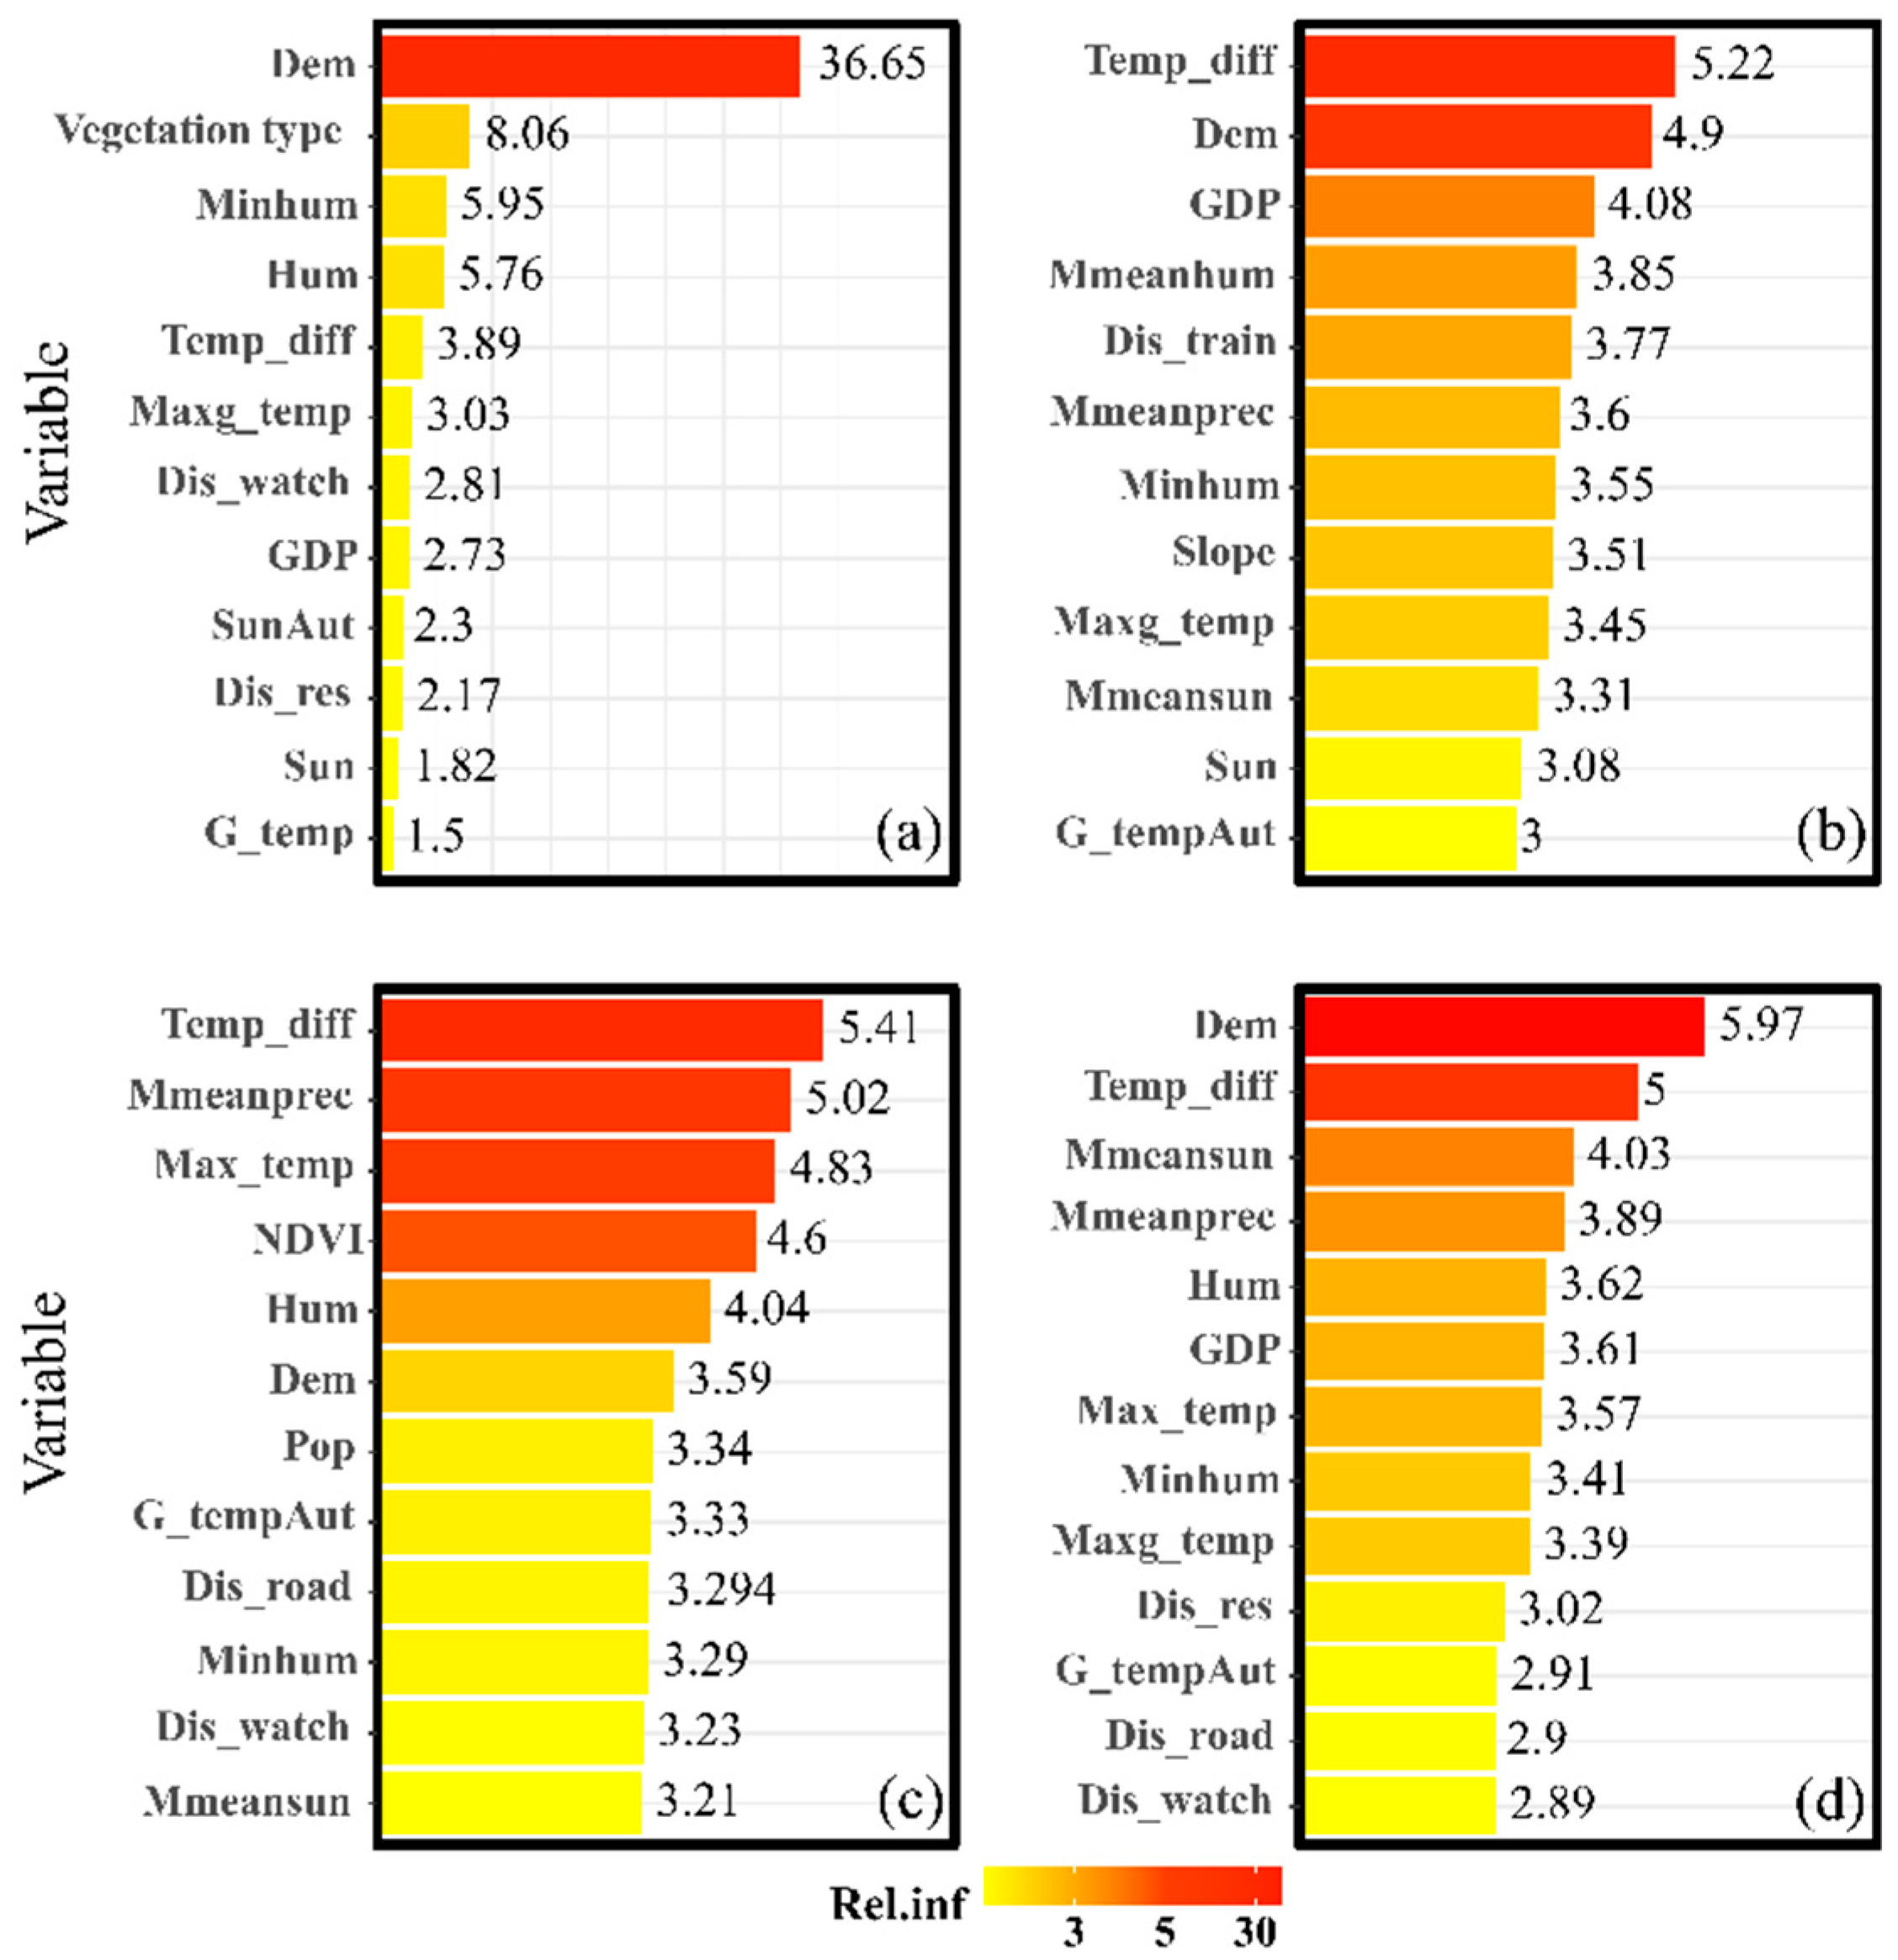
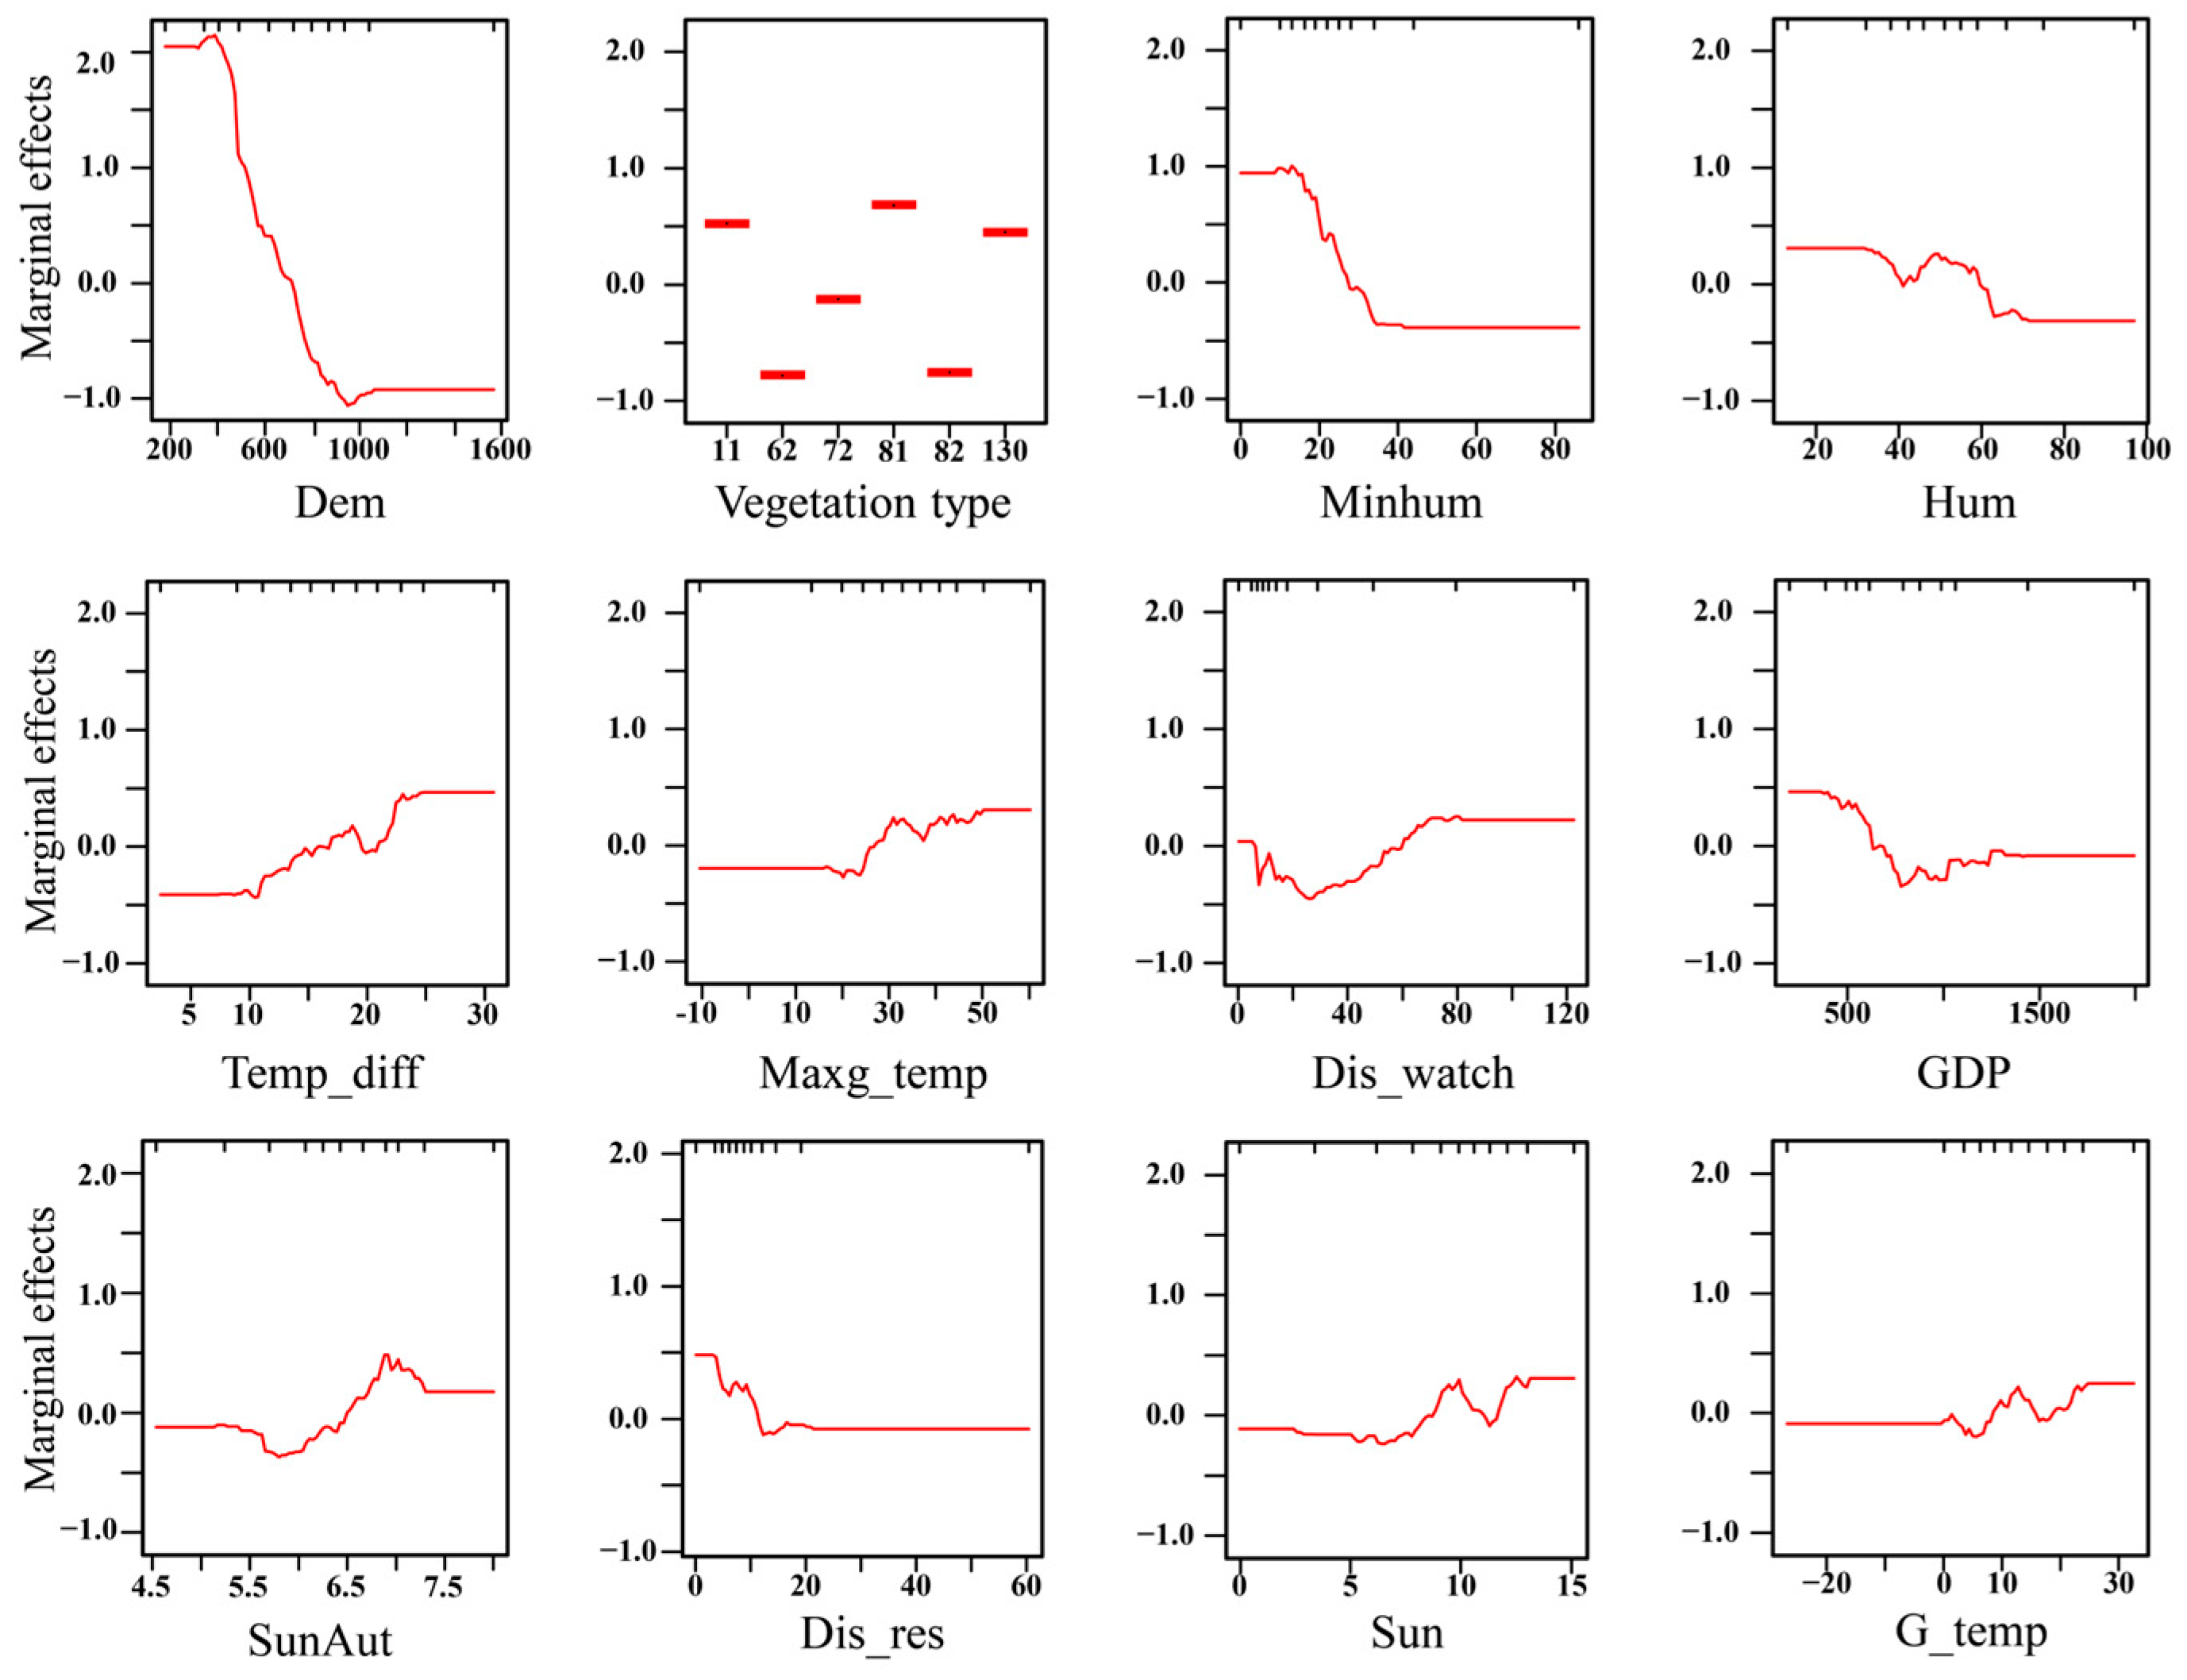
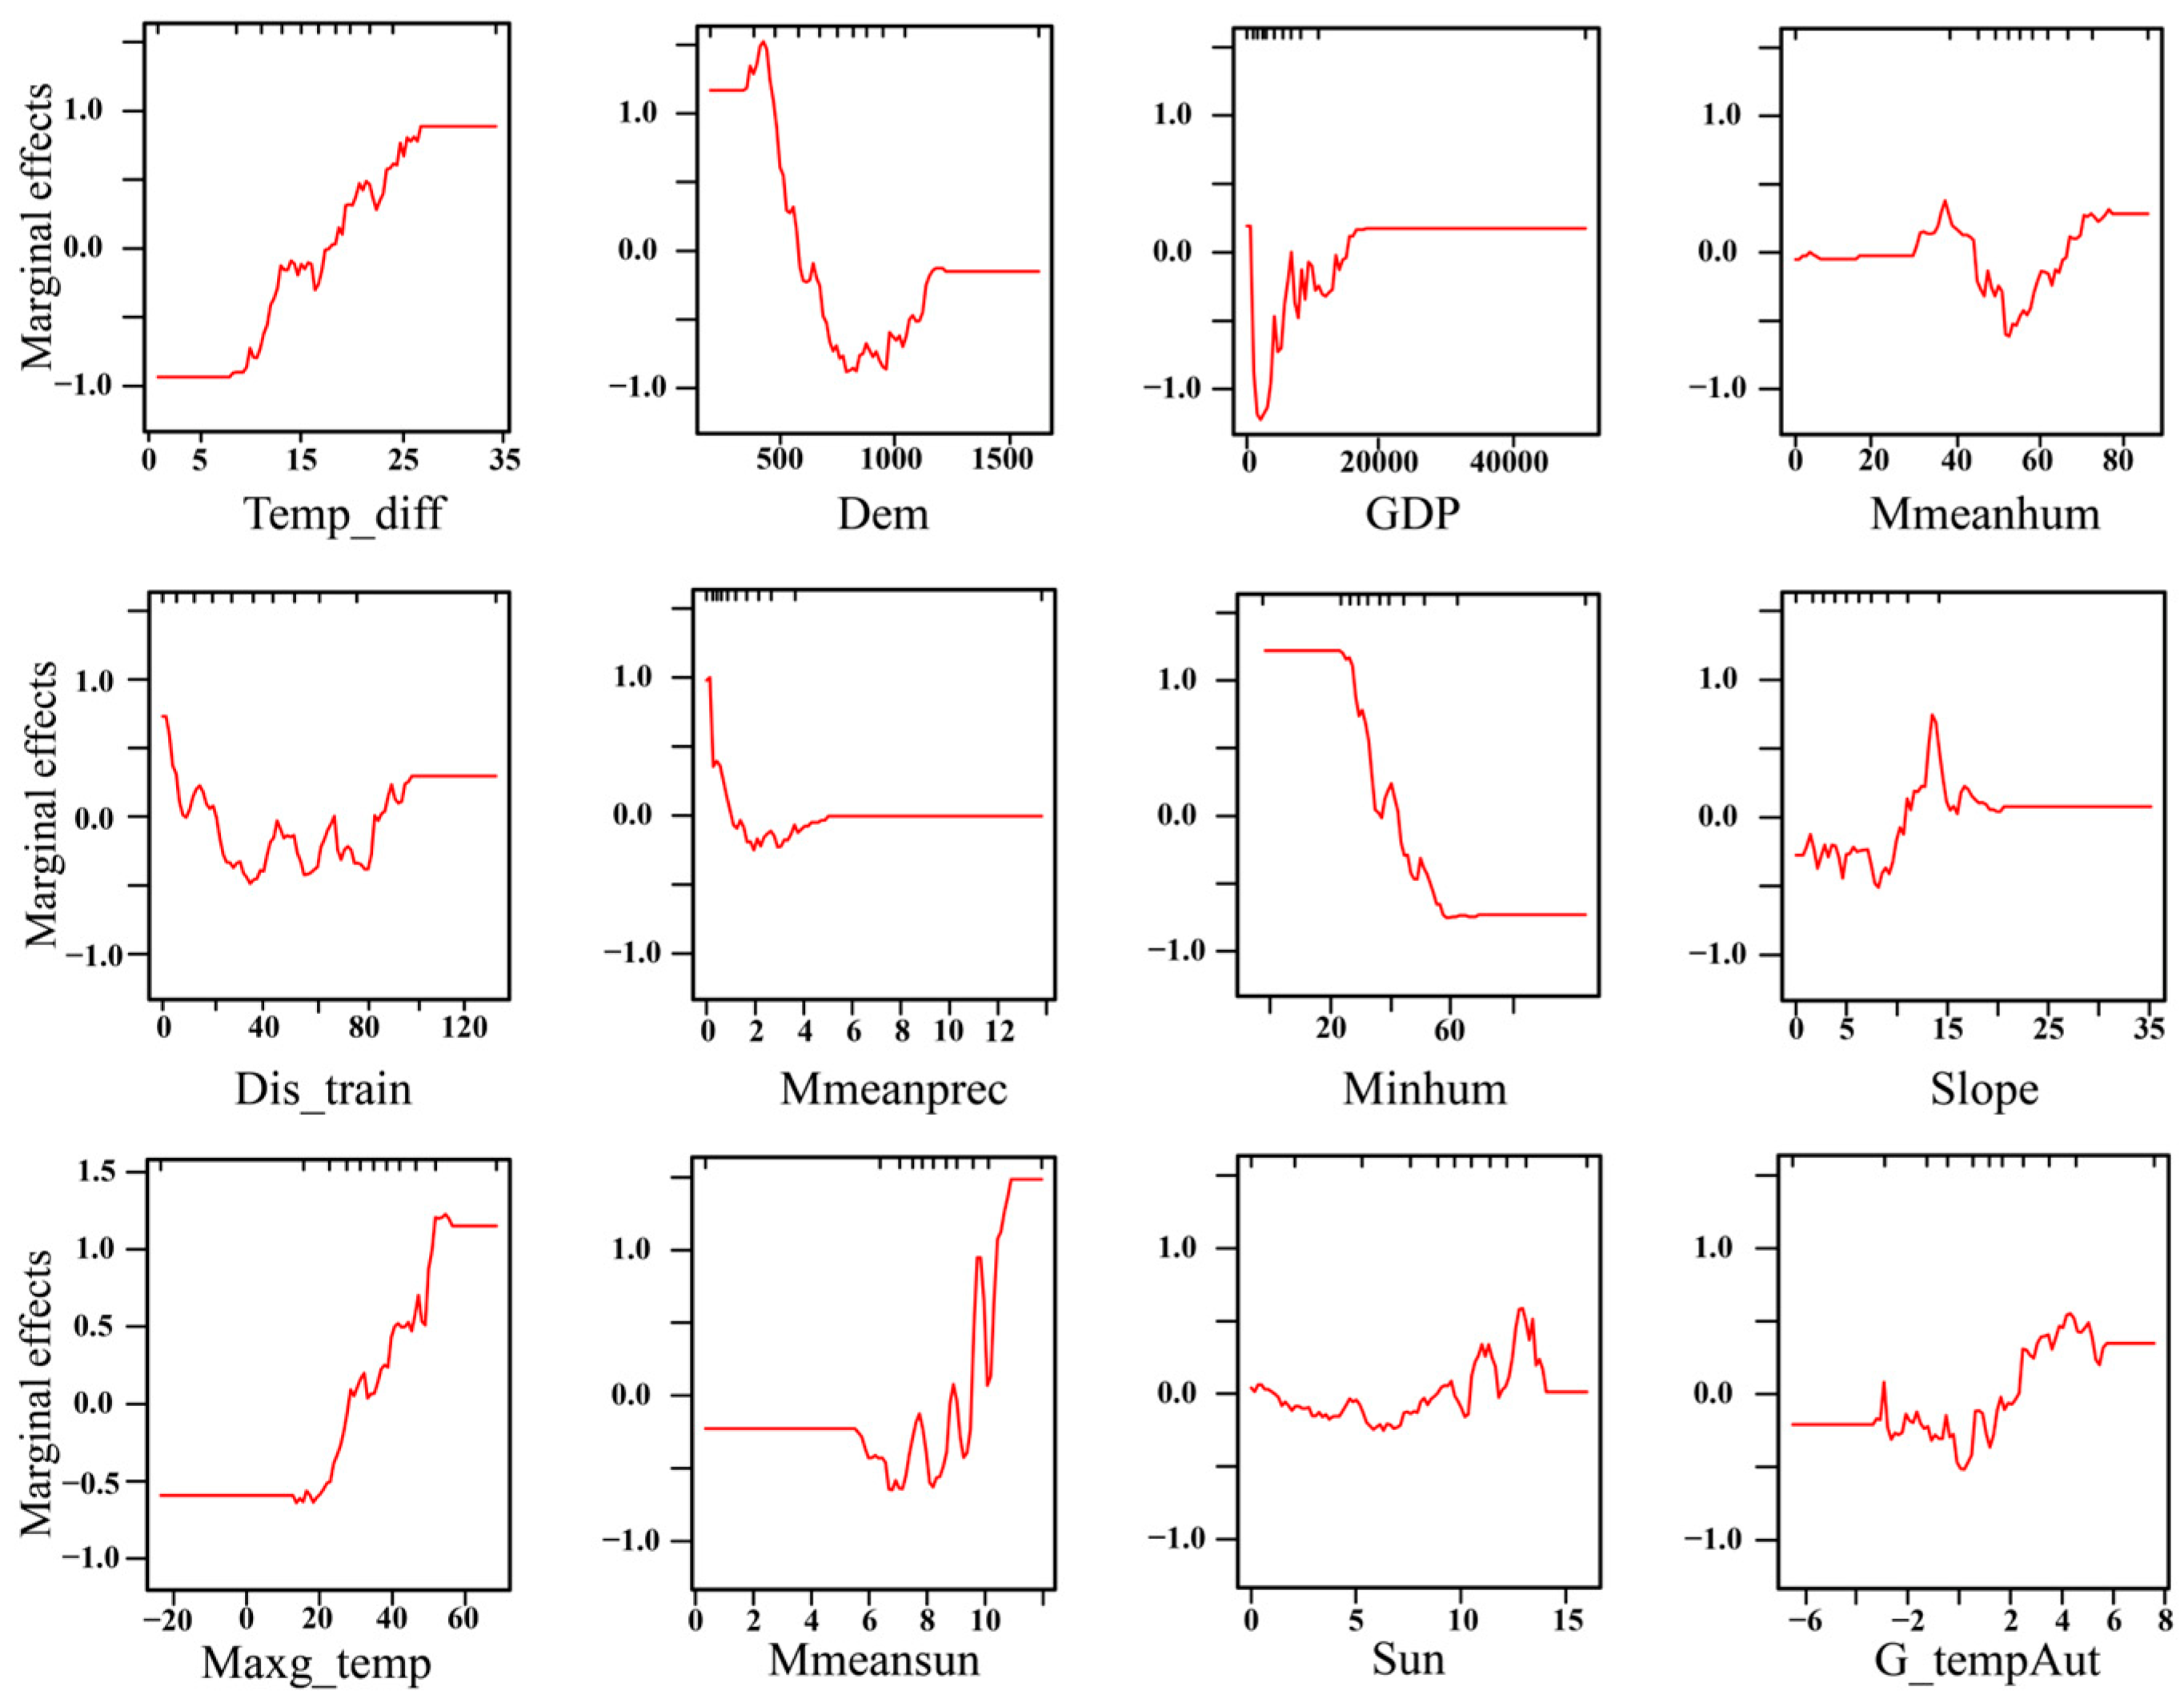
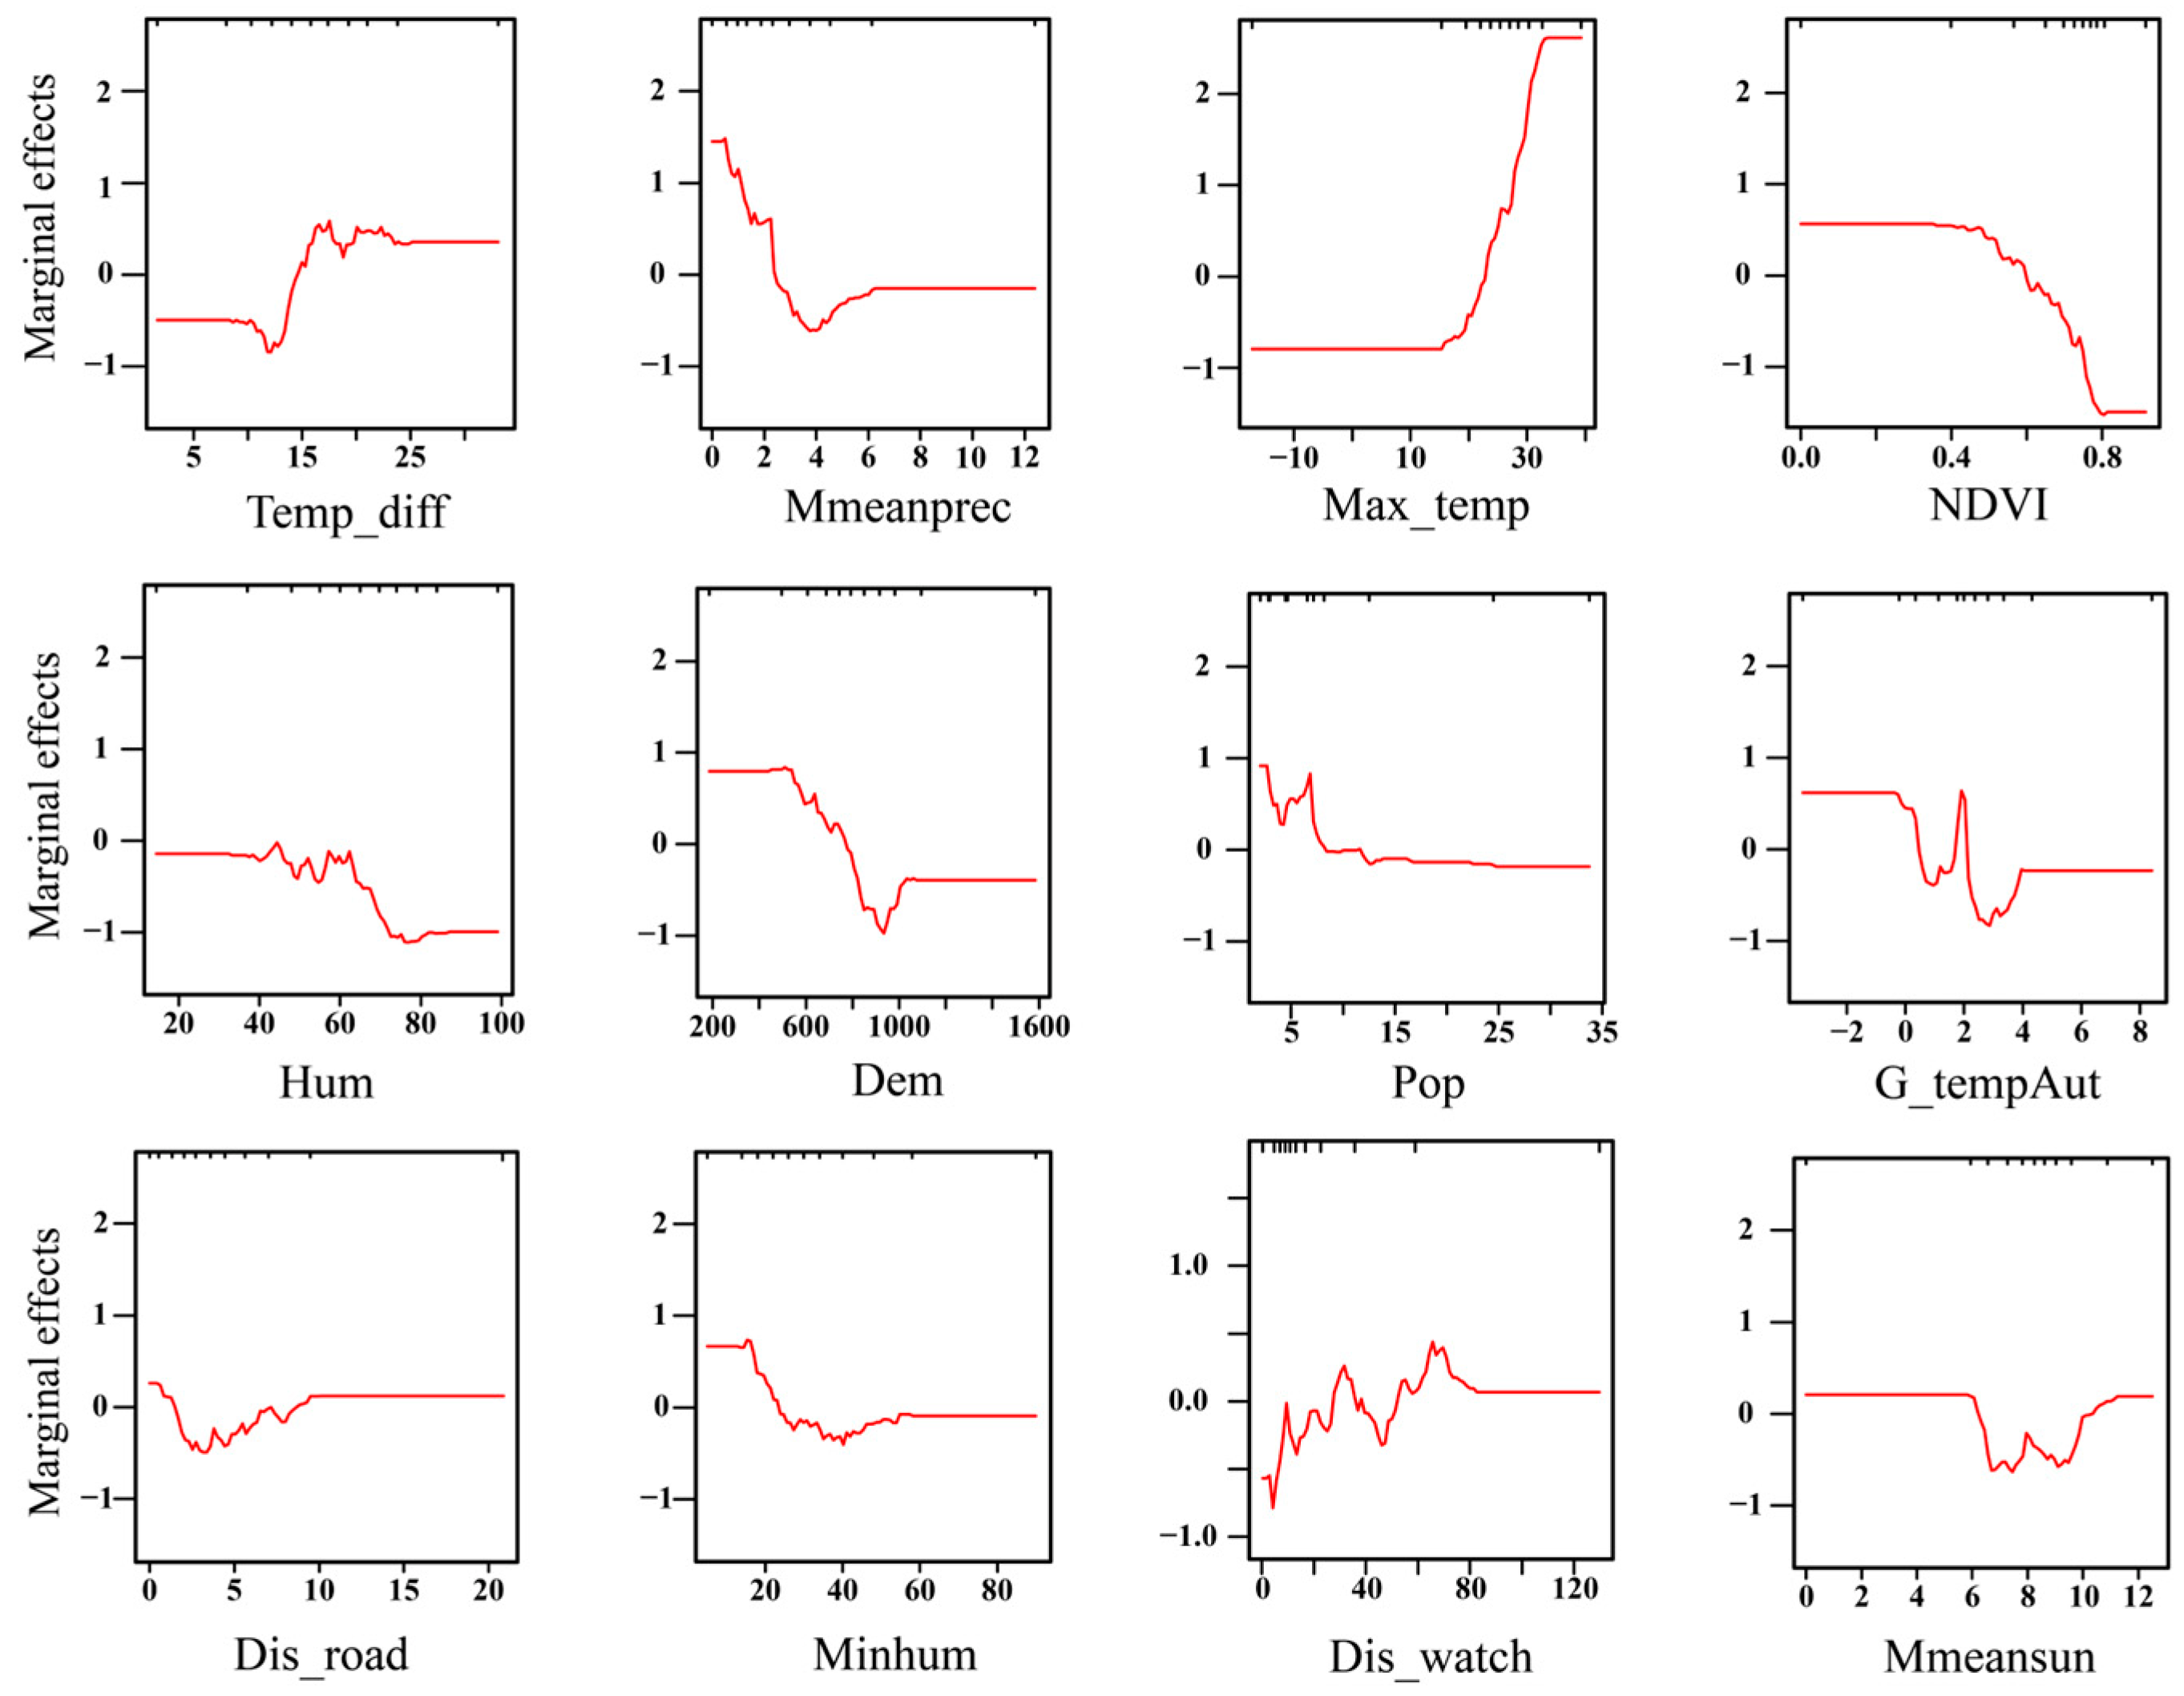
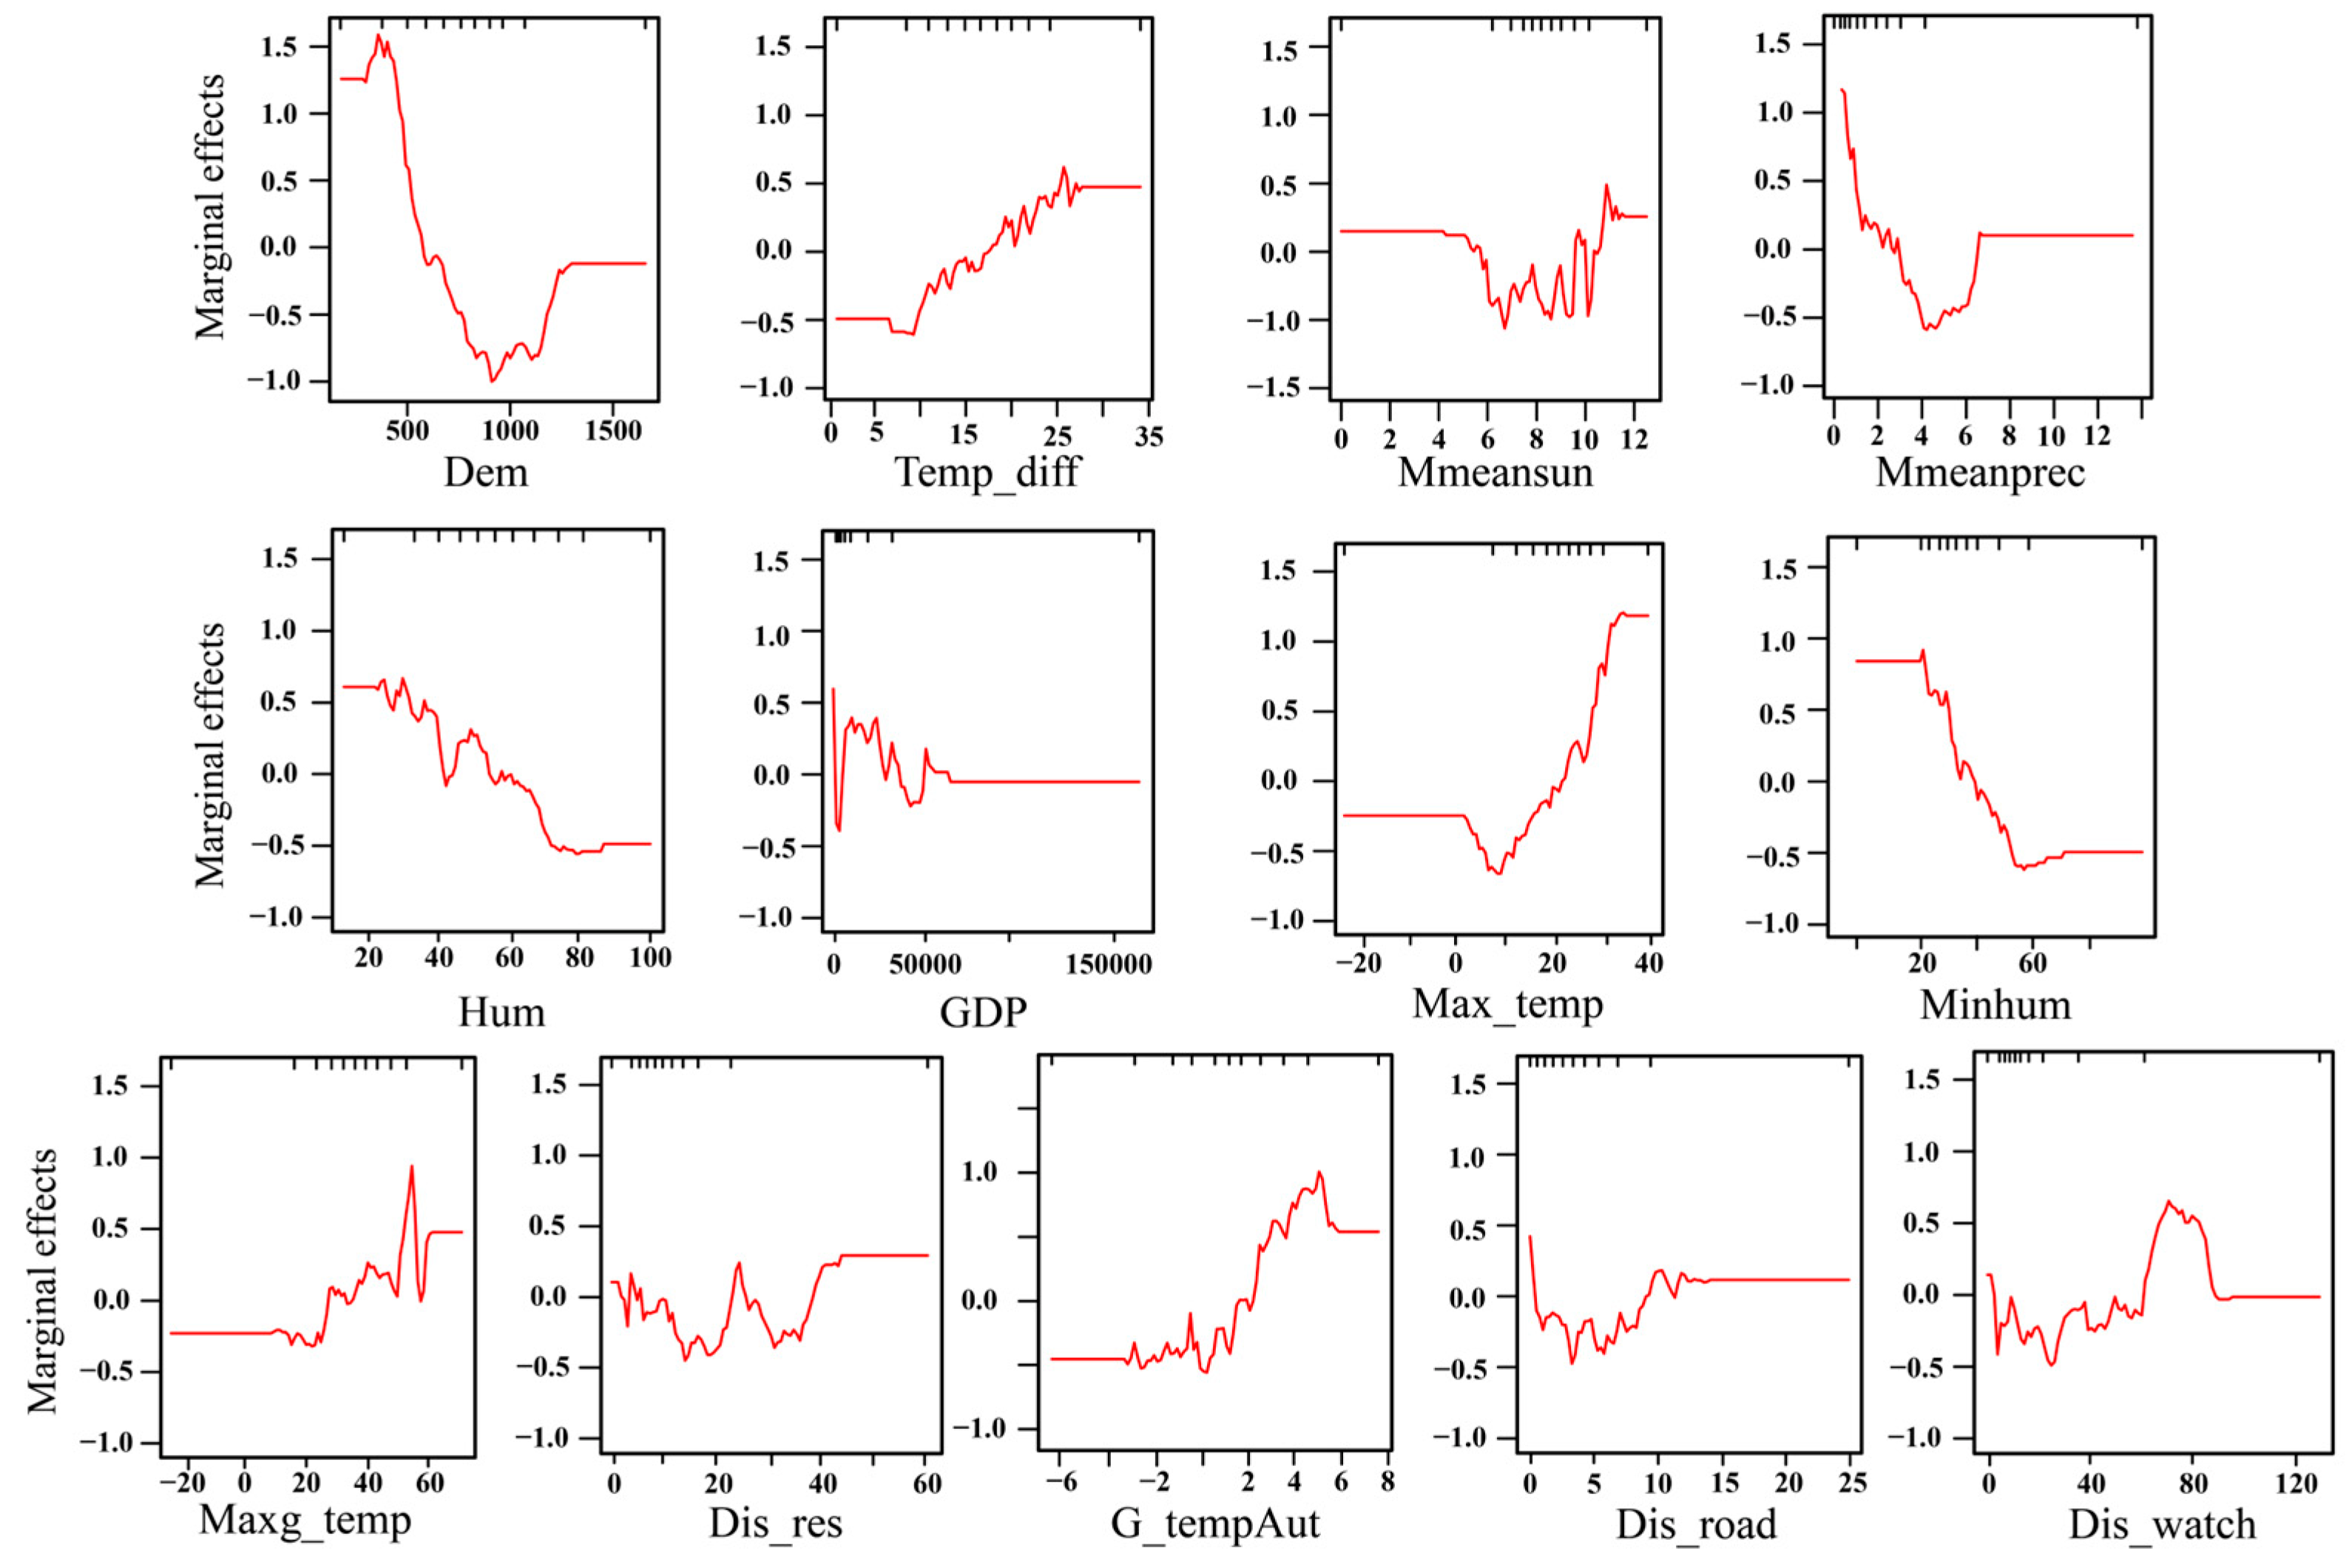
3.2. Identification of Drivers during Different Periods Using the BRT Model

We used the “gbm.simplify” function in the “gbm” package in R studio to test five training samples for abandoning unimportant variables. The “gbm.simplify” function allows the abandoning of unimportant variables among multiple variables to optimize the prediction accuracy of the model. We kept the variables that were not abandoned three times or less in the five training samples, and these variables were regarded as important variables (Table 3). Finally, 12, 12, 12, and 13 variables were entered into the fitting phase of the model as the main forest fire drivers for the four periods, respectively. The key parameters of the BRT model in the four periods are shown in Table 4.

3.3. Ranking the Importance of Drivers

Nearly half of the important variables that were excluded were climate factors. The model selection of significant variables suggests that fire occurrence was significantly influenced by altitude, daily mean relative humidity or minimum relative humidity, and daily temperature range. Humidity and precipitation are significant monthly factors that influence the occurrence of fires. We also found that some indicators in the autumn fire prevention period in the year before the fire had a significant impact on the fire occurrence in the four periods, such as the average sunshine and average surface temperature during the autumn fire prevention period in the year before the fire occurrence. Altitude and topographic factors in all the models during all four periods showed a significant effect on fire occurrence, and its importance level decreased during Periods 1–3. Vegetation type had a significant effect during Period 3, and NDVI was also important during this period. Socioeconomic factors, such as the average population density or GDP per capita, were important at least once during each of the four periods. During Period 1, the location of residential areas (Dis_res) had a significant impact on the occurrence of fires, but this effect vanished in Periods 2 and 3. Figure 5 depicts the aforementioned data.

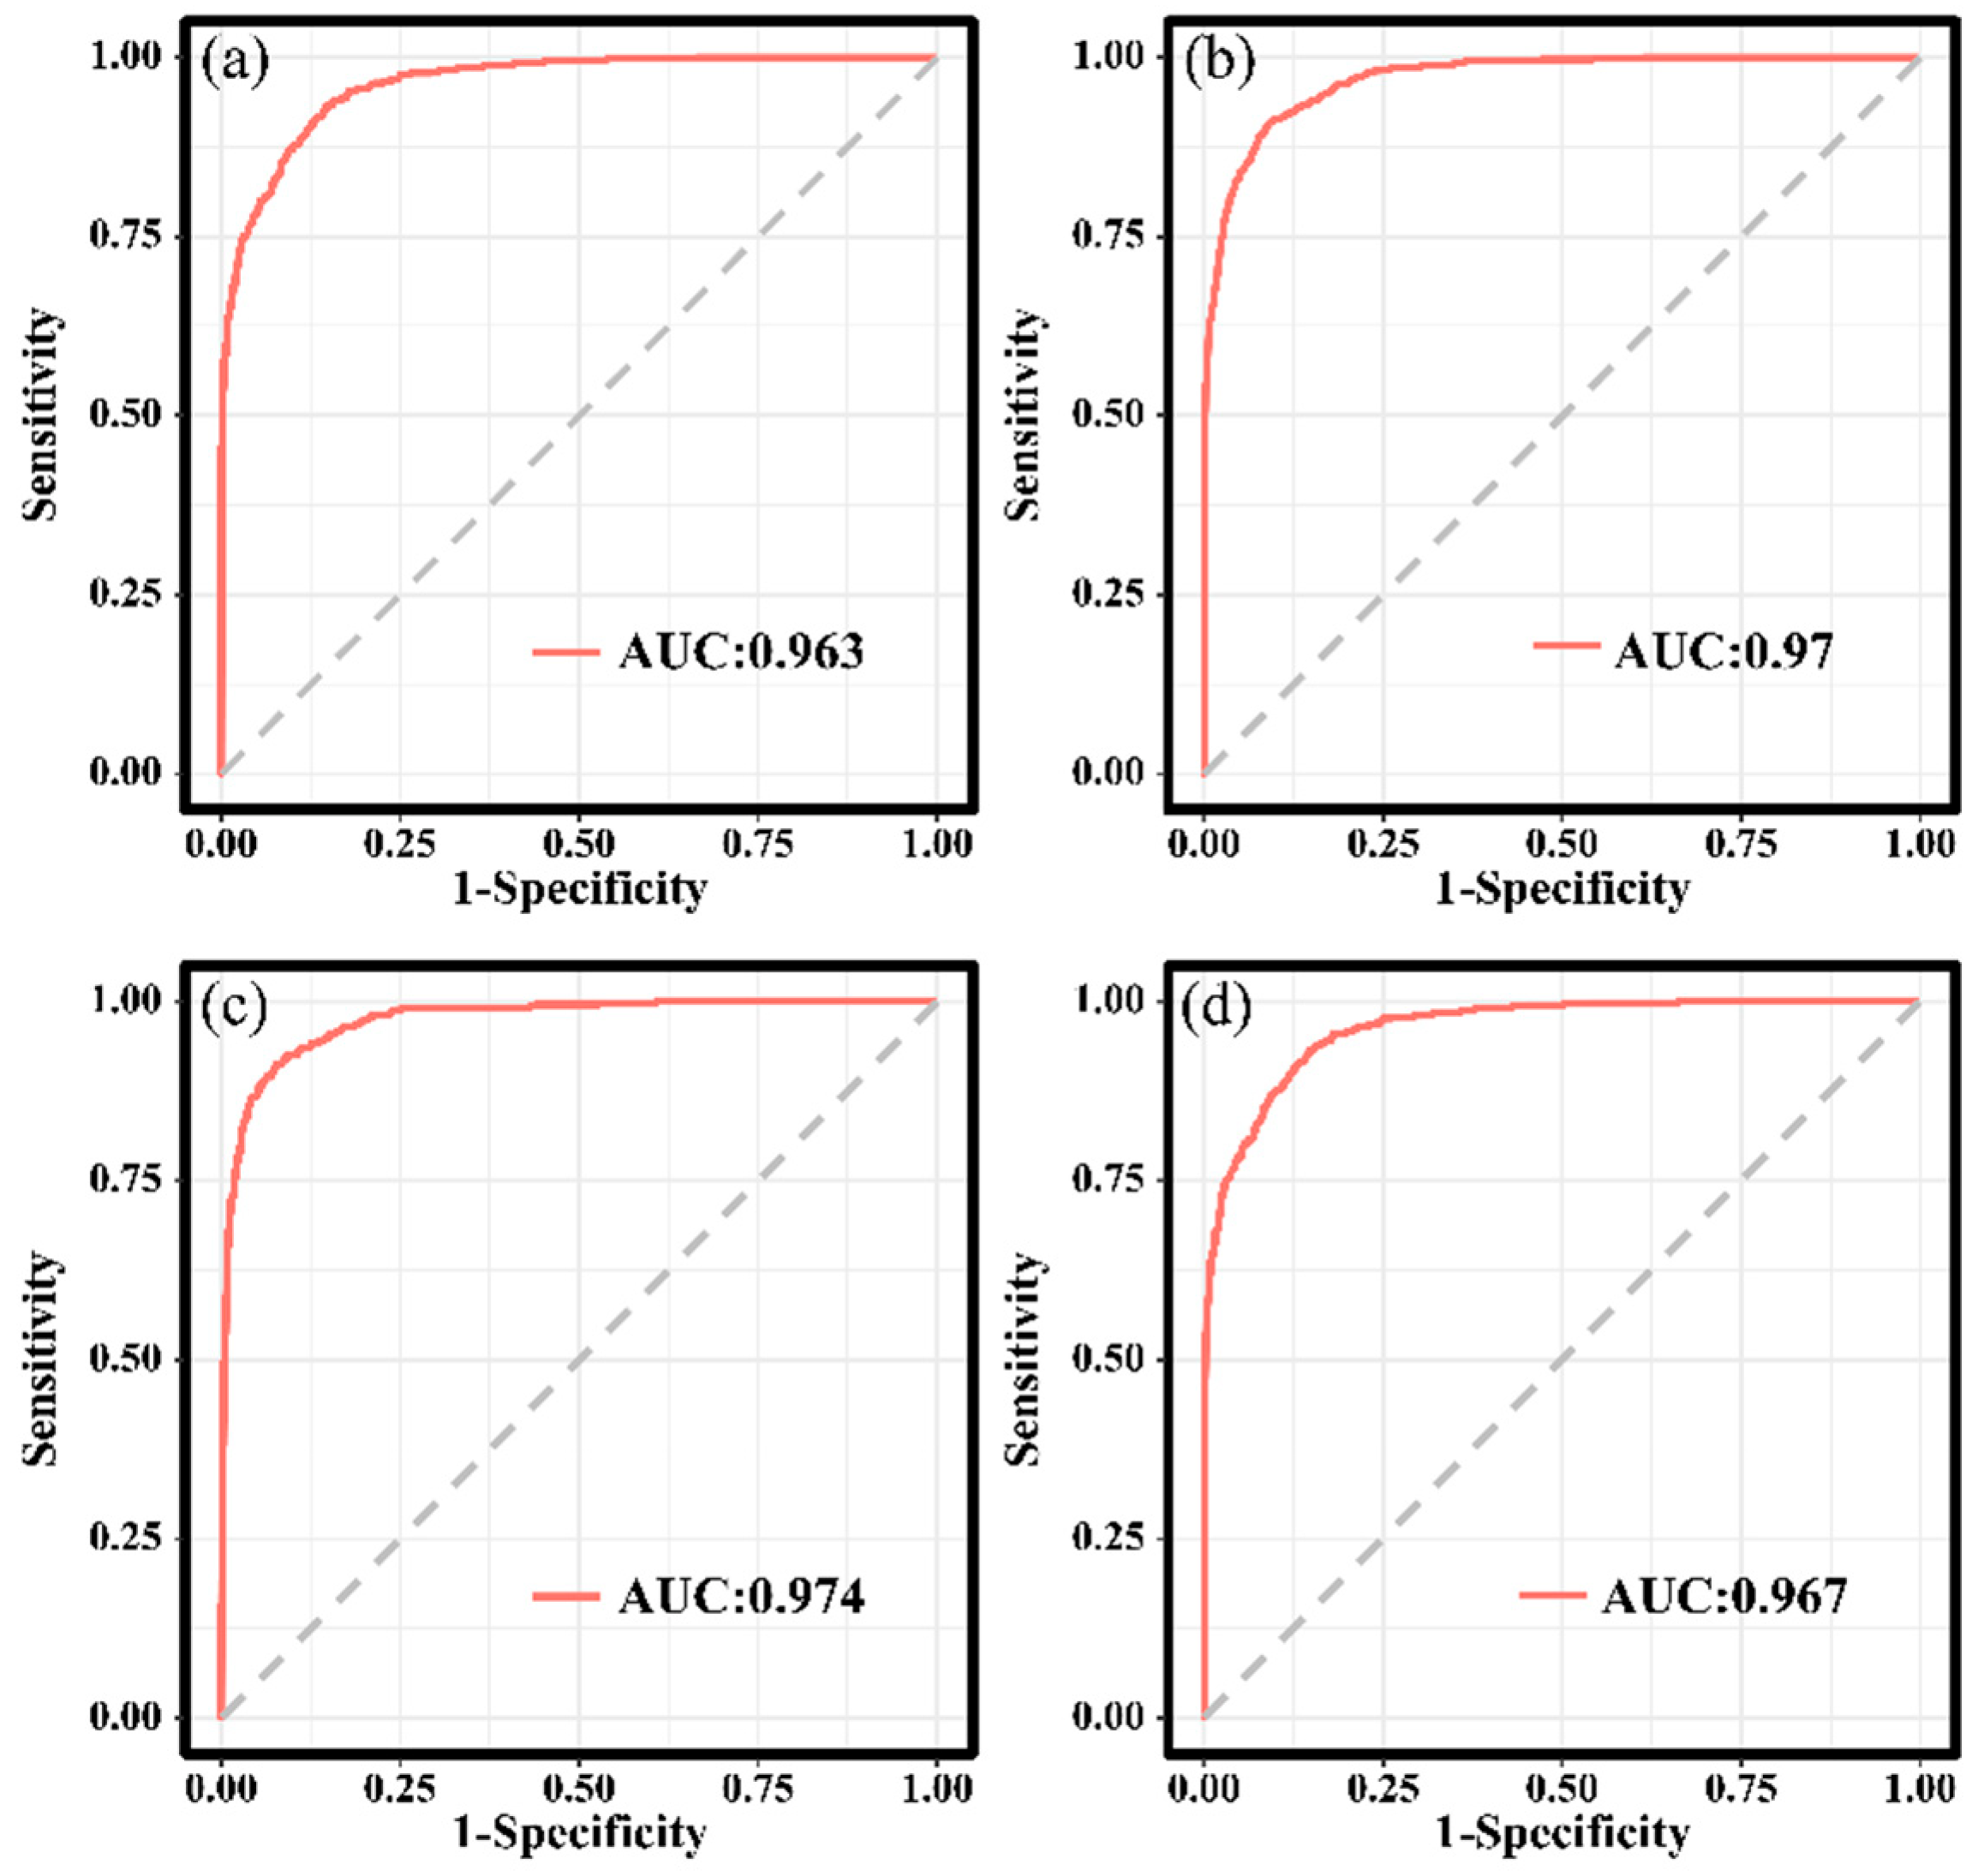
3.4. Model Performance and Prediction Accuracy

We calculated the prediction accuracy of each sub-sample and the entire dataset, as well as the AUC value under the ROC curve and the corresponding cut-off value, to test the BRT model’s ability to predict (Figure 6). The results showed that the AUC values of the BRT model in the four periods were all greater than 0.9, and the prediction accuracy was greater than 80% (Table 5), indicating that the model fits well in the four periods. In general, the AUC value was ranked as Period 1 < Period 2 < Period 3 ≈ all years, and the AUC value of Period 3 was generally slightly higher than that of all the years.
We used the full sample fitting results of the BRT model and used the “gbm.plot” function in the R language to plot the marginal effects between the forest fire occurrence and main forest drivers (Appendix A, Figure A1, Figure A2, Figure A3 and Figure A4) to analyze the influence range of the variables selected in different periods on the probability of forest fire occurrence. The ordinate represents the marginal effects, and the higher the value, the greater the probability of fire occurrence.

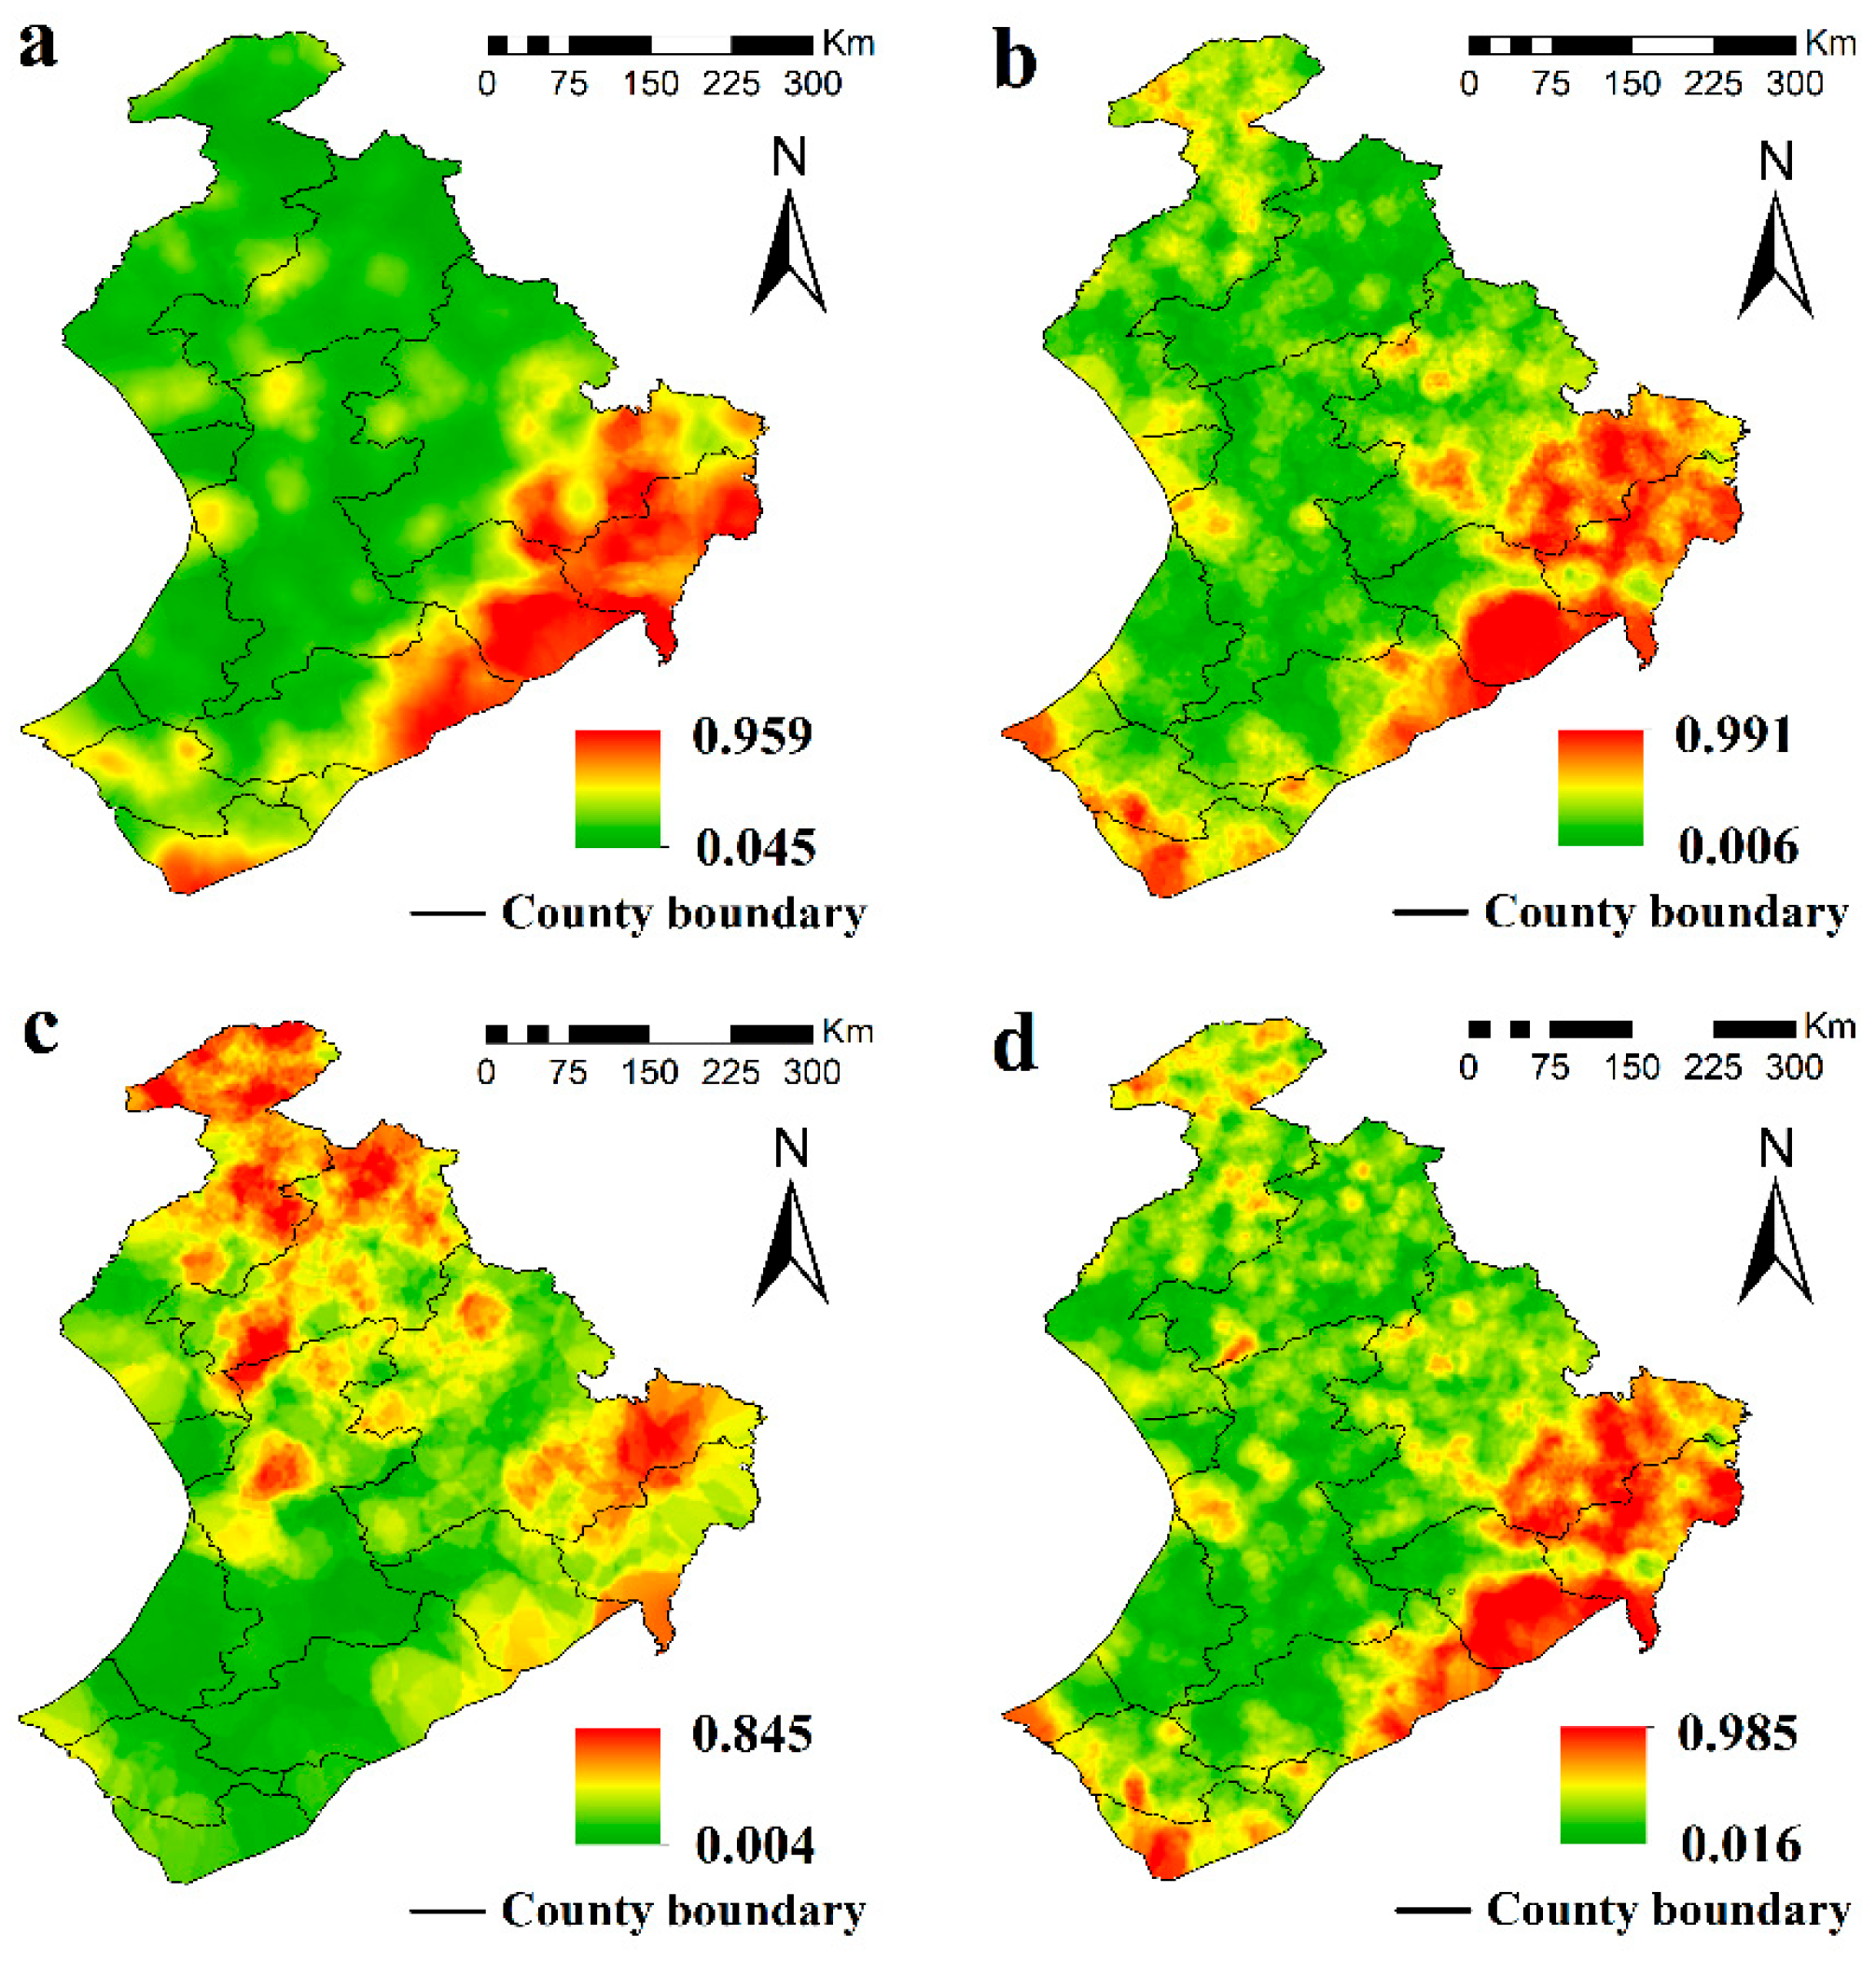
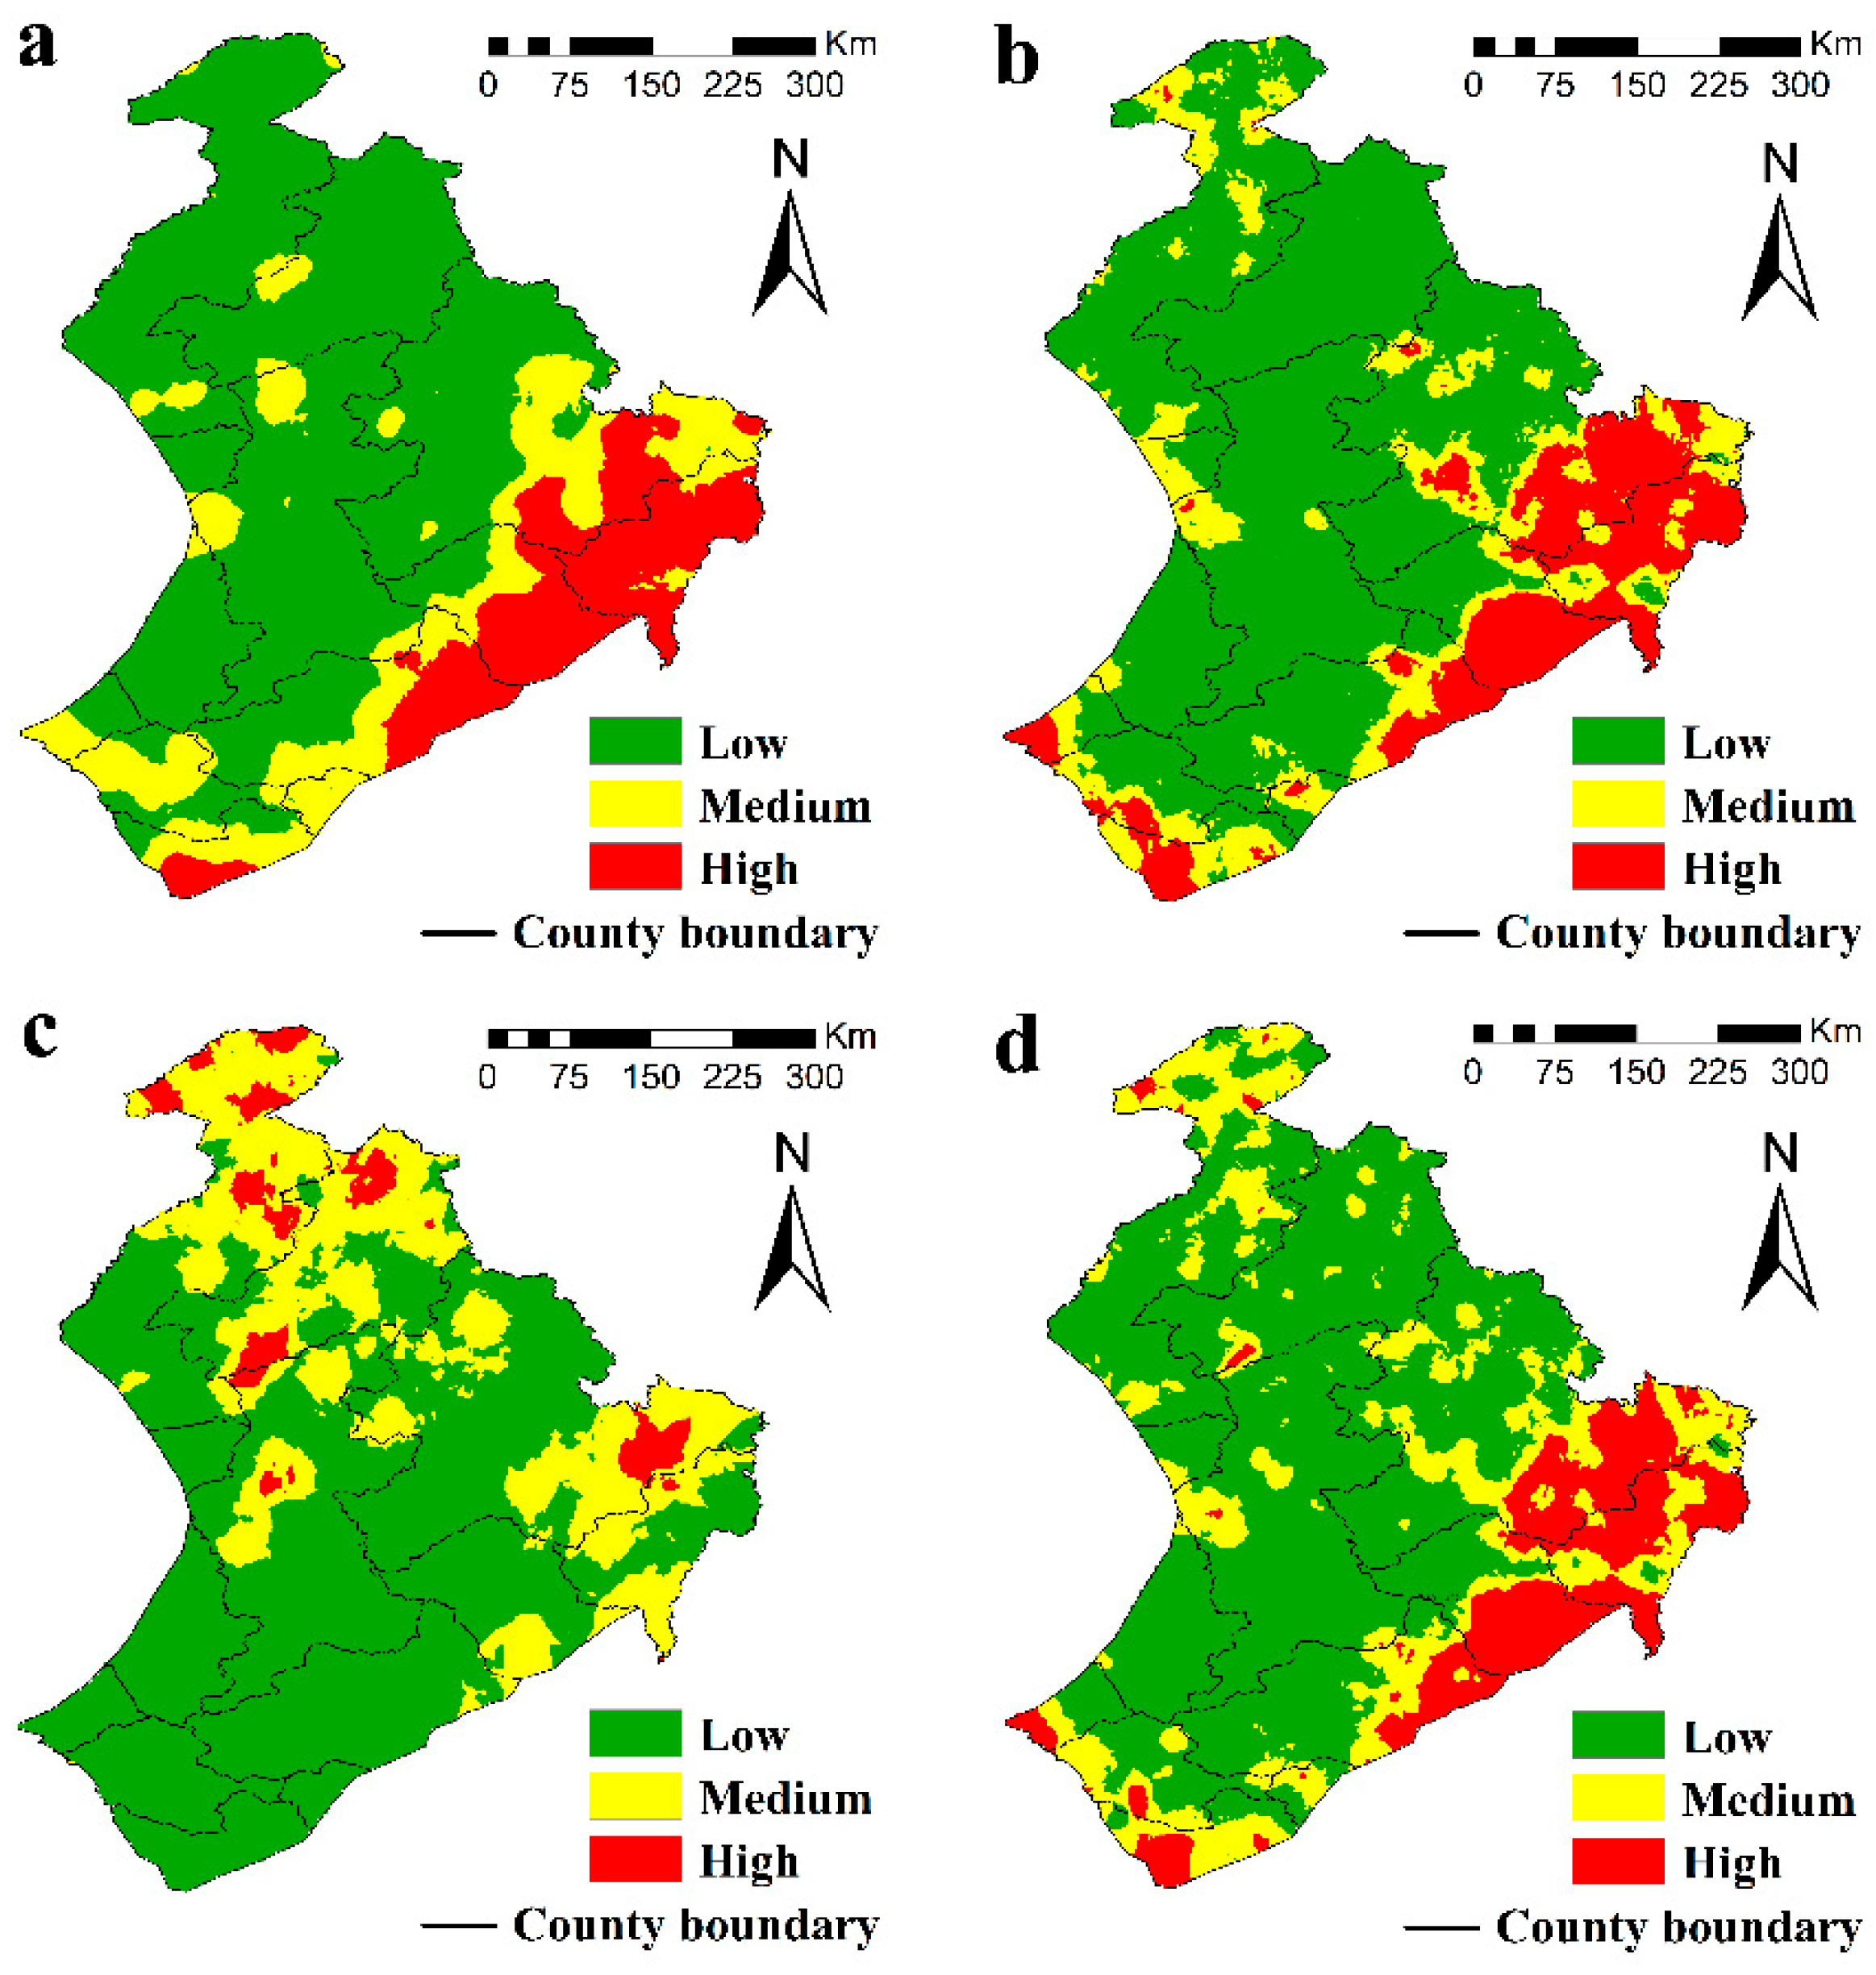
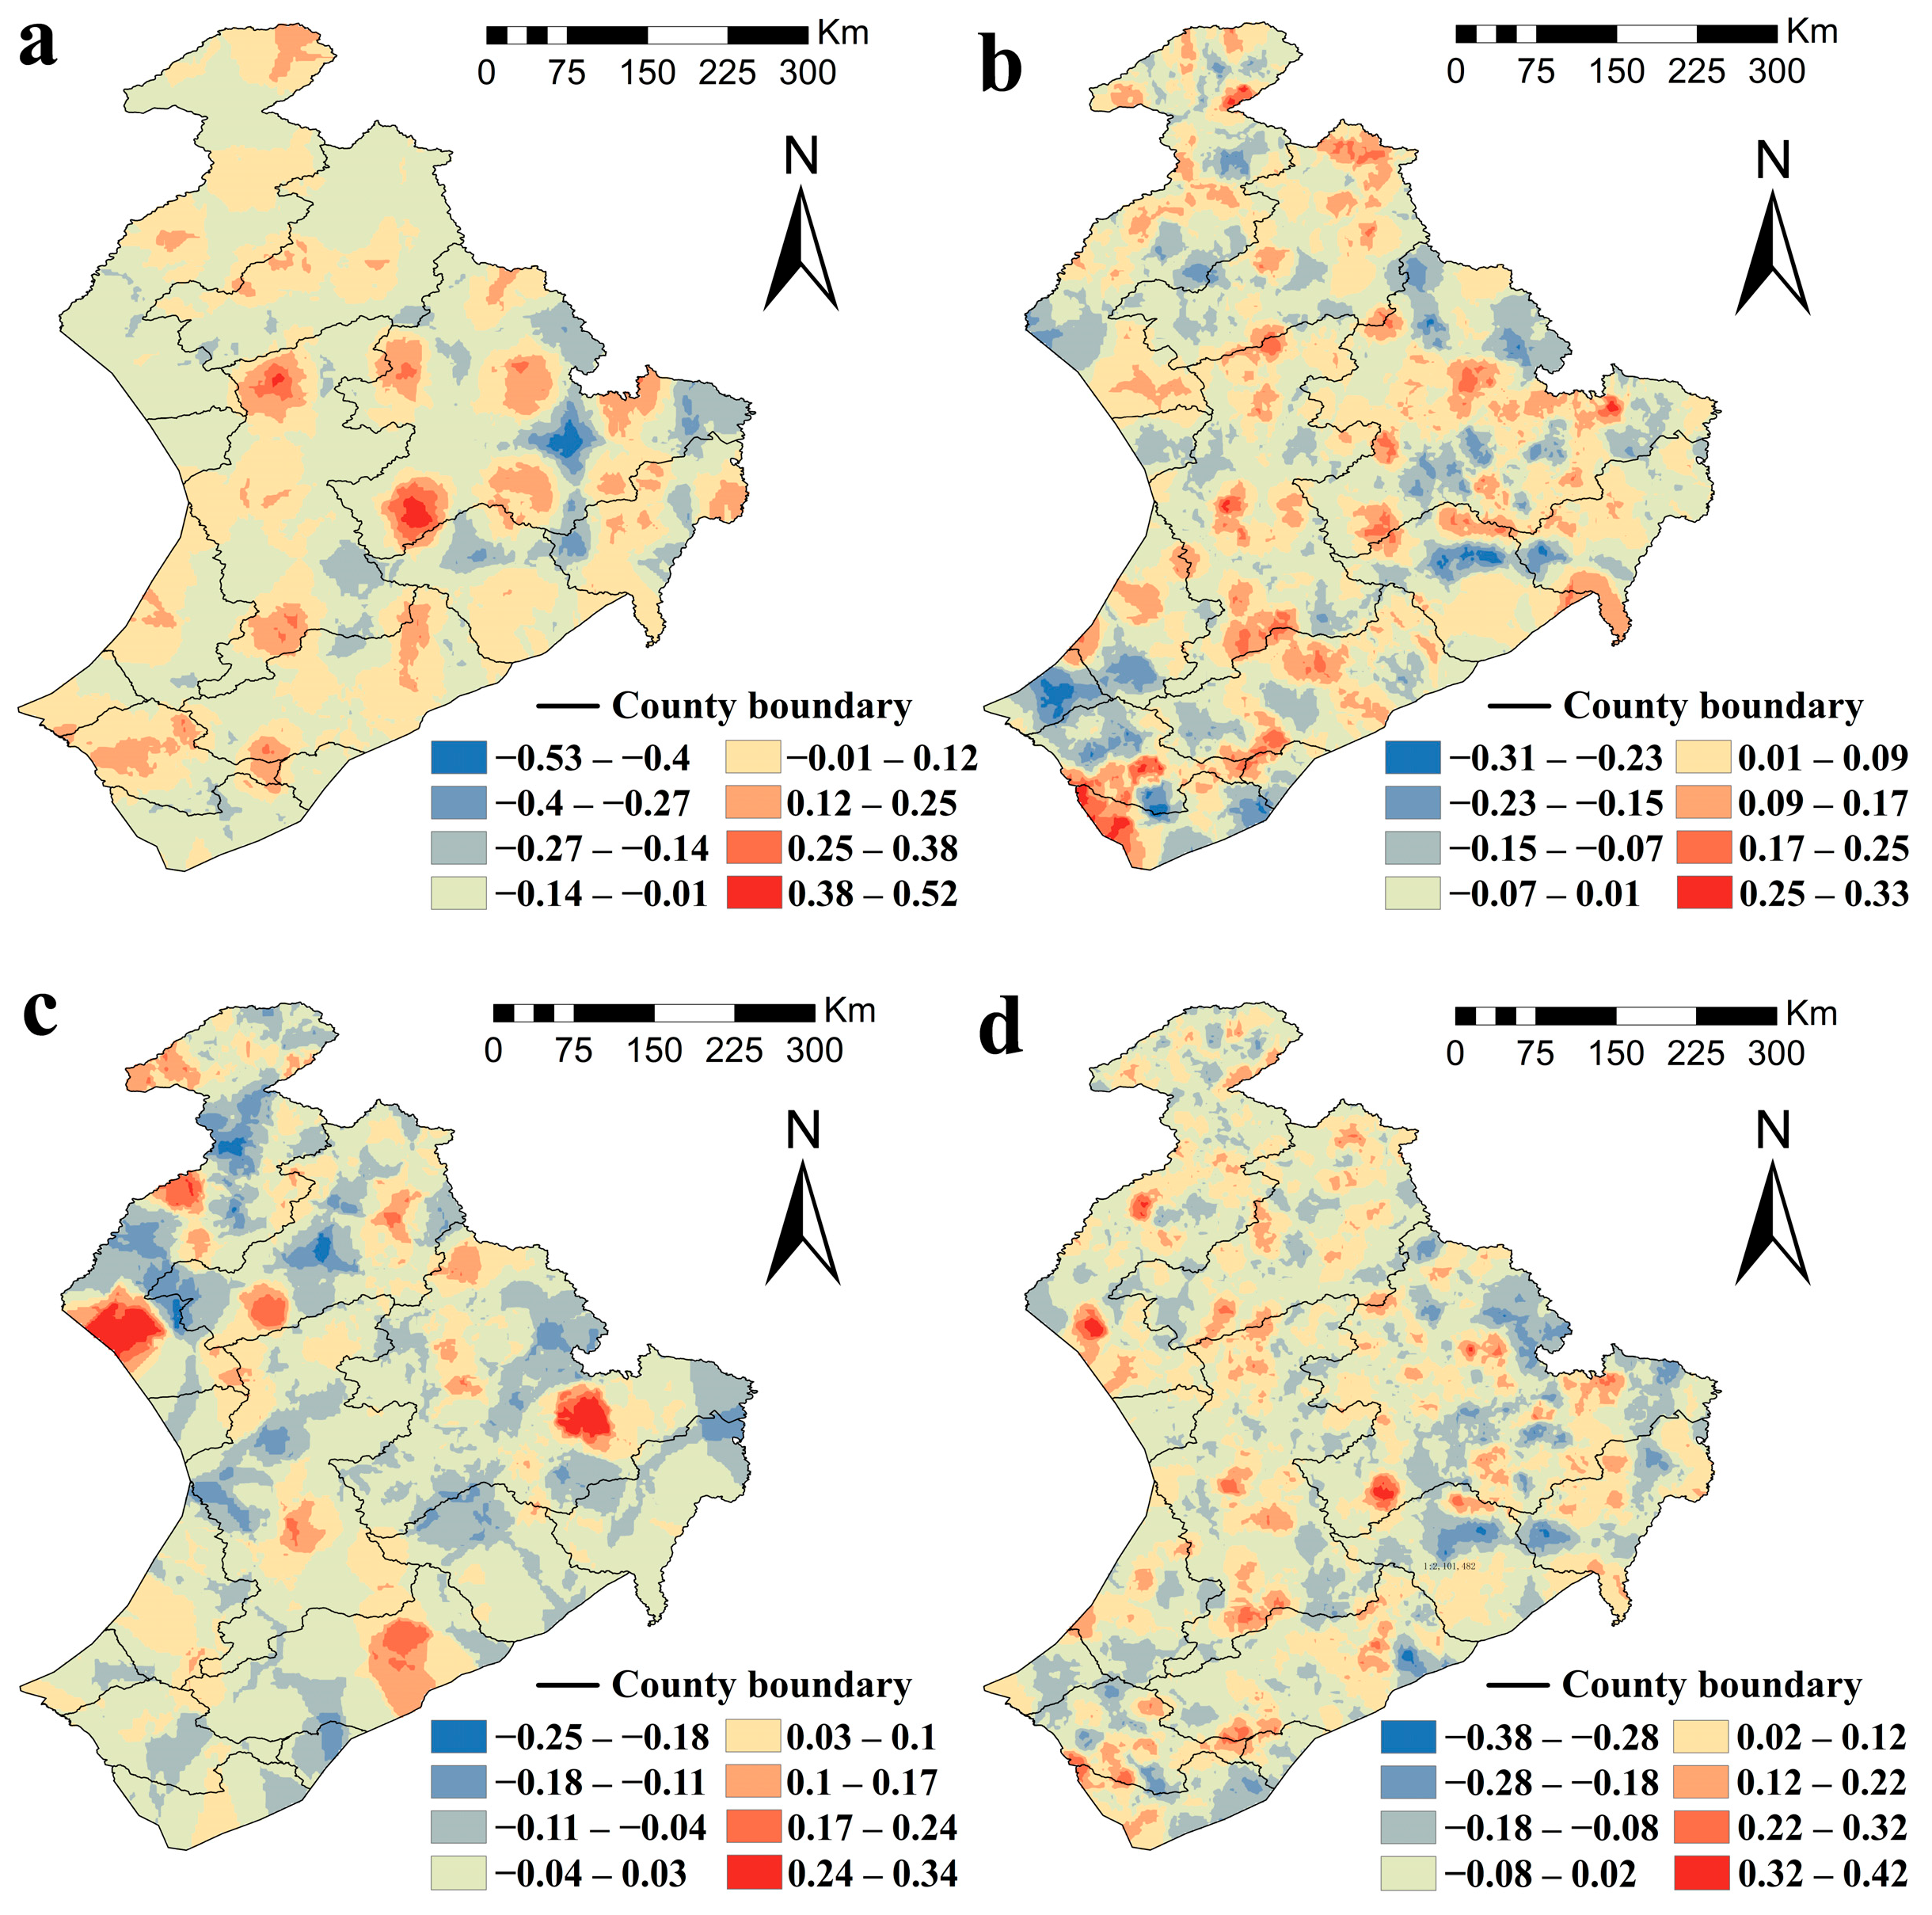
3.5. Mapping the Likelihood of Fire Occurrence and Fire Risk

We then drew the forest fire probability map and the fire risk zone map (Figure 7 and Figure 8) (a 0 cut-off point was a low fire risk area, a cut-off points up to 0.6 was a medium fire risk area, and 0.6 to 1 was a high fire risk area), according to the final model of the BRT model in the four periods. The findings indicated that, within a larger region to the east and southeast of the study area, the areas with a high probability of forest fires during Periods 1 and 2 were primarily concentrated. The areas with high a probability of forest fire during Period 3 were different from the first two periods, mainly in the north and northeast, and the area with a high probability of fire in the east decreased. The areas with a high probability of forest fire were also concentrated in the east, southeast, and south, and the fire risk for the entire period was comparable to that of Period 2. It is worth noting that for all years, the border areas of China-Russia and China-Mongolia have had a high fire risk. In addition, although the number of “border-crossing” fires was not high, weak fire prevention facilities in the border areas and different fire management systems, and difficulties in coordinating the cross-border firefighting efforts led to the fact that the area of crossing fires was generally large and there was a great risk potential.
The model’s residuals were calculated and plotted to determine the model’s goodness of fit. Figure 9 shows that there were clusters of positive residual areas (underprediction) in the south and center of the study area in Periods 1 and 4, while clusters of negative residual areas (overprediction) were found in the east. Positive residual areas were observed in the south of the study area by the models during Period 2. Positive residual areas were relatively concentrated in the northwest, southeast, and center of the study area during Period 3 of the models. The model had more positive residuals throughout the entire time period, but there was no large cluster area.

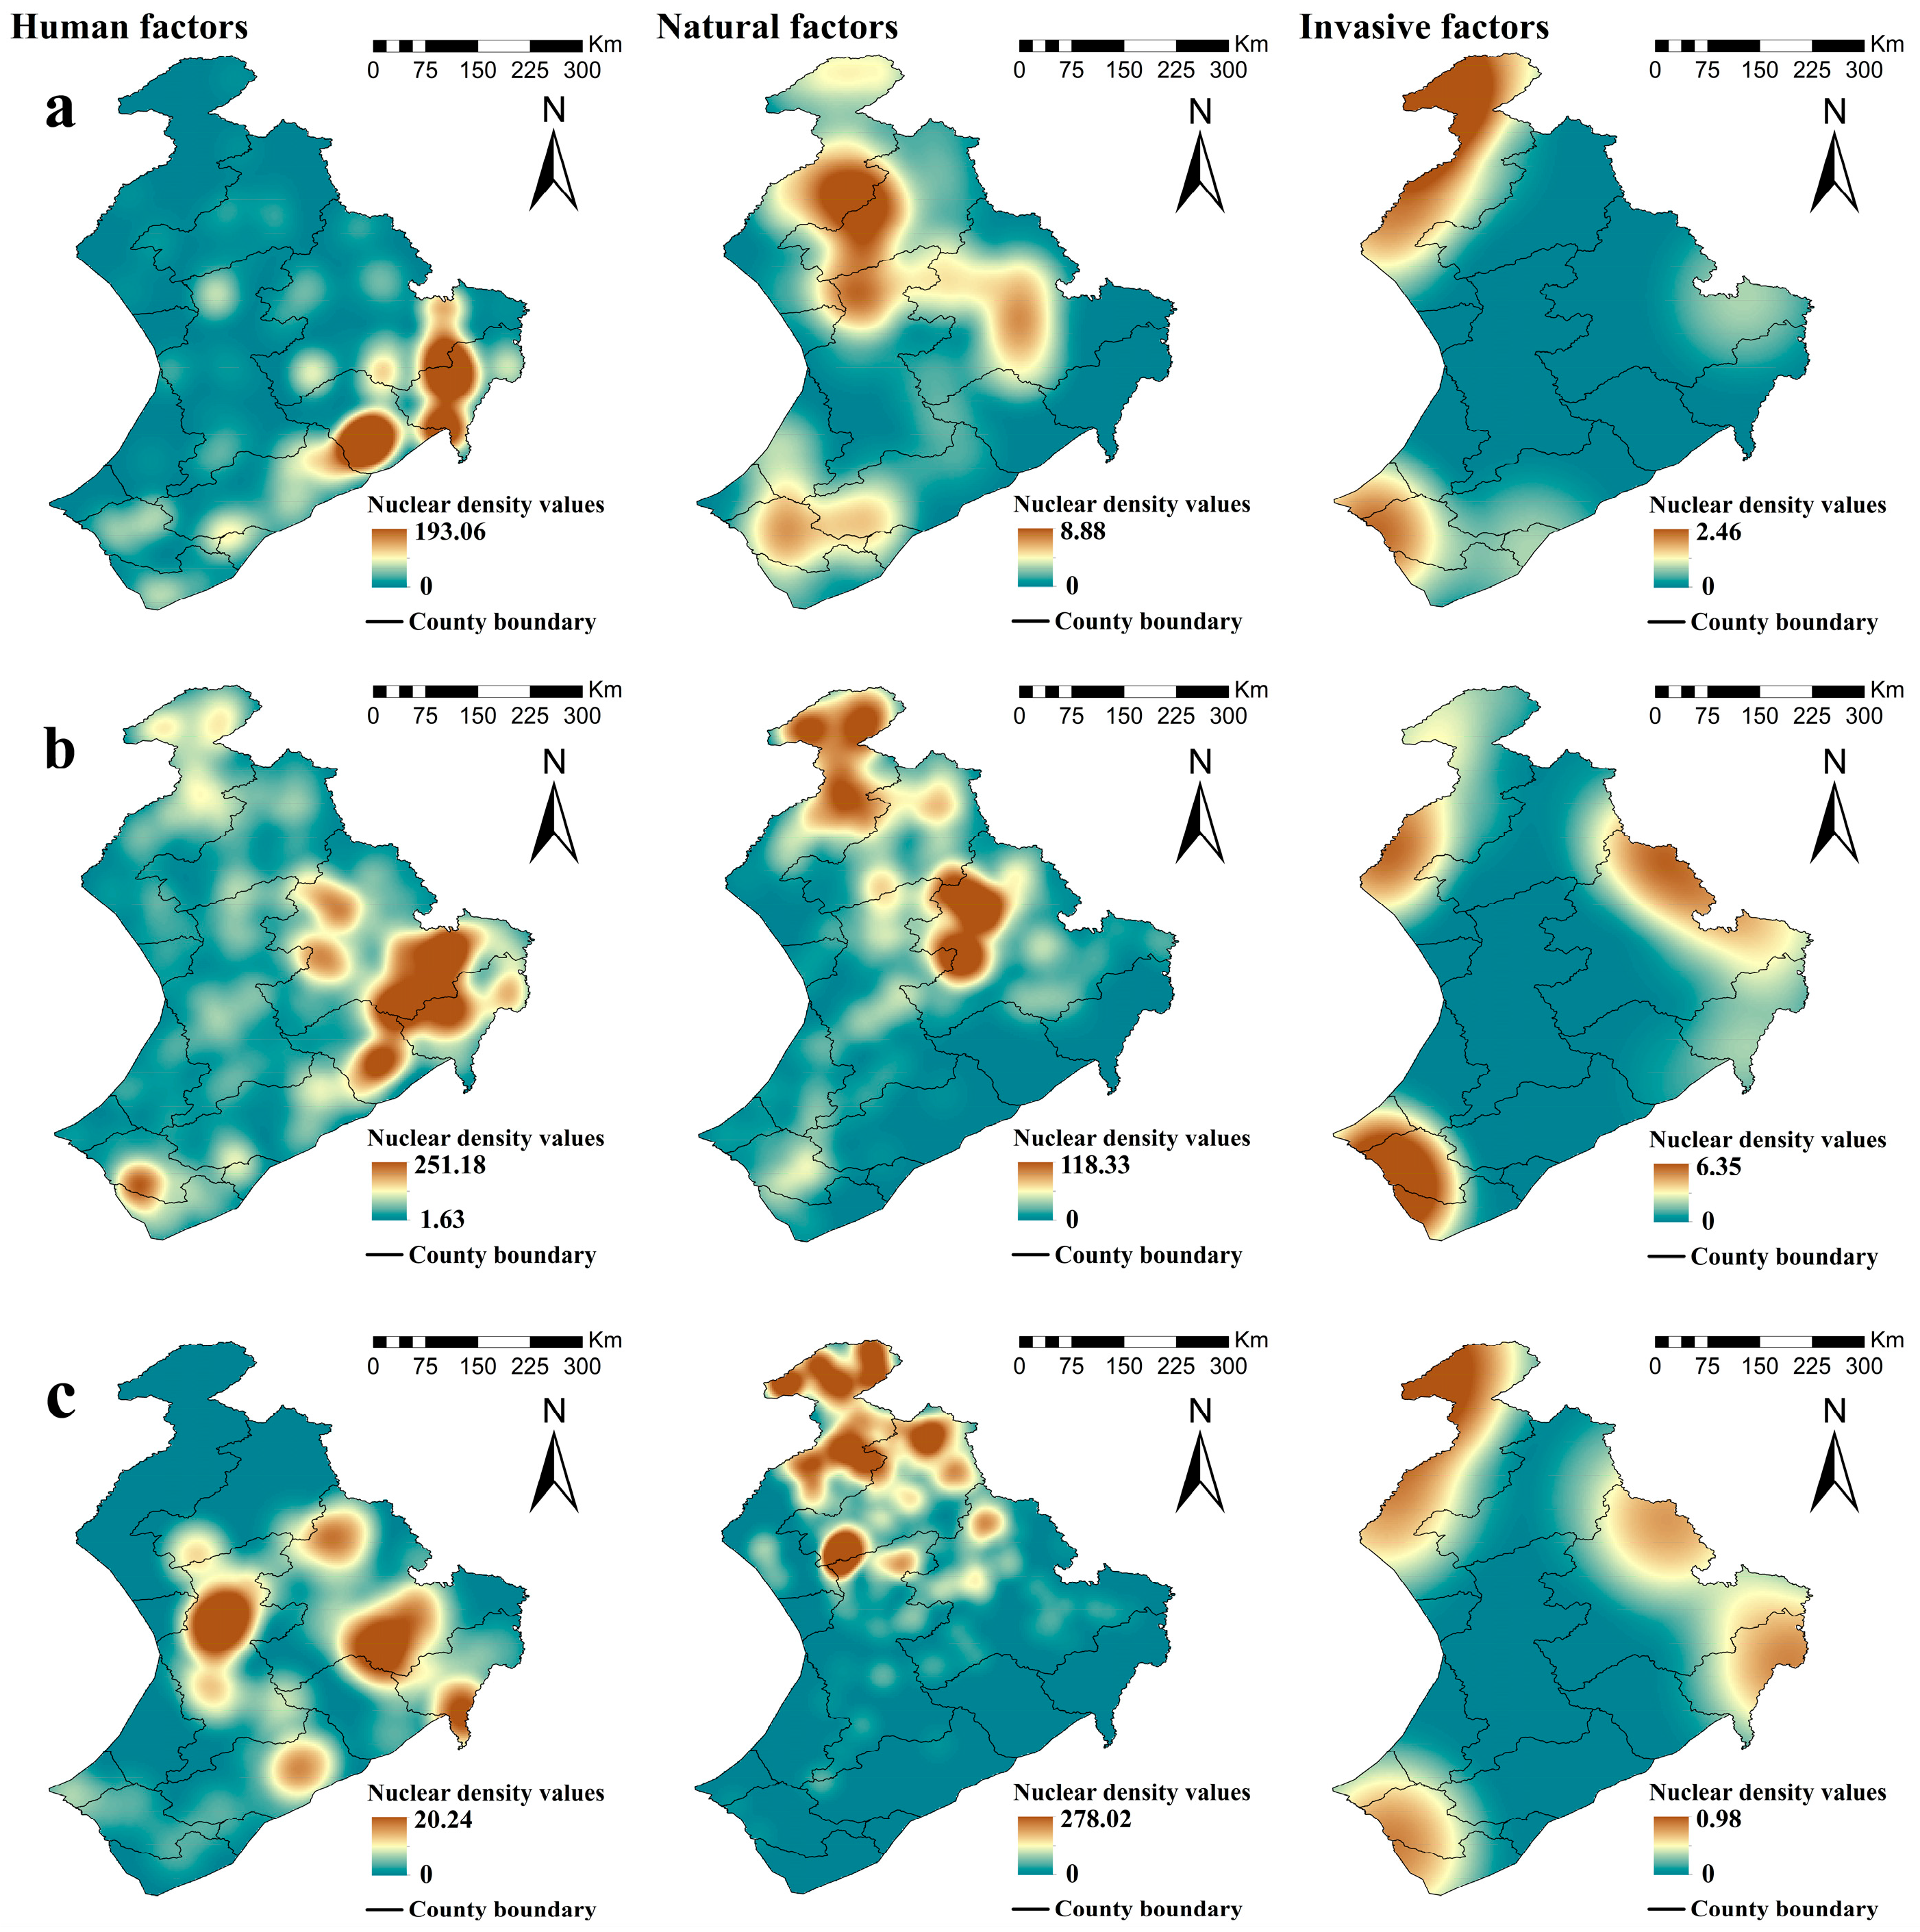
3.6. Kernel Density Analysis of Different Disaster-Causing Factors in Different Periods

Fires caused by human factors in the three periods were mainly concentrated in the eastern part of the study area (Figure 10), while the distribution of natural factors (lightning fires) was mainly concentrated in the northern part of the study area, and there was a tendency to shift to the north with increasing fire density values. Combining Figure 10 with Figure 7 and Figure 8, we can see that the eastern part of the study area has a higher probability of fire occurrence in different periods. The gradual northward migration of the fire occurrence probability in Periods 2 and 3 in Figure 7 and Figure 8 may be related to the migration trend of lightning strike fires. The northeastern and southwestern parts of the study area have been invaded by foreign fires at various times, and the northeast also has a high fire density, so it is important to guard against fires from other provinces and cities as well.

4. Discussion

4.1. Changes in Forest Fire Risk Zones and Fire Causes in Different Periods

The kernel density analysis graphs over different periods (Figure 10) show that the aggregation of anthropogenic factors and natural factors are not the same in different periods. In addition, the medium and high fire risk areas during Period 1 and Period 2 were very different from those during Period 3, mainly because the risk of forest fire in the north of the Daxing’an Mountains in Inner Mongolia was low before 15 March 1988, and the risk increased after this period (Figure 7 and Figure 8). The northern part of the Daxing’an Mountains in Inner Mongolia is an undeveloped northern primeval forest area. For a long time, there have been few fires caused by human factors, especially before 1987. The proportion of lightning strikes as the cause of all forest fires in this area has been increasing in recent decades [50]. After 1987, the number of human-caused fires decreased (Table 2), mainly because regulations changed human activities during the fire season (all persons were prohibited from using wildfires during the fire season), thus reducing human-caused fires. At the same time, the number of fires caused by lightning strikes has increased significantly. For example, in the northern primeval forest area, on the Qiqian Forest Farm on 2 July 2017 and Uma Forest Farm on 27 July 2002, there were huge forest fires caused by lightning strikes. Another important reason for the increase in the probability of forest fires in this area after 1987 is the burning from abroad. For example, on 30 April 2014, in the Yimu River area of the Uma Forestry Bureau and on 2 May 2003, in the Heishantou area of Erguna City, a huge forest fire occurred in the Russian borderland region, which undoubtedly increased the fire risk in China. Both before and after the regulations were written, there was typically a high likelihood of fires occurring in the eastern portion of the study area. The reason for this is that the human gathering points in this area are relatively concentrated, and the road network density is high. After the 1990s, many tourist areas and forest trails were built, which greatly increased the possibility of fire caused by human factors. At the same time, the area is also prone to lightning strikes, making it a high-fire risk area.

4.2. Key Drivers and Their Changes in Different Periods

The key drivers affecting fire occurrence in different periods mainly include three variables: temperature, relative humidity, and surface temperature. The contribution of these climate-related factors are the main drivers of fires in the Daxing’an Mountains in Inner Mongolia, consistent with the research on the boreal forests of China [7,33,34,43]. Here, we discovered that some indicators of the fall fire prevention period are now significant factors that influence the occurrence of forest fires. There is always a correlation between the likelihood of a fire occurring and the average amount of sunshine hours and surface temperature during the autumn fire prevention period of the year prior to the fire. Zhao (2007) and Shu (2011) concluded from their research on the Daxing’an Mountains in China that if the temperature is high and the relative humidity is low in the fire prevention period in spring or fall, the number of forest fires and the burned area will increase significantly [51,52]. The latter study also pointed out that if the temperature in the non-fire prevention period in winter is significantly higher than that of the same period, it will lead to the advance of the snow melting date in the spring of the second year and the increase in the drying degree of combustibles, making the meteorological and combustible conditions conducive to an early-season occurrence of forest fires [52]. Our results extended the winter nonfire prevention period to the autumn fire prevention period. When formulating fire prevention strategies, the forestry management department should pay attention to the fire risks that may be caused by meteorological factors during the fire prevention period of that year and should also carry out forest fire prevention work for the following year in advance if it is found that meteorological factors, such as the average surface temperature in the previous autumn fire prevention period have significant fluctuations when compared with the same period. Two variables, altitude, and vegetation type are considered to have an important impact on the occurrence of forest fires in the Daxing’an Mountains of Inner Mongolia. This is consistent with the previous results [5,34,40,53]. Figure A1, Figure A2, Figure A3 and Figure A4 show that the majority of forest fires occur in low-altitude regions due primarily to the concentration of intense human activity there, which will undoubtedly raise the likelihood of human-caused fires. Additionally, the weather will alter the vegetation cover and soil moisture as the altitude increases, making it less likely that fires will start [5,54,55]. After the formulation of regulations, human-caused fires decreased significantly, while the number of lightning fires increased and mainly occurred in high-altitude areas.
Socioeconomic factors such as gross domestic product, population density, and human infrastructure factors (such as the location of settlements and railroads) have a significant impact on the occurrence of forest fires. These findings are consistent with previous results [7,14,43,56,57,58]. During Period 1, the location of the settlement (Dis_res) had a significant effect on the occurrence of forest fires, but the effect of this variable disappeared in Periods 2 and 3. Here, we hypothesize that fire prevention policies in different periods have changed the distance between the fire point and the residential areas, which is an important human factor affecting the occurrence of forest fires. After the 1990s, China entered a stage of rapid development after reform and opening up, and many roads and railways were built in the Daxing’an Mountains in Inner Mongolia. Fires near railway tracks are mainly due to sparks accidentally released by steam engines, fire accidents on trains, and cigarette butts thrown by passengers [43], while the roads are highly disturbed by human activities, which is also a high-risk area for forest fires.
During Period 2 and Period 3, there were two key drivers: the location of the road (Dis_road) and the location of the railway (Dis_train). Both of these factors decreased the fire probability with an increase in the distance (Figure A2 and Figure A3). Figure A1, Figure A3 and Figure A4 show that when the distance from the fire point to the observation tower was further, the probability of fire occurrence was relatively higher. We propose two possible hypotheses for this to happen: (1) The closer to the watchtower, the easier the fire is to be discovered, and if someone has the potential to start a fire, it can be stopped in time from the watchtower. (2) If a fire has already occurred, the forestry management can discover the fire through the watchtower and respond in time, which can limit the fire spreading, so there are fewer fires near the watchtower. The concentration of firefighting resources is relatively low outside the areas with frequent human activities, so increasing and smartly locating watchtowers is crucial for forest fire prevention in remote areas.

4.3. Implications for Forest Fire Modeling and Management

Fire data used in modeling has long been limited by time and accuracy. The use of remote sensing technology to identify wildfires has greatly developed since 2000 (such as MOD14A1 satellite fire point data), with most current forest fire modeling studies (especially large-scale) using fire point data from the past 20 years [31,59]. Other studies use historical fire point data for modeling. The time span of historical fire point data can be longer than that of satellite fire points, but most of them lack recent data [40]. Our modeling using a long time series (40 years) of fire data revealed that the prediction accuracy of Period 3 was higher than that of the full period, indicating that the modeling accuracy using a long time series of fire data (1981–2020) was not higher than that of recent fire data for a shorter period (2009–2020). In future work, we will consider the various factors in the selection of fire time range data for the forest fire prediction modeling; this should allow prediction results that are truly applicable to forest fire prevention and control.
The purpose of fire prevention and control policies is to minimize the harm of forest fires to humans and their property through the actions of managers. Fire prevention and control policies during different periods lead to different drivers affecting the fire occurrence in different periods. The influence of the elevation on fire is weakened over time (Figure 5), indicating that human activities are reduced, which is a quantitative process for fire prevention and control policies. It is well-known and logical that watchtowers can effectively reduce fire occurrence, and a comparison of the different periods shows that the location of watchtowers may significantly influence fire occurrence (Figure 5), indicating that there is still a higher risk of fire in places with fewer watchtowers. This means that fire policy influences the probability and drivers of forest fires primarily through the regulation of human behavior.
Different fire prevention and control policies have led to great differences in the fire probability map of the same area during different periods. However, in the actual construction of forest fire prediction models and the division of fire risk zones, previous studies have often ignored the impact of fire prevention and control policies, especially in China, where the occurrence of forest fires is identified as an administrative event and equipped with the corresponding laws for support [60]. After 1987, government departments at all levels, from national to local, strengthened their forest fire management [21], which reduced the impact of human factors and socioeconomic factors on the occurrence of forest fires. Our results show that the relevant fire prevention and control policies formulated in China after the fire in 1987 had a positive effect on the control of forest fires. In the future, the impact of fire prevention and control policies on the dynamic changes in the fire risk zones should be fully considered when drawing updated fire probability maps. The forest fire management policy of China has made great progress compared to the period before 1987. Before this, forest fire prevention and firefighting in China were developing slowly, lacked laws on forest fire prevention, mainly relied on trees and branches to put out fires, and lacked professional firefighting teams. After the implementation of the regulations, wind-powered fire extinguishers were promoted. China has focused on forest fire prevention and has established professional firefighting and rescue teams, which has greatly improved the efficiency of fire prevention and firefighting. After the implementation of the new regulations, China’s investment in forest fire prevention infrastructure has increased year by year, local forest fire prevention forces have been developed, and the introduction of large aircraft has improved aviation forest fire protection capabilities. The average number of forest fires per year in China has decreased from 15,932 before the formulation of the old regulations to 7626 after the implementation of the old regulations to 3537 after the implementation of the new regulations.
The forest fire management policies of China have made great progress; however, there are still significant issues to address. In recent decades, a large number of trees have been planted in China, which has greatly increased the forest fuel load and increased the potential risk of forest fires. Additionally, the proportion of human-caused fires is still high due to traditional customs and habits. The forest fire management information system in China is inadequate systems in various regions are not unified and have poor data sharing and system compatibility [17]; In addition, the pressure of lightning fire prevention and control is high. The Daxing’an Mountains in Inner Mongolia is a high-incidence area of forest fires caused by lightning strikes, accounting for 70% of the total number of lightning fires in China, and most of the lightning strikes are in primeval forest areas and areas with no roads. It is difficult to spot these fires in their initial stage, and they are extremely difficult to mitigate or fight. There have been many major forest fires in history, resulting in the heavy losses of ecological resources [61]. The basic capabilities of forest fire prevention and control in China still have gaps compared to developed countries, the basic theoretical support is lacking, and research on relevant forest fire spread models, lightning fire monitoring, etc., is still in its infancy. It is thus necessary to continue to improve relevant management policies, learn from the experience of developed countries, and yield a strengthened comprehensive understanding of forest fire science in the future.

4.4. Limitations and Prospects

There are some limitations to this study. The fire data we use are from official government data; however, it is crucial to check the reliability of this data for forest fire forecasting. In China, forest fires are considered administrative events, so the fire information recorded in our fire dataset is relatively detailed. The date of the fire is accurate, but there may be some inevitable errors in the details. As for fire location, an alternative method based on historical data is to use satellite imaging for fire detection [53], where satellite-derived and historical data can be compared to verify the accuracy of the fire data location. Some of the variables we use are often limited by the time range of the data, and there is no past or current information about the variables [5], such as the distance from the fire points to the roads and the distance from the fire point to human gathering points, which may vary over time. In future research, we will collect updated information on the variables from different data sources to improve the prediction of our forest fire model. In addition to the impact of historical events on the occurrence and drivers of forest fires, extreme climate events also affect the occurrence of forest fires. Yao et al. (2017) [62] found that positive phases of the ENSO (El Niño-southern oscillation) and the PDO (Pacific decadal oscillations) and negative NAO (North Atlantic oscillations) were linked to regional wildfires, which mostly occurred during drought years. Gao et al. (2021) [63] showed that the AMO (Atlantic multidecadal oscillation) could regulate the fire states caused by lightning strikes in the boreal forests of China. All this evidence suggests that extreme climate events may impact or change the mechanisms of forest fires. Climate is still the dominant factor affecting the occurrence of forest fires. Therefore, in future research, we will correlate major historical events with extreme climate events and further explore the mechanisms and drivers leading to forest fires in different periods. Additionally, a phenomenon known as spatial non-stationarity can result from differences in the relative importance of factors influencing fire occurs due to the environmental heterogeneity of fire points in various spatial locations [64]. The problem of spatial non-stationarity can be effectively solved with geographically weighted regression (GWR) [43]. This approach can incorporate spatial changes in explanatory variables into the model by taking into account the influence of geospatial and spatial factors. The impact of forest fire drivers on the probability of forest fires with spatial location changes will be examined in our subsequent step using techniques like geographically weighted logistic regression (GWLR). We here analyzed actual fire data combined with other remote sensing data based on GIS to supplement forest fire prediction and forecasting systems. In the future, we will work on the collection of actual fire data in practice and combine it with remote sensing data to achieve better forest fire prediction results.

5. Conclusions

Here, we used historical fire data and demarcated using the new and old Forest Fire Prevention Regulations as a dividing line to compare the differences between the model prediction accuracy and the drivers in different periods using a BRT model. The results show that the BRT model is suitable for the construction of forest fire predictions in the Daxing’an Mountains of Inner Mongolia, with AUC values of more than 0.95 and prediction accuracies of about 90%. The average surface temperature and average sunshine hours during the fire prevention season of the previous year are the important driving factors affecting the occurrence of forest fires in Daxing’an Mountains of Inner Mongolia. The implementation of the old and new “Forest Fire Prevention Regulations” has caused the number of man-made fires to decrease year by year, while the number of lightning fires is increasing year by year. The aggregation of fires caused by natural factors (lightning fires) varies from period to period, with a tendency to shift northward. The probability of fire occurrence and fire risk zones have changed in different periods under the combined influence of policy-regulated anthropogenic fires and lightning fires influenced by events such as extreme weather. Our research can provide support and guidance for the selection of the time series lengths of forest fire modeling and will provide more reasonable resource allocations (such as watchtowers, checkpoints, etc.) for local forest fire prevention and control so as to reduce the hidden danger of forest fires.

Author Contributions

Conceptualization, Q.Z.; Formal analysis, Q.Z.; Funding acquisition, H.Z.; Methodology, H.Z. and Z.W.; Project administration, H.Z.; Software, Q.Z. and Z.W.; Supervision, H.Z. and Z.W.; Visualization, Q.Z.; Writing—original draft, Q.Z.; Writing—review and editing, H.Z. and Z.W. All authors have read and agreed to the published version of the manuscript.

Funding

This research was funded by the National Nature Science Foundation of China (funder: Heng Zhang, NO. 32060344) and Inner Mongolia Autonomous Region Postgraduate Research Innovation Project (funder: Qing Zhou, NO. S20210209Z).

Data Availability Statement

Since the fire datasets are part of the authors’ graduation paper, they are not publicly available at the moment but are available from the corresponding author on reasonable request. The other data can be obtained from the means provided in the text.

Acknowledgments

We are grateful for the help and support of the National Field Scientific Observation and Research Station on Forest Ecosystems in the Daxing’an Mountains, Inner Mongolia. We are also grateful to Researcher Zhihua Liu and Yu Chang of the Institute of Applied Ecology of the Chinese Academy of Sciences, Professor Futao Guo of Fujian Agriculture and Forestry University, Zhangwen Su of Zhangzhou institute of technology, Meng Guo of Northeast Normal University, and Tongxin Hu of Northeast Forestry University for their support and assistance with this work. Finally, we thank the reviewers for their constructive suggestions for this article.

Conflicts of Interest

The authors declare no conflict of interest.

Appendix A

Figure A1. Marginal effects of explanatory variables on fire occurrence probability, Period 1.
Remotesensing 14 05724 g0a1
Figure A2. Marginal effects of explanatory variables on fire occurrence probability, Period 2.
Remotesensing 14 05724 g0a2
Figure A3. Marginal effects of explanatory variables on fire occurrence probability, Period 3.
Remotesensing 14 05724 g0a3
Figure A4. Marginal effects of explanatory variables on fire occurrence probability, Full time period.
Remotesensing 14 05724 g0a4
Table A1. Land use type every five years from 1985 to 2020.
Land Use ClassificationYear (Percentage of Area Occupied)
Code NameName19851990199520002005201020152020
10Rainfed cropland<0.1%<0.1%<0.1%<0.1%<0.1%<0.1%<0.1%<0.1%
11Herbaceous cover7.77%8.26%9.75%10.82%11.46%11.24%11.17%11.79%
20Irrigated cropland0.15%0.16%0.17%0.23%0.22%0.22%0.25%0.19%
61Open deciduous broadleaved forest (0.15 < c < 0.4)\<0.1%<0.1%<0.1%<0.1%<0.1%<0.1%<0.1%
62Closed deciduous broadleaved forest (fe > 0.4)47.66%48.41%46.65%46.24%45.77%45.42%43.73%43.76%
71Open evergreen needle-leaved forest(0.15< fc < 0.4)<0.1%<0.1%<0.1%<0.1%<0.1%<0.1%<0.1%<0.1%
72Closed evergreen needle-leaved forest (fc > 0.4)0.61%0.82%0.96%1.24%1.35%1.44%1.31%1.37%
81Open deciduous needle-leaved forest(0.15< fc < 0.4)<0.1%<0.1%<0.1%<0.1%<0.1%<0.1%<0.1%<0.1%
82Closed deciduous needle-leaved forest (fc > 0.4)29.33%28.17%27.52%27.31%27.75%27.94%28.87%28.78%
92Closed mixed leaf forest (broadleaved and needle-leaved)<0.1%<0.1%<0.1%<0.1%<0.1%<0.1%<0.1%<0.1%
120Shrubland<0.1%<0.1%<0.1%<0.1%<0.1%<0.1%<0.1%<0.1%
121Evergreen shrubland\\\\<0.1%<0.1%<0.1%<0.1%
122Deciduous shrubland<0.1%<0.1%<0.1%<0.1%<0.1%<0.1%<0.1%<0.1%
130Grassland14.34%13.88%14.62%13.71%12.91%13.03%13.88%13.14%
150Sparse vegetation (fe < 0.15)<0.1%<0.1%<0.1%<0.1%<0.1%<0.1%0.11%0.16%
180Wetlands<0.1%<0.1%<0.1%<0.1%<0.1%<0.1%<0.1%<0.1%
190Impervious surfaces0.15%0.17%0.18%0.22%0.26%0.29%0.33%0.37%
200Bare areas<0.1%<0.1%<0.1%<0.1%<0.1%<0.1%<0.1%<0.1%
210Water body<0.1%<0.1%<0.1%0.11%0.15%0.21%0.22%0.21%
220Permanent ice and snow\\\\\\\<0.1%

References

  1. Land Use, Land-Use Change, and Forestry. Intergovernmental Panel on Climate Change (IPCC); Cambridge University Press: Cambridge, UK, 2000; p. 4. [Google Scholar]
  2. Dixon, R.K. Carbon pools and flux of global forest ecosystems (VOL 263, PG 185, 1994). Science 1994, 265, 171. [Google Scholar]
  3. Jiang, H.; Apps, M.J.; Peng, C.H.; Zhang, Y.L.; Liu, J.X. Modelling the influence of harvesting on Chinese boreal forest carbon dynamics. For. Ecol. Manag. 2002, 169, 65–82. [Google Scholar] [CrossRef]
  4. Meng, S.-W.; Liu, Q.-J.; Jia, Q.-Q.; Zhuang, H.-X.; Qi, Y.; Lu, C.-X.; Deng, L.-B. Spatial distribution and dynamics of carbon storage in natural Larix gmelinii forest in Daxing’anling mountains of Inner Mongolia, northeastern China. J. Mt. Sci. 2017, 14, 1633–1641. [Google Scholar] [CrossRef]
  5. Guo, F.; Selvalakshmi, S.; Lin, F.; Wang, G.; Wang, W.; Su, Z.; Liu, A. Geospatial information on geographical and human factors improved anthropogenic fire occurrence modeling in the Chinese boreal forest. Can. J. For. Res. 2016, 46, 582–594. [Google Scholar] [CrossRef] [Green Version]
  6. Huang, C.; He, H.S.; Liang, Y.; Wu, Z.; Hawbaker, T.J.; Gong, P.; Zhu, Z. Long-term effects of fire and harvest on carbon stocks of boreal forests in northeastern China. Ann. For. Sci. 2018, 75, 42. [Google Scholar] [CrossRef] [Green Version]
  7. Wu, Z.; He, H.S.; Yang, J.; Liu, Z.; Liang, Y. Relative effects of climatic and local factors on fire occurrence in boreal forest landscapes of northeastern China. Sci. Total Environ. 2014, 493, 472–480. [Google Scholar] [CrossRef] [PubMed]
  8. Pradhan, B.; Suliman, M.D.H.B.; Awang, M.A.B. Forest fire susceptibility and risk mapping using remote sensing and geographical information systems (GIS). Disaster Prev. Manag. 2007, 16, 344–352. [Google Scholar] [CrossRef]
  9. Guo, F.; Su, Z.; Wang, G.; Sun, L.; Tigabu, M.; Yang, X.; Hu, H. Understanding fire drivers and relative impacts in different Chinese forest ecosystems. Sci. Total Environ. 2017, 605, 411–425. [Google Scholar] [CrossRef]
  10. Guo, F.; Wang, G.; Innes, J.L.; Ma, Z.; Liu, A.; Lin, Y. Comparison of six generalized linear models for occurrence of lightning-induced fires in northern Daxing’an Mountains, China. J. For. Res. 2016, 27, 379–388. [Google Scholar] [CrossRef]
  11. Martinez, J.; Vega-Garcia, C.; Chuvieco, E. Human-caused wildfire risk rating for prevention planning in Spain. J. Environ. Manag. 2009, 90, 1241–1252. [Google Scholar] [CrossRef]
  12. Niklasson, M.; Granstrm, A. Numbers and sizes of fires: Long-term spatially explicit fire history in a swedish boreal landscape. Ecology 2000, 81, 1484–1499. [Google Scholar] [CrossRef]
  13. Oliveira, S.; Oehler, F.; San-Miguel-Ayanz, J.; Camia, A.; Pereira, J.M.C. Modeling spatial patterns of fire occurrence in Mediterranean Europe using Multiple Regression and Random Forest. For. Ecol. Manag. 2012, 275, 117–129. [Google Scholar] [CrossRef]
  14. Ma, W.; Feng, Z.; Cheng, Z.; Chen, S.; Wang, F. Identifying Forest Fire Driving Factors and Related Impacts in China Using Random Forest Algorithm. Forests 2020, 11, 507. [Google Scholar] [CrossRef]
  15. Su, Z.; Tigabu, M.; Cao, Q.; Wang, G.; Hu, H.; Guo, F. Comparative analysis of spatial variation in forest fire drivers between boreal and subtropical ecosystems in China. For. Ecol. Manag. 2019, 454, 117669. [Google Scholar] [CrossRef]
  16. Wu, Z.; He, H.S.; Yang, J.; Liang, Y. Defining fire environment zones in the boreal forests of northeastern China. Sci. Total Environ. 2015, 518, 106–116. [Google Scholar] [CrossRef] [PubMed]
  17. Guo, X.-B.; Zheng, W.-X.; Zeng, A.-C.; Ma, Y.-F.; Guo, L.-F.; Guo, F.-T. Forest fire management in the United States. Yingyong Shengtai Xuebao 2019, 30, 4361–4368. [Google Scholar] [CrossRef]
  18. Ingalsbee, T. Whither the paradigm shift? Large wildland fires and the wildfire paradox offer opportunities for a new paradigm of ecological fire management. Int. J. Wildland Fire 2017, 26, 557–561. [Google Scholar] [CrossRef]
  19. Fule, P.Z.; Crouse, J.E.; Roccaforte, J.P.; Kalies, E.L. Do thinning and/or burning treatments in western USA ponderosa or Jeffrey pine-dominated forests help restore natural fire behavior? For. Ecol. Manag. 2012, 269, 68–81. [Google Scholar] [CrossRef]
  20. Stephens, S.L.; McIver, J.D.; Boerner, R.E.J.; Fettig, C.J.; Fontaine, J.B.; Hartsough, B.R.; Kennedy, P.L.; Schwilk, D.W. The Effects of Forest Fuel-Reduction Treatments in the United States. Bioscience 2012, 62, 549–560. [Google Scholar] [CrossRef] [Green Version]
  21. Zong, X.; Tian, X.; Yao, Q.; Brown, P.M. An analysis of fatalities from forest fires in China, 1951–2018. Int. J. Wildland Fire 2022, 31, 507–517. [Google Scholar] [CrossRef]
  22. Miao, Q.; Liu, Y.; Tian, X. The Effects of Forest Fire Management on Fire Regime. World For. Res. 2014, 27, 42–47. [Google Scholar]
  23. Tian, X.; Cui, W.; Shu, L. Evaluating fire management effectiveness with a burn probability model in Daxing’anling, China. Can. J. For. Res. 2020, 50, 670–679. [Google Scholar] [CrossRef]
  24. Huanjin, H. Interpretation of the old and new “Forest Fire Prevention Regulations”. Leg. Syst. Soc. 2009, 12, 331–332. [Google Scholar] [CrossRef]
  25. Fang, J.Y.; Chen, A.P.; Peng, C.H.; Zhao, S.Q.; Ci, L. Changes in forest biomass carbon storage in China between 1949 and 1998. Science 2001, 292, 2320–2322. [Google Scholar] [CrossRef]
  26. Wang, C.K. Biomass allometric equations for 10 co-occurring tree species in Chinese temperate forests. For. Ecol. Manag. 2006, 222, 9–16. [Google Scholar] [CrossRef]
  27. Huacheng, X. Da Hinggan Ling Mountains Forests in China; Science Press: Beijing, China, 1998; pp. 40–41. [Google Scholar]
  28. Parisien, M.-A.; Moritz, M.A. Environmental controls on the distribution of wildfire at multiple spatial scales. Ecol. Monogr. 2009, 79, 127–154. [Google Scholar] [CrossRef]
  29. Syphard, A.D.; Radeloff, V.C.; Keuler, N.S.; Taylor, R.S.; Hawbaker, T.J.; Stewart, S.I.; Clayton, M.K. Predicting spatial patterns of fire on a southern California landscape. Int. J. Wildland Fire 2008, 17, 602–613. [Google Scholar] [CrossRef]
  30. Littell, J.S.; McKenzie, D.; Peterson, D.L.; Westerling, A.L. Climate and wildfire area burned in western U. S. ecoprovinces, 1916–2003. Ecol. Appl. 2009, 19, 1003–1021. [Google Scholar] [CrossRef]
  31. Guo, F.; Wang, G.; Su, Z.; Liang, H.; Wang, W.; Lin, F.; Liu, A. What drives forest fire in Fujian, China? Evidence from logistic regression and Random Forests. Int. J. Wildland Fire 2016, 25, 505–519. [Google Scholar] [CrossRef]
  32. Prestemon, J.P.; Butry, D.T. Time to burn: Modeling wildland arson as an autoregressive crime function. Am. J. Agric. Econ. 2005, 87, 756–770. [Google Scholar] [CrossRef] [Green Version]
  33. Chang, Y.; Zhu, Z.; Bu, R.; Chen, H.; Feng, Y.; Li, Y.; Hu, Y.; Wang, Z. Predicting fire occurrence patterns with logistic regression in Heilongjiang Province, China. Landsc. Ecol. 2013, 28, 1989–2004. [Google Scholar] [CrossRef]
  34. Guo, F.; Innes, J.L.; Wang, G.; Ma, X.; Sun, L.; Hu, H.; Su, Z. Historic distribution and driving factors of human-caused fires in the Chinese boreal forest between 1972 and 2005. J. Plant Ecol. 2015, 8, 480–490. [Google Scholar] [CrossRef]
  35. Guo, F.; Su, Z.; Wang, G.; Sun, L.; Lin, F.; Liu, A. Wildfire ignition in the forests of southeast China: Identifying drivers and spatial distribution to predict wildfire likelihood. Appl. Geogr. 2016, 66, 12–21. [Google Scholar] [CrossRef]
  36. Zhang, H.J.; Qi, P.C.; Guo, G.M. Improvement of fire danger modelling with geographically weighted logistic model. Int. J. Wildland Fire 2014, 23, 1130–1146. [Google Scholar] [CrossRef]
  37. Badia, A.; Serra, P.; Modugno, S. Identifying dynamics of fire ignition probabilities in two representative Mediterranean wildland-urban interface areas. Appl. Geogr. 2011, 31, 930–940. [Google Scholar] [CrossRef]
  38. Avila-Flores, D.; Pompa-Garcia, M.; Antonio-Nemiga, X.; Rodriguez-Trejo, D.A.; Vargas-Perez, E.; Santillan-Perez, J. Driving factors for forest fire occurrence in Durango State of Mexico: A geospatial perspective. Chin. Geogr. Sci. 2010, 20, 491–497. [Google Scholar] [CrossRef]
  39. Hawbaker, T.J.; Radeloff, V.C.; Stewart, S.I.; Hammer, R.B.; Keuler, N.S.; Clayton, M.K.J.E.A. Human and biophysical influences on fire occurrence in the United States. Ecol. Appl. 2013, 23, 565–582. [Google Scholar] [CrossRef]
  40. Guo, F.; Zhang, L.; Jin, S.; Tigabu, M.; Su, Z.; Wang, W. Modeling Anthropogenic Fire Occurrence in the Boreal Forest of China Using Logistic Regression and Random Forests. Forests 2016, 7, 250. [Google Scholar] [CrossRef] [Green Version]
  41. Catry, F.X.; Rego, F.C.; Bacao, F.; Moreira, F. Modeling and mapping wildfire ignition risk in Portugal. Int. J. Wildland Fire 2009, 18, 921–931. [Google Scholar] [CrossRef] [Green Version]
  42. Vega-Garcia, C.; Tatay-Nieto, J.; Blanco, R.; Chuvieco, E. Evaluation of the Influence of Local Fuel Homogeneity on Fire Hazard through Landsat-5 TM Texture Measures. Photogramm. Eng. Remote Sens. 2010, 76, 853–864. [Google Scholar] [CrossRef]
  43. Su, Z.; Hu, H.; Tigabu, M.; Wang, G.; Zeng, A.; Guo, F. Geographically Weighted Negative Binomial Regression Model Predicts Wildfire Occurrence in the Great Xing’an Mountains Better Than Negative Binomial Model. Forests 2019, 10, 377. [Google Scholar] [CrossRef] [Green Version]
  44. Inner Mongolia Autonomous Region Bureau of Statistics. Inner Mongolia in the 30 Years of Reform and Opening Up; China Statistics Press: Beijing, China, 2008. [Google Scholar]
  45. Elith, J.; Leathwick, J.R.; Hastie, T. A working guide to boosted regression trees. J. Anim. Ecol. 2008, 77, 802–813. [Google Scholar] [CrossRef] [PubMed]
  46. De’ath, G. Boosted trees for ecological modeling and prediction. Ecology 2007, 88, 243–251. [Google Scholar] [CrossRef]
  47. Mu, X.; Song, W.; Gao, Z.; McVicar, T.R.; Donohue, R.J.; Yan, G. Fractional vegetation cover estimation by using multi-angle vegetation index. Remote Sens. Environ. 2018, 216, 44–56. [Google Scholar] [CrossRef]
  48. Wu, R.; Zhao, J.; Zhang, H.; Guo, X.; Ying, H.; Deng, G.; Li, H. Wildfires on the Mongolian Plateau: Identifying Drivers and Spatial Distributions to Predict Wildfire Probability. Remote Sens. 2019, 11, 2361. [Google Scholar] [CrossRef] [Green Version]
  49. Jaiswal, R.K.; Mukherjee, S.; Raju, K.D.; Saxena, R. Forest fire risk zone mapping from satellite imagery and GIS. Int. J. Appl. Earth Obs. Geoinf. 2002, 4, 1–10. [Google Scholar] [CrossRef]
  50. Shu, Y.; Shi, C.; Yi, B.; Zhao, P.; Guan, L.; Zhou, M. Influence of Climatic Factors on Lightning Fires in the Primeval Forest Region of the Northern Daxing’an Mountains, China. Sustainability 2022, 14, 5462. [Google Scholar] [CrossRef]
  51. Fengjun, Z. Study on the Impacts of Climate Change on Forest Fires in Inner Mongolia Daxing’anling Forest Region; Chinese Academy of Forestry: Beijing, China, 2007. [Google Scholar]
  52. Zhan, S. Impacts Research of Climate Change on Forest Fires in Ta He Forestry Bureau in Great Xing’an Mountain Region; Northeast Forestry University: Harbin, China, 2011. [Google Scholar]
  53. Tariq, A.; Shu, H.; Siddiqui, S.; Munir, I.; Sharifi, A.; Li, Q.; Lu, L. Spatio-temporal analysis of forest fire events in the Margalla Hills, Islamabad, Pakistan using socio-economic and environmental variable data with machine learning methods. J. For. Res. 2022, 33, 183–194. [Google Scholar] [CrossRef]
  54. Tian, X.; Zhao, F.; Shu, L.; Wang, M. Distribution characteristics and the influence factors of forest fires in China. For. Ecol. Manag. 2013, 310, 460–467. [Google Scholar] [CrossRef]
  55. Vilar, L.; Woolford, D.G.; Martell, D.L.; Pilar Martin, M. A model for predicting human-caused wildfire occurrence in the region of Madrid, Spain. Int. J. Wildland Fire 2010, 19, 325–337. [Google Scholar] [CrossRef]
  56. Penman, T.D.; Bradstock, R.A.; Price, O. Modelling the determinants of ignition in the Sydney Basin, Australia: Implications for future management. Int. J. Wildland Fire 2013, 22, 469–478. [Google Scholar] [CrossRef]
  57. Pereira, M.G.; Trigo, R.M.; da Camara, C.C.; Pereira, J.M.C.; Leite, S.M. Synoptic patterns associated with large summer forest fires in Portugal. Agric. For. Meteorol. 2005, 129, 11–25. [Google Scholar] [CrossRef]
  58. Sturtevant, B.R.; Cleland, D.T. Human and biophysical factors influencing modern fire disturbance in northern Wisconsin. Int. J. Wildland Fire 2007, 16, 398–413. [Google Scholar] [CrossRef] [Green Version]
  59. Wu, Z.; He, H.S.; Keane, R.E.; Zhu, Z.; Wang, Y.; Shan, Y. Current and future patterns of forest fire occurrence in China. Int. J. Wildland Fire 2020, 29, 104–119. [Google Scholar] [CrossRef]
  60. Chen, J.; Di, X.-Y. Forest fire prevention management legal regime between China and the United States. J. For. Res. 2015, 26, 447–455. [Google Scholar] [CrossRef]
  61. Wang, H. Thinking about building a strong Great Wall of Forest Fire Protection in the Great Xinganling Mountains. China Green Times 2022. [Google Scholar]
  62. Yao, Q.; Brown, P.M.; Liu, S.; Rocca, M.E.; Trouet, V.; Zheng, B.; Chen, H.; Li, Y.; Liu, D.; Wang, X. Pacific-Atlantic Ocean influence on wildfires in northeast China (1774 to 2010). Geophys. Res. Lett. 2017, 44, 1025–1033. [Google Scholar] [CrossRef] [Green Version]
  63. Gao, C.; Zhao, F.; Shi, C.; Liu, K.; Wu, X.; Wu, G.; Liang, Y.; Shu, L. Previous Atlantic Multidecadal Oscillation (AMO) modulates the lightning-ignited fire regime in the boreal forest of Northeast China. Environ. Res. Lett. 2021, 16, 024054. [Google Scholar] [CrossRef]
  64. McMillen, D.P. Geographically Weighted Regression: The Analysis of Spatially Varying Relationships. Am. J. Agric. Econ. 2004, 86, 554–556. [Google Scholar] [CrossRef]
Figure 1. Geographic location of the study area. (a) The relative position and elevation of the Daxing’an Mountains, Inner Mongolia. (b) Human infrastructure, weather stations, watchtowers in the study area. (c) Forest types in the study area.
Remotesensing 14 05724 g001
Figure 2. The location of different levels of forest fires. (a) Spatial distribution of forest fires of general;(b) Spatial distribution of forest fires of larger; (c) Spatial distribution of forest fires of major; (d) Spatial distribution of forest fires of especially major.
Remotesensing 14 05724 g002
Figure 3. Number of fires and burned area per year during the past 40 years. (a) 1981–14 March 1988; (b) 15 March 1988–2008; (c) 2009–2020.
Remotesensing 14 05724 g003
Figure 4. Number of fires with three causes of fire and area of fire. The natural factor is lightning fire; human factors mainly include smoking, production and living, burning paper, deliberately setting fire, etc. The invasive factors include foreign burning and burning in other provinces and cities. Note: time periods are as in Figure 3. (a) 1981–14 March 1988; (b) 15 March 1988–2008; (c) 2009–2020.
Remotesensing 14 05724 g004
Figure 5. Contribution rank of important drivers identified by the model for each of the four periods: (a) 1981–14 March 1988; (b) 15 March 1988–2008; (c) 2009–2020; (d) 1981–2020.
Remotesensing 14 05724 g005
Figure 6. ROC curves and the corresponding AUC values based on the complete datasets in each of the four periods. (a) 1981–14 March 1988 (Period 1); (b) 15 March 1988–2008 (Period 2); (c) 2009–2020 (Period 3); (d) 1981–2020 (all years).
Remotesensing 14 05724 g006
Figure 7. Probability distribution of forest fires in the Daxing’an Mountains, Inner Mongolia, during different periods. (a) 1981–14 March 1988 (Period 1); (b) 15 March 1988–2008 (Period 2); (c) 2009–2020 (Period 3); (d) 1981–2020 (all years).
Remotesensing 14 05724 g007
Figure 8. Fire risk zone map of the Daxing’an Mountains, Inner Mongolia, in four periods (a) 1981–14 March 1988 (Period 1); (b) 15 March 1988–2008 (Period 2); (c) 2009–2020 (Period 3); (d) 1981–2020 (all years). Fire risk is represented by three levels: low, medium, and high fire risk.
Remotesensing 14 05724 g008
Figure 9. Distribution of residuals obtained from the developed fire prediction model. (a) 1981–14 March 1988 (Period 1); (b) 15 March 1988–2008 (Period 2); (c) 2009–2020 (Period 3); (d) 1981–2020 (all years).
Remotesensing 14 05724 g009
Figure 10. Kernel density analysis of anthropogenic, natural, and invasive factors in different periods. (a) 1981–14 March 1988 (Period 1); (b) 15 March 1988–2008 (Period 2); (c) 2009–2020 (Period 3).
Remotesensing 14 05724 g010
Table 1. Explanatory variables and their abbreviations and units.
FactorsVariablesAbbreviationNumerical RangeUnitsResolution/Scale
ClimateAverage daily temperatureTemp−31.3–28.7°CDaily/0.01
Daily maximum temperatureMax_temp−23.4–39.3°C
Daily difference in temperatureTemp_diff0.9–34.1°C
Daily average relative humidityHum12–99%
Daily minimum relative humidityMinhum0.4–93%
Average daily ground temperatureG_temp−32.2–38.9°C
Daily maximum ground temperatureMaxg_temp−23.5–70.6°C
Daily average wind speedWin0–11.3m/s
Maximum daily wind speedMax_win0–18.7m/s
Daily accumulated precipitationPrec0–104.3mm/24 h
Sunshine hoursSun0–16h
Average monthly temperatureMmeantemp−30.2–24.7°CMonthly/0.01
Average monthly precipitationMmeanprec0–13.8mm
Monthly average relative humidityMmeanhum5.7–87.3%
Average monthly surface temperatureMmeang_temp−29.8–54.8°C
Average monthly sunshine hoursMmeansun0.34–12.51h
Average temperature during spring fire prevention seasonTempSpr0.2–11°CQuarterly/0.01
Average humidity during spring fire prevention seasonHumSpr34.9–64.1%
Average ground temperature during spring fire prevention seasonG_tempSpr2.44–15.1°C
Average precipitation during the spring fire prevention seasonPrecSpr0.18–2.94mm
Average sunshine hours during the spring fire seasonSunSpr1.01–10.7h
Average temperature during autumn fire prevention seasonTempAut−5.96–6.53°C
Average humidity during autumn fire prevention seasonHumAut44.4–75.5%
Average ground temperature during autumn fire prevention seasonG_tempAut−6.45–8.4°C
Average precipitation during the autumn fire prevention seasonPrecAut0.03–2.82mm
Average sunshine hours during the autumn fire seasonSunAut0.64–8.88h
AnthropogenicDistance to the nearest settlementDis_res0.06–60.54kmVector/1:250,000
Distance to the nearest roadDis_road0.001–24.9km
Distance to the nearest railwayDis_rail0.01–133.2km
Distance to the nearest watchtowerDis_watch0.06–129km
VegetationVegetation typesVegetation typeTen types-Raster/30 m
Normalized Difference Vegetation IndexNDVI0.01–0.94-Raster/5 km
TopographicAltitudeDem178–1657meterRaster/30 m
Aspect indexAspect---
SlopeSlope0–35.14degreeRaster/30 m
SocioeconomicGDP per capitaGDP197–167,10010,000 yuanYearly
Density of populationPop1.7–33.7People/100 hm2
Note: The relevant indicator of the fire prevention period refers to the year before the fire.
Table 2. Average annual number of fires and fire area for three causes in four periods.
Period 1
(1981–14 March 1988)
Period 2
(15 March 1988–2008)
Period 3
(2009–2020)
All Years
(1981–2020)
Disaster-Causing FactorsAverage Number of Fires per YearAverage Annual Fire Area (104 hm3)Average Number of Fires per YearAverage Annual Fire Area (104 hm3)Average Number of Fires per YearAverage Annual Fire Area (104 hm3)Average Number of Fires per YearAverage Annual Fire Area (104 hm3)
Human factors56.323.530.612.156.330.1327.825.28
Natural factors7.2810.8623.140.7227.660.2721.732.36
Invasive factors0.712.462.472.271.160.181.7752.36
Table 3. Selection of significant variables by the BRT model during four periods.
Period 1
(1981–14 March 1988)
Period 2
(15 March 1988–2008)
Period 3
(2009–2020)
All Years
(1981–2020)
VariableNumber of
Times
Abandoned
VariableNumber of
Times
Abandoned
VariableNumber of Times
Abandoned
VariableNumber of Times
Abandoned
Altitude0Daily difference
in temperature
0Daily difference
in temperature
0Altitude0
Vegetation type0Altitude0Average monthly precipitation0Daily difference
in temperature
0
Daily minimum
relative humidity
0GDP per capita0Daily maximum temperature0Monthly average relative humidity0
Daily average
relative humidity
0Monthly average relative humidity0NDVI0Average monthly precipitation0
Daily difference
in temperature
0Distance to the nearest railway0Daily average
relative humidity
0Daily average
relative humidity
0
Daily maximum
ground
temperature
0Average monthly precipitation0Altitude0Daily minimum
relative humidity
0
Distance to the
nearest
watchtower
1Daily minimum
relative humidity
0Density of
population
0Daily maximum temperature0
GDP per capita1Slope0Average ground temperature during autumn fire
prevention season
1Distance to the
nearest
watchtower
0
Average sunshine hours during the fall fire season1Daily maximum
ground
temperature
1Distance to the
nearest road
1Daily maximum ground
temperature
1
Distance to the
nearest settlement
1Average monthly sunshine hours1Daily minimum
relative humidity
1Distance to the nearest settlement1
Sunshine hours1Sunshine hours1Distance to the
nearest watchtower
2Average ground temperature
during autumn fire prevention season
1
Average daily
ground
temperature
2Average sunshine hours during the fall fire season1Average monthly sunshine hours2Distance to the nearest road1
GDP per capita0
Table 4. Key fitting parameters of the final BRT model.
ParametersPeriod 1
(1981–14 March 1988)
Period 2
(15 March 1988–2008)
Period 3
(2009–2020)
All Years
(1981–2020)
FamilyBernoulliBernoulliBernoulliBernoulli
Learning rate0.010.010.010.01
Tree complexity5555
Bag fraction0.050.050.050.05
Number of trees1050290023504750
Table 5. Model prediction accuracy and goodness of fit based on intermediate and complete datasets.
SamplePeriodCut-offAUC ValuePrediction Accuracy (%)
Training DataValidation
Sample 11/2
3/All years
0.31/0.428
0.429/0.426
0.958/0.963
0.974/0.959
87.8/90.1
87/89.5
84.3/85.6
87/84.4
Sample 21/2
3/All years
0.332/0.431
0.252/0.387
0.968/0.97
0.966/0.969
90.4/90.6
90.1/90.4
81/87.8
79.9/85.1
Sample 31/2
3/All years
0.331/0.372
0.315/0.358
0.969/0.958
0.973/0.97
89.1/89.1
91.4/90.1
81.6/82.1
86.6/85.6
Sample 41/2
3/All years
0.31/0.428
0.429/0.426
0.955/0.961
0.976/0.967
89/89.9
92.9/83.6
83.2/84.7
90.3/83.7
Sample 51/2
3/All years
0.34/0.411
0.34/0.388
0.96/0.955
0.97/0.969
90.1/90
90/90
83.2/83.9
84.4/84.7
Complete dataset1/2
3/All years
0.315/0.388
0.337/0.349
Figure 688.5/90.7
92/89.9
Publisher’s Note: MDPI stays neutral with regard to jurisdictional claims in published maps and institutional affiliations.

