Abstract
Global Navigation Satellite System interferometric reflectometry (GNSS-IR), a new and inexpensive technique, has become available to the broader scientific community for detecting surface environmental information, such as soil moisture, snow depth and vegetation growth. However, there have been limited experiments focusing on the potential of crop height retrieval, especially the performance evaluation of BeiDou Navigation Satellite System (BDS) with other GNSS. Accuracy and reliability are challenging to achieve with traditional methods utilizing a single GNSS, and few measured verification data. In this study, an improved method that includes segmentation processing and multi-GNSS fusion is proposed based on GPS/GLONASS/Galileo/BDS multi-frequency data. Furthermore, experiments were carried out on a farmland in Fengqiu County, Henan Province, China. The results show that the height retrievals from four GNSS were in good agreement with the in situ observations during the whole growth cycle of the wheat after overwintering. Meanwhile, the retrievals based on the proposed method exhibited greater correspondence than the single frequency results, the correlation coefficient was increased and the root-mean-square error (RMSE) was reduced, respectively. Therefore, this study illustrates the feasibility of the proposed method to precisely estimate wheat height and its potential for use in the early warning of wheat lodging based on GNSS-IR.
1. Introduction
Wheat is a type of cereal crop that is widely planted all over the world, and is a staple food for human beings. Yield information comprehensively reflects the growth level of crops in that year, and has important reference value for agricultural food policy and farming planning [1]. The height of wheat is the main index reflecting the growth and development of wheat, and it is a critical factor for predicting the yield during the growth process. At the same time, due to global warming, various extreme weather conditions occur frequently, which may affect the growth of wheat. For example, lodging caused by wind, rain and other meteorological factors threatens the growth of wheat seriously affect the maturity of wheat, reduce production and endanger agricultural production and food security. The most obvious sign of wheat lodging is an unreasonable change in wheat height. Therefore, the measurement or real-time monitoring of wheat height during growth is of great significance for yield prediction and for the early warning of disasters, such as lodging [2].
For a long time, people used the meter ruler to measure the height of wheat. This method is time-consuming, laborious and difficult to use for continuous monitoring. As state-of-the-art technology, the Synthetic Aperture Radar (SAR) and Light Detection and Ranging (LiDAR) have been used more recently to carry out wheat height monitoring. Kumar et al. [3] employed Sentinel-1A Synthetic Aperture Radar analysis of time series data at C-band to estimate winter wheat crop growth parameters, such as leaf area index, vegetation water content, fresh biomass, dry biomass and plant height, using multiple machine learning algorithms. A ground-based multi-sensor phenotyping system equipped with ultrasonic sensors and LiDAR was developed by Yuan et al. [4] to compare it with manual measurements and an unmanned aircraft system. LiDAR provided the best results; the unmanned aircraft system obtained reasonable ones and the ultrasonic sensors did not perform well. These abovementioned methods also have individual restrictions, such as being expensive or having low spatial–temporal resolution [5]. In recent years, GNSS reflected signals have been used opportunistically to retrieve land surface environmental information instead of navigation and positioning. The first use of GNSS-reflected signals on remote sensing was proposed by Hall et al. [6] to determine ocean wind velocity. Subsequently, GNSS reflectometry (GNSS-R) studies primarily pursued the application potential of reflections in the ocean for measurements, such as sea surface wind speed [7,8], ocean altimetry [9,10] and sea ice thickness [11,12]. The above studies focused primarily on using specially designed GNSS receivers to retrieve environmental parameters, which is not conducive to the promotion of the technology. Later, a subset of studies also had success in using geodetic-quality GNSS receivers with a Right-Hand Circularly Polarized (RHCP) antenna to estimate surface environmental monitoring information, such as soil moisture [13,14,15,16,17], changes in vegetation [18,19] and snow depth [20,21]. This technology, known as GNSS interferometric reflectometry (GNSS-IR), was initially proposed by Larson et al. [22] to measure soil moisture fluctuations using signal-to-noise ratio (SNR) interferograms.
The application of GNSS-IR technology in agriculture has always been concerned with measurements, such as soil moisture, vegetation moisture, vegetation index and crop height. Chew et al. [23] studied the relationship between soil moisture and the amplitude, frequency and phase shift of SNR multipath signals. The results showed that phase shift was the most ideal factor to describe fluctuation in soil moisture. Later, Larson and Wan found in the test that the amplitude of SNR had strongly linear relationship with the vegetation water content (VWC) when VWC was less than ~1 kg/m2 [18]. Chew et al. [24] verified that the normalized amplitude time series kept below 0.78 for a long period was possibly affected by vegetation. The normalized microwave reflection index (NMRI), calculated from multipath data, was also able to characterize the changes in surface vegetation in [25]. Similarly, the amplitude of the annual growth cycle and the correlation between the NMRI and the normalized difference vegetation index (NDVI) were estimated from 184 GPS sites by Evans et al. [26]. At the same time, considering the impact of vegetation on GNSS reflected signals, it was necessary to mitigate this effect to better estimate soil moisture [27]. A retrieval method of vegetation biomass based on GNSS SNR was proposed by Zheng et al. [28]. Techniques to estimate the vegetation optical depth and infer the VWC using a single GNSS receiver located under the vegetation layer were analyzed [29,30].
In comparison with other aspects, there are few studies on crop height at present. A vegetation-height retrieval algorithm was first proposed using the SNR-dominant period with GPS L1 frequency by Zhang et al. [31], who also found that these vegetation height retrievals were sensitive to changes in crop height of at least one wavelength. Similarly, Zhang et al. [32] comprehensively evaluated the potential of BDS and GPS to retrieve soil moisture and vegetation growth. Empirical mode decomposition (EMD) and wavelet algorithms were compared to estimate the optimal wheat height changes. The conclusion was that the wavelet analysis method showed optimal retrieval ability during the height change process of wheat in the middle and late periods. Li et al. [33] proposed a new retrieval method that used a low-cost GNSS chip and an RHCP antenna to retrieve the peak frequencies of the GNSS SNR series using Lomb–Scargle periodogram (LSP) and simplified the winter wheat as multi-layer equivalent mediums. The results showed that the estimated equivalent medium heights were very close to the in situ observations during the wheat heading and ripening stages.
In previous works, vegetation height retrieval was mostly focused on using GPS- or BDS reflected signals. There are few experiments based on the GLONASS, Galileo or BDS to retrieve the crop growth information such as wheat height in a farmland environment. In addition, the traditional method can only retrieve information in cases where the wheat heights are greater than one wavelength, and also cannot distinguish between bare soil and a height of less than one wavelength. Meanwhile, there are few in situ measured data of the whole growth cycle, and it is difficult to comprehensively compare the retrieval differences between different GNSS and frequencies. Therefore, this study aims to retrieve wheat height measurements based on GPS, GLONASS, Galileo and BDS SNR data obtained with a classical geodetic receiver over an intensively cultivated wheat field in the northeast Henan Province. The differences of individual system and frequency signals on wheat height retrieval are deeply analyzed, and segment processing is performed to obtain optimum retrieval results. An improved method is then proposed to fuse multi-system and multi-frequency data to improve the retrieval accuracy. In addition, the retrieval values are compared with in situ observations for systematic evaluation, resulting in an efficient method for monitoring or providing early warning of wheat height change with high spatial and temporal resolution.
2. Methods
2.1. SNR Characteristics
When the signals generated by GNSS satellites through the atmosphere are reflected by the surface and other ground environment in the process of propagation (as in Figure 1), the signal superposition at the antenna will produce relatively stable interference signals, which is more obvious at the low elevation angle in Figure 2. According to the full model [34], interference SNR data can be given by:
where Ad and Am are the amplitude of the direct and reflected signal, respectively, and represents the phase difference between the direct and reflected signals.
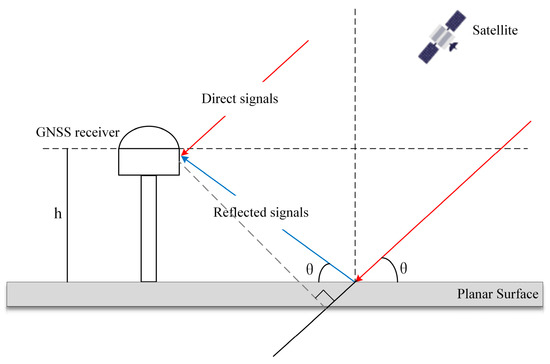
Figure 1.
Schematic diagram of GNSS reflected signals.

Figure 2.
The SNR diagram of GPS PRN02.
The influence of the power of the direct signals is seen in a large arcing trend in the SNR data in Equation (1), which does not contain information about the surface environment. In order to remove this influence and only see the interference pattern, the SNR is firstly converted from dB-Hz to a linear scale (volt/volt) and then detrended with a two-order polynomial fitting, estimated for each satellite track on each day:
where represents the raw data and denotes the transformed data.
Therefore, the detrended SNR data, that is, the reflected components, have previously been modeled using the following equation [13]:
where θ represents the elevation angle of the satellite, A is the constant amplitude, λ refers to the GNSS signal wavelength (GPS λL1 = 0.1902 m, Galileo λE1 = 0.1904 m, BDS λB1 = 0.1920 m), φ denotes a phase shift and h is the height of the antenna, which is generally replaced by the median of the high reflectance series calculated by the Lomb–Scargle periodogram.
Generally, Equation (2) forms the foundation for remote sensing of soil moisture using GNSS-IR. The parameters in Equation (2), A and φ, are two metrics that have been investigated with regards to their potential for inferring changes in vegetation water content and surface soil moisture.
2.2. Wheat Height Retrieval
Larson et al. proposed an algorithm to retrieve snow depth and sea level height, which demonstrates the potential of the GNSS-IR technique in estimating height changes. Similarly, when wheat grows, the vegetation surface gradually replaces the bare soil surface as the dominant reflecting surface (Figure 3). Consequently, the effective reflected height of the antenna above the reflecting surface decreases. Thus, this method is used to retrieve the wheat height. First, the LSP is applied to estimate the frequency f; then, the f can be converted to the reflected height as follows:
where f denotes the peak frequency of the LSP.
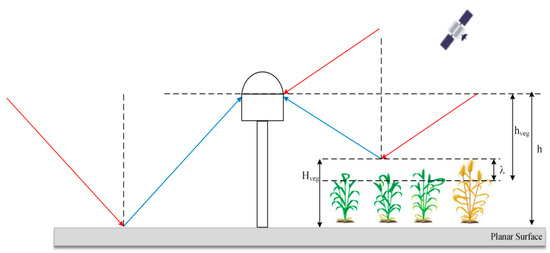
Figure 3.
Schematic diagram of wheat height retrieval.
Zhang et al. [31] also proposed an algorithm to retrieve changes in wheat height using the dominant period T of SNR data by wavelet analysis. As the changes in h impact T, this property allows the use of changes in T to infer changes in h, further evaluating relative wheat height. This model is given by:
where T is the dominant period of the SNR reflected components and dθ/dt represents the change rate of satellite elevation angle, θ.
However, the selection of wavelet basis will seriously affect the periodic structure of the SNR reflected signals, and the best elevation angle cosθ may change due to different GNSS and frequencies. Therefore, we do not verify the performance of this method, only using Equation (5).
Finally, considering the penetration characteristics of the GNSS signals, the wheat height of multi-satellites (m = 1,2,3…) is retrieved as follows:
where h0 is the median value of the top 15% h data during the wheat growth period, Hveg-m denotes the changes in height and H is refers to final wheat height. Due to the extra wavelength, this method only retrieves wheat height greater than one wavelength.
2.3. Retrieval Steps
The algorithm flow is shown in Figure 4. According to the surrounding environment of the site, the SNR data within the azimuth range of 30–300° and the elevation angle range of 5–25° are selected first. Quality control is then used in the LSP periodogram analysis to determine the proper frequency. If the SNR passes detection, the relevant metrics will be directly calculated; otherwise, the signal will be decomposed through the improved complete ensemble EMD (ICEEMDAN) [35] to obtain the effective frequency information. The SNR metrics A and f are subsequently calculated through a non-linear least square fitting procedure and the LSP.

Figure 4.
Flowchart of the algorithm retrieval process.
In addition, the wheat height is retrieved during wheat growth periods by the multi-frequency of the GPS/GLONASS/Galileo/BDS, and the results are systematically analyzed and evaluated at the site. Segmented processing is then carried out to correct the deviation with each GNSS system. Following this, the multi-frequency and multi-system retrieval results are fused to improve the retrieval accuracy and to compensate the shortcomings of traditional methods. Finally, the retrieval values are compared with the in situ observations and a growing degree-days (GDD) model simulation [36], which verify the effectiveness of this method. The GDD model is described in detail in [37].
2.3.1. Quality Control
For the wheat height retrieval, the vegetation canopy changes and the GNSS site environment play an important role in the measurement results. The response of different frequency bands to the field environment is very complex, so quality control is a critical step in a wheat farmland environment. Therefore, two methods are used in periodogram analysis to determine the correct frequency f.
The first type of ratio refers to the ratio of the amplitude corresponding to the highest peak to the average of all other amplitudes:
where AMPmax is the maximum value of the amplitude sequence in the LSP and AMP denotes the amplitude sequence of the other peaks in the LSP.
The second ratio is given as follows:
where secmax(AMP) is the amplitude of the second highest peak in the LSP.
In the data processing, after setting the thresholds of the two parameters, if the values of Ratio1 and Ratio2 of the LSP do not exceed the a priori threshold, the frequency f is directly obtained. Otherwise, the ICEEMDAN method [35] will be used to decompose the SNR data, and the fourth layer will be selected for the next step.
2.3.2. Segmented Processing
It can be seen from previous works that it is difficult to distinguish wheat height of less than one wavelength using the traditional method [31,32], which seriously restricts the practical application of GNSS-IR. Therefore, a segmented processing method is proposed to address this issue. Specifically, the wheat height time series is segmented using the normalized amplitude (Anorm) and empirical phenological information [24].
First, whether Anorm is less than 0.78 can be approximately regarded as an indicator of vegetation effect, the height retrieval time series is divided into three sections: before the regreening stage, before the rapid growth stage and after harvest. One wavelength would not be added in the first and last stages to obtain more practical retrieval results for all GNSS frequencies.
Second, the L1 frequency data of each system would also not increase one wavelength from the heading stage to harvest due to the signal attenuation. The winter wheat heading date in the Fengqiu Experimental Station (HNFQ) site is roughly the same, basically around day of year (DOY) 115 according to our investigation.
Therefore, the final H after segment processing can be given as follows:
where Day1 is the date when Anorm is first less than 0.78, Day2 denotes the date of heading stage, which is DOY 115 in this study, and Day3 represents the last date when Anorm is less than 0.78.
2.3.3. Multi-Frequency and Multi-System Fusion Retrieval
Considering the sensitivity of different frequency signals to vegetation, it is necessary to fuse multi-frequency and multi-system values to improve the retrieval accuracy. Therefore, an improved method based on the daily mean root-mean-square errors is proposed for fusion.
First, for a single system, the fusion values are the mean of different frequencies (n = 1,2,3):
where F denotes the number of frequencies for a single system. Then, the daily mean root-mean-square errors (i = 1, 2, 3, …) with the GDD model simulation values are calculated according to the fused results from each GNSS system (k = 1, 2, 3, 4):
where HGDD indicates the GDD model simulation and Hsys is the retrieval value of a single system.
The weights can be expressed as follows:
Based on these, the final fusion retrieval values are defined as:
3. Results
3.1. Experiments
The experiment was carried out at Fengqiu Experimental Station (HNFQ) for the Agroecology Chinese Academy of Sciences, Fengqiu County, Henan Province, China (Figure 5). A Sino M300 Pro GNSS receiver and AT500 GNSS antenna were used to track the GNSS signals from 1 January 2022 to 21 June 2022 (DOY 1–172). The SNR data of DOY 157–167 were lost due to power failure during wheat harvesting. The in situ wheat height measurement had been carried out at five-day interval since 5 March (DOY 64) 2022, measured with a metallic tape ruler from four sampling points in the wheat field. Then, the average of these heights was considered as the in situ wheat height. During the experiment, the measured wheat height at the beginning was 0.2730 m, and the maximum plant height measured on 25 April (DOY 115) was 0.7083 m. After that, the wheat height remained basically unchanged. Then, until DOY 156, when the wheat had been harvested, there was no obvious crop growth at the site.
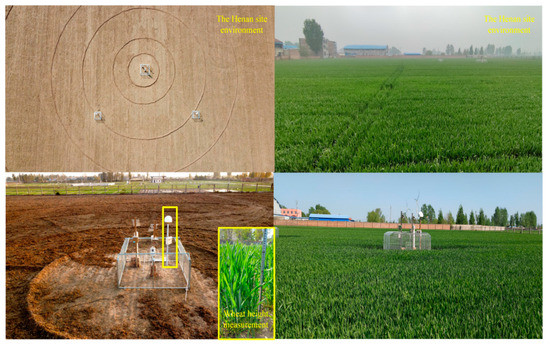
Figure 5.
The site instrument, equipment and surrounding environment.
For this experiment, the sample frequency of the GNSS receiver was set up to 15 Hz, and the types of SNR signals received by the GNSS receiver are shown in Table 1. Moreover, the low elevation angles (less than 5°) were excluded to avoid obstacle effects surrounding the wheat farmland.

Table 1.
Received SNR types for HNFQ.
3.2. Wheat Height Retrieval Results
3.2.1. Single Frequency
Figure 6 shows an example of the reflector height from the GPS L1 frequency band during the whole winter wheat growth period. It can be seen from Figure 6 that the reflector height has an obvious downward trend, which is consistent with the growth process of wheat. From January to February (DOY 1–60), the wheat becomes dormant, resulting in a basically consistent reflector height. Then, after March, the wheat regreens and begins to grow gradually. In the stem extension stage (after DOY 75), the wheat grows rapidly, and the reflector height also distinctly increased. In contrast, the wheat gradually heads on DOY 115, which forms a stable wheat reflective canopy and leads to the height remaining relatively unchanged. After the wheat harvest, its height recovers rapidly.

Figure 6.
The reflector height of the GPS L1 band.
Specifically, the multi-frequency retrieval results from GPS/GLONASS/Galileo/BDS, together with the in situ measurements and the daily wheat height simulations using the GDD model, are illustrated in Figure 7, Figure 8, Figure 9 and Figure 10. The in situ measured heights are recovered 14 times, from 5 March to 13 May (DOY 133), with an interval of five days. In this experiment, the change trends of the wheat height retrievals of each frequency band and each GNSS are consistent with those of the small number of in situ observations and the GDD model simulations. Some characteristics of the wheat growth process are detected, such as rapid growth, remaining relative unchanged, and harvest. As discussed above, the winter wheat enters the rapid growth stage after DOY 60, and reaches a peak of approximately 0.7 m around DOY 120. After that, the wheat height remains relatively unchanged until DOY 156. During the DOY 168–172 period, the wheat height recovers rapidly after harvest. These results show that the in situ GNSS height retrievals are able to detect the change process in wheat height.
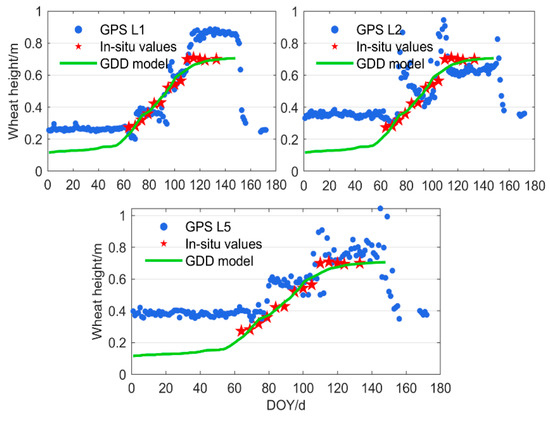
Figure 7.
Wheat height retrieval with GPS.

Figure 8.
Wheat height retrieval with GLONASS.

Figure 9.
Wheat height retrieval with Galileo.
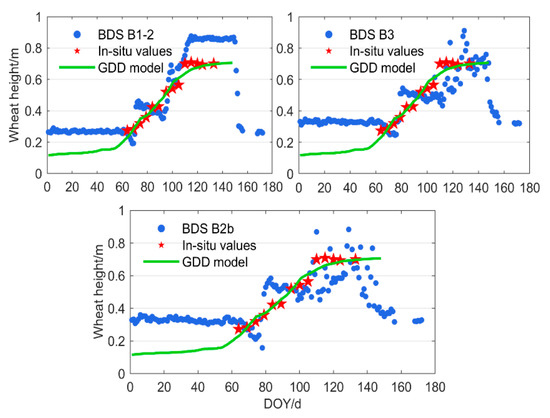
Figure 10.
Wheat height retrieval with BDS.
It is worth noting that the steady change trend in wheat height did not represent the actual wheat growth during the DOY 1–60 and DOY 166–172 periods, for which the values should be closer to zero. Generally speaking, it is almost impossible to retrieve wheat height of less than one wavelength due to the difficulty in distinguishing the surface of the wheat and the soil [30].
In addition, the retrievals of different frequency bands of different systems are also inconsistent. For the GPS and BDS systems, the retrieval height of L1 and B1-2 are clearly better than these of L2/L5 and B2b/B3. Similarly, for GLONASS and Galileo, the results of the first frequency band (G1/E1) are better than that of the second frequency band (G2/E5b). However, the L1 frequency retrievals, of which the wavelength is nearly 0.19 m, have the problem of being over high after heading stage. The differences between the retrieval and in situ values reach 0.1764, 0.1688, 0.1641 and 0.1599 m, respectively, which are close to one wavelength for these frequencies. One possible reason is the relationship between the signal penetration depth and the GNSS signal wavelength; that is, the higher the frequency, the larger the signal attenuation and the shallower the penetration depth. In early May, the wheat forms a new reflection layer on the top of the wheat crop, resulting in penetration by the GNSS signals. The L1 frequency band may stay at the surface layer of the canopy and may then be reflected, while the L2 frequency penetrates a certain thickness of wheat ears before being received.
3.2.2. Segmented Processing
The segmented processing method in Section 2.3.2 is used to solve the problem above. Figure 11 shows an example of the segmented processing results based on the GPS. Note that, compared with the retrieval results obtained directly, the results of the segmented processing method are more consistent with the in situ measured values and the GDD model simulations, especially the GPS L1 frequency, which is more in line with the changing trend of the actual winter wheat growth process. Compared with Figure 6, the retrieval values are closer to the in situ values during DOY 115–150.
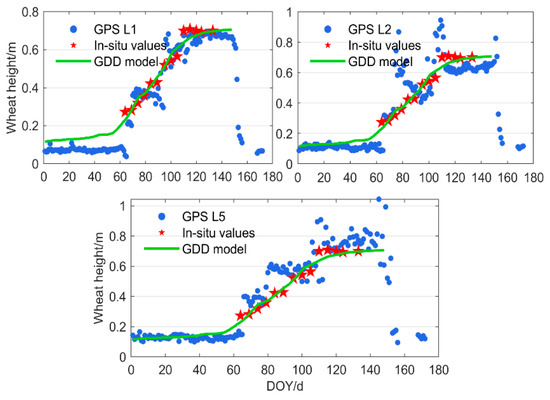
Figure 11.
Wheat height retrieval with the GPS system using segmented processing.
The relative wheat height retrievals of the L1 frequency band using the segmented processing method are compared with the in situ height observations in Table 2. There are no in situ measured values at the beginning and after harvest; only a comparison of wheat height after the heading stage is shown here.
Table 2.
Relative deviations of L1 frequency band between wheat height retrievals, in situ observations and GDD model.
The retrieval performance of these two methods is inconsistent. The differences between the four in situ observations and the original retrievals H are obviously larger due to the segmented processing. Specifically, the deviation in the original method ranges from 0.12 m to 0.17 m, and the deviation in this proposed method is from −0.06 m to −0.01 m, exhibiting a negative bias. This is consistent with the previous conclusion: due to the penetration of the L-band signal through the wheat, the retrievals results are significantly smaller than the in situ observations generally. The segmented processing results are closer to the observed growth trend than the GDD simulations. Additionally, the proposed method presents a much better fit for the in situ measurements than the original retrievals.
3.2.3. Multi-Frequency and Multi-System Fusion
To make full use of the abundant GNSS signal multi-frequency and multi-system resources, the method described in Section 2.3.3 is used to fuse the retrievals. The fusion results are depicted in Figure 12.

Figure 12.
Fusion wheat height retrieval.
The retrieval results based on the fusion method in Section 2.3.3 are in good agreement with the in situ observations and the GDD simulations, which fully proves the feasibility and accuracy of wheat height retrieval using multi-frequency and multi-system signals. In contrast, compared with the raw retrievals, the retrievals show great correspondence with the GDD model simulations in DOY 1–60 and 110–157, which proves that the application of GNSS signals for monitoring changes in wheat height has considerable potential. However, it is still necessary to collect more in situ wheat height observations to further analyze and verify the universality and accuracy of this technology.
4. Discussion
In the HNFQ site experiment, the errors between the wheat height retrieval and the GDD model simulations produced by four GNSS system with multi-frequency after segmented processing are illustrated in Figure 13, Figure 14, Figure 15 and Figure 16. Clearly, most of the residuals are concentrated within ±0.15 m, while those from the L5/G2/E5b/B2b frequency band are slightly larger, with a variation of ±0.20 m. The errors based on the L1/G1/E1/B1-2 frequency are slightly better than those of the other frequency, and have the highest accuracy, with most stable residuals smaller than ±0.08 m. In particular, for all frequencies, the residuals increase slowly during the DOY 1–60 period, which may be caused by the rising GDD simulation values and the relatively stable retrieval values. The residuals during the DOY 80–115 period are slightly larger than those at other growth stages. With the rapid wheat growth, the space between the winter wheat becomes larger, and the wheat is well penetrated by the GNSS signals, which explains the above phenomenon. In addition, after the segmented correction, the wheat height residuals of the L1 frequency significantly decrease at the heading stage. In general, this proposed method can effectively overcome the problems of over high and low accuracy.

Figure 13.
Retrieval errors of wheat height with GPS.

Figure 14.
Retrieval errors of wheat height with GLONASS.
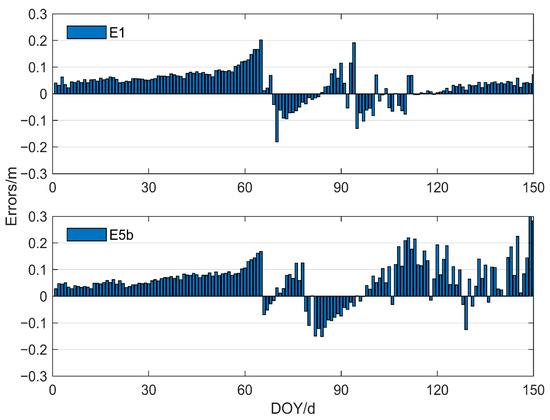
Figure 15.
Retrieval errors of wheat height with Galileo.
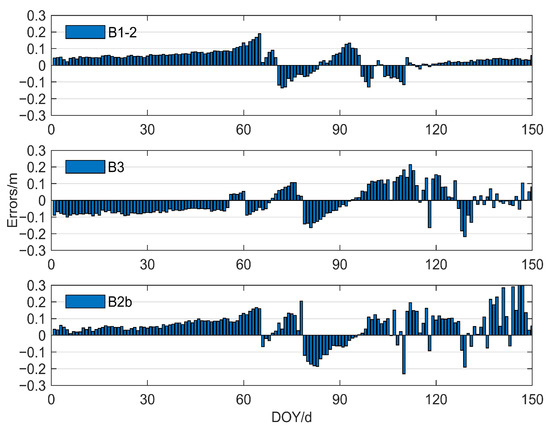
Figure 16.
Retrieval errors of wheat height with BDS.
In terms of correlation, the scatterplot of the wheat height retrieval at HNFQ site using multi-system and multi-frequency fusion is depicted in Figure 17. It shows that the retrievals are consistent with the trend of the in situ values, which are basically distributed on both sides of the regression line. Additionally, we obtained the following score values from the HNFQ site: RMSE = 0.0383 m, mean-absolute error (MAE) = 0.0301 m. The correlation coefficient of the proposed combination method is the largest, reaching 0.9555, which effectively overcomes the uncertainty discussed above and greatly improves the stability and accuracy of wheat height retrieval.

Figure 17.
Correlation between the proposed method and wheat height.
In addition, the performance of the proposed method is compared with that of other single frequency methods of four GNSS. Table 3 shows the accuracy in terms of HNFQ site error statistics based on the multiple retrieval methods.
Table 3.
Wheat height retrieval precision statistics.
It can be seen from Table 3 that all the height retrievals are in good agreement with the limited in situ observations, which means that the proposed method performs best. Most of RMSEs and MAEs are nearly 0.095 m and 0.081 m, respectively. Except for the GPS L1 frequency with 0.8868, the retrievals based on a single frequency are almost all below 0.85, proving the difference between the different frequencies based on the GNSS system, while the R2 of the proposed method is above 0.9, reaching 0.955 m. The RMSE and MAE compared with the single frequency results are decreased to a great extent. Specifically, the average correlation coefficient of the proposed method is increased by 27.25%, the average RMSE is decreased by 60.23% and the average MAE is decreased by 62.79%. That is, the height retrieval method can be applied to all GNSS system, especially the proposed multi-system and multi-frequency fusion method, taking full advantage of the difference and complementarity of GNSS signals with different frequencies to improve the retrieval accuracy. It is worth mentioning that due to the single experimental site, the applicability of the proposed model for wheat height retrieval needs to be further verified.
5. Conclusions
Different from traditional navigation, positioning and timing (PNT) services, GNSS has been widely explored as an efficient remote sensing tool, with GNSS-IR technology being used for surface environmental monitoring. Essentially, the contribution of this research is to evaluate the performance of wheat height retrieval using different GNSS. To fully exploit the advantages of multi-mode GNSS combination, a fusion method is proposed to retrieve winter wheat height using multi-frequency and multi-system SNR data and its performance is verified by using in situ measurements from the HNFQ site and simulated values from GDD model.
The long-term experiment in Henan station showed that the retrieval results of a single frequency from four GNSS (GPS/GLONASS/Galileo/BDS) can reflect the height change process of most wheat growth stages after overwintering. In terms of wheat height accuracy, the proposed method performed better than the traditional method using a single frequency. There was good correlation between the in situ values and the retrieval values, with a correlation coefficient of 0.9555, and a corresponding RMSE and MAE of 0.0383 m and 0.0301 m, respectively. These improvements mainly benefited from the data fusion of the multi-frequency and multi-system. Compared with the retrievals from a single frequency, the R2, RMSE and MAE improved on average by 27.25%, 60.23% and 62.79%, respectively. Therefore, retrieving wheat height based on the proposed method may have application in crop monitoring with high time resolution and accuracy.
In the future, we will continue to observe the Henan site for a long period to obtain more information about other relevant crops, such as corn, to confirm the potential and adaptability of this technology. At the same time, future research will focus on using GNSS SNR data to obtain other crop indicators, for example, the division of the growth cycle or crop yield.
Author Contributions
M.S. proposed the method and designed the experiments; K.C. collected and carried out initial processing of the experiment data; M.S. and K.C. wrote the paper; F.S. modified the paper and provided supervision; all of the authors contributed the discussion. All authors have read and agreed to the published version of the manuscript.
Funding
This work was sponsored by the National Natural Science Foundation of China (No. 41904018, No. 42077003) and Natural Science Foundation of Jiangsu Province (No. BK20190714, BK20201374), and funded by the Key Laboratory of Land Satellite Remote Sensing Application, Ministry of Natural Resources of the People’s Republic of China (2022).
Data Availability Statement
All data included in this study are available upon request by contact with the corresponding author.
Acknowledgments
The authors gratefully acknowledge the IGS and its analysis centers for providing GNSS data and precise products. Our thanks to the Fengqiu Experimental Station for Agro-ecology Chinese Academy of Sciences for providing the experimental site and the corresponding power supply equipment.
Conflicts of Interest
The authors declare no conflict of interest.
References
- Qian, Y.; Mao, L.; Zhou, G. Changes in global main crop yields and its meteorological risk assessment. Trans. CSAE 2016, 32, 226. [Google Scholar]
- Zhang, M.; Zhou, Q.; Chen, Z.; Jia, L.; Zhou, Y.; Cai, C. Crop discrimination in Northern China with double cropping systems using Fourier analysis of time-series MODIS data. Int. J. Appl. Earth Obs. Geoinf. 2008, 10, 476–485. [Google Scholar]
- Kumar, P.; Prasad, R.; Gupta, D.K.; Mishra, V.N.; Vishwakarma, A.K.; Yadav, V.P.; Bala, R.; Choudhary, A.; Avtar, R. Estimation of winter wheat crop growth parameters using time series Sentinel-1A SAR data. Geocarto Int. 2018, 33, 942–956. [Google Scholar] [CrossRef]
- Yuan, W.; Li, J.; Bhatta, M.; Shi, Y.; Baenziger, P.S.; Ge, Y. Wheat Height Estimation Using LiDAR in Comparison to Ultrasonic Sensor and UAS. Sensors 2018, 18, 3731. [Google Scholar] [CrossRef] [PubMed]
- Liao, C.; Wang, J.; Shang, J.; Huang, X.; Liu, J.; Huffman, T. Sensitivity study of Radarsat-2 polarimetric SAR to crop height and fractional vegetation cover of corn and wheat. Int. J. Remote Sens. 2017, 39, 1475–1490. [Google Scholar] [CrossRef]
- Hall, C.D.; Cordey, R.A. Multistatic Scatterometry. In Proceedings of the International Geoscience & Remote Sensing Symposium, Edinburgh, UK, 12–16 September 1988. [Google Scholar]
- Alonso-Arroyo, A.; Camps, A.; Park, H.; Pascual, D.; Onrubia, R.; Martín, F. Retrieval of Significant Wave Height and Mean Sea Surface Level Using the GNSS-R Interference Pattern Technique: Results From a Three-Month Field Campaign. IEEE Trans. Geosci. Remote Sens. 2015, 53, 3198–3209. [Google Scholar] [CrossRef]
- Guo, W.; Du, H.; Cheong, J.; Southwell, B.A.G. Dempster. GNSS-R Wind Speed Retrieval of Sea Surface Based on Particle Swarm Optimization Algorithm. IEEE Trans. Geosci. Remote Sens. 2022, 60, 4202414. [Google Scholar] [CrossRef]
- Mashburn, J.; Axelrad, P.; Zuffada, C.; Loria, E.; O’Brien, A.; Haines, B. Improved GNSS-R Ocean Surface Altimetry with CYGNSS in the Seas of Indonesia. IEEE Trans. Geosci. Remote Sens. 2020, 58, 6071–6087. [Google Scholar] [CrossRef]
- Ozafrain, S.; Roncagliolo, P.; Muravchik, C. Likelihood Map Waveform Tracking Performance for GNSS-R Ocean Altimetry. IEEE J. Sel. Top. Appl. Earth Obs. Remote Sens. 2019, 12, 5379–5384. [Google Scholar] [CrossRef]
- Yan, Q.; Huang, W. Spaceborne GNSS-R Sea Ice Detection Using Delay-Doppler Maps: First Results From the U.K. TechDemoSat-1 Mission. IEEE J. Sel. Top. Appl. Earth Obs. Remote Sens. 2016, 9, 4795–4801. [Google Scholar] [CrossRef]
- Strandberg, J.; Hobiger, T.; Haas, R. Coastal Sea Ice Detection Using Ground-Based GNSS-R. IEEE Geosci. Remote Sens. Lett. 2017, 14, 1552–1556. [Google Scholar] [CrossRef]
- Small, E.E.; Larson, K.M.; Chew, C.C.; Dong, J.; Ochsner, T.E. Validation of GPS-IR Soil Moisture Retrievals: Comparison of Different Algorithms to Remove Vegetation Effects. IEEE J. Sel. Top. Appl. Earth Obs. Remote Sens. 2016, 9, 4759–4770. [Google Scholar] [CrossRef]
- Vey, S.; Güntner, A.; Wickert, J.; Blume, T.; Ramatschi, M. Long-term soil moisture dynamics derived from GNSS interferometric reflectometry: A case study for Sutherland, South Africa. GPS Solut. 2016, 20, 641–654. [Google Scholar] [CrossRef]
- Zhu, Y.; Shen, F.; Sui, M.; Cao, X. Effects of Parameter Selections on Soil Moisture Retrieval Using GNSS-IR. IEEE Access 2020, 8, 211784–211793. [Google Scholar] [CrossRef]
- Chen, K.; Cao, X.; Shen, F.; Ge, Y. An Improved Method of Soil Moisture Retrieval Using Multi-Frequency SNR Data. Remote Sens. 2021, 13, 3725. [Google Scholar] [CrossRef]
- Shen, F.; Sui, M.; Zhu, Y.; Cao, X.; Ge, Y.; Wei, H. Using BDS MEO and IGSO Satellite SNR Observations to Measure Soil Moisture Fluctuations Based on the Satellite Repeat Period. Remote Sens. 2021, 13, 3967. [Google Scholar] [CrossRef]
- Wan, W.; Larson, K.M.; Small, E.E.; Chew, C.C.; Braun, J.J. Using geodetic GPS receivers to measure vegetation water content. GPS Solut. 2015, 19, 237–248. [Google Scholar] [CrossRef]
- Yuan, Q.; Li, S.; Yue, L.; Li, T.; Shen, H.; Zhang, L. Monitoring the Variation of Vegetation Water Content with Machine Learning Methods: Point–Surface Fusion of MODIS Products and GNSS-IR Observations. Remote Sens. 2019, 11, 1440. [Google Scholar] [CrossRef]
- Larson, K.M.; Gutmann, E.D.; Zavorotny, V.U.; Braun, J.J.; Williams, M.W.; Nievinski, F.G. Can we measure snow depth with GPS receivers? Geophys. Res. Lett. 2012, 36, L17502. [Google Scholar] [CrossRef]
- Jin, S.; Najibi, N. Sensing snow height and surface temperature variations in Greenland from GPS reflected signals. Adv. Space Res. 2014, 53, 1623–1633. [Google Scholar] [CrossRef]
- Larson, K.M.; Small, E.E.; Gutmann, E.; Bilich, A.; Axelrad, P.; Braun, J. Using GPS Multipath to Measure Soil Moisture Fluctuations: Initial Results. GPS Solut. 2008, 12, 173–177. [Google Scholar] [CrossRef]
- Chew, C.C.; Small, E.E.; Larson, K.M.; Zavorotny, V.U. Effects ofnear-surface soil moisture on GPS SNR data: Development of a retrieval algorithm for soil moisture. IEEE Trans. Geosci. Remote Sens. 2014, 52, 537–543. [Google Scholar] [CrossRef]
- Chew, C.C.; Small, E.E.; Larson, K.M. An algorithm for soil moisture estimation using GPS-interferometric reflectometry for bare and vegetated soil. GPS Solut. 2016, 20, 525–537. [Google Scholar] [CrossRef]
- Larson, K.M.; Small, E.E.; Smith, W.K. Normalized microwave reflection index: Validation of vegetation water content estimates from Montana grasslands. IEEE J. Sel. Top. Appl. Earth Obs. Remote Sens. 2014, 7, 1512–1521. [Google Scholar] [CrossRef]
- Evans, S.G.; Small, E.E.; Larson, K.M. Comparison of vegetation phenology in the western USA determined from reflected GPS microwave signals and NDVI. Int. J. Remote Sens. 2014, 35, 2996–3017. [Google Scholar] [CrossRef]
- Lv, J.; Zhang, R.; Tu, J.; Liao, M.; Pang, J.; Yu, B.; Li, K.; Xiang, W.; Fu, Y.; Liu, G. A GNSS-IR Method for Retrieving Soil Moisture Content from Integrated Multi-Satellite Data That Accounts for the Impact of Vegetation Moisture Content. Remote Sens. 2021, 13, 2442. [Google Scholar] [CrossRef]
- Zhou, X.; Zheng, N.; Qi, Y.; Chen, S. Inversing of Vegetation Biomass Based on GPS-R. Bull. Surv. Mapp. 2018, 129–132. [Google Scholar] [CrossRef]
- Alonso-Arroyo, A.; Querol, J.; Camps, A.; Onrubia, R.; Park, H.; Pascual, D. Can we measure vegetation water content and vegetation opacity at L-band with a single GPS receiver? In Proceedings of the 2016 IEEE International Geoscience and Remote Sensing Symposium (IGARSS), Beijing, China, 10–15 July 2016; pp. 1985–1988. [Google Scholar]
- Humphrey, V.; Frankenberg, C. Continuous ground monitoring of vegetation optical depth and water content with GPS signals. Biogeosci. Discuss. 2022. in review. [Google Scholar] [CrossRef]
- Zhang, S.; Roussel, N.; Boniface, K.; Ha, M.; Frappart, F.; Darrozes, J.; Baup, F.; Calvet, J. Use of reflected GNSS SNR data to retrieve either soil moisture or vegetation height from a wheat crop. Hydrol. Earth Syst. Sci. 2017, 21, 4767–4784. [Google Scholar] [CrossRef]
- Zhang, S.; Wang, T.; Wang, L.; Zhang, J.; Peng, J.; Liu, Q. Evaluation of GNSS-IR for Retrieving Soil Moisture and Vegetation Growth Characteristics in Wheat Farmland. J. Surv. Eng. 2021, 147, 04021009. [Google Scholar] [CrossRef]
- Li, Y.; Yu, K.; Chang, X.; Jin, T.; Li, J. Estimation of Wheat Height with SNR Observations Collected by Low-Cost Navigational GNSS Chip and RHCP Antenna. IEEE Geosci. Remote Sens. Lett. 2022, 19, 8024905. [Google Scholar] [CrossRef]
- Nievinski, F.G.; Larson, K.M. Forward modeling of GPS multipath for near-surface reflectometry and positioning applications. GPS Solut. 2014, 18, 309–322. [Google Scholar] [CrossRef]
- Colominas, M.A.; Schlotthauer, G.; Torres, M.E. Improved complete ensemble EMD: A suitable tool for biomedical signal processing. Biomed. Signal Process. Control 2014, 14, 19–29. [Google Scholar] [CrossRef]
- Liu, Y.; Su, L.; Wang, Q.; Zhang, J.; Shan, Y.; Deng, M. Comprehensive and quantitative analysis of growth characteristics of winter wheat in China based on growing degree days. Adv. Agron. 2019, 159, 237–273. [Google Scholar]
- Wang, X.; Wang, Q.; Fan, J.; Su, L.; Shen, X. Logistic model analysis of winter wheat growth on China’s Loess Plateau. Can. J. Plant Sci. 2014, 94, 1471–1479. [Google Scholar]
Publisher’s Note: MDPI stays neutral with regard to jurisdictional claims in published maps and institutional affiliations. |
© 2022 by the authors. Licensee MDPI, Basel, Switzerland. This article is an open access article distributed under the terms and conditions of the Creative Commons Attribution (CC BY) license (https://creativecommons.org/licenses/by/4.0/).