Abstract
Synthetic aperture radar (SAR), as a wideband radar system, is easily contaminated by radio frequency interference (RFI), which affects the imaging quality of SAR. The subband spectral cancellation (SSC) method and its modifications utilize the SAR single-look complex (SLC) image to realize RFI extraction and mitigation by subtracting between sub-images, which are robust and efficient for engineering applications. In the past, the traditional SSC was often applied to narrowband interference (NBI) mitigation. However, when it was used for wideband interference (WBI) mitigation, it would cause the mitigated image to lose much of its useful information. In contrast, this paper proposes an improved SSC method based on successive cancellation and data accumulation (SSC-SCDA) for WBI mitigation. First, the fast Fourier transform (FFT) is used to characterize the SAR SLC data in the frequency domain, and the average range spectrum algorithm is used to detect whether there are interference components in the SAR SLC data. Then, according to the carrier frequency and bandwidth of the RFI in the frequency domain, the subbands are divided, and a cancellation strategy is formulated. Finally, based on the successive cancellation and data accumulation technology, WBIs can be removed by using only a small percentage of the clean subbands. Based on the simulated experiments, the interference mitigation performance of the proposed method is analyzed when the interference-to-signal bandwidth ratio (ISBR) varies from 20% to 80% under different signal-to-interference-to-noise ratios (SINR). The experimental results based on WBI-contaminated European Space Agency (ESA) Sentinel-1A SAR SLC data demonstrate the effectiveness of the proposed method in WBI mitigation.
1. Introduction
Synthetic aperture radar (SAR) plays a vital role in military, civil, and scientific research fields by virtue of its all-day, all-weather, and high-resolution characteristics [1]. However, with the increasingly prevalent application of modern radio technology, electromagnetic spectrum resources are becoming scarcer, which will potentially increase the possibility of occurring radio frequency interference (RFI) [2]. Figure 1 shows the RFI probability map of the European Space Agency (ESA) Sentinel-1A. RFI mainly comes from television, communication equipment, microwave radar, etc., whose operating frequency overlaps with the frequency band of the SAR system [3,4]. When the RFI is received by the SAR system, RFI will affect the pulse responses of SAR signals, degrade the qualities of SAR images, and further hinder the subsequent image interpretations and engineering applications. For RFI-contaminated SAR images, detecting and removing RFI can improve the application accuracy of various ship detection methods [5,6]. Therefore, it is significant to mitigate various RFIs in SAR data. According to the bandwidth of RFI, RFI can be classified into two categories: narrowband interference (NBI) and wideband interference (WBI). Generally, the former bandwidth is no more than 2% of the SAR system bandwidth, and the interference exceeding this ratio is considered WBI [7]. Due to the latter bandwidth occupying a large portion of the SAR system, WBI mitigation is challenging [8].
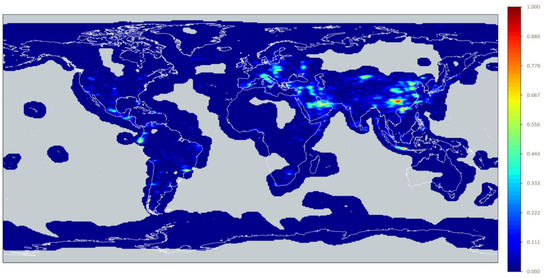
Figure 1.
Map showing the probability of experiencing RFI of at least 1000 K [9].
In the past few decades, numerous methods to mitigate RFI have been proposed, which can be divided into three categories: parametric methods, semi-parametric methods, and non-parametric methods [2]. The parametric methods estimate the RFI parameters by establishing an RFI parameterized model, and then the RFI from the SAR data is removed [10]. Braunstein et al. established the sine wave model of the interference signal and proposed the maximum likelihood estimation method for NBI mitigation [11]. Miller et al. established the sinusoidal superposition model of the NBI signal and combined the least-squares method to estimate the model parameters to suppress NBI [12]. Liu et al. proposed to use the iterative adaptive approach (IAA) to estimate the model parameters of the NBI signal and obtained the interference suppression results’ balancing speed and efficiency [13]. Compared with NBI, the signal form of WBI is complex and diverse, so it is more difficult to establish an accurate parametric model, and its research is relatively rare. Yang et al. combined time-frequency analysis technology to expand the IAA method, making it suitable for WBI suppression [14]. In 2021, Zhou et al. proposed a method based on instantaneous frequency estimation and regularized time-frequency filtering to estimate and extract the WBI components for suppression [15].
Semi-parametric methods transform the RFI mitigation problem into a hyperparameter optimization problem. The RFI optimization model is established based on low-rank and sparse characteristics, and RFI is mitigated by solving optimization problems [16]. In 2014, Nguyen et al. first proposed the idea of the semi-parametric interference suppression method and carried out a series of pioneering studies [17]. Liu et al. extended the sparse reconstruction algorithm to the WBI suppression [18]. Since 2018, Huang et al. have conducted in-depth research on semi-parametric interference suppression methods and proposed a series of “low-rank + sparse” decomposition models [19,20,21,22,23], which further improved the relevant theories and models. In 2021, Nguyen et al. further improved their semi-parametric interference suppression model and proposed a joint down-range and cross-range RFI suppression method [24]. In the same year, Zhou et al. proposed an RFI suppression algorithm based on the time-frequency constraint of joint low-rank and sparsity properties [25]. In 2022, Zhang et al. proposed an improved RFI mitigation approach based on the low-rank sparse decomposition from the perspective of useful signal protection [26].
Non-parametric methods use the intensity characteristics differences between the interferences and real echoes to mitigate RFI. The notch filter method and its modifications are classical non-parametric RFI mitigation methods [27]. They effectively notch RFI in the transform domain. However, when the interference is WBI, a copious loss of useful signal during processing will seriously degrade the side-lobe levels. Xu Wei et al. proposed a two-step notch method based on a linear prediction model to compensate for the missing spectrum and improve the interference suppression effect [28]. Another popular non-parametric method uses matrix decomposition to separate and mitigate RFI. The eigen-subspace projection (ESP) method, proposed by Zhou et al., is a representative matrix decomposition method [29]. Through eigenvalue decomposition, the ESP method can effectively separate the SAR signal component and the interference component and obtain a better interference suppression effect. In 2022, Li et al. proposed an improved ESP method to mitigate the mutual RFI between SAR satellites [30]. After that, their team successively proposed interference suppression methods based on matrix decomposition, such as independent component analysis [31], complex empirical mode decomposition [32], and independent subspace analysis [33], and achieved good suppression effects. In 2022, Li et al. proposed a modified EMD method to mitigate NBI in SAR data, which protected the SAR’s useful signal and improved the mitigated image quality [34].
Most of the above methods realize RFI extraction and mitigation in the echo domain. However, modern SAR systems generally do not provide raw echo data and only provide level one and higher-level products, which hinders the extended application of existing methods. Even though a few methods can be used on SAR SLC data, they are less effective in mitigating WBI, such as the FNF and ESP methods. To conquer this circumstance, Feng et al. [35] proposed the subband spectral cancellation (SSC) method that utilized SAR SLC images to mitigate RFI. This method has the advantages of robustness, low computational cost, and ease of engineering application. Yang et al. [36] improved the SSC method. RFI detection was first performed by using a useful subband spectral kurtosis detector, and its results were then used for RFI mitigation. Li et al. [37] further improved the SSC method, which achieved secondary interference detection and avoided the loss of detailed information in the image.
Both traditional SSC and its modifications only focus on mitigating NBI. When they were used for WBI mitigation, it would cause the mitigated image to lose much of its useful information. However, in some practical situations, the SAR systems may be contaminated by WBI, so the traditional SSC and its modifications cannot be applied to WBI mitigation directly. In this paper, an improved SSC method based on successive cancellation and data accumulation (SSC-SCDA) is proposed for WBI mitigation. First, the SAR SLC data are transformed to the range-frequency domain with the fast Fourier transform (FFT), and the average range spectrum algorithm is used to detect whether there is RFI. Then, the RFI carrier frequency and bandwidth are analyzed in the frequency domain. According to the interference bandwidth and the frequency band of the interference carrier frequency in the SAR spectrum, the subbands are divided, and the cancellation strategy is formulated. Finally, based on successive cancellation and data accumulation technology, WBI is mitigated with a limited fraction of clean subband. Based on the simulation experiments of the ESA Sentinel-1A SAR SLC image, the interference mitigation performance of the proposed method is analyzed when the interference-to-signal bandwidth ratio (ISBR) is from 20% to 80%. The experimental results based on WBI-contaminated ESA Sentinel-1A SAR SLC data demonstrate the potential of the proposed method in WBI mitigation.
In conclusion, the contribution of this paper can be summarized as follows:
- A WBI mitigation algorithm based on SAR SLC images is proposed. The vast majority of the previous works on removing WBI are based on SAR raw echo data and cannot be directly applied to SAR SLC data. Even though a few methods can be used on SAR SLC data, they are less effective in mitigating WBI. Compared with previous RFI mitigation methods, SSC-SCDA is based on the SAR SLC images to mitigate WBI, which is more suitable for modern SAR systems. The algorithm utilizes successive cancellation and data accumulation technology to extend the traditional SSC algorithm into WBI mitigation, which enables it to extract and remove WBI in SAR SLC images effectively.
- The interference mitigation performance of the proposed algorithm under different ISBRs is evaluated. Under complicated heterogeneous scenarios, combining the RFI-free measured SAR data with the WBIs of different ISBRs, the mitigation performance of the algorithm against WBIs with different bandwidths is qualitatively and quantitatively evaluated.
- The performance and practicability of the proposed algorithm in a realistic environment are further verified by the experimental results of the measured SAR SLC data with the WBI bandwidth exceeding 50% of the SAR system bandwidth.
The MATLAB code implementation of SSC-SCDA is available at https://github.com/cococbx/SSC-SCDA, Kaifeng, China, 29 August 2022.
2. Related Work
2.1. Interference Formulation and Analysis
In complex electromagnetic environments, SAR systems may be affected by RFI. Each echo received by the SAR system can be considered as a 1-D time series. Assuming that each returned echo contains equally spaced samples, the RFI-contaminated SAR echo can be modeled as the sum of the target echoes, RFI, and noise:
where , and denote the useful target echoes, RFI, and system noise, respectively; denotes the sampling index. According to the bandwidth of RFI, RFI can be classified into two categories: NBI and WBI. NBI can be expressed as the sum of sinusoidal function signals:
where , and denote the amplitude, carrier frequency, and phase for the l-th interference component, respectively. Generally, WBI is considered to contain two major forms: linear frequency modulation (LFM) WBI and sinusoidal frequency modulation (SFM) WBI. The LFM WBI can be formulated as
where , and denote the amplitude, carrier frequency, and chirp rate of the l-th interference component, respectively. The SFM WBI can be formulated as
where , , and denote the amplitude, modulation factor, carrier frequency, and initial phase of the l-th component, respectively.
Figure 2 shows RFI-contaminated SAR echoes in different domains. These SAR echoes are acquired from a spaceborne SAR system working in the C-band. The SAR echoes contaminated with NBI and WBIs are shown in Figure 2a,d,g, respectively. It can be seen that there is no difference in the characterization of NBI and WBIs in the time domain, and the bandwidth of the RFI cannot be distinguished. The SAR echoes are transformed to the range-frequency domain by FFT, and the range spectrums of the RFI-contaminated SAR echoes are shown in Figure 2b,e,h, respectively. The range spectrum of the NBI-contaminated SAR echo is shown in Figure 2b. As shown in the figure, the energy of NBI is mainly concentrated in certain frequency units of the SAR range spectrum, and the spectral amplitude of NBI is much larger than that of the SAR useful signal. Figure 2e,h shows the range spectrums of the WBI-contaminated SAR echoes. It can be seen that the bandwidths of the WBIs occupy a large part of the bandwidth of the SAR signal, and the spectral amplitudes of the WBIs are stronger than that of the useful signal. Figure 2c shows the 2-D time-frequency representation of the NBI-contaminated SAR echo. In the figure, the horizontal direction represents the range time, and the vertical direction represents the range frequency. It can be seen that the NBI appears as an almost horizontal bright line in the 2-D time-frequency domain, which corresponds to the above-mentioned characteristics of the NBI in the frequency domain, and its energy is higher than that of the useful signal in the time-frequency spectrum. Figure 2f shows the 2-D time-frequency representation of the SAR echo contaminated by the LFM WBI. As shown, the oblique bright line is the WBI and occupies a large fraction of the range frequency, whose energy is much stronger than the surrounding useful signal. Figure 2i shows the 2-D time-frequency representation of the SAR echo contaminated by the SFM WBI. As described in Equation (4), the SFM WBI presents a bright sinusoidal function in the time-frequency domain.
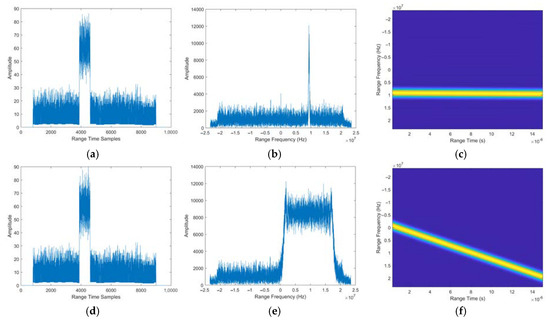

Figure 2.
The RFI-contaminated SAR echoes in different domains. (a) The NBI-contaminated SAR echo in the time domain, (b) the NBI-contaminated SAR echo in the range-frequency domain, (c) the NBI-contaminated SAR echo in the time-frequency domain, (d) the LFM WBI-contaminated SAR echo in the time domain, (e) the LFM WBI-contaminated SAR echo in the range-frequency domain, (f) the LFM WBI-contaminated SAR echo in the time-frequency domain, (g) the SFM WBI-contaminated SAR echo in the time domain, (h) the SFM WBI-contaminated SAR echo in the range-frequency domain, (i) the SFM WBI-contaminated SAR echo in the time-frequency domain.
2.2. Theory of SSC
Due to the fact that the SAR imaging process does not change the bandwidth of the SAR signal, the RFI still maintains its frequency domain characteristics in the SLC data. To explain the SSC method clearly, two subbands are taken as an example. The same case applies to the multiple subbands.
The SAR echo data with RFI is shown in Equation (1). Without considering the influence of system noise, the total power spectrum of the SLC data can be expressed as
where , and denote the SAR SLC data, clean SLC data, and RFI SLC data, respectively.
The SAR SLC image is converted to the range-frequency domain by FFT [38,39,40], which can be formulated as
where denotes the SAR spectrum and denotes the FFT operation. The interference is detected in the range-frequency domain by the subband spectral kurtosis detection algorithm [36], and then the spectrum is divided into two range subband spectrums with and without interference. Two sub-images and are obtained by performing an inverse FFT on the two subband spectrums, which can be formulated as
where denotes the RFI subband spectrum, denotes the clean subband spectrum, and denotes the inverse FFT operation. and can be expressed as
where and denote two sub-images without RFI, respectively. Obviously, the power spectrums of the sub-images can be expressed as
Make the subtraction between Equation (10) and Equation (11):
The compensation and internal calibration are performed in the measured data processing to obtain the approximately same amplitude of the sub-image signals. After this operation, Equation (13) can be obtained:
After substituting Equation (13) into Equation (12), the interference image signal can be obtained as
The RFI-free image can be obtained according to Equation (5):
According to the above theoretical derivation, the main idea of the SSC method firstly extracts the interference signal through the cancellation operation between the sub-images and then obtains the mitigated SAR image by subtracting the RFI from the SAR SLC intensity image. The flow chart of the traditional SSC method is shown in Figure 3.
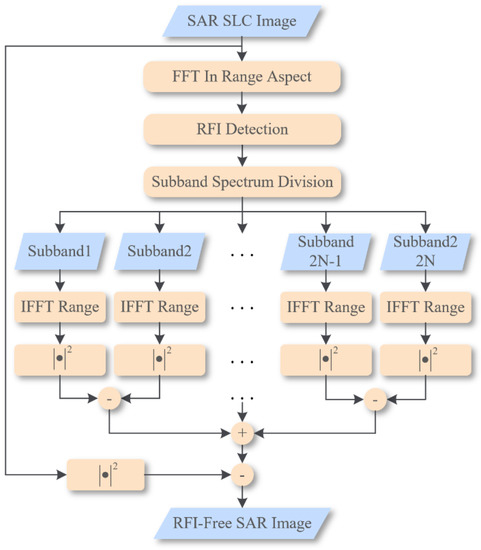
Figure 3.
The flow chart of the traditional SSC method.
As shown in Figure 3, the SAR range spectrum is divided into multiple subbands. The number of subbands is divided according to the spectrum of the NBI. Then, NBIs are extracted by pairwise cancellation between adjacent sub-images. Finally, the extracted NBI is removed from the SAR SLC image.
3. Improved SSC Method for WBI Mitigation
3.1. Problem Statement
In the previous literature on SSC, RFI is assumed to be NBI, and the improvements of SSC are all to protect the useful signal. However, in a complex electromagnetic environment, the SAR system may be contaminated by WBI.
An issue must be considered when applying the traditional SSC method to WBI mitigation. The traditional SSC method and its improvements consider that to ensure the method’s effectiveness, the number of RFI-contaminated subbands must be less than or equal to the number of clean subbands. As shown in Figure 4a, when the RFI is NBI, there are enough clean subbands to cancel the RFI-contaminated subbands. In Figure 4b, when the WBI bandwidth is relatively large and is located near the SAR carrier frequency, there are not enough clean subbands on both sides of the interference subband to cancel the WBI. In Figure 4c, when ISBR exceeds 50%, no matter where the WBI is located in the SAR spectrum, the clean subband is insufficient to cancel the interference subband. Hence, the traditional SSC method and its modifications cannot mitigate these WBIs.
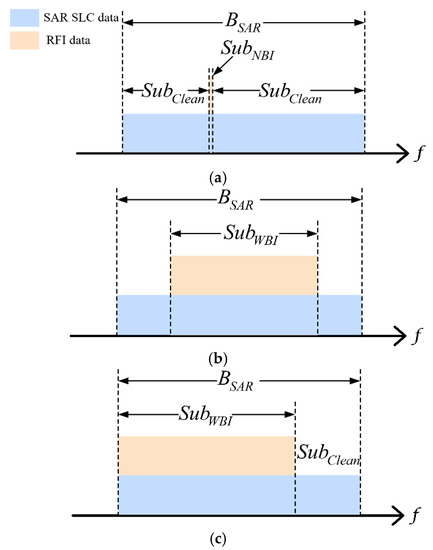
Figure 4.
The schematic diagram of subband division. (a) Subband division of NBI. (b,c) Subband division of WBI.
In Figure 4, , , and denote the SAR data bandwidth, the NBI subband, the clean subband, and the WBI subband, respectively.
3.2. Proposed Method
In order to solve the above issue, an improved SSC method based on the successive cancellation technology is proposed. The flowchart of the proposed method is shown in Figure 5.
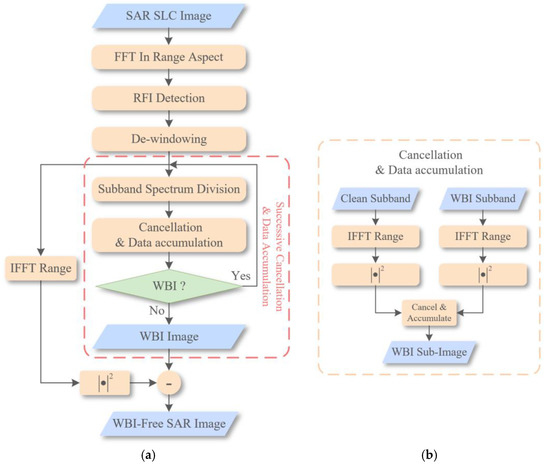
Figure 5.
The flow chart of the proposed method. (a) The flow chart of the improved SSC method. (b) The flow chart of the cancellation and data accumulation is in Figure 5a.
- Step 1: RFI detection
Since the same RFI appears in the same frequency units in the range-frequency domain, the range spectrum of the RFI will show a strong range coherence, while the SAR target signal does not have this characteristic. The power of the RFI is stronger than the power of the SAR signal, and after coherent accumulation, the RFI will show an obvious mutation in the range-frequency domain.
First, the SAR SLC data is converted to the range-frequency domain by FFT. Then, the range spectrum is superimposed along the azimuth direction. Finally, the average range spectrum is obtained by taking the average value of the superimposed range spectrum. The average range spectrum can be formulated as
where denotes the number of the range sampling points.
After the superposition and average processing, the spectrum of the SAR range signal is smooth, while the WBI spectrum is accumulated to form a mutation with a certain width. Through the above detection process, the frequency range of the WBI can be determined, which provides a basis for the subsequent subband division.
- Step 2: Subband division
The key to the proposed method is the establishment of Equation (13). To wit, the amplitudes of the divided subbands and are approximately equal. However, modern SAR systems often perform windowing operations in the imaging process, which makes the SAR spectrum uneven, so the range amplitude spectrum must perform the de-windowing operation first. The de-windowing operation is performed on the 1-D range amplitude spectrum. Construct the de-windowing function to multiply the range spectrum. The de-windowing function can be expressed as
where denotes the range-frequency sampling points, denotes the SAR system bandwidth and denotes the window function. Different SAR systems use different window functions in imaging processing. Therefore, the window function should be selected according to the actual situation in the measured data processing. The window functions usually used in imaging processing include the Kaiser window, the Hamming window, the Hanning window, and the like.
After the de-windowing operation, the amplitudes of the SAR range spectrum are approximately the same. Finally, according to the detection results of step 1, the SLC data is divided into two groups: clean subband and WBI subband.
- Step 3: Successive cancellation and data accumulation
When the clean subband is not enough to cancel the WBI subband, a portion of the WBI subband is first cancelled with a small clean subband. Then, the cancelled subband and the original clean subband are accumulated into a new clean subband. Continue using the accumulated clean subband to cancel the remaining WBI subbands. Repeat the above operations until the WBI is cancelled altogether.
The algorithm flow of the successive cancellation and data accumulation technology is shown in Algorithm 1.
| Algorithm 1 The Successive Cancellation and Data Accumulation Technology Algorithm |
Input:
. . Repeat . . . . . . . If ; else . End Until. Output:. |
The schematic diagram of the successive cancellation and data accumulation technology is shown in Figure 6.
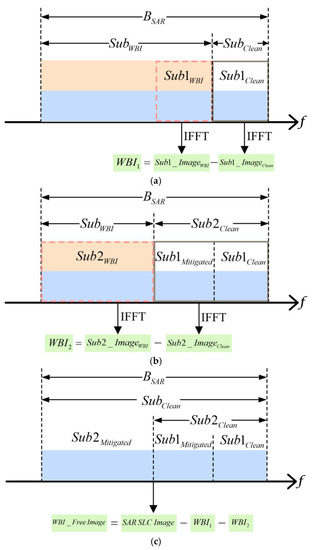
Figure 6.
The schematic diagram of the successive cancellation and data accumulation technology. (a) Before the successive cancellation. (b,c) After successive cancellation.
As shown in Figure 6, and denote the RFI-mitigated subbands after cancellation; and denote a part of the WBI subband. In Figure 6a, based on the successive cancellation technology, the clean subband with the gray box is first used to cancel the partial subband of the WBI in the red dashed box, which can be expressed as
where denotes the cancelled WBI sub-image. Then, as shown in Figure 6b, the is accumulated to increase the number of clean subbands samples for subsequent RFI cancellation, further improving the bandwidth used for interference mitigation, which can be expressed as
where denotes the accumulated clean sub-image. Finally, the remaining WBI subband in the red dashed box in Figure 6b is cancelled with the accumulated clean sub-image to obtain the mitigated SAR image, which can be expressed as
where denotes WBI-mitigated SAR image.
4. Experimental Results
4.1. Results of the Simulated Experiments
In order to analyze the performance of the proposed method in WBI mitigation, the simulated experiments based on the ESA Sentinel-1A SAR SLC images were carried out. The ISBR and signal-to-interference-noise ratio (SINR) are defined to analyze the mitigation performance of the proposed method under different interference bandwidths and strengths. The ISBR is set from 20% to 80%, increased by 10% steps. The SINR are set as 10 dB, 0 dB, −10 dB, and −20 dB, respectively.
The main system parameters are summarized in Table 1.

Table 1.
Main system parameters of the simulation.
The simulated experimental results are shown in Figure 7. In these 2-D images, the up dimension is the azimuth direction, and the lateral dimension is the range direction. The SAR images contaminated by WBI with SINR of −10 dB are given in Figure 7a–g, whose ISBRs are 20%, 30%, 40%, 50%, 60%, 70%, and 80%, respectively. The WBIs in these images appear as fog-like or streak-like artifacts, which obscure the ground targets and make the whole SAR image blurry. The corresponding SAR images after WBI mitigation are shown in Figure 7h–n, respectively. It can be seen that all WBIs are mitigated to some extent.

Figure 7.
Simulated interference mitigation results in different ISBRs. (a–g) Contaminated SAR images with ISBR of 20%, 30%, 40%, 50%, 60%, 70%, 80%, respectively. (h–n) Mitigated SAR images with ISBR of 20%, 30%, 40%, 50%, 60%, 70%, and 80%, respectively. (1)–(14) ROIs in (a–n) with green boxes.
For further comparison, the regions of interest (ROI) marked with green boxes in Figure 7a–n are zoomed in, as shown in Figure 8a–n. As can be seen from Figure 8h–j, when the ISBR varies from 20% to 40%, the side-lobes of the strong point targets with the green boxes are not abnormal, and the airport runways are clear. In Figure 8k, although the airport runway can still be distinguished, the range side-lobe of the strong point target rises slightly. In Figure 8l, when the ISBR is 60%, the airport runway becomes indistinguishable, and the range side-lobe is noticeably abnormal. As can be seen, in Figure 8m,n, the airport runways are completely indistinguishable and strong point targets are defocused when the ISBR varies from 70% to 80%. Due to the loss of a large number of useful signals, the signal-to-noise ratios of the images are degraded, and the SAR images become defocused and blurry.

Figure 8.
ROIs in Figure 7a–n with green boxes. (a–n) Strong point targets with green boxes.
The range profiles of the strong point target in the green boxes in Figure 8h,k,n are shown in Figure 9. It can be seen that when the ISBR is around 80%, the range side-lobes of the strong point target are severely distorted and significantly higher than other side-lobes. The range side-lobe for an ISBR of around 50% is similar to that with an ISBR of 20%. It is shown that the proposed method has a better suppression performance when the ISBR is around 50% and below.
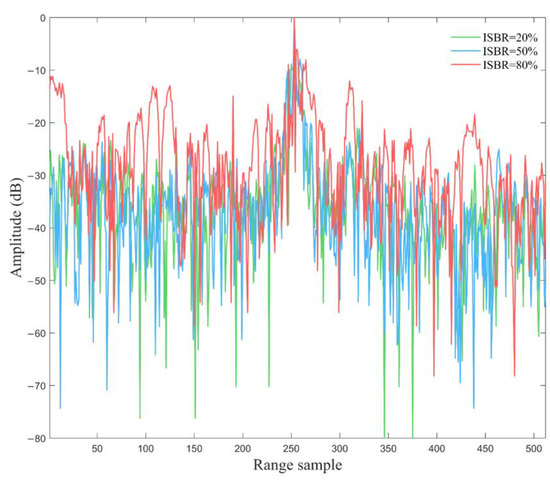
Figure 9.
Range profiles of the strong point targets are in the green boxes.
Root mean square error (RMSE) is used to analyze the mitigation performance quantitatively [3]. RMSE is defined as
where denotes the SAR SLC image after mitigation, denotes the SAR SLC image without RFI and denotes the Frobenius norm. RMSE describes the difference between the original SAR data and mitigated SAR data. The smaller the RMSE, the better the mitigation performance. The RMSEs with different SINRs are shown in Figure 10 when the ISBR varies from 20% to 80%. As shown in Figure 10, when the ISBR is 20% to 50%, the RFI mitigation performance with the same SINR is good and has no significant difference. When the ISBR is grown from 60% to 80%, the RFI mitigation performance deteriorates abruptly. It is proved that the mitigation performance of the proposed method continues to decline when the ISBR exceeds 60%. In the case of the same ISBR, the larger the SINR, the better the RFI mitigation performance. The RFI mitigation performance is even worse when the SINRs are −10 dB to −20 dB. It is proved that the proposed method underperforms in strong RFI mitigation. The results of RMSE validate the above analysis.
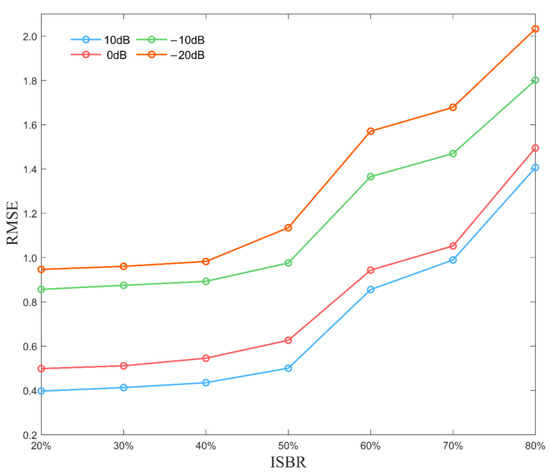
Figure 10.
RMSEs with different SINRs when the ISBR varies from 20% to 80%.
4.2. Experiment Results of the Measured WBI-Contaminated SAR SLC Data
In this section, the experimental results based on the measured SAR SLC data are given to further demonstrate the effectiveness of the proposed method in WBI mitigation. The measured SAR SLC data were acquired by the ESA C-band Interferometric Wide (IW) Sentinel-1A in Kepulauan Riau, Indonesia, on 18 December 2021. The carrier frequency of the Sentinel-1A is 5.405 GHz, and its range bandwidth is 48.3 MHz. The range sampling rate and pulse repetition frequency of the measured data are 64.35 MHz and 1452 HZ, respectively. The 1-D range FFT is performed on the measured WBI-contaminated SAR SLC data to obtain 1-D range spectrums and 2-D range spectrums. The 2-D range spectrums of the WBI-contaminated SLC data are shown in Figure 11. The 1-D range spectrums of the WBI-contaminated SLC data are shown in Figure 12.
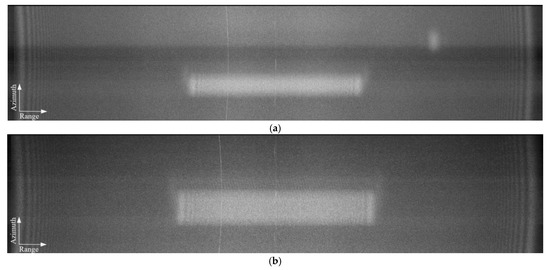
Figure 11.
The 2-D range spectrums of the WBI-contaminated SLC data. (a,b) The 2-D range spectrums of scene 1 and scene 2, respectively.
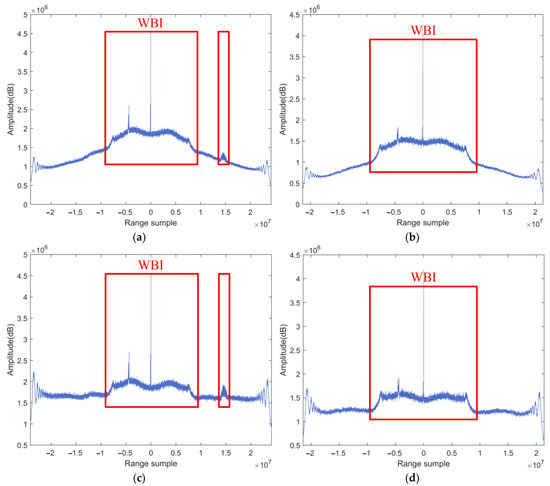
Figure 12.
The 1-D range spectrums of the WBI-contaminated SLC data. (a,b) Range spectrums of scene 1 and scene 2 before the de-windowing operation, respectively. (c,d) Range spectrums of scene 1 and scene 2 after the de-windowing operation, respectively.
It can be seen that, before the de-windowing operation, the range spectrums were bulging and irregular. After the de-windowing operation, the range spectrums become approximately flat and smooth, and the spectrums of WBI become more prominent, which benefits the subsequent subband division. The red boxes in Figure 12 are WBIs, and their bandwidths occupy more than 50% of the SAR bandwidth.
The interference mitigation results of the different methods for scene one and scene two are shown in Figure 13 and Figure 14 respectively. Figure 13a and Figure 14a show the SAR images contaminated by WBIs, respectively. Affected by WBIs, periodic artifacts, and bright wide stripes appear in the images, which mask some natural ground objects and landform information. Figure 13b–d and Figure 14b–d show the RFI mitigation results of the frequency-domain notch filtering (FNF) method, the eigen-subspace projection (ESP) method, and the proposed method, respectively, where all of these methods can mitigate RFI to some extent. It can be seen that, because the FNF method loses too many frequency-domain components, the signal-to-noise ratios of the mitigated SAR images are seriously decreased in Figure 13b and Figure 14b. The image becomes blurred, and many details are lost. The ESP method mitigated the RFI by constructing the RFI subspace. As shown in Figure 13c and Figure 14c the ESP method can mitigate the RFI to a certain extent. However, the complexity of WBI makes it difficult to achieve an accurate subspace separation, which leads to artifacts still existing in the SAR images. This case hinders the subsequent image interpretation. The results in Figure 13d and Figure 14d show that most of the bright stripes and artifacts are mitigated. Compared with the above two methods, the proposed method loses fewer details. The experiment results demonstrate the effectiveness of the proposed method for WBI mitigation.
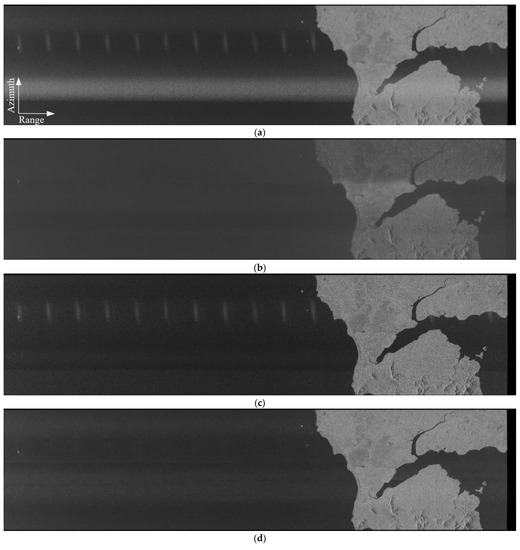
Figure 13.
Experimental results for scene 1. (a) SAR SLC image without mitigation process. (b) Mitigation result by FNF method. (c) Mitigation result by ESP method. (d) Mitigation result by proposed method.
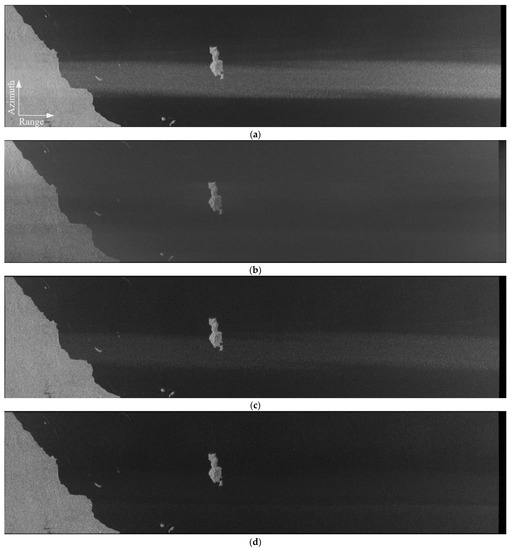
Figure 14.
Experimental results for scene 2. (a) SAR SLC image without mitigation process. (b) Mitigation result by FNF method. (c) Mitigation result by ESP method. (d) Mitigation result by proposed method.
In order to further illustrate the effectiveness of the proposed method and analyze its mitigation performance, image entropy, and the average gradient (AG) are used to analyze the above RFI mitigation methods quantitatively.
Image entropy is used to measure the average amount of information in an image [41]. For traditional images, the larger the image entropy, the more information the image contains, which means the more complex the image is. However, for RFI-contaminated SAR images, the interference appears as fog-like or streak-like artifacts in the image, which makes the image blurry. Therefore, the entropy of the RFI-contaminated SAR image is relatively large. In SAR interference mitigation, the smaller the image entropy, the better the mitigation effect.
The AG refers to the average value of the grayscale change rate [42], which reflects the changing characteristics of the details and textures in the image and the clarity of the image. In general, the larger the AG, the clearer the image.
The quantitative analysis results of the proposed method and the comparative methods are shown in Table 2. It can be seen that the image entropy and AG of the proposed method are better than FNF and ESP, which indicates that the interference mitigation performance of the proposed method is better than the other two methods.

Table 2.
The quantitative analysis of the WBI-contaminated measured SAR SLC data.
5. Discussion
SSC-SCDA is a WBI mitigation method based on SAR SLC images. Compared with the traditional SSC method and its modifications, the proposed method solves the problem that the clean spectrum is insufficient to cancel and remove WBI when the ISBR is large. The proposed method is based on successive cancellation and data accumulation technology, which can successively subtract the WBI subbands with only a small part of the clean subband to obtain WBI and eliminate it. The WBI mitigation capability of the proposed method with different ISBRs is studied and analyzed through the simulated WBI experiments based on the measured SAR SLC data. The simulation results show that the WBI mitigation performance is better when the ISBR does not exceed 60%. The experimental results, which are based on the ESA C-band IW Sentinel-1A SAR SLC data, verify the effectiveness of the proposed method, and the quantitative analysis results of this experiment show that the proposed method performs better WBI mitigation in SAR SLC data than other methods. In conclusion, the experimental results on simulated and real SAR SLC data demonstrate that the proposed SSC-SCDA approach can obtain better WBI mitigation performance. However, the quantitative analysis results of the simulation experiments showed that the mitigation performance of SSC-SCDA began to decline when the ISBR of WBI reached 60%. When the ISBR of WBI reaches 80%, the mitigation performance of the proposed method may be degraded. This method will be further improved in the future to enhance the mitigation effect when the ISBR is larger.
6. Conclusions
This paper proposes an improved SSC method based on successive cancellation and data accumulation technologies to mitigate WBI because the great majority of modern SAR systems, especially spaceborne SAR systems, often do not provide raw echo data products. Until now, only Sentinel-1 can provide raw data; however, it requires complex decoding processing. Users generally obtain SLC images and the above products, but most interference mitigation algorithms cannot be directly applied. Even though a few methods can be used on SAR SLC data, they are less effective in mitigating WBI. Compared with the previous WBI mitigation methods, the proposed method is based on SAR SLC images to mitigate WBI, which is more suitable for modern SAR systems. It should be noted that some useful signals will be lost after removing the WBI because of the large spectrum overlap between the WBI and SAR systems. Future work will focus on how to protect more useful signals in WBI mitigation by utilizing deep learning techniques [43,44,45,46,47]. Because some useful image detail information is found in the cancelled interference image, the useful information can be further separated from the interference image.
Author Contributions
Formal analysis, B.C.; methodology, B.C., Z.L. and N.L.; validation, B.C., Z.L., P.L., Y.H. and G.S.; resources, B.C., Y.H. and N.L.; writing—original draft, B.C. and N.L.; writing—review and editing, Z.L., P.L., G.S., Y.H. and N.L.; funding acquisition, N.L. All authors have read and agreed to the published version of the manuscript.
Funding
This work was supported in part by the National Natural Science Foundation of China under grant 61871175; in part by the Foundation of Key Laboratory of Radar Imaging and Microwave Photonics, Ministry of Education, under grant RIMP2020003; and in part by the Graduate Education Innovation and Quality Improvement Program of Henan University under grant SYL20060144.
Data Availability Statement
Not applicable.
Acknowledgments
Thanks to all anonymous reviewers and editors for their comments and suggestions that made the article’s content more rigorous and meaningful. At the same time, thanks to ESA for providing the open-source data of the Sentinel-1A spaceborne SAR satellite, which provided the basis for the verification experiments of this study.
Conflicts of Interest
The authors declare no conflict of interest.
References
- Lyu, Q.; Han, B.; Li, G.; Sun, W.; Pan, Z.; Hong, W.; Hu, Y. SAR Interference Suppression Algorithm Based on Low-Rank and Sparse Matrix Decomposition in Time-frequency Domain. IEEE Geosci. Remote Sens. Lett. 2021, 19, 4008305. [Google Scholar] [CrossRef]
- Tao, M.; Su, J.; Huang, Y.; Wang, L. Mitigation of Radio Frequency Interference in Synthetic Aperture Radar Data: Current Status and Future Trends. Remote Sens. 2019, 11, 2438. [Google Scholar] [CrossRef]
- Li, N.; Lv, Z.; Guo, Z. Pulse RFI Mitigation in Synthetic Aperture Radar Data via a Three-Step Approach: Location, Notch, and Recovery. IEEE Trans. Geosci. Remote Sens. 2022, 60, 5225617. [Google Scholar] [CrossRef]
- Li, N.; Zhang, H.; Lv, Z.; Min, L.; Guo, Z. Simultaneous Screening and Detection of RFI From Massive SAR Images: A Case Study on European Sentinel-1. IEEE Trans. Geosci. Remote Sens. 2022, 60, 5231917. [Google Scholar] [CrossRef]
- Zhang, T.; Zhang, X.; Shi, J.; Wei, S. HyperLi-Net: A hyper-light deep learning network for high-accurate and high-speed ship detection from synthetic aperture radar imagery. ISPRS J. Photogramm. Remote Sens. 2020, 167, 123–153. [Google Scholar] [CrossRef]
- Xu, X.; Zhang, X.; Zhang, T. Lite-YOLOv5: A Lightweight Deep Learning Detector for On-Board Ship Detection in Large-Scene Sentinel-1 SAR Images. Remote Sens. 2022, 14, 1018. [Google Scholar] [CrossRef]
- Zhang, S.; Xing, M.; Guo, R.; Zhang, L.; Bao, Z. Interference Suppression Algorithm for SAR Based on Time-frequency Transform. IEEE Trans. Geosci. Remote Sens. 2011, 49, 3765–3779. [Google Scholar] [CrossRef]
- Liu, H.; Li, D.; Zhou, Y.; Truong, T.-K. Simultaneous Radio Frequency and Wideband Interference Suppression in SAR Signals via Sparsity Exploitation in Time-Frequency Domain. IEEE Trans. Geosci. Remote Sens. 2018, 56, 5780–5793. [Google Scholar] [CrossRef]
- Sentinel-1 RFI Maps. Available online: https://s1rfimap.aresys.it/ (accessed on 10 June 2022).
- Li, N.; Lv, Z.; Guo, Z.; Zhao, J. Time-Domain Notch Filtering Method for Pulse RFI Mitigation in Synthetic Aperture Radar. IEEE Geosci. Remote Sens. Lett. 2022, 19, 4013805. [Google Scholar] [CrossRef]
- Braunstein, M.; Ralston, M.; Sparrow, A. Signal Processing Approaches to Radio Frequency Interference (RFI) Suppression. In Proceedings of the SPIE Algorithms for Synthetic Aperture Radar Imagery, Orlando, FL, USA, 9 June 1994. [Google Scholar] [CrossRef]
- Miller, T.; Mccorkle, J.; Potter, L. Near-Least-Squares Radio Frequency Interference Suppression. In Proceedings of the SPIE Algorithms for Synthetic Aperture Radar Imagery II, Orlando, FL, USA, 5 June 1995. [Google Scholar] [CrossRef]
- Liu, Z.; Liao, G.; Yang, Z. Time Variant RFI Suppression for SAR Using Iterative Adaptive Approach. IEEE Geosci. Remote Sens. Lett. 2013, 10, 1424–1428. [Google Scholar] [CrossRef]
- Yang, Z.; Du, W.; Liu, Z.; Liao, G. WBI Suppression for SAR Using Iterative Adaptive Method. IEEE J. Sel. Top. Appl. Earth Obs. Remote Sens. 2015, 9, 1008–1014. [Google Scholar] [CrossRef]
- Han, W.; Bai, X.; Fan, W.; Wang, L.; Zhou, F. Wideband Interference Suppression for SAR via Instantaneous Frequency Estimation and Regularized Time-Frequency Filtering. IEEE Trans. Geosci. Remote Sens. 2021, 60, 5208612. [Google Scholar] [CrossRef]
- Nguyen, L.; Dao, M.; Tran, T. Joint Sparse and Low-Rank Model for Radio-Frequency Interference Suppression in Ultra-Wideband Radar Applications. In Proceedings of the IEEE 2014 48th Asilomar Conference on Signals, Systems and Computers, Pacific Grove, CA, USA, 2–5 November 2014. [Google Scholar] [CrossRef]
- Nguyen, L.H.; Tran, T.; Do, T. Sparse models and sparse recovery for ultra-wideband SAR applications. IEEE Trans. Aerosp. Electron. Syst. 2014, 50, 940–958. [Google Scholar] [CrossRef]
- Liu, H.; Li, D.; Zhou, Y.; Truong, T.-K. Joint Wideband Interference Suppression and SAR Signal Recovery Based on Sparse Representations. IEEE Geosci. Remote Sens. Lett. 2017, 14, 1542–1546. [Google Scholar] [CrossRef]
- Huang, Y.; Liao, G.; Li, J.; Xu, J. Narrowband RFI Suppression for SAR System via Fast Implementation of Joint Sparsity and Low-Rank Property. IEEE Trans. Geosci. Remote Sens. 2018, 56, 2748–2761. [Google Scholar] [CrossRef]
- Huang, Y.; Liao, G.; Xiang, Y.; Zhang, Z.; Li, J.; Nehorai, A. Reweighted Nuclear Norm and Reweighted Frobenius Norm Minimizations for Narrowband RFI Suppression on SAR System. IEEE Trans. Geosci. Remote Sens. 2018, 57, 5949–5962. [Google Scholar] [CrossRef]
- Huang, Y.; Liao, G.; Zhang, Z.; Xiang, Y.; Li, J.; Nehorai, A. Fast Narrowband RFI Suppression Algorithms for SAR Systems via Matrix-Factorization Techniques. IEEE Trans. Geosci. Remote Sens. 2018, 57, 250–262. [Google Scholar] [CrossRef]
- Huang, Y.; Liao, G.; Zhang, L.; Xiang, Y.; Li, J.; Nehorai, A. Efficient Narrowband RFI Mitigation Algorithms for SAR Systems with Reweighted Tensor Structures. IEEE Trans. Geosci. Remote Sens. 2019, 57, 9396–9409. [Google Scholar] [CrossRef]
- Huang, Y.; Liao, G.; Xu, J.; Li, J. Narrowband RFI Suppression for SAR System via Efficient Parameter-Free Decomposition Algorithm. IEEE Trans. Geosci. Remote Sens. 2018, 56, 3311–3322. [Google Scholar] [CrossRef]
- Joy, S.; Nguyen, L.H.; Tran, T.D. Joint Down-Range and Cross-Range RFI Suppression in Ultra-Wideband SAR. IEEE Trans. Geosci. Remote Sens. 2021, 59, 3136–3149. [Google Scholar] [CrossRef]
- Ding, Y.; Fan, W.; Zhang, Z.; Zhou, F.; Lu, B. Radio Frequency Interference Mitigation for Synthetic Aperture Radar Based on the Time-Frequency Constraint Joint Low-Rank and Sparsity Properties. Remote Sens. 2022, 14, 775. [Google Scholar] [CrossRef]
- Zhang, H.; Min, L.; Lu, J.; Chang, J.; Guo, Z.; Li, N. An Improved RFI Mitigation Approach for SAR Based on Low-Rank Sparse Decomposition: From the Perspective of Useful Signal Protection. Remote Sens. 2022, 14, 3278. [Google Scholar] [CrossRef]
- Cazzaniga, G.; Guarnieri, A. Removing RF interferences from P-band airplane SAR data. In Proceedings of the IGARSS ‘96. 1996 International Geoscience and Remote Sensing Symposium, Lincoln, NE, USA, 31 May 1996. [Google Scholar] [CrossRef]
- Xu, W.; Xing, W.; Fang, C.; Huang, P.; Tan, W. RFI Suppression Based on Linear Prediction in Synthetic Aperture Radar Data. IEEE Geosci. Remote Sens. Lett. 2021, 18, 2027–2131. [Google Scholar] [CrossRef]
- Zhou, F.; Wu, R.; Xing, M.; Bao, Z. Eigensubspace-Based Filtering with Application in Narrow-Band Interference Suppression for SAR. IEEE Geosci. Remote Sens. Lett. 2007, 4, 75–79. [Google Scholar] [CrossRef]
- Li, N.; Lv, Z.; Guo, Z. Observation and Mitigation of Mutual RFI Between SAR Satellites: A Case Study Between Chinese GaoFen-3 and European Sentinel-1A. IEEE Trans. Geosci. Remote Sens. 2022, 60, 5112819. [Google Scholar] [CrossRef]
- Zhou, F.; Tao, M.; Bai, X.; Liu, J. Narrow-Band Interference Suppression for SAR Based on Independent Component Analysis. IEEE Trans. Geosci. Remote Sens. 2013, 51, 4952–4960. [Google Scholar] [CrossRef]
- Zhou, F.; Xing, M.; Bai, X.; Sun, G.; Bao, Z. Narrow-Band Interference Suppression for SAR Based on Complex Empirical Mode Decomposition. IEEE Geosci. Remote Sens. Lett. 2009, 6, 423–427. [Google Scholar] [CrossRef]
- Tao, M.; Zhou, F.; Liu, J.; Liu, Y.; Zhang, Z.; Bao, Z. Narrow-Band Interference Mitigation for SAR Using Independent Subspace Analysis. IEEE Trans. Geosci. Remote Sens. 2014, 52, 5289–5301. [Google Scholar] [CrossRef]
- Li, N.; Chen, B.; Lv, Z.; Shu, G. A modified EMD method for detecting and mitigating narrow-band RFI in SAR data. Remote Sens. Lett. 2022, 13, 643–650. [Google Scholar] [CrossRef]
- Feng, J.; Zheng, H.; Deng, Y.; Gao, D. Application of Subband Spectral Cancellation for SAR Narrow-Band Interference Suppression. IEEE Geosci. Remote Sens. Lett. 2012, 9, 190–193. [Google Scholar] [CrossRef]
- Yang, L.; Zheng, H.; Feng, J.; Li, N.; Chen, J. Detection and suppression of narrow band RFI for synthetic aperture radar imaging. Chin. J. Aeronaut. 2015, 28, 1189–1198. [Google Scholar] [CrossRef]
- Li, N.; Lv, Z.; Guo, Z. SAR image interference suppression method by integrating change detection and subband spectral cancellation technology. Syst. Eng. Electron. 2021, 43, 2484–2492. [Google Scholar] [CrossRef]
- Ozdemir, C. Inverse Synthetic Aperture Radar Imaging with MATLAB Algorithms, 2nd ed.; John Wiley & Sons: Hoboken, NJ, USA, 2021. [Google Scholar]
- Marghany, M. Nonlinear Ocean Dynamics: Synthetic Aperture Radar, 1st ed.; Elsevier: Amsterdam, The Netherlands, 2021. [Google Scholar]
- Shakya, P.; Raj, A.B. Inverse Synthetic Aperture Radar Imaging Using Fourier Transform Technique. In Proceedings of the 2019 1st International Conference on Innovations in Information and Communication Technology (ICIICT), Chennai, India, 25 April 2019. [Google Scholar] [CrossRef]
- Li, G.; Ye, W.; Lao, G.; Kong, S.; Yan, D. Narrowband Interference Separation for Synthetic Aperture Radar via Sensing Matrix Optimization-Based Block Sparse Bayesian Learning. Electronics 2019, 8, 458. [Google Scholar] [CrossRef]
- Cui, G.; Feng, H.; Xu, Z.; Li, Q.; Chen, Y. Detail preserved fusion of visible and infrared images using regional saliency extraction and multi-scale image decomposition. Opt. Commun. 2015, 341, 199–209. [Google Scholar] [CrossRef]
- Zhang, T.; Zhang, X. A Full-Level Context Squeeze-and-Excitation ROI Extractor for SAR Ship Instance Segmentation. IEEE Geosci. Remote Sens. Lett. 2022, 19, 4506705. [Google Scholar] [CrossRef]
- Zhang, T.; Zhang, X. High-Speed Ship Detection in SAR Images Based on a Grid Convolutional Neural Network. Remote Sens. 2019, 11, 1206. [Google Scholar] [CrossRef]
- Zhang, T.; Zhang, X. HTC+ for SAR Ship Instance Segmentation. Remote Sens. 2022, 14, 2395. [Google Scholar] [CrossRef]
- Zhang, T.; Shi, J.; Wei, S. Depthwise Separable Convolution Neural Network for High-Speed SAR Ship Detection. Remote Sens. 2019, 11, 2483. [Google Scholar] [CrossRef]
- Zhang, T.; Zhang, X. A Mask Attention Interaction and Scale Enhancement Network for SAR Ship Instance Segmentation. IEEE Geosci. Remote Sens. Lett. 2022, 19, 4511005. [Google Scholar] [CrossRef]
Publisher’s Note: MDPI stays neutral with regard to jurisdictional claims in published maps and institutional affiliations. |
© 2022 by the authors. Licensee MDPI, Basel, Switzerland. This article is an open access article distributed under the terms and conditions of the Creative Commons Attribution (CC BY) license (https://creativecommons.org/licenses/by/4.0/).