Abstract
Rainfall erosivity is an important indicator for quantitatively representing the erosive power of rainfall. This study expanded three satellite-based precipitation products (SPPs) for estimating and mapping rainfall erosivity in a subtropical basin in China and evaluated their performance at different rainfall erosivity intensities, seasons, and spaces. The results showed that the rainfall erosivity data from GPM-IMERG had the smallest errors compared to the estimates from rain gauge data on monthly and seasonal scales, while data from PERSIANN-CDR and TRMM 3B42 significantly underestimated and slightly overestimated rainfall erosivity, respectively. The three SPPs generally presented different strengths and weaknesses in different seasons. TRMM 3B42 performed best in summer, with small biases, but its performance was less satisfactory in winter. The precision of estimates from GPM-IMERG was higher than that from TRMM 3B42; the biases, especially in winter, were significantly reduced. For different intensities, PERSIANN-CDR overestimated light rainfall erosivity but underestimated heavy rainfall erosivity. In terms of space, TRMM 3B42 and GPM-IMERG correctly presented the spatial pattern of rainfall erosivity. However, PERSIANN-CDR tended to be less skillful in describing its spatial maps. Outcomes of the study provide an insight into the suitability of the SPPs for estimating and mapping rainfall erosivity and suggest possible directions for further improving these products.
1. Introduction
Soil erosion and soil loss caused by rainfall is a global ecological and environmental issue [1]. Soil erosion may deteriorate soil fertility and land productivity, lead to land degradation, and negatively affect the water quality, sustainable agricultural production, carbon sequestration, and reservoir capacity [1,2,3,4]. Severe soil erosion has resulted in significant environmental deterioration and threatened global food security and the development of human society [1,5]. Moreover, mounting evidence indicates that global warming is accelerating the hydrological cycle and increasing the inhomogeneity and variability in the spatial and temporal distribution of precipitation. Although extreme precipitation has decreased in some regions, the frequency and intensity of torrential rains have increased in others [6,7,8,9,10], which forebodes increasing soil erosion rates and the aggravation of soil loss.
Rainfall, topography and land use, and cover change are important factors influencing soil erosion, including the vegetation cover, soil properties, slope, characteristics of runoff, and climatic conditions [2,11,12,13]. Rainfall erosivity, as a key indicator for quantitatively representing the erosive power of rainfall, combines the effects of various rainfall features (intensity, duration, and amount) [14,15,16]. It can directly reflect and measure the degrees of raindrops that erode the soil [2,16,17]. Thus, rainfall erosivity is widely included in numerous quantitative prediction models of soil erosion and sediment yield [18], including the Universal Soil Loss Equation (USLE), as well as its revised version (RUSLE and RUSLE2) [19,20,21], the European Soil Erosion Model (EUROSEM), and the Soil Erosion Model for Mediterranean regions (SEMMED) [22,23]. Moreover, rainfall erosivity can identify areas vulnerable to soil erosion or hotspot areas with higher erosivity potential [24], where soil conservation structures or other appropriate measures are urgently needed to control water-induced erosion [25,26]. Accordingly, the accurate estimation of rainfall erosivity and the mapping of its spatial pattern are particularly important for soil erosion risk assessment and soil loss prevention, and also critical for land-use planning and agricultural management [27]. Actually, such efforts have been made in many areas across the world [1,2,28,29]. In China, several studies on this issue have been conducted, either on the national scale [15,27,30,31] or on the regional scale, such as in Beijing [32], the Yunnan Plateau region [24], the Chinese Loess Plateau [33], and the dryland regions [34].
Recent developments in satellite technology and corresponding retrieval algorithms for rainfall have greatly improved the quality and accuracy of satellite-based precipitation products (SPPs) [35]. Several SPPs provide reliable precipitation data with wide spatial coverage, high spatiotemporal resolution, and near real-time availability. Numerous researchers have examined the quality of SPPs in various regions of the world. Levizzani and Cattani presented an overview of the current status of the satellite remote sensing of precipitation and identified some obvious gaps and future directions of satellite missions [36]. Li et al. evaluated and compared two widely used high-resolution SPPs (TRMM 3B42 and PERSIANN) with rain gauge data in the Poyang Lake basin and investigated their spatial and temporal characteristics, including their relationship with the evaluation and slope [37]. Chen and Li, Tang et al., and Guo et al. validated that the accuracy of GPM-IMERG precipitation estimates was greatly improved compared to other SPPs in China [38,39,40]. Similar studies have also been conducted in Canada, Pakistan, Singapore, Bolivia, and Austria [41,42,43,44,45]. SPPs have been recognized as a good alternative to traditional rain gauge observations in many research fields, such as for extreme precipitation analysis [46,47], hydrological modeling [48,49,50], drought and flood monitoring [51,52], rainfall characteristics [53], and weather processes [54]. Therefore, high-resolution SPPs have great potential and inherent advantages for the large-scale mapping of rainfall erosivity [55].
Several studies have applied SPPs for rainfall erosivity estimation and evaluated their applicability and performance in various regions. Vrieling et al. applied Tropical Rainfall Measuring Mission (TRMM) data (3B42) for estimating and mapping rainfall erosivity in Africa [56]. Similar studies were subsequently conducted in different areas on national or regional scales, including in Australia, Austria, China, and the United States [55,57,58,59]. Further, Li et al. quantified seasonal and annual rainfall erosivity using different TRMM rainfall products (3B42 3-hourly, daily, and 3B43) in a subtropical basin in China [60]. Teng et al. merged TRMM 3B42 data and daily rain gauge observations to estimate rainfall erosivity across China and further improved the accuracy of rainfall erosivity [58]. Chen et al. evaluated and compared the applicability of TRMM and its successor, the GPM-IMERG precipitation product (Integrated Multi-satellite Retrievals for Global Precipitation Measurement Mission), for mapping rainfall erosivity in China [16]. In addition, Kim et al. suggested a new approach to depict the spatial pattern of rainfall erosivity using the CMORPH precipitation product (CPC morphing technique) [55]. These preliminary studies suggest that SPPs have great potential to estimate and map rainfall erosivity with relative accuracy. On the other hand, numerous studies have shown that the accuracy of SPPs is affected by the regional topography, rainfall types (i.e., convective or stratiform), and several other climatic factors [61,62], so different SPPs may show various levels of accuracy in different areas, seasons, or rainfall intensities. However, few of the previous studies have focused on the performance of SPPs in various erosivity intensities and different seasons when they were used to estimate and map rainfall erosivity. The strengths and weaknesses of different SPPs for estimating and mapping rainfall erosivity remain unclear [24], which is not conducive to (or even has hindered) the further application of SPPs. It is therefore essential to fully assess the performance of SPPs for mapping rainfall erosivity at different rainfall erosivity intensities, seasons, and spaces.
The Poyang Lake Basin, with its fertile soil and rich grain products, is an important agricultural production base in China. However, the basin is suffering from serious soil erosion and farmland degradation [63]. The increasingly serious soil erosion and soil loss have significantly affected local agricultural production and even threatened national food security to a great extent [64]. It is urgently needed in this region to apply high-resolution SPPs to estimate and map rainfall erosivity and to quickly identify the critical areas prone to erosion. This has become a vital prerequisite for soil erosion control, soil loss prevention, sustainable land-use planning, and agricultural management [1,2,24]. Therefore, the objectives of the study are (1) to estimate monthly, seasonal, and annual rainfall erosivity and map its spatial pattern in a subtropical basin in China (Poyang Lake Basin), using three widely used SPPs, i.e., TRMM 3B42, GPM-IMERG, and PERSIANN-CDR (Precipitation Estimation from Remote Sensing Information using Artificial Neural Networks-Climate Data Record); and (2) to explore the biases distribution and evaluate their performance and accuracy for different rainfall erosivity intensities, seasons, and spaces, compared to the estimates from rain gauge observations. The results of the study can provide useful references and deep insight into the suitability of SPPs for estimating and mapping rainfall erosivity.
2. Materials and Methods
2.1. Study Area
The Poyang Lake Basin (PLB) is located in the middle reaches of the Yangtze River, China (24°32′–29°58′N and 113°45′–118°29′E) (Figure 1) and covers a huge area of 16.22 ×10⁴ km2. There are five rivers in the basin (namely, the Ganjiang River, the Xinjiang River, the Fuhe River, the Raohe River, and the Xiushui River), which converge to form the largest freshwater lake in China. The basin is characterized by a subtropical monsoon climate with frequent extreme precipitation events. April–June is the rainy season, and higher than 50% of the annual total rainfall occurs during this period. The topography of the basin is complex, and the elevation varies from 2200m in the mountainous area to about 30m in the alluvial plains. Moreover, the soil type is mainly red soil, which is easy to erode with low infiltration rates [65]. According to a recent remote sensing survey [64], about 20.03% (3.35 × 10⁴ km2) of the watershed area is suffering from soil erosion and land degradation.
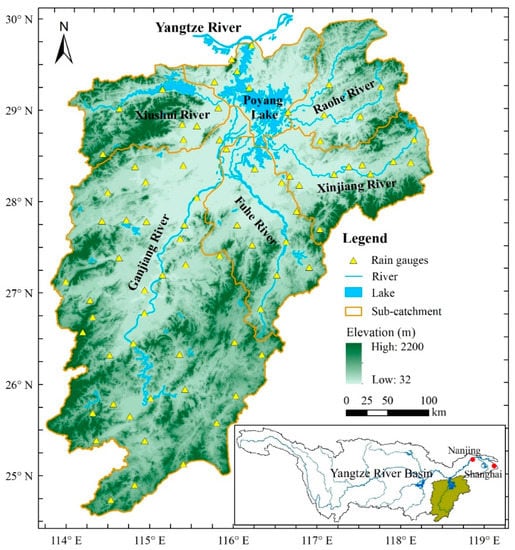
Figure 1.
Location of the Poyang Lake Basin and distribution of the rain gauges.
2.2. Data
Three popular high-resolution SPPs are used for estimating and mapping rainfall erosivity in this study, including the TRMM 3B42 V7, GPM-IMERG V06 Final, and PERSIANN-CDR products. These precipitation products provide reliable rainfall data with different temporal resolutions (up to 0.5–3 hourly) and high spatial resolutions (0.1–0.25°), which have been widely used in many hydrological and meteorological studies.
The TRMM satellite was launched in 1997 to explore and monitor tropical precipitation conditions [66,67]. TRMM carried multiple rain sensors and provided rainfall estimates with a temporal resolution of 3 h and spatial resolution of 0.25° × 0.25° at a global coverage area of 50°S–50°N, from January 1998 to December 2019. TRMM 3B42 V7, as the most representative level-3 SPP, has been validated to have satisfactory accuracy in many regions of the world [66].
The GPM project (Global Precipitation Measurement Mission), as the successor of TRMM, commenced in 2014 to provide a new generation of precipitation measurements with higher spatiotemporal resolution [68]. IMERG is a new algorithm of GPM for precipitation estimation, which integrates information from any satellite in a specific time and space to estimate the precipitation [69]. The GPM-IMERG products have advantages compared to TRMM in terms of temporal resolution (0.5 h), spatial resolution (0.1° × 0.1°), and coverage area (60°S–60°N). More importantly, the latest Version 6 release can fuse precipitation estimates from the TRMM product during 2000–2014 with new estimates from the GPM satellite to extend the IMERG precipitation estimates from June 2000 to the present [69].
PERSIANN is a satellite-based precipitation retrieval algorithm, which uses neural network function classification procedures to convert the infrared brightness temperature image at each 0.25° × 0.25° pixel, provided by geostationary satellites, to the rainfall rate [70]. PERSIANN-CDR is generated, based on GridSat-B1 infrared data, by the PERSIANN algorithm and calibrated with the Global Precipitation Climatology Project monthly products (GPCP v2.2) [71]. PERSIANN-CDR has provided daily rainfall estimates at a 0.25° × 0.25° spatial resolution at global coverage of 60°S–60°N from 1983 to the present. This dataset supports climatologists, hydrologists, and hydro-meteorologists in various forms of climate research [71].
Specifically, the daily TRMM 3B42 V7 and GPM-IMERG V06 Final products from 1 January 1998 and 1 June 2000, respectively, to 31 December 2019 were used to calculate rainfall erosivity in this study. These products are freely available at https://disc.gsfc.nasa.gov/datasets (accessed on 1 May 2021). The PERSIANN-CDR daily rainfall estimates, from 1 January 1998 to 31 December 2019, were selected after considering the length of data available from the TRMM and GPM-IMERG products. The PERSIANN-CDR precipitation product is freely available at https://www.ncei.noaa.gov/erddap (accessed on 1 May 2021). In addition, the daily observed rainfall data are collected from 76 traditional meteorological stations in the PLB during the same period (from 1 January 1998 to 31 December 2019). The qualities of these observed rainfall data have been proven in numerous previous studies and can be used to evaluate and validate the accuracy of the SPPs [37,60,72].
2.3. Methodologies
2.3.1. Rainfall Erosivity
Zhang et al. developed and improved a quantitative method based on daily rainfall data for calculating rainfall erosivity [73]. This model has been widely applied on the regional or national scale in China, with an average relative error of only 4.2% [74]. Moreover, this model was recommended for the first national survey of soil erosion and soil loss in China and delivered a good performance [75]. Thus, this model is applied in this study to estimate the variation of rainfall erosivity. The formula of the model is as follows [73]:
where REi is the rainfall erosivity for i half-month (MJ·mm·ha−1 h−1); each month is divided into two parts: the first part comprises the period from day 1 to 15, and the second part is the rest of the month; Pj is the erosive rainfall, and 12mm/day is considered as the threshold of erosive rainfall in China, according to the analysis of rainfall characteristics by Xie et al. [76]. For daily rainfall of less than the threshold value of 12mm, Pj is set to be 0. α and β are empirical coefficients and they can be determined by the following equations [73]:
where and are the average erosive rainfall on the daily and annual scales during the study period.
In addition, the erosivity density represents the erosivity per rainfall unit and can be calculated from the ratio of rainfall erosivity to rainfall on a specific time scale (i.e., monthly, seasonal, or yearly) (MJ·ha−1 h−1) [77]. The erosivity density is estimated as follows:
where EDi is the erosivity density for the i given month, season or year; REi and Pi are the accumulated rainfall erosivity and erosive rainfall, respectively, during the same period.
2.3.2. Performance Evaluating Metrics
The four most commonly used evaluating metrics were selected to quantitatively assess the performance and accuracy of the mentioned three SPPs for estimating rainfall erosivity, including the correlation coefficient (R), root mean square error (RMSE), mean error (ME), and relative bias (BIAS). These evaluating metrics are used to measure the consistency of rainfall erosivity from the SPPs with that from the rain gauge data, and also to evaluate their deviation degrees and systematic biases. These evaluating metrics can be determined by the following equations:
where is the rainfall erosivity obtained from the SPPs (i.e., TRMM 3B42, PERSIANN-CDR and GPM-IMERG); is the rainfall erosivity obtained from the rain gauge data; and represent the average values.
Moreover, another four statistical indicators were adopted to evaluate the performance of each SPP in depicting light and heavy rainfall erosivity: the frequency bias index (FBI), probability of detection (POD), false alarm ratio (FAR), and equitable threat score (ETS). These statistical indicators are calculated based on a contingency table with different thresholds on monthly and seasonal scales. Specifically, the FBI indicates whether the SPPs overestimate (with FBI > 1) or underestimate (with FBI < 1) the rainfall erosivity; the FAR represents the fraction of rainfall erosivity which are actually false alarms; the POD provides the proportion of correctly estimated rainfall erosivity; the ETS gives the fraction of rainfall erosivity which is correctly detected [78]. These evaluating metrics have been widely used in numerous studies and can provide a powerful tool for the accurate evaluation of rainfall erosivity detection [79]. The values of these evaluating indices are calculated as follows:
where a is the number of correct rainfall erosivity results obtained from the SPPs; b represents the number of false detections (presented in the estimates from the SPPs but not in the estimates from the rain gauge data); c means the opposite of b—it is the number of omitted signals (estimates not detected by the SPPs); N is the total number of estimates.
3. Results
3.1. Intra-Annual Distribution and Seasonal Variation
The monthly rainfall erosivity and erosivity density in the PLB were estimated, based on the TRMM 3B42, PERSIANN-CDR, and GPM-IMERG precipitation products, respectively. Their consistency, deviation degrees, and systematic biases were compared to the estimates from rain gauge data and are summarized in Table 1. It is seen that the average monthly rainfall erosivity estimated from the rain gauge data was 884.2 MJ·mm·ha−1 h−1, compared to 983.5, 577.9, and 853.4 MJ·mm·ha−1 h−1 from the three SPPs, respectively, which suggests that the GPM-IMERG precipitation product produced the closest estimates to that of the gauge-based rainfall erosivity, while the PERSIANN-CDR significantly underestimated and the TRMM 3B42 slightly overestimated the rainfall erosivity. The R-values between the rainfall erosivity estimated from the three SPPs and that from the rain gauge data were all high, at 0.89, 0.90, and 0.90, respectively, indicating that all three SPPs effectively captured the changing characteristics of monthly rainfall erosivity. However, large errors were presented in estimates from the PERSIANN-CDR precipitation product, with the ME of −306.3 MJ·mm·ha−1 h−1, and BIAS of −34.6%. Relatively, the rainfall erosivity obtained from the GPM-IMERG precipitation product showed the smallest values of ME, RMSE, and BIAS.

Table 1.
Performance comparison of the three SPPs for rainfall erosivity and erosivity density on the monthly scale.
It is also seen from Table 1 that the average erosivity density estimated from the rain gauge data was 6.18 MJ·ha−1 h−1, compared to 6.91, 4.76, and 6.48 MJ·ha−1 h−1 for the TRMM 3B42, PERSIANN-CDR, and GPM-IMERG precipitation products, respectively. R between the erosivity density estimated from the three SPPs and the rain gauge data were 0.81, 0.83, and 0.83, respectively, which were slightly lower than that of the rainfall erosivity. Similarly, the erosivity density from PERSIANN-CDR exhibited the largest error, with an ME of −1.42 MJ·ha−1 h−1, RMSE of 1.73 MJ·ha−1 h−1, and BIAS of −22.9%, while GPM-IMERG showed the smallest systematic biases, with an ME of 0.30 MJ·ha−1 h−1, RMSE of 1.08 MJ·ha−1 h−1, and BIAS of 4.1%. In general, the GPM-IMERG precipitation product had the best performance, TRMM 3B42 slightly overestimated rainfall erosivity and erosivity density on the monthly scale, and the PERSIANN-CDR precipitation product presented significant systematic biases.
Figure 2 shows the monthly variation of the R, ME, RMSE, and BIAS of rainfall erosivity and erosivity density from the three SPPs. It is seen that the correlation coefficient varied greatly in different months, with the R-value ranging from 0.65 to 0.95 for rainfall erosivity, and from 0.53 to 0.91 for erosivity density. All three SPPs showed poor consistency for rainfall erosivity during January–February and for erosivity density during April–June, and August (Figure 2a,b). Moreover, the large errors of rainfall erosivity from the PERSIANN-CDR product were mainly derived from its significant underestimation of rainfall erosivity in June (with the largest ME and RMSE values) (Figure 2c,e), while systematic biases of erosivity density were principally due to its obvious deviation during June–August and November (Figure 2d,f). It can be seen from Figure 2g,h that the estimates from the TRMM 3B42 and GPM-IMERG products had large errors during December–February (with the BIAS of 20–75%); however, they generally performed well in estimating monthly rainfall erosivity and erosivity density.
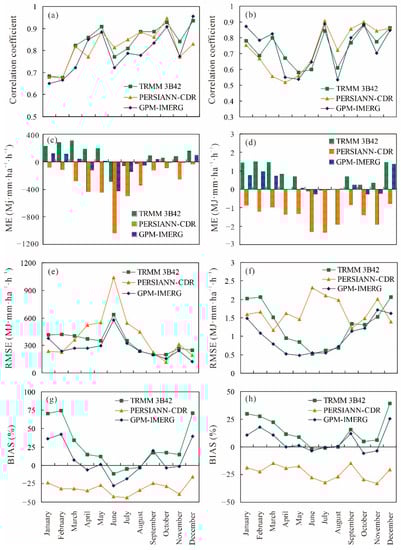
Figure 2.
Monthly variation of the R, ME, RMSE, and BIAS ((a,c,e,g) for monthly rainfall erosivity; (b,d,f,h) for monthly erosivity density).
Table 2 compares the performances of the three SPPs for rainfall erosivity and erosivity density on the seasonal scale. It is found that the average seasonal rainfall erosivity from the rain gauge data was 2652 MJ·mm·ha−1 h−1, compared to 2951, 1713, and 2538 MJ·mm·ha−1 h−1 for the TRMM 3B42, PERSIANN-CDR, and GPM-IMERG precipitation products, respectively. In addition, the seasonal rainfall erosivity from the three SPPs showed significant correlations with that from the rain gauge data, with R-values of 0.91, 0.94, and 0.93, respectively. However, the PERSIANN-CDR product significantly underestimated and TRMM 3B42 slightly overestimated seasonal rainfall erosivity in terms of the ME, RMSE, and BIAS values. In contrast, the GPM-IMERG precipitation product presented a high accuracy for seasonal rainfall erosivity. For seasonal erosivity density, the three SPPs showed similar accuracies, i.e., PERSIANN-CDR underestimated the erosivity density, with a BIAS of 23.0%, and GPM-IMERG produced the lowest bias (4.6%).
Table 2.
Performance comparison of the three SPPs for rainfall erosivity and erosivity density on the seasonal scale.
Figure 3 shows the seasonal changes in the R, ME, RMSE, and BIAS of rainfall erosivity and erosivity density from the three SPPs. The consistency of estimates from the GPM-IMERG product with those from the rain gauge data was unsatisfactory, especially the correlation coefficient, which was lower than 0.7 for rainfall erosivity during the summer and winter, and lower than 0.65 for erosivity density during the spring. The seasonal rainfall erosivity and erosivity density obtained from the PERSIANN-CDR product presented great systematic biases, especially during the summer, when the values of ME and RMSE were at their maximum. In addition, the TRMM 3B42 product significantly overestimated rainfall erosivity and erosivity density during the winter (BIAS values up to 72.2% and 31.6%, respectively). It is noteworthy that the systematic biases of seasonal estimates from the GPM-IMERG product in winter cannot be ignored, with a BIAS of 27.8% for rainfall erosivity, and 16.3% for erosivity density.
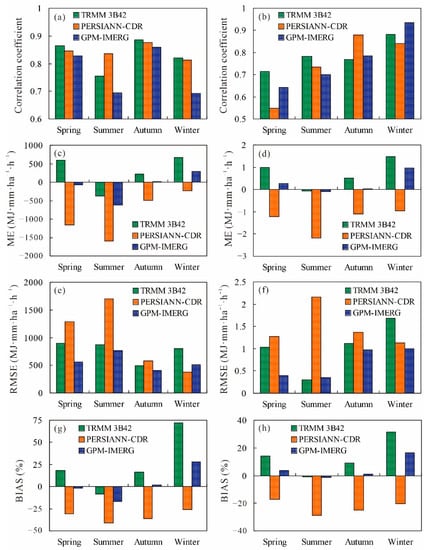
Figure 3.
Seasonal variation of R, ME, RMSE, and BIAS ((a,c,e,g) for rainfall erosivity; (b,d,f,h) for erosivity density).
3.2. Performance at Different Rainfall Erosivity Intensities
Figure 4 shows the frequency of rainfall erosivity in different intensity categories and its contribution to the annual rainfall erosivity on monthly and seasonal scales. It is seen that, on the monthly scale, the small intensity category (<500 MJ·mm·ha−1 h−1) had the highest frequency of occurrence (approximately 38.3%). However, its contribution to the total annual rainfall erosivity was low (10.1%). As the intensity category of rainfall erosivity changed from 500–1000 MJ·mm·ha−1 h−1 to 2000–2500 MJ·mm·ha−1 h−1, its frequency decreased from 27.3% to 6.4%, and the contribution rate decreased from 21.7% to 16.3% for the estimates from the rain gauge data. In particular, although the frequency was very low (3.8%) in the heavy rainfall erosivity group (>2500 MJ·mm·ha−1 h−1), the corresponding contribution rate was still high (13.8%). As for the estimates from TRMM 3B42 and GPM-IMERG, the distributions of rainfall erosivity and their corresponding contribution rates in different intensity groups were almost consistent with that of the gauge-based rainfall erosivity. However, the PERSIANN-CDR product significantly overestimated the frequency and contribution rate of light rainfall erosivity, such as in the categories of <500 and 500–1000 MJ·mm·ha−1 h−1, but underestimated them for heavy rainfall erosivity, such as in groups of 2000–2500 and >2500 MJ·mm·ha−1 h−1 (Figure 4a).
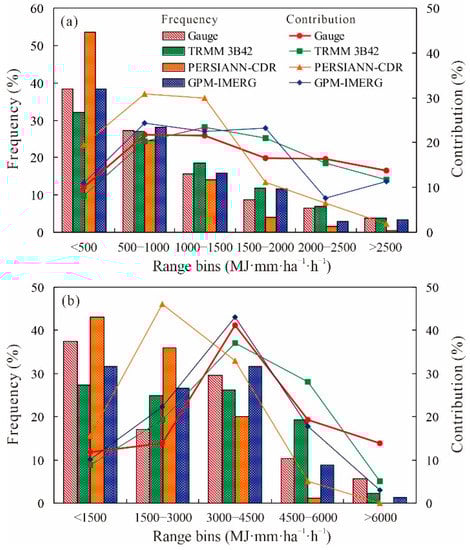
Figure 4.
Distribution of frequencies and corresponding contribution rates of rainfall erosivity in different intensity categories ((a): monthly scale; (b): seasonal scale).
On the seasonal scale, the gauge-based rainfall erosivity showed the highest occurrence (37.5%) in the <1500 MJ·mm·ha−1 h−1 group, but the largest contribution rate (41.2%) in the 3000–4500 MJ·mm·ha−1 h−1 group. However, although the frequency of the gauge-based rainfall erosivity was very low (5.6%) in the heavy intensity group (>6000 MJ·mm·ha−1 h−1), its contribution rate was higher than 13.8%. The PERSIANN-CDR product obviously overestimated light rainfall erosivity but underestimated heavy rainfall erosivity in terms of their frequency and contribution rate. In addition, it is also seen from Figure 4b that the TRMM 3B42 and GPM-IMERG products significantly underestimated the frequencies and corresponding contribution rates of rainfall erosivity in groups of <1500 and >6000 MJ·mm·ha−1 h−1.
Figure 5 shows the changes in the Mean, ME, RMSE, and BIAS of monthly rainfall erosivity in different intensity categories. It is seen that the PERSIANN-CDR product significantly underestimated the mean values of monthly rainfall erosivity in each intensity category. Correspondingly, its systematic bias was bigger for larger rainfall erosivity, especially the value of ME exceeded −1100 MJ·mm·ha−1 h−1 in the group of >2500 MJ·mm·ha−1 h−1. Unlike the performance of PERSIANN-CDR, the TRMM 3B42 and GPM-IMERG products underestimated the mean values of the monthly rainfall erosivity only in the heavy intensity group, with corresponding large values of ME and RMSE. However, in terms of the relative error, the estimates from TRMM 3B42 and GPM-IMERG showed large biases for light rainfall erosivity, with the BIAS reaching 28.7–54.2% in the <500 MJ·mm·ha−1 h−1 group.
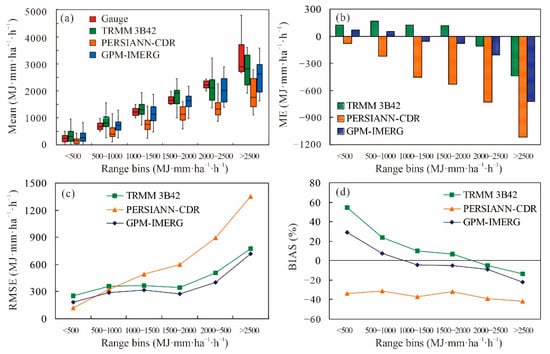
Figure 5.
Distribution of the Mean (a), ME (b), RMSE (c), and BIAS (d) of rainfall erosivity in different intensity categories on the monthly scale.
The distributions of the Mean, ME, RMSE, and BIAS of seasonal rainfall erosivity in different intensity categories are shown in Figure 6. It is seen that the distribution characteristics of these metrics at different rainfall erosivity intensities on the seasonal scale were similar to those on the monthly scale. For instance, the PERSIANN-CDR product underestimated the mean values of seasonal rainfall erosivity in each intensity group, which resulted in large ME and RMSE values, especially for the heavy rainfall erosivity group (>6000 MJ·mm·ha−1 h−1). The relative errors for light rainfall erosivity obtained from TRMM 3B42 and GPM-IMERG were also remarkable.
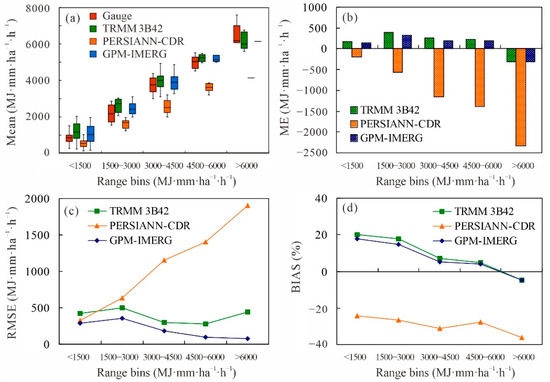
Figure 6.
Distribution of the Mean (a), ME (b), RMSE (c), and BIAS (d) of rainfall erosivity in different intensity categories on seasonal scale.
Furthermore, the performance and accuracy of the TRMM 3B42, PERSIANN-CDR, and GPM-IMERG products for estimating rainfall erosivity were evaluated based on the FBI, FAR, POD, and ETS scores, and their changes at different rainfall erosivity thresholds are shown in Figure 7. It was found that the FBI values from the PERSIANN-CDR product decreased from 0.71 to 0.11, the POD decreased from 0.70 to 0.11, and the ETS decreased from 0.46 to 0.11 when the threshold increased from 500 to 2500 MJ·mm·ha−1 h−1. These changes indicate that the PERSIANN-CDR product was less skillful in correctly estimating the monthly rainfall erosivity, especially for heavy rainfall erosivity. The FAR kept changing around 0, which implied that PERSIANN-CDR presented very few false detections for the monthly rainfall erosivity. In addition, TRMM 3B42 and GPM-IMERG had FBI values of 0.78–0.89, POD values of 0.56–0.67, and ETS values of 0.44–0.53 at the threshold of 2500 MJ·mm·ha−1 h−1. Relative low values of the FBI, POD, and ETS indicated that the estimates from TRMM 3B42 and GPM-IMERG had significant biases for heavy rainfall erosivity. Moreover, the value of FAR increased to 0.25–0.29, which meant the proportion of false detection increased at the 2500 MJ·mm·ha−1 h−1 threshold.
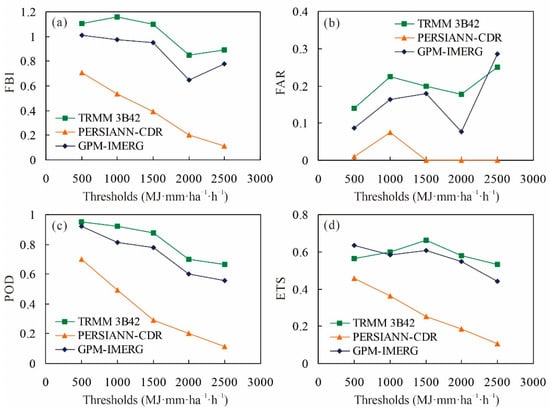
Figure 7.
Changes in FBI (a), FAR (b), POD (c), and ETS (d) scores at different thresholds on the monthly scale.
On the seasonal scale, the changing characteristics of the FBI, FAR, POD, and ETS scores (Figure 8) were similar to those on the monthly scale. Thus, the PERSIANN-CDR product was less skillful in correctly estimating heavy rainfall erosivity, while the performances of TRMM 3B42 and GPM-IMERG for heavy rainfall erosivity were worse than those for light rainfall erosivity, especially for the false detection, which was significantly high at the 5000 MJ·mm·ha−1 h−1 threshold (FAR values of 0.2 and 0.44).
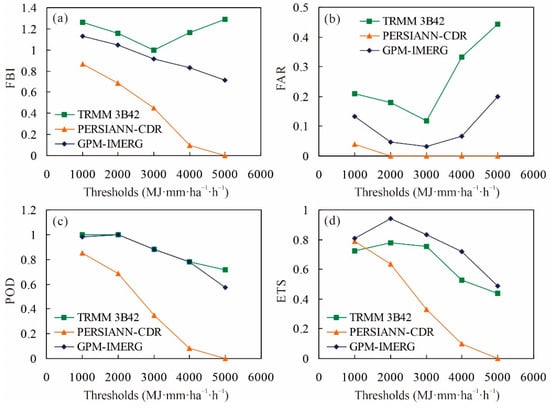
Figure 8.
Changes in FBI (a), FAR (b), POD (c), and ETS (d) scores at different thresholds on the seasonal scale.
3.3. Annual Rainfall Erosivity and Spatial Patterns
The average annual rainfall erosivity estimated from the rain gauge data was 10,611 MJ·mm·ha−1 h−1, compared to 11,802, 6853, and 10,027 MJ·mm·ha−1 h−1 obtained from the TRMM 3B42, PERSIANN-CDR, and GPM-IMERG products, respectively. It means that the PERSIANN-CDR precipitation product significantly underestimated the annual rainfall erosivity while TRMM 3B42 slightly overestimated it, as in the cases of the monthly and seasonal scales. Table 3 and Table 4 summarize the performances of the three SPPs for estimating the annual rainfall erosivity and its density. The values of R between the annual rainfall erosivity from the three SPPs and those from the rain gauge data were 0.87, 0.93, and 0.84, respectively, which indicates that all three SPPs showed good consistency for rainfall erosivity on the annual scale. However, the deviation was significant in estimates of the PERSIANN-CDR precipitation product, with the ME of −3758 MJ·mm·ha−1 h−1, and BIAS of −35.4% (Table 3). Relatively, the GPM-IMERG product performed best for its annual rainfall erosivity estimation, and its ME, RMSE, and BIAS values were the lowest of the three SPPs. Similar performances of the three SPPs are also presented in the estimation of annual erosivity density (Table 4).
Table 3.
Performance comparison of three SPPs for rainfall erosivity at different sub-catchments.
Table 4.
Performance comparison of the three SPPs for erosivity density at different sub-catchments.
On the sub-catchment scale, the correlation coefficient varied greatly in different sub-catchments. The estimates from the three SPPs in the Ganjiang and Fuhe sub-catchments presented significant correlations with the gauge-based rainfall erosivity (R > 0.8). However, the TRMM 3B42 and PERSIANN-CDR products presented large systematic biases in these two sub-catchments. The former overestimated the annual rainfall erosivity and erosivity density, while the latter significantly underestimated them. It is worth mentioning that, in the Xiushui and Raohe sub-catchments, all three SPPs showed poor performance in estimating rainfall erosivity and erosivity density on the annual scale. In these cases, the correlation coefficients were very low and their systematic biases were large, especially for the PERSIANN-CDR and GPM-IMERG precipitation products.
The inverse distance weighting (IDW) method is used to interpolate the annual rainfall erosivity to assess its spatial distribution by using the rain gauge data. Figure 9 compares the spatial maps of rainfall erosivity obtained from the rain gauge data and the three SPPs, respectively. It is seen that the annual rainfall erosivity from the rain gauge data varied strongly in different areas of the PLB and presented an increasing gradient from the southwest to the northeast of the basin. Light rainfall erosivity mainly occurred in the southwest of the PLB (approximately less than 8000 MJ·mm·ha−1 h−1), while heavy rainfall erosivity was mostly distributed in the northeast (greater than 11,000, even 13,000 MJ·mm·ha−1 h−1) (Figure 9a). Visual inspections of the results from the three SPPs revealed that, although regions with large rainfall erosivity values covered a wider area in cases of TRMM 3B42 and GPM-IMERG, they showed good spatial consistencies with the map of annual rainfall erosivity from the rain gauge data. These spatial consistencies were also confirmed by the large values of R (0.90 for TRMM 3B42 and 0.75 for GPM-IMERG) between the estimates at every rain gauge and corresponding satellite pixel (Figure 10). However, the performance of PERSIANN-CDR was unsatisfactory in depicting the spatial pattern of rainfall erosivity, i.e., the southwest–northeast gradient of the annual rainfall erosivity was not reproduced, and the area with the median values of rainfall erosivity in the northwest of the basin was significantly narrowed (Figure 9c).
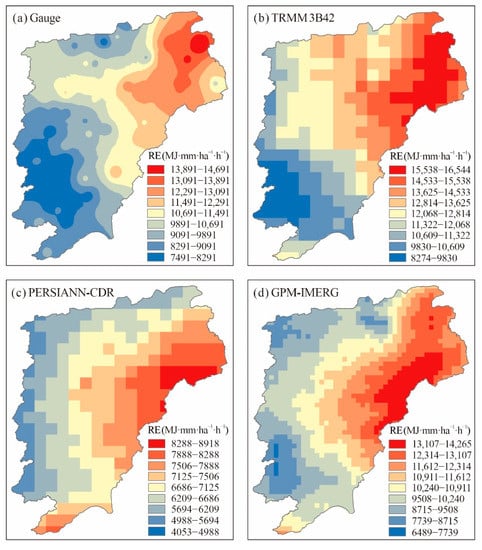
Figure 9.
Comparison of the spatial patterns of average annual rainfall erosivity.
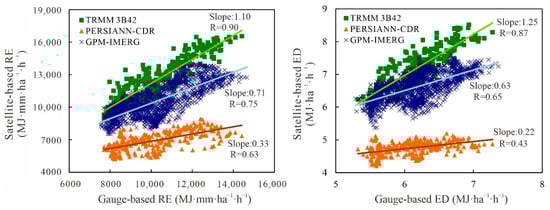
Figure 10.
Spatial correlation between estimates from the three SPPs and that from the rain gauge data (left for rainfall erosivity; right for erosivity density).
Figure 11 shows the spatial patterns of average annual erosivity density, estimated from the rain gauge data and the three SPPs. Likewise, the spatial distribution of erosivity density from the rain gauge data was obtained by spatial interpolation, based on the IDW method. It is obvious that the spatial pattern of erosivity density is similar to that of rainfall erosivity; for instance, large values of erosivity density are mainly distributed in the northeast, while small values are distributed in the southwest of the PLB. Moreover, the TRMM 3B42 and GPM-IMERG precipitation products characterized the spatial patterns of annual erosivity density well, with the spatial correlation coefficients of 0.87 and 0.65, respectively (Figure 10). In contrast, the PERSIANN-CDR precipitation product tended to show an insufficient ability to describe the spatial pattern of erosivity density.
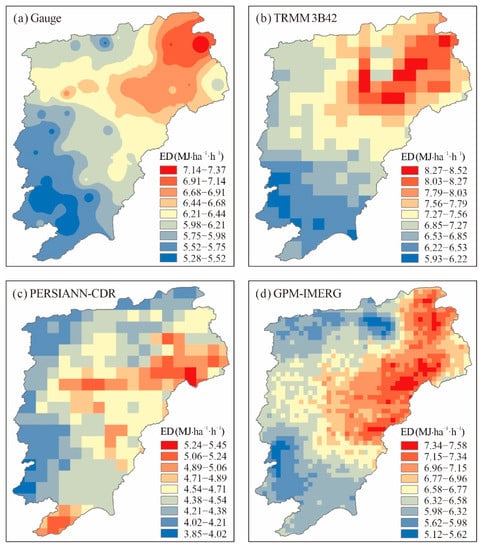
Figure 11.
Comparison of spatial patterns of average annual erosivity density.
4. Discussion
The TRMM 3B42, GPM-IMERG, and PERSIANN-CDR precipitation products have different accuracies in different areas, seasons, or rainfall intensities; they also present varying strengths and weaknesses for estimating and mapping rainfall erosivity. The performance assessment on the monthly and seasonal scales revealed that the TRMM 3B42 precipitation product performed best for estimating rainfall erosivity and erosivity density, with small BIAS values (−8.3% and −0.8%) in summer. However, the performance was unsatisfactory in winter because the rainfall erosivity and erosivity density were significantly overestimated by TRMM 3B42 during December–February, with large BIAS values (72.1% and 31.6%). This seasonality of biases was primarily related to the varying accuracies of the TRMM 3B42 product in different seasons. Many previous studies have shown that the season, climatological factors, and rainfall type can affect the accuracy of the TRMM precipitation product [37,80]. Wang et al. compared and evaluated several SPPs and re-analysis precipitation datasets and noted that the precision of the TRMM data was higher than that of other precipitation products during the wet season [81], while rainfall in the dry season was usually underestimated by the TRMM 3B42 product [82]. Similar results were also reported in studies of Li et al. [37] and Wang et al. [83]. Therefore, seasonality in the accuracy of the SPPs undoubtedly resulted in seasonal variation of biases of rainfall erosivity and erosivity density.
The PERSIANN-CDR precipitation product showed poor performance for estimating rainfall erosivity and erosivity density in this study, compared to TRMM 3B42 and GPM-IMERG, in most evaluated aspects. PERSIANN tended to detect false precipitation and generally showed a large systematic underestimation of rainfall [84], which were the main reasons why it significantly underestimated rainfall erosivity and erosivity density in all seasons. In addition, from the comparison of the TRMM 3B42 and GPM-IMERG precipitation products, the accuracies of rainfall erosivity and erosivity density derived from GPM-IMERG were better than those from TRMM 3B42, and the biases in winter were significantly reduced (27.8% and 16.3%). Similarly, Chen et al. also found that GPM-IMERG generally performed better than the TRMM 3B42 product in the Yangtze River Basin, when they evaluated the applicability of these two SPPs for assessing rainfall erosivity in different sub-regions of China [16]. Generally, as the successor of TRMM, the GPM-IMERG product is predictably more accurate than the TRMM product, which has been confirmed by numerous studies.
An analysis of the rainfall erosivity intensity revealed that the PERSIANN-CDR precipitation product overestimated light rainfall erosivity but underestimated heavy rainfall erosivity, regardless of the occurrence frequency and contribution rate. In particular, PERSIANN-CDR was unable to correctly estimate the mean values of rainfall erosivity in the heavy intensity groups (>2500 MJ·mm·ha−1 h−1) and exhibited large negative errors (ME exceeded −1100 MJ·mm·ha−1 h−1). This was mainly attributed to the overestimation of moderate precipitation (10–25 mm/day) and the underestimation of violent precipitation events (>50 mm/day) [84]. As for the TRMM 3B42 and GPM-IMERG precipitation products, although they generally performed better than PERSIANN-CDR, they still showed weaknesses in estimating heavy rainfall erosivity. This result is consistent with the finding of Chen et al. [16]. Villarini and Krajewski believed that heavy and extreme precipitation may cause signal attenuation and consequently affect the accuracy of the precipitation product [85]. TRMM 3B42 and GPM-IMERG achieved relatively poor performances in capturing extreme precipitation events [84] and therefore failed to accurately estimate heavy rainfall erosivity.
In addition, spatial performance analysis revealed that the spatial patterns of rainfall erosivity and erosivity density were generally reproduced by TRMM 3B42 and GPM-IMERG (with spatial correlation coefficients of 0.90 and 0.87 for TRMM 3B42, and 0.75 and 0.65 for GPM-IMERG, respectively), and this is mainly due to their remarkable ability for detecting the spatial characteristics of precipitation [60,84,86]. However, the PERSIANN-CDR precipitation product performed worse in capturing the spatial distributions of rainfall erosivity and erosivity density (with spatial correlation coefficients of 0.63 and 0.43). These spatial biases may be associated with, on one hand, the weak ability of PERSIANN-CDR to accurately detect extreme rainfall events, which frequently occur in the Raohe and Xinjiang sub-catchments of the PLB [87]. On the other hand, the topography of the PLB is complex, and its western and southern parts are mostly occupied by mountains and hills, which may significantly affect the accuracy of the PERSIANN precipitation product.
Finally, the current study has several uncertainties regarding the suitability evaluation of the SPPs for estimating and mapping rainfall erosivity. The data reliability and biases of the satellite-based precipitation products largely determine the accuracy of rainfall erosivity and erosivity density. In particular, only erosive rainfall greater than 12 mm was considered in this study [73]. The accuracy of the SPPs for heavy and extreme precipitation varies greatly in different atmospheric regions or complex topographic areas, which undoubtedly affected the assessment results. In addition, different models of rainfall erosivity estimation and parameter values also impact the results. Many methods based on the routine rain gauge records of daily, monthly, or annual rainfall data for estimating rainfall erosivity have been developed [3], and there may be some differences in the estimates from different models. Moreover, the values of weight coefficients (i.e., α and β) of the Zhang model used in this study were considered to be related to regional climate characteristics. Richardson et al. suggested using different values for α for the warm and cool seasons [88]. Therefore, future studies should focus on collective research through multiple models to reduce the uncertainty caused by this model. Moreover, the Hurst phenomenon is important in the long-term analysis of the changes in hydroclimatic processes. The intensity, frequency, and duration of extreme precipitation events have changed significantly compared to their distribution characteristics in the past, due to the impacts of climate change and human activities. Future studies should pay attention to the uncertainty of results derived from the Hurst phenomenon.
5. Conclusions
Three widely used SPPs (TRMM 3B42 V7, GPM-IMERG V06 Final, and PERSIANN-CDR) were used to estimate the rainfall erosivity and map its spatial pattern in the PLB. Their accuracy and performance in different rainfall erosivity intensities, seasons, and spaces were evaluated. The main conclusions are summarized as follows:
(1) For average monthly and seasonal rainfall erosivity, the GPM-IMERG precipitation product obtained the closest estimates to gauge-based rainfall erosivity (with a BIAS of −3.5–4.3%), while PERSIANN-CDR significantly underestimated (−34.6–35.4%) and TRMM 3B42 slightly overestimated (11.2%) the rainfall erosivity.
(2) TRMM 3B42 performed best for estimating rainfall erosivity and erosivity density in summer with small BIAS values (−8.3% and −0.8%), but its performance was less satisfactory in winter. The precision of estimates obtained from GPM-IMERG was better than those from TRMM 3B42, especially the biases in winter, which were significantly reduced. PERSIANN-CDR presented a poor performance in most of the evaluated aspects, and the rainfall erosivity and erosivity density showed large systematic biases during the summer.
(3) Regardless of the occurrence frequency and contribution rate, PERSIANN-CDR overestimated light rainfall erosivity (<1000 MJ·mm·ha−1 h−1) and underestimated heavy rainfall erosivity (>2000 MJ·mm·ha−1 h−1). TRMM 3B42 and GPM-IMERG also underestimated the mean rainfall erosivity in the heavy intensity groups. However, they had the largest biases for light rainfall erosivity in terms of relative error (about 20%).
(4) TRMM 3B42 and GPM-IMERG correctly presented the spatial pattern of rainfall erosivity and erosivity density with high values of spatial correlation coefficients. However, PERSIANN-CDR tended to be less skillful in correctly describing its spatial maps.
Overall, the SPPs had good potential for estimating and mapping rainfall erosivity. In particular, GPM-IMERG provides a new generation of precipitation data, and its high spatial and temporal resolutions and high accuracy are favorable for estimating and mapping rainfall erosivity. The outcomes of the study provide insight into the suitability of the SPPs for rainfall erosivity estimation. Further, it is important to recognize that some errors and biases still exist in the estimates of rainfall erosivity from the SPPs, especially for heavy rainfall erosivity in summer. This provides possible directions for further improving these products by improving the algorithms and incorporating additional information to reduce false alarms and correctly capture heavy rainfall. Conversely, extensive efforts to assess the performance of SPPs for rainfall erosivity must continue, while considering the influence of climate characteristics and complex topography.
Author Contributions
Conceptualization, X.L.; methodology, X.L. and C.X.; software, C.X.; validation, X.Y.; formal analysis, X.L. and X.Y.; investigation, X.L. and X.Y.; data curation, C.X.; writing—original draft preparation, X.L.; writing—review and editing, X.Y.; visualization, C.X.; supervision, X.L.; project administration, X.L.; funding acquisition, X.L. All authors have read and agreed to the published version of the manuscript.
Funding
This research was funded by the National Key Research and Development Program of China, grant number 2018YFE0206400, and the National Natural Science Foundation of China, grant number 41871093.
Data Availability Statement
The TRMM 3B42 V7 and GPM-IMERG V06 Final products are openly available at https://disc.gsfc.nasa.gov/datasets (accessed on 1 May 2021). The PERSIANN-CDR daily rainfall estimates are openly available at https://www.ncei.noaa.gov/erddap (accessed on 1 May 2021).
Conflicts of Interest
The authors declare no conflict of interest.
References
- Panagos, P.; Ballabio, C.; Borrelli, P.; Meusburger, K.; Klik, A.; Rousseva, S.; Tadic, M.P.; Michaelides, S.; Hrabalikova, M.; Olsen, P.; et al. Rainfall erosivity in Europe. Sci. Total Environ. 2015, 511, 801–814. [Google Scholar] [CrossRef] [PubMed]
- Panagos, P.; Borrelli, P.; Spinoni, J.; Ballabio, C.; Meusburger, K.; Beguería, S.; Klik, A.; Michaelides, S.; Petan, S.; Hrabalíková, M.; et al. Monthly Rainfall Erosivity: Conversion Factors for Different Time Resolutions and Regional Assessments. Water 2016, 8, 119. [Google Scholar] [CrossRef]
- Lee, J.H.; Heo, J.H. Evaluation of estimation methods for rainfall erosivity based on annual precipitation in Korea. J. Hydrol. 2011, 409, 30–48. [Google Scholar] [CrossRef]
- Nearing, M.A.; Yin, S.Q.; Borrelli, P.; Polyakov, V.O. Rainfall erosivity: An historical review. Catena 2017, 157, 357–362. [Google Scholar] [CrossRef]
- Sunday, E.O.; Mohammed, M.B.; John, C.N.; Hermansah, Y.W.; Charles, A.; Toshiyuki, W. Soil degradation-induced decline in productivity of sub-Saharan African soils: The prospects of looking downwards the lowlands with the Sawah ecotechnology. Appl. Environ. Soil Sci. 2012, 2012, 673926. [Google Scholar]
- Luo, P.; Luo., M.; Li, F.; Qi, X.; Huo, A.; Wang, Z.; He, B.; Takara, K.; Nover, D.; Wang, Y. Urban flood numerical simulation: Research, methods and future perspectives. Environ. Modell. Softw. 2022, 156, 105478. [Google Scholar] [CrossRef]
- IPCC. Climate Change 2021: The Physical Science Basis; Contribution of Working Group I to the Sixth Assessment Report of the Intergovernmental Panel on Climate Change; Cambridge University Press: Cambridge, UK; New York, NY, USA, 2021. [Google Scholar]
- Luo, P.; Liu, L.; Wang, S.; Ren, B.; He, B.; Nover, D. Influence assessment of new Inner Tube Porous Brick with absorbent concrete on urban floods control. Case Stud. Constr. Mater. 2022, 17, e01236. [Google Scholar] [CrossRef]
- Luo, P.; Mu, Y.; Wang, S.; Zhu, W.; Mishra, B.K.; Huo, A.; Zhou, M.; Lyu, J.; Hu, M.; Duan, W.; et al. Exploring sustainable solutions for the water environment in Chinese and Southeast Asian cities. Ambio 2022, 51, 1199–1218. [Google Scholar] [CrossRef]
- Zhu, W.; Wang, S.; Luo, P.; Zha, X.; Cao, Z.; Lyu, J.; Zhou, M.; He, B.; Nover, D. A Quantitative Analysis of the Influence of Temperature Change on the Extreme Precipitation. Atmosphere 2022, 13, 612. [Google Scholar] [CrossRef]
- Wang, S.; Cao, Z.; Luo, P.; Zhu, W. Spatiotemporal Variations and Climatological Trends in Precipitation Indices in Shaanxi Province, China. Atmosphere 2022, 13, 744. [Google Scholar] [CrossRef]
- Zhao, B.; Zhang, L.; Xia, Z.; Xu, W.; Xia, L.; Liang, Y.; Xia, D. Effects of rainfall intensity and vegetation cover on erosion characteristics of a soil containing rock fragments slope. Adv. Civ. Eng. 2019, 2019, 7043428. [Google Scholar] [CrossRef]
- Angulo-Martínez, M.; Barros, A.P. Measurement uncertainty in rainfall kinetic energy and intensity relationships for soil erosion studies: An evaluation using PARSIVEL disdrometers in the Southern Appalachian mountains. Geomorphology 2015, 228, 28–40. [Google Scholar] [CrossRef]
- Mello, C.R.; Viola, M.R.; Beskow, S.; Norton, L.D. Multivariate models for annual rainfall erosivity in Brazil. Geoderma 2013, 202, 88–102. [Google Scholar] [CrossRef]
- Yin, S.; Xie, Y.; Liu, B.; Nearing, M.A. Rainfall erosivity estimation based on rainfall data collected over a range of temporal resolutions. Hydrol. Earth Syst. Sci. 2015, 19, 4113–4126. [Google Scholar] [CrossRef]
- Chen, Y.H.; Xu, M.H.; Wang, Z.L.; Gao, P.; Lai, C.G. Applicability of two satellite-based precipitation products for assessing rainfall erosivity in China. Sci. Total Environ. 2021, 757, 143975. [Google Scholar] [CrossRef] [PubMed]
- Hoyos, N.; Waylen, P.R.; Jaramillo, A. Seasonal and spatial patterns of erosivity in a tropical watershed of the Colombian Andes. J. Hydrol. 2005, 314, 177–191. [Google Scholar] [CrossRef]
- Zhao, Q.H.; Liu, Q.; Ma, L.J.; Ding, S.Y.; Xu, S.S.; Wu, C.S.; Liu, P. Spatiotemporal variations in rainfall erosivity during the period of 1960–2011 in Guangdong Province, southern China. Theor. Appl. Climatol. 2017, 128, 113–128. [Google Scholar] [CrossRef]
- Foster, G.R. User’s Reference Guide: Revised Universal Soil Loss Equation (RUSLE2); U.S. Department of Agriculture; Agricultural Research Service: Washington, DC, USA, 2004.
- Wischmeier, W.H.; Smith, D.D. Predicting Rainfall Erosion Losses: A Guide to Conservation Planning; Agriculture Handbook No. 537; U.S. Department of Agriculture: Washington, DC, USA, 1978.
- Renard, K.G.; Foster, G.R.; Weesies, G.A.; McCool, D.K.; Yoder, D.C. Predicting Soil Erosion by Water: A Guide to Conservation Planning with the Revised Universal Soil Loss Equation (RUSLE); Agriculture Handbook No. 703; U.S. Department of Agriculture: Washington, DC, USA, 1997.
- Morgan, R.P.C.; Quinton, J.N.; Smith, R.E.; Govers, G.; Poesen, J.W.A.; Auerswald, K.; Chisci, G.; Torri, D.; Styczen, M.E. The European Soil Erosion Model (EUROSEM): A dynamic approach for predicting sediment transport from fields and small catchments. Earth Surf. Proc. Land. 1998, 23, 527–544. [Google Scholar] [CrossRef]
- de Jong, S.M.; Paracchini, M.L.; Bertolo, F.; Folving, S.; Megier, J.; de Roo, A.P.J. Regional assessment of soil erosion using the distributed model SEMMED and remotely sensed data. Catena 1999, 37, 291–308. [Google Scholar] [CrossRef]
- Gu, Z.J.; Duan, X.W.; Liu, B.; Hu, J.M.; He, J.N. The spatial distribution and temporal variation of rainfall erosivity in the Yunnan Plateau, Southwest China: 1960–2012. Catena 2016, 145, 291–300. [Google Scholar]
- Carolina, M.A.; Gabrela, C.A.; Ruben, M.C. Long term variation in rainfall erosivity in Uruguay: A preliminary Fournier approach. GeoJournal 2008, 70, 257–262. [Google Scholar]
- Meshesha, D.T.; Tsunekawa, A.; Tsubo, M.; Haregeweyn, N.; Adgo, E. Evaluating spatial and temporal variations of rainfall erosivity, case of Central Rift Valley of Ethiopia. Theor. Appl. Climatol. 2015, 119, 515–522. [Google Scholar] [CrossRef]
- Qin, W.; Guo, Q.K.; Zuo, C.Q.; Shan, Z.J.; Ma, L.; Sun, G. Spatial distribution and temporal trends of rainfall erosivity in mainland China for 1951–2010. Catena 2016, 147, 177–186. [Google Scholar] [CrossRef]
- Vallebona, C.; Pellegrino, E.; Frumento, P.; Bonari, E. Temporal trends in extreme rainfall intensity and erosivity in the Mediterranean region: A case study in southern Tuscany, Italy. Clim. Chang. 2015, 128, 139–151. [Google Scholar] [CrossRef]
- Ballabio, C.; Borrelli, P.; Spinoni, J.; Meusburger, K.; Michaelides, S.; Begueria, S.; Klik, A.; Petan, S.; Janecek, M.; Olsen, P.; et al. Mapping monthly rainfall erosivity in Europe. Sci. Total Environ. 2017, 579, 1298–1315. [Google Scholar] [CrossRef]
- Yin, S.; Xie, Y.; Nearing, M.A.; Wang, C. Estimation of rainfall erosivity using 5- to 60-minute fixed-interval rainfall data from China. CATENA 2007, 70, 306–312. [Google Scholar] [CrossRef]
- Xie, Y.; Yin, S.Q.; Liu, B.Y.; Nearing, M.A.; Zhao, Y. Models for estimating daily rainfall erosivity in China. J. Hydrol. 2016, 535, 547–558. [Google Scholar] [CrossRef]
- Li, Y.; He, Y.; Zhang, Y.; Jia, L. Spatiotemporal evolutionary analysis of rainfall erosivity during 1901–2017 in Beijing, China. Environ. Sci. Pollut. Res. 2022, 29, 2510–2522. [Google Scholar] [CrossRef] [PubMed]
- Yue, B.J.; Shi, Z.H.; Fang, N.F. Evaluation of rainfall erosivity and its temporal variation in the Yanhe River catchment of the Chinese Loess Plateau. Nat. Hazards 2014, 74, 585–602. [Google Scholar] [CrossRef]
- Yang, F.B.; Lu, C.H. Spatiotemporal variation and trends in rainfall erosivity in China’s dryland region during 1961–2012. Catena 2015, 133, 362–372. [Google Scholar] [CrossRef]
- Stisen, S.; Sandholt, I. Evaluation of remote-sensing-based rainfall products through predictive capability in hydrological runoff modelling. Hydrol. Process. 2010, 24, 879–891. [Google Scholar] [CrossRef]
- Levizzani, V.; Cattani, E. Satellite Remote Sensing of Precipitation and the Terrestrial Water Cycle in a Changing Climate. Remote Sens. 2019, 11, 2301. [Google Scholar] [CrossRef]
- Li, X.H.; Zhang, Q.; Xu, C.Y. Assessing the performance of satellite-based precipitation products and its dependence on topography over Poyang Lake basin. Theor. Appl. Climatol. 2014, 115, 713–729. [Google Scholar] [CrossRef]
- Chen, F.R.; Li, X. Evaluation of IMERG and TRMM 3B43 Monthly Precipitation Products over Mainland China. Remote Sens. 2016, 8, 472. [Google Scholar] [CrossRef]
- Tang, G.Q.; Ma, Y.Z.; Long, D.; Zhong, L.Z.; Hong, Y. Evaluation of GPM Day-1 IMERG and TMPA Version-7 legacy products over Mainland China at multiple spatiotemporal scales. J. Hydrol. 2016, 533, 152–167. [Google Scholar] [CrossRef]
- Guo, R.F.; Liu, Y.B. Evaluation of Satellite Precipitation Products with Rain Gauge Data at Different Scales: Implications for Hydrological Applications. Water 2016, 8, 281. [Google Scholar] [CrossRef]
- Asong, Z.E.; Razavi, S.; Wheater, H.S.; Wong, J.S. Evaluation of Integrated Multisatellite Retrievals for GPM (IMERG) over Southern Canada against Ground Precipitation Observations: A Preliminary Assessment. J. Hydrometeorol. 2017, 18, 1033–1050. [Google Scholar] [CrossRef]
- Anjum, M.N.; Ding, Y.J.; Shangguan, D.H.; Ahmad, I.; Ijaz, M.W.; Farid, H.U.; Yagoub, Y.E.; Zaman, M.; Adnan, M. Performance evaluation of latest integrated multi-satellite retrievals for Global Precipitation Measurement (IMERG) over the northern highlands of Pakistan. Atmos. Res. 2018, 205, 134–146. [Google Scholar] [CrossRef]
- Tan, M.L.; Duan, Z. Assessment of GPM and TRMM Precipitation Products over Singapore. Remote Sens. 2017, 9, 720. [Google Scholar] [CrossRef]
- Sharifi, E.; Steinacker, R.; Saghafian, B. Multi time-scale evaluation of high-resolution satellite-based precipitation products over northeast of Austria. Atmos. Res. 2018, 206, 46–63. [Google Scholar] [CrossRef]
- Satge, F.; Xavier, A.; Zola, R.P.; Hussain, Y.; Timouk, F.; Garnier, J.; Bonnet, M.P. Comparative Assessments of the Latest GPM Mission’s Spatially Enhanced Satellite Rainfall Products over the Main Bolivian Watersheds. Remote Sens. 2017, 9, 369. [Google Scholar] [CrossRef]
- Fang, J.; Yang, W.T.; Luan, Y.B.; Du, J.; Lin, A.W.; Zhao, L. Evaluation of the TRMM 3B42 and GPM IMERG products for extreme precipitation analysis over China. Atmos. Res. 2019, 223, 24–38. [Google Scholar] [CrossRef]
- Yi, L.; Zhang, W.C.; Wang, K. Evaluation of Heavy Precipitation Simulated by the WRF Model Using 4D-Var Data Assimilation with TRMM 3B42 and GPM IMERG over the Huaihe River Basin, China. Remote Sens. 2018, 10, 646. [Google Scholar] [CrossRef] [Green Version]
- Zhu, Y.; Luo, P.; Su, F.; Zhang, S.; Sun, B. Spatiotemporal Analysis of Hydrological Variations and Their Impacts on Vegetation in Semiarid Areas from Multiple Satellite Data. Remote Sens. 2020, 12, 4177. [Google Scholar] [CrossRef]
- Zhang, Z.X.; Tian, J.X.; Huang, Y.H.; Chen, X.; Chen, S.; Duan, Z. Hydrologic Evaluation of TRMM and GPM IMERG Satellite-Based Precipitation in a Humid Basin of China. Remote Sens. 2019, 11, 431. [Google Scholar] [CrossRef]
- Yang, Y.M.; Du, J.; Cheng, L.L.; Xu, W. Applicability of TRMM satellite precipitation in driving hydrological model for identifying flood events: A case study in the Xiangjiang River Basin, China. Nat. Hazards 2017, 87, 1489–1505. [Google Scholar] [CrossRef]
- Duan, W.L.; He, B.; Nover, D.; Fan, J.L.; Yang, G.S.; Chen, W.; Meng, H.F.; Liu, C.M. Floods and associated socioeconomic damages in China over the last century. Nat. Hazards 2016, 82, 401–413. [Google Scholar] [CrossRef]
- Zambrano, F.; Wardlow, B.; Tadesse, T.; Lillo-Saavedra, M.; Lagos, O. Evaluating satellite-derived long-term historical precipitation datasets for drought monitoring in Chile. Atmos. Res. 2017, 186, 26–42. [Google Scholar] [CrossRef]
- Fu, Y.F.; Pan, X.; Xian, T.; Liu, G.S.; Zhong, L.; Liu, Q.; Li, R.; Wang, Y.; Ma, M. Precipitation characteristics over the steep slope of the Himalayas in rainy season observed by TRMM PR and VIRS. Clim. Dyn. 2018, 51, 1971–1989. [Google Scholar] [CrossRef]
- Onyango, A.O.; Xu, H.M.; Lin, Z.H. Diurnal cycle of rainfall over Lake Victoria Basin during the long-rain season based on TRMM satellite estimate. Int. J. Climatol. 2020, 40, 4622–4637. [Google Scholar] [CrossRef]
- Kim, J.H.; Han, H.C.; Kim, B.R.; Chen, H.N.; Lee, J.H. Use of a high-resolution-satellite-based precipitation product in mapping continental-scale rainfall erosivity: A case study of the United States. Catena 2020, 193, 104602. [Google Scholar] [CrossRef]
- Vrieling, A.; Sterk, G.; de Jong, S.M. Satellite-based estimation of rainfall erosivity for Africa. J. Hydrol. 2010, 395, 235–241. [Google Scholar] [CrossRef]
- Zhu, Q.; Chen, X.W.; Fan, Q.X.; Jin, H.P.; Li, J.R. A new procedure to estimate the rainfall erosivity factor based on Tropical Rainfall Measuring Mission (TRMM) data. Sci. China Technol. Sci. 2011, 54, 2437–2445. [Google Scholar] [CrossRef]
- Teng, H.F.; Ma, Z.Q.; Chappell, A.; Shi, Z.; Liang, Z.Z.; Yu, W. Improving Rainfall Erosivity Estimates Using Merged TRMM and Gauge Data. Remote Sens. 2017, 9, 1134. [Google Scholar] [CrossRef]
- Fan, J.R.; Chen, Y.; Yan, D.; Guo, F.F. Characteristics of rainfall erosivity based on tropical rainfall measuring mission data in Tibet, China. J. Mt. Sci. 2013, 10, 1008–1017. [Google Scholar] [CrossRef]
- Li, X.H.; Li, Z.; Lin, Y.L. Suitability of TRMM Products with Different Temporal Resolution (3-Hourly, Daily, and Monthly) for Rainfall Erosivity Estimation. Remote Sens. 2020, 12, 3924. [Google Scholar] [CrossRef]
- Prakash, S.; Mitra, A.K.; AghaKouchak, A.; Liu, Z.; Norouzi, H.; Pai, D.S. A preliminary assessment of GPM-based multi-satellite precipitation estimates over a monsoon dominated region. J. Hydrol. 2018, 556, 865–876. [Google Scholar] [CrossRef]
- Amjad, M.; Yilmaz, M.T.; Yucel, I.; Yilmaz, K.K. Performance evaluation of satellite- and model-based precipitation products over varying climate and complex topography. J. Hydrol. 2020, 584, 124707. [Google Scholar] [CrossRef]
- Ma, L.; Jiang, G.H.; Zuo, C.Q.; Qiu, G.Y.; Huo, H.G. Spatial and temporal distribution characteristics of rainfall erosivity changes in Jiangxi Province over more than 50 years. Trans. CSAE 2009, 25, 61–68. (In Chinese) [Google Scholar]
- Huang, J.; Zhang, J.C.; Zhang, Z.X.; Xu, C.Y. Spatial and temporal variations in rainfall erosivity during 1960–2005 in the Yangtze River basin. Stoch. Environ. Res. Risk Assess. 2013, 27, 337–351. [Google Scholar] [CrossRef]
- Ye, X.C.; Zhang, Q.; Liu, J.; Li, X.H.; Xu, C.Y. Distinguishing the relative impacts of climate change and human activities on variation of streamflow in the Poyang Lake catchment, China. J. Hydrol. 2013, 494, 83–95. [Google Scholar] [CrossRef]
- Huffman, G.J.; Adler, R.F.; Bolvin, D.T.; Gu, G.J.; Nelkin, E.J.; Bowman, K.P.; Hong, Y.; Stocker, E.F.; Wolff, D.B. The TRMM multisatellite precipitation analysis (TMPA): Quasi-global, multiyear, combined-sensor precipitation estimates at fine scales. J. Hydrometeorol. 2007, 8, 38–55. [Google Scholar] [CrossRef]
- Kummerow, C.; Barnes, W.; Kozu, T.; Shiue, J.; Simpson, J. The Tropical Rainfall Measuring Mission (TRMM) sensor package. J. Atmos. Ocean. Technol. 1998, 15, 809–817. [Google Scholar] [CrossRef]
- Hou, A.Y.; Kakar, R.K.; Neeck, S.; Azarbarzin, A.A.; Kummerow, C.D.; Kojima, M.; Oki, R.; Nakamura, K.; Iguchi, T. The Global Precipitation Measurement Mission. Bull. Am. Meteorol. Soc. 2014, 95, 701–722. [Google Scholar] [CrossRef]
- Huffman, G.J.; Bolvin, D.T.; Nelkin, E.J. Integrated Multi-Satellite Retrievals for GPM (IMERG) Technical Documentation. 2018. Available online: https://pmm.nasa.gov/sites/default/files/document_files/IMERG_doc_180207.pdf (accessed on 1 May 2021).
- Hong, Y.; Hsu, K.L.; Sorooshian, S.; Gao, X.G. Improved representation of diurnal variability of rainfall retrieved from the Tropical Rainfall Measurement Mission Microwave Imager adjusted Precipitation Estimation From Remotely Sensed Information Using Artificial Neural Networks (PERSIANN) system. J. Geophys. Res. Atmos. 2005, 110, D06102. [Google Scholar] [CrossRef]
- Ashouri, H.; Hsu, K.L.; Sorooshian, S.; Braithwaite, D.K.; Knapp, K.R.; Cecil, L.D.; Nelson, B.R.; Prat, O.P. PERSIANN-CDR Daily Precipitation Climate Data Record from Multisatellite Observations for Hydrological and Climate Studies. Bull. Am. Meteorol. Soc. 2015, 96, 69–83. [Google Scholar] [CrossRef]
- Li, X.H.; Zhang, Q.; Hu, Q.; Zhang, D.; Ye, X.C. Lake flooding sensitivity to the relative timing of peak flows between upstream and downstream waterways: A case study of Poyang Lake, China. Hydrol. Process. 2017, 31, 4217–4228. [Google Scholar] [CrossRef]
- Zhang, W.B.; Xie, Y.; Liu, B.Y. Rainfall erosivity estimation using daily rainfall amounts. Sci. Geogr. Sin. 2002, 22, 705–711. (In Chinese) [Google Scholar]
- Zhang, W.B.; Fu, J.S. Rainfall erosivity estimation under different rainfall amount. Resour. Sci. 2003, 25, 35–41. (In Chinese) [Google Scholar]
- Liu, S.Y.; Huang, S.Z.; Xie, Y.Y.; Leng, G.Y.; Huang, Q.; Wang, L.; Xue, Q. Spatial-temporal changes of rainfall erosivity in the loess plateau, China: Changing patterns, causes and implications. Catena 2018, 166, 279–289. [Google Scholar] [CrossRef]
- Xie, Y.; Liu, B.Y.; Zhang, W.B. Study on standard of erosive rainfall. J. Soil Water Conserv. 2000, 14, 6–11. (In Chinese) [Google Scholar]
- Kinnell, P.I.A. Event soil loss, runoff and the Universal Soil Loss Equation family of models: A review. J. Hydrol. 2010, 385, 384–397. [Google Scholar] [CrossRef]
- Wilks, D.S. Forecast Verification. Statistical Methods in the Atmospheric Sciences; Academic Press: New York, NY, USA, 2006. [Google Scholar]
- Shrestha, M.S.; Takara, K.; Kubota, T.; Bajracharya, S.R. Verification of GSMaP rainfall estimates over the central Himalaya. Ann. J. Hydraulic Eng. JSCE 2011, 55, 37–42. [Google Scholar] [CrossRef]
- Artan, G.; Gadain, H.; Smith, J.L.; Asante, K.; Bandaragoda, C.J.; Verdin, J.P. Adequacy of satellite derived rainfall data for stream flow modeling. Nat. Hazards 2007, 43, 167–185. [Google Scholar] [CrossRef]
- Wang, N.; Liu, W.B.; Sun, F.B.; Yao, Z.H.; Wang, H.; Liu, W.Q. Evaluating satellite-based and reanalysis precipitation datasets with gauge-observed data and hydrological modeling in the Xihe River Basin, China. Atmos. Res. 2020, 234, 104746. [Google Scholar] [CrossRef]
- Ward, E.; Buytaert, W.; Peaver, L.; Wheater, H. Evaluation of precipitation products over complex mountainous terrain: A water resources perspective. Adv. Water Resour. 2011, 34, 1222–1231. [Google Scholar] [CrossRef]
- Wang, X.N.; Ding, Y.J.; Zhao, C.C.; Wang, J. Similarities and improvements of GPM IMERG upon TRMM 3B42 precipitation product under complex topographic and climatic conditions over Hexi region, Northeastern Tibetan Plateau. Atmos. Res. 2019, 218, 347–363. [Google Scholar] [CrossRef]
- Tan, M.L.; Santo, H. Comparison of GPM IMERG, TMPA 3B42 and PERSIANN-CDR satellite precipitation products over Malaysia. Atmos. Res. 2018, 202, 63–76. [Google Scholar] [CrossRef]
- Villarini, G.; Krajewski, W.F. Review of the Different Sources of Uncertainty in Single Polarization Radar-Based Estimates of Rainfall. Surv. Geophys. 2010, 31, 107–129. [Google Scholar] [CrossRef]
- Arshad, M.; Ma, X.Y.; Yin, J.; Ullah, W.; Ali, G.; Ullah, S.; Liu, M.Y.; Shahzaman, M.; Ullah, I. Evaluation of GPM-IMERG and TRMM-3B42 precipitation products over Pakistan. Atmos. Res. 2021, 249, 105341. [Google Scholar] [CrossRef]
- Li, X.H.; Hu, Q. Spatiotemporal Changes in Extreme Precipitation and Its Dependence on Topography over the Poyang Lake Basin, China. Adv. Meteorol. 2019, 2019, 1253932. [Google Scholar] [CrossRef]
- Richardson, C.W.; Foster, G.R.; Wright, D.A. Estimation of Erosion Index from Daily Rainfall Amount. Trans. ASAE 1983, 26, 153–156. [Google Scholar] [CrossRef]
Publisher’s Note: MDPI stays neutral with regard to jurisdictional claims in published maps and institutional affiliations. |
© 2022 by the authors. Licensee MDPI, Basel, Switzerland. This article is an open access article distributed under the terms and conditions of the Creative Commons Attribution (CC BY) license (https://creativecommons.org/licenses/by/4.0/).