Article

EO4Migration: The Design of an EO-Based Solution in Support of Migrants’ Inclusion and Social-Cohesion Policies

1
Institute of Atmospheric Pollution Research (IIA), National Research Council (CNR), c/o Interateneo Physics Department, Via Amendola 173, 70126 Bari, Italy
2
Institute for Environmental Research and Sustainable Development, National Observatory of Athens, Metaxa & Vas. Pavlou, 15236 Athens, Greece
*
Author to whom correspondence should be addressed.
Remote Sens. 2022, 14(17), 4295; https://doi.org/10.3390/rs14174295
Submission received: 13 July 2022 / Revised: 13 August 2022 / Accepted: 25 August 2022 / Published: 31 August 2022

Abstract

:
The purpose of this research is to demonstrate the strong potential of Earth-observation (EO) data and techniques in support of migration policies, and to propose actions to fill the existing structural gaps. The work was carried out within the “Smart URBan Solutions for air quality, disasters and city growth” (SMURBS, ERA-PLANET/H2020) project. The novelties introduced by the implemented solutions are based on the exploitation and synergy of data from different EO platforms (satellite, aerial, and in situ). The migration theme is approached from different perspectives. Among these, this study focuses on the design process of an EO-based solution for tailoring and monitoring the SDG 11 indicators in support of those stakeholders involved in migration issues, evaluating the consistency of the obtained results by their compliance with the pursued objective and the current policy framework. Considering the city of Bari (southern Italy) as a case study, significant conclusions were derived with respect to good practices and obstacles during the implementation and application phases. These were considered to deliver an EO-based proposal to address migrants’ inclusion in urban areas, and to unfold the steps needed for replicating the solution in other cities within and outside Europe in a standardized manner.

Graphical Abstract

1. Introduction

Migration is an increasing issue of our age, with an indisputable interlink with climate change and other environmental pressures. This paper showcases the strong potential of Earth-observation (EO) data and techniques in support of migration policies, and it identifies the gaps and needs for future work. In fact, as demonstrated in many other cases where the support for global policy frames has been demanded (i.e., Paris Agreement, Sendai Framework for Disaster Risk Reduction [1,2]), EO can support international cooperation and multilateralism, which are essential for supporting migration management.
Migrants and the movement of displaced populations to urban areas have been global trends over the last decade. By 2030, one in every three people will live in cities with at least half a million inhabitants [3]. Already in 2020, most of the 26.4 million refugees worldwide, and the 82.4 million internationally displaced persons (IDPs), are thought to live in urban areas [4].
This situation will introduce significant changes in the level and pace of urbanization, which can be determined by several factors. These factors include differences in the natural population growth between rural and urban areas, and rural-to-urban and international migration. In turn, this will bring about the expansion of urban settlements through the annexation and reclassification of rural settlements into cities. Thus, the challenge of social inclusion and resilience lies within cities.
The implementation of the 2030 United Nations (UN) Agenda for Sustainable Development Goals (SDGs) [5], and in particular SDG 11, “Make cities and human settlements inclusive, safe, resilient and sustainable”, requires an understanding of the key urbanization trends. Quantitative indicators may be crucial for such an understanding. The adoption of the New Urban Agenda [6] also brought about a new narrative in urban migration, with constant and solid reference to the respect of the “human rights of refugees and internally displaced persons and migrants, regardless of their migration status”, and the needed support to “host cities in the spirit of international cooperation”.
The discourse on the linkages between migration and urban development has become increasingly important within the international community (e.g., the Global Migration Group (GMG)), contributing to the migration and development agenda shaping [7]. Consequently, several countries have established ministries dedicated to migration and related policies; yet, at the same time, 12 European member states have recently requested European funding to build new border walls to repel migrants [8].
Meanwhile, new techniques (e.g., drones) are being adopted for monitoring the walls that were built after 2015 in Europe, when more than one million Syrians tried to enter Europe. However, the problem is more complex than just the defense of external borders, as it needs to incorporate both a common vision and an efficient policy on migration in Europe. In all cases, quantitative data and the long-term monitoring of pertinent processes, including demographic, social, political, and economic issues, are urgently needed.
In support of these policies, quantitative data should provide both temporal and spatial information, which is the direction clearly indicated by the UN initiative on Global Geospatial Information Management (UN-GGIM), which aims at playing a leading role in setting the agenda for developing global geospatial information, and at promoting its use to address key global challenges. In the case of migration, the temporal dimension is mostly related to the causes, which may influence the intensity of fluxes. Indeed, new political conflicts (e.g., Afghanistan, Ukraine) and extreme natural hazards (e.g., flooding, tsunamis) can lead to a rapid concentration of migrants at country borders seeking refuge. Simultaneously, the economic crises and climate-change impacts (e.g., desertification, droughts) that we are facing generally involve slower and continuous timescales in migration processes. In the latter case, insights into regular-migrant-distribution management are required.
The spatial dimension involves issues related to both migrant spatial concentrations in well-known areas (e.g., refugee camps in Lampedusa (Italy), Lesbos, and Samos (Greece)), and the optimized distribution of regular migrants in urban areas all over Europe. To ensure social inclusion as well as good health and safety (e.g., from natural hazards) conditions, the questions to be posed include the location of new services required (transport, school, medical health), the housing location and its actual state, the population-density distribution, etc.
To answer these questions, EO data and techniques can provide a significant part of the temporal and spatial measurements needed to assess references, patterns, and trends, and thus support decisions in the short/medium term. Regularly acquired EO data enables the monitoring of constant or changing ground conditions at multiple scales and temporal frequencies [9,10,11,12,13,14,15,16,17,18]. Regarding the theme of the humanitarian crisis, the Copernicus Emergency Management Service (CEMS) [19] provides a suite of products that are available for free, described as follows: the P10 product in urban growth analysis; the P11 product on the human footprint evaluated through nighttime imagery; the P18 product providing information about human settlement structures by very-high-resolution imagery and ancillary data; the P19 product providing information about settlements of people who have left their homes or places of habitual residence due to natural or human-made disasters. Monitoring such activities can provide information on city growth over time, as well as population and dwelling changes.
At the same time, the integration of EO data with ancillary data (e.g., demographic) enables the long-term management of the location of regular migrants. The Organization for Economic Cooperation and Development (OECD) is a prominent and internationally recognized institution that is aimed at providing such demographic statistics [20]. In 2019, the OECD published a paper on resilient cities [21] that highlighted urban-resilience monitoring to urban pressure (as migration fluxes) by using resilience indicators, which, in turn, enforced the linkage between inclusion policies and the UN 2030 Agenda [5].
In this framework, this paper proposes a list of EO-based indicators that are compliant with the OECD and aligned to SDG 11 as a solution to provide quantitative measures of the achievement of the resilient, sustainable, and inclusive city goals. The study evaluates how this solution can support migration policies, proposing actions to fill the existing structural gaps evidenced from the interaction with the stakeholders. The process includes a checklist of actions addressed to evaluate whether the solution achieves the proposed objectives (filling the existing gaps) or not, and to understand what worked well and what is to be improved in future works.
The solution was conceptualized and implemented within the European H2020 project “Smart URBan Solutions for air quality, disasters and city growth” (SMURBS) (GA: 689443). The core of the SMURBS project was the implementation of a portfolio of “SMart URBan Solutions” that best represent the nature of the ERA-PLANET program [22] as a scientific-and-policy crossroad to create bottom-up EO-driven solutions against an array of environmental urban pressures, including migration aspects [23]. The aims and context of the SMURBS-project investigation on the migration theme are well described on the website summary page.
All the SMURBS solutions were based on the exploitation and synergy of different EO products from satellites and in situ-monitoring data. The analytical description of the platforms and the data used are detailed in the deliverables of Work Package 3—“EO based and citizen observatories data collection, processing and analysis”.
A few solutions uptake the crowdsourcing of data from IoT mobile-phone applications or smart-sensor technologies. This is an emerging research area for the urban environment, as suggested by the abundant research works in the recent literature [24,25,26,27].
Two of the thirteen SMURBS solutions from the portfolio were focused on migration issues and identified by the acronym SMIG—Solutions for MIGration:
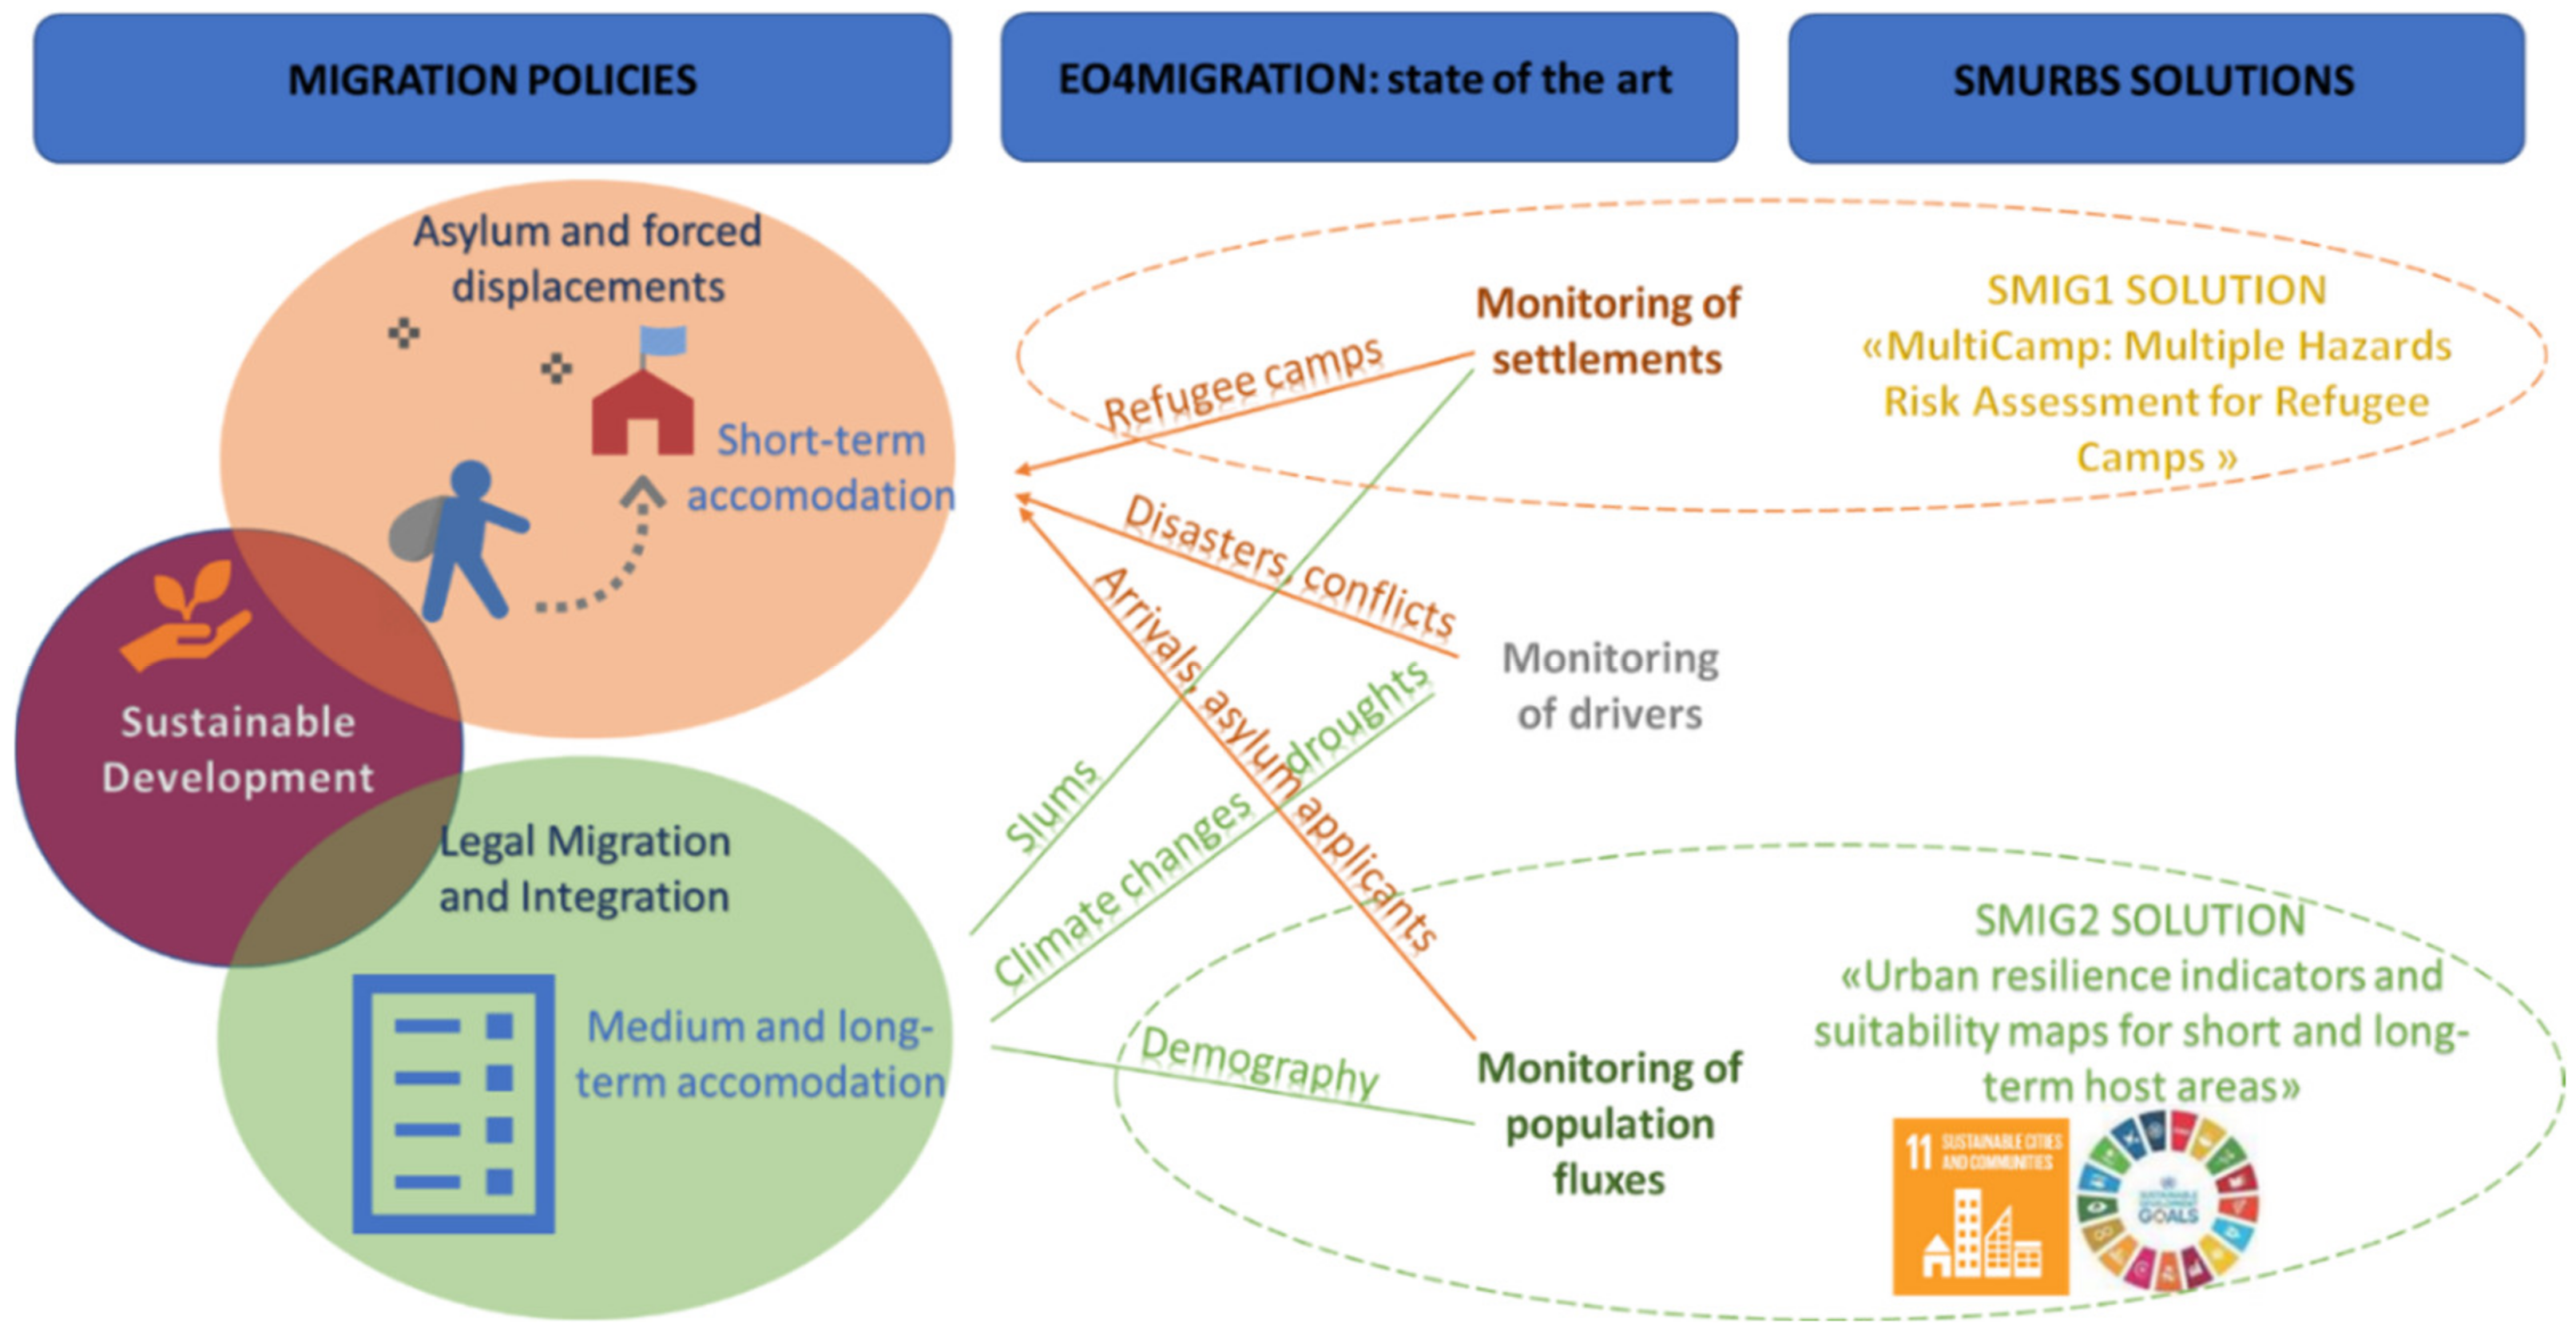
  • SMIG1: “Multiple Hazards Risk Assessment for Refugee Camps”;
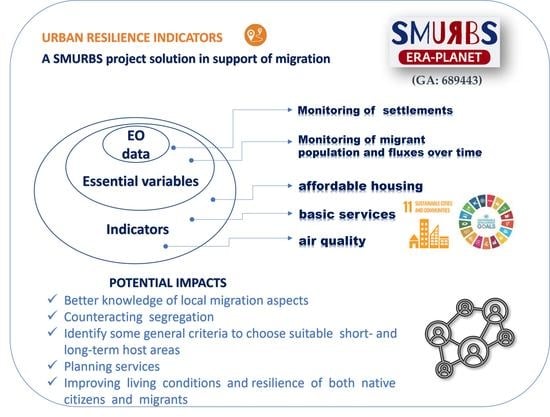
  • SMIG2: “Urban resilience indicators and suitability maps for short- and long-term host areas”.
Both solutions are described in detail in “D5.4—EO in the migration case studies” project deliverable [28]. However, this research work only focuses on the SMIG2 solution. A couple of research papers [29,30] provided technical details about the EO-based methods and tools developed within the SMURBS project in support of the SMIG2 solution.
The SMIG2 solution was developed through the integration of remote-sensing data from satellite and aerial platforms, EO-based products from the Copernicus Land Monitoring Service [31], and a large amount of heterogeneous ancillary data acquired by local providers (e.g., open-data portals, statistics authorities, and regional agencies on environmental protection).
The purpose of the SMIG2 solution was to implement a set of urban-resilience indicators to support local policymakers in devising sustainable, livable, and resilient trajectories to increase urban resilience, reduce urban segregation, and foster citizen inclusion.
The paper is organized as follows: Section 2 establishes the needs of the research work by an analysis on the recent EO-based applications for the monitoring of settlements and population fluxes and their exploitation within the current policy framework. Section 2.2, in particular, describes the integration into the project deliverable “D2.3—Policy and legal framework” [32], and focuses on the most recent sectoral policies on migration management. Section 2.3 updates and illustrates the state of the art of the existing EO technologies adopted in previous research projects or initiatives on migration. Section 2.4 summarizes the SMIG2-solution design process by analyzing specific gaps that emerged in the pilot city (i.e., Bari (southern Italy)). Section 3 reports the findings and results. Section 4 discusses recommendations on key actions to be taken forward in the future by EO scientists, decisionmakers, and a broadened community of stakeholders.

2. Materials and Methods

2.1. Case Study

To evaluate the strong potential of the existing EO data and techniques in support of migration, two solutions of the SMURBS portfolio were focused on migration issues.
SMIG1 focuses on predisaster-situation analysis, including hazards, exposure, and vulnerability and risk assessments, whereas the SMIG2 solution was designed in support of legal migration and integration (Figure 1). This research work only focuses on the second solution (SMIG2), and Bari city (Apulia region, southern Italy) was adopted as a case study for development and testing.
Bari, as a city on the Mediterranean Sea, has been historically exposed to regular and irregular migrant flows: 2.8% of the population (37,054 citizens) residing in the entire metropolitan area of Bari on 1 January 2020 was of non-EU citizenship [33]. Over the last 20 years, the city of Bari has experienced an upward trend in its migrant population, in contrast to a downward trend in the native population. In the last decade, the overall migratory balance—evaluated with respect to the entire metropolitan-area population—has been continuously negative. The local population (especially young people) tends to move toward northern Italy or abroad for work and study purposes. The total population of Bari city remained quite stable up until 2020, with only an additional total increase of 2.18%, whereas the migrant population has increased by about 100% since 2011, according to the last national census survey by the Italian Institute of STATistics (ISTAT) [29].
All the SMURBS solutions were based on the exploitation and synergy of different EO products from satellite imagery and various additional multisource data [34]. In this research work, multiseasonal and cloud-free Sentinel-2 images, freely downloaded from the United States Geological Survey (USGS) EarthExplorer portal [35] as Level-2A surface-reflectance products, were proposed to derive updated settlement maps. A pixel-based data-driven automatic-classification procedure was tested in [30], obtaining an overall accuracy (OA) of 99.00% ± 0.33%. Settlement maps were used in implementing the SMIG2 solution as input to test different dasymetric methods [29,30] aimed at generating grid population maps. At the second stage of the solution’s implementation, LiDAR data from aerial surveys were used to evaluate the introduction of volume information into the population-density estimation [29].
Different datasets from the Copernicus Land Monitoring Service (i.e., Corine Land Cover and Urban Atlas) were proposed and tested, as reported in [29], as input information on building use (residential, rural, commercial, industrial, and others).
Other categories of data, as statistics and demographic surveys, were considered and processed in support of the SMIG2 solution. The ancillary data used for the urban-resilience indicators are specified in Section 3.2.
An open-source geographical information system [36] was used as the main environment to ingest the heterogeneous data and translate them into compliant geospatial data and formats. Automatic workflows and a QGIS plugin were developed to facilitate the data handling and processing in order to generate updated grid population maps, as reported in Section 3.5.

2.2. Legal Migration and Integration Policies under the UN 2030 Agenda

Between 2014 and 2017, an unprecedented historical crisis, which witnessed numerous migrants and political refugees crossing the Mediterranean, prompted both the European Union (EU) and UN to prioritize the issue of how to enhance the management of the population mobility. For this purpose, the EU established the European Agenda on Migration [37].
Adopted in May 2015, the agenda aims at developing a holistic approach to human mobility, and at providing the EU member states with tools to better manage migration in the short as well as medium-to-long term [38]. In all its multifaceted aspects, the approach deals with border control and possible legal integration, in collaboration with the original migrant countries. Concurrently, in September 2015, the 193 member states of the UN committed to the 2030 Agenda for SDGs [5], which included SDG 10, aimed at facilitating “orderly, safe, regular and responsible migration and mobility of people, including through the implementation of planned and well-managed migration policies”. This objective was further elaborated one year later (19 September 2016) in the UN New York Declaration for Refugees and Migrants [39]. The declaration launched a step-by-step procedure toward the adoption of the UN Global Compact for Safe, Orderly and Regular Migration [40]. This agreement was adopted on 19 December 2018, and it focused particularly on the need “to strengthen our knowledge and analysis of migration, as shared understanding will improve policies”.
In other words, the EU and UN agendas share a series of common traits: they strive to set up a governance of international migration in which migration policies would be able to plan and manage flows effectively; they also state the need for better migration-related data and knowledge to inform the policymaking process.
In November 2020, the European Commission (EC) presented the Action Plan on Integration and Inclusion 2021–2027 [41]. The plan delineates a framework for concrete initiatives and actions to assist member states in the integration of around 34 million third-country nationals legally residing in the territory of the EU. To increase multilateral partnerships at different levels of governance, the plan covers education, employment, healthcare, and housing. It brings together monitoring measures, the use of new digital tools, and efforts to promote migrants’ participation in society.
In Italy, migration policies have two main objectives: to guarantee public order and security by preventing irregular migration, and to facilitate the reception and integration of asylum seekers and recognized refugees to ensure social cohesion. Essentially, with Legislative Decree no. 142 of 18 August 2015 [42], Italy began to implement what is addressed in the European policy framework for laying down standards for the reception of applicants for international protection [43,44]. With the Decree Law no. 130 of 21 October 2020, which was converted into Law no. 173 of 18 December 2020 [45], a diffuse reception network called the Reception and Integration System (SAI) was created [46].
This law also reintroduced the possibility for asylum seekers to be included in the registry of the resident population (by revoking the more restrictive laws previously in force), thereby bringing Italian legislation into line with the EU Reception Conditions Directive.
In this current framework, the monitoring of population and settling has become crucial to fostering social cohesion and resilience, as further detailed in Section 2.3.

2.3. Assessment of Human Settlement Trends

Because population distribution is crucial for migration analyses, recent EO-based applications for the monitoring of settlements and population fluxes are hereafter described, suggesting their exploitation within the current policy framework.

2.3.1. The Monitoring of Settlement

During the UN-Habitat III conference in October 2016, the EU, OECD, and World Bank launched a voluntary commitment to develop a global people-based definition of cities and settlements. This commitment will support the implementation of the New Urban Agenda [6]. It will also support the monitoring and comparison of the urban Sustainable Development Goals. Several indicators linked to this goal are highly sensitive to such definitions [47].
The Joint Research Center (JRC) of the EC has been at the frontline of providing technical contributions and settlement data across the world, at various scales. The JRC defines a “settlement map” as a built-up (BU) map that includes only structures that have a vertical extent, which is achieved by filtering roads and other sealed surfaces. The working definition of the BU structure (building), according to the Interactive Data Specification platform of the INfrastructure for SPatial InfoRmation in Europe (INSPIRE) [48] definition, is “enclosed constructions above ground which are intended or used for the shelter of humans, animals, things or for the production of economic goods and that refer to any structure constructed or erected on its site”.
This definition does not impose any permanency on the BU structure and results, thus encompassing temporary human settlements, such as refugee or internally-displaced-people camps and slums, or the informal-settlement concept [49].
The main settlement datasets provided by the JRC and other relevant institutions in Europe are listed in Table 1.

2.3.2. The Monitoring of Population Fluxes

Statistics offices and demographic services are relevant key players for the implementation of the UN 2030 Agenda. Up-to-date high-resolution population datasets are fundamental to understanding demographic trends, managing safe, orderly, and regular migration, and planning humanitarian operations [57]. Within the main objective of the data collection of demographic data (qualitative and quantitative), the UN Global Compact [40] emphasizes the necessity of improving migration data at the local, national, regional, and global levels, and also with respect to their comparability and compatibility, by supporting the participation of all relevant stakeholders, and by collaboration between the existing global and regional databases and depositories under the guidance of the Statistical Commission of the UN, strengthening the analysis and dissemination of migration-related data and indicators.
Nowadays, there are several initiatives with the aim of providing multipurpose global population datasets, including the Gridded Population of the World [58], JRC GHSL population dataset [59], Global Urban Footprint [55,56], WorldPop [60], and LandScan Global Population Dataset [61]. These datasets provide both raster maps showing the spatial distribution of the population density, as well as the amount of the total population usually residing in a specific study area. However, they do not provide information on the specific components (attributes) of a population (e.g., citizenship or country of birth) [29].
In Europe, the Commission (Eurostat) regularly collects statistical demographic data on asylum and migration management according to Regulation (EC) No. 862/2007 of both the European Parliament and European Council [38]. This regulation and Commission Regulation (EU) No. 216/2010 [62], which defines the different categories that allow for the residence permit, are considered the main tools for performing mandatory statistical analyses on asylum and migration management.
The main historical sources of international-migration data are represented by the following: (a) UNDESA statistics on the stocks of migrants by country of birth and destination (1990–2017) [63]; (b) World Bank statistics on the stocks of migrants by country of birth and destination (1960, 1970, 1980) [64], which is a dataset of the net migration flows at five-year intervals between world countries, estimated from a demographic accounting exercise (1965–2015) [65]; (c) UNHCR statistics on monthly asylum applications (1999–2017) and on the annual stocks of refugees (1960–2016) [66]; (d) EUROSTAT statistics on first residence permits (2008–2016) [67]; (e) the GALLUP World Poll for individual intentions to migrate (2010–2015) [68].
In 2016, the EC created the Knowledge Centre on Migration and Demography (KCMD) [69], which is aimed at providing scientific evidence for EU policymaking tailored to the needs of the commission services. In 2018, the KCMD conducted the initiative Data 4 Integration (D4I) [70], consisting of assembling datasets, based on the 2011 Census in eight EU member states, and showing the concentration of migrants by origin at a high spatial resolution (grid cells of 100 by 100 m). Such data allow for the analysis of the patterns of segregation, diversity, and concentrations of migrants at the level of neighborhoods, and they compare these patterns across small and large cities, countries of destination, and the origins of the migrants. The JRC provided all the necessary technical know-how to support this and other similar initiatives, such as the European migration-flux map from the European migration-data Hub [71]. Such a map was produced using population data from the JRC Global Human Settlement Layer (GHSL) (for settlements, see Table 1) and demographic data from the United Nations World Population Prospects (UNDESA) [72,73]. More recently, the KCMD has been exploring the potential of large and nontraditional data sources for migration [74]. These efforts, strengthened by the KCMD and IOM’s Global Migration Data Analysis Centre (IOM, GMDAC) through the initiative Big Data for Migration Alliance (BD4M) [61,62], have led to the development of two areas of research. The first one explores social-media-advertising platforms (i.e., Facebook) to estimate migration stocks, and the second one looks at air-traffic-passenger data to estimate the flows of migrants at the global scale [75].
In Table 2, the most recent research papers found in the literature on spatial population datasets, obtained from EO data, along with various geospatial processing techniques, are reported.

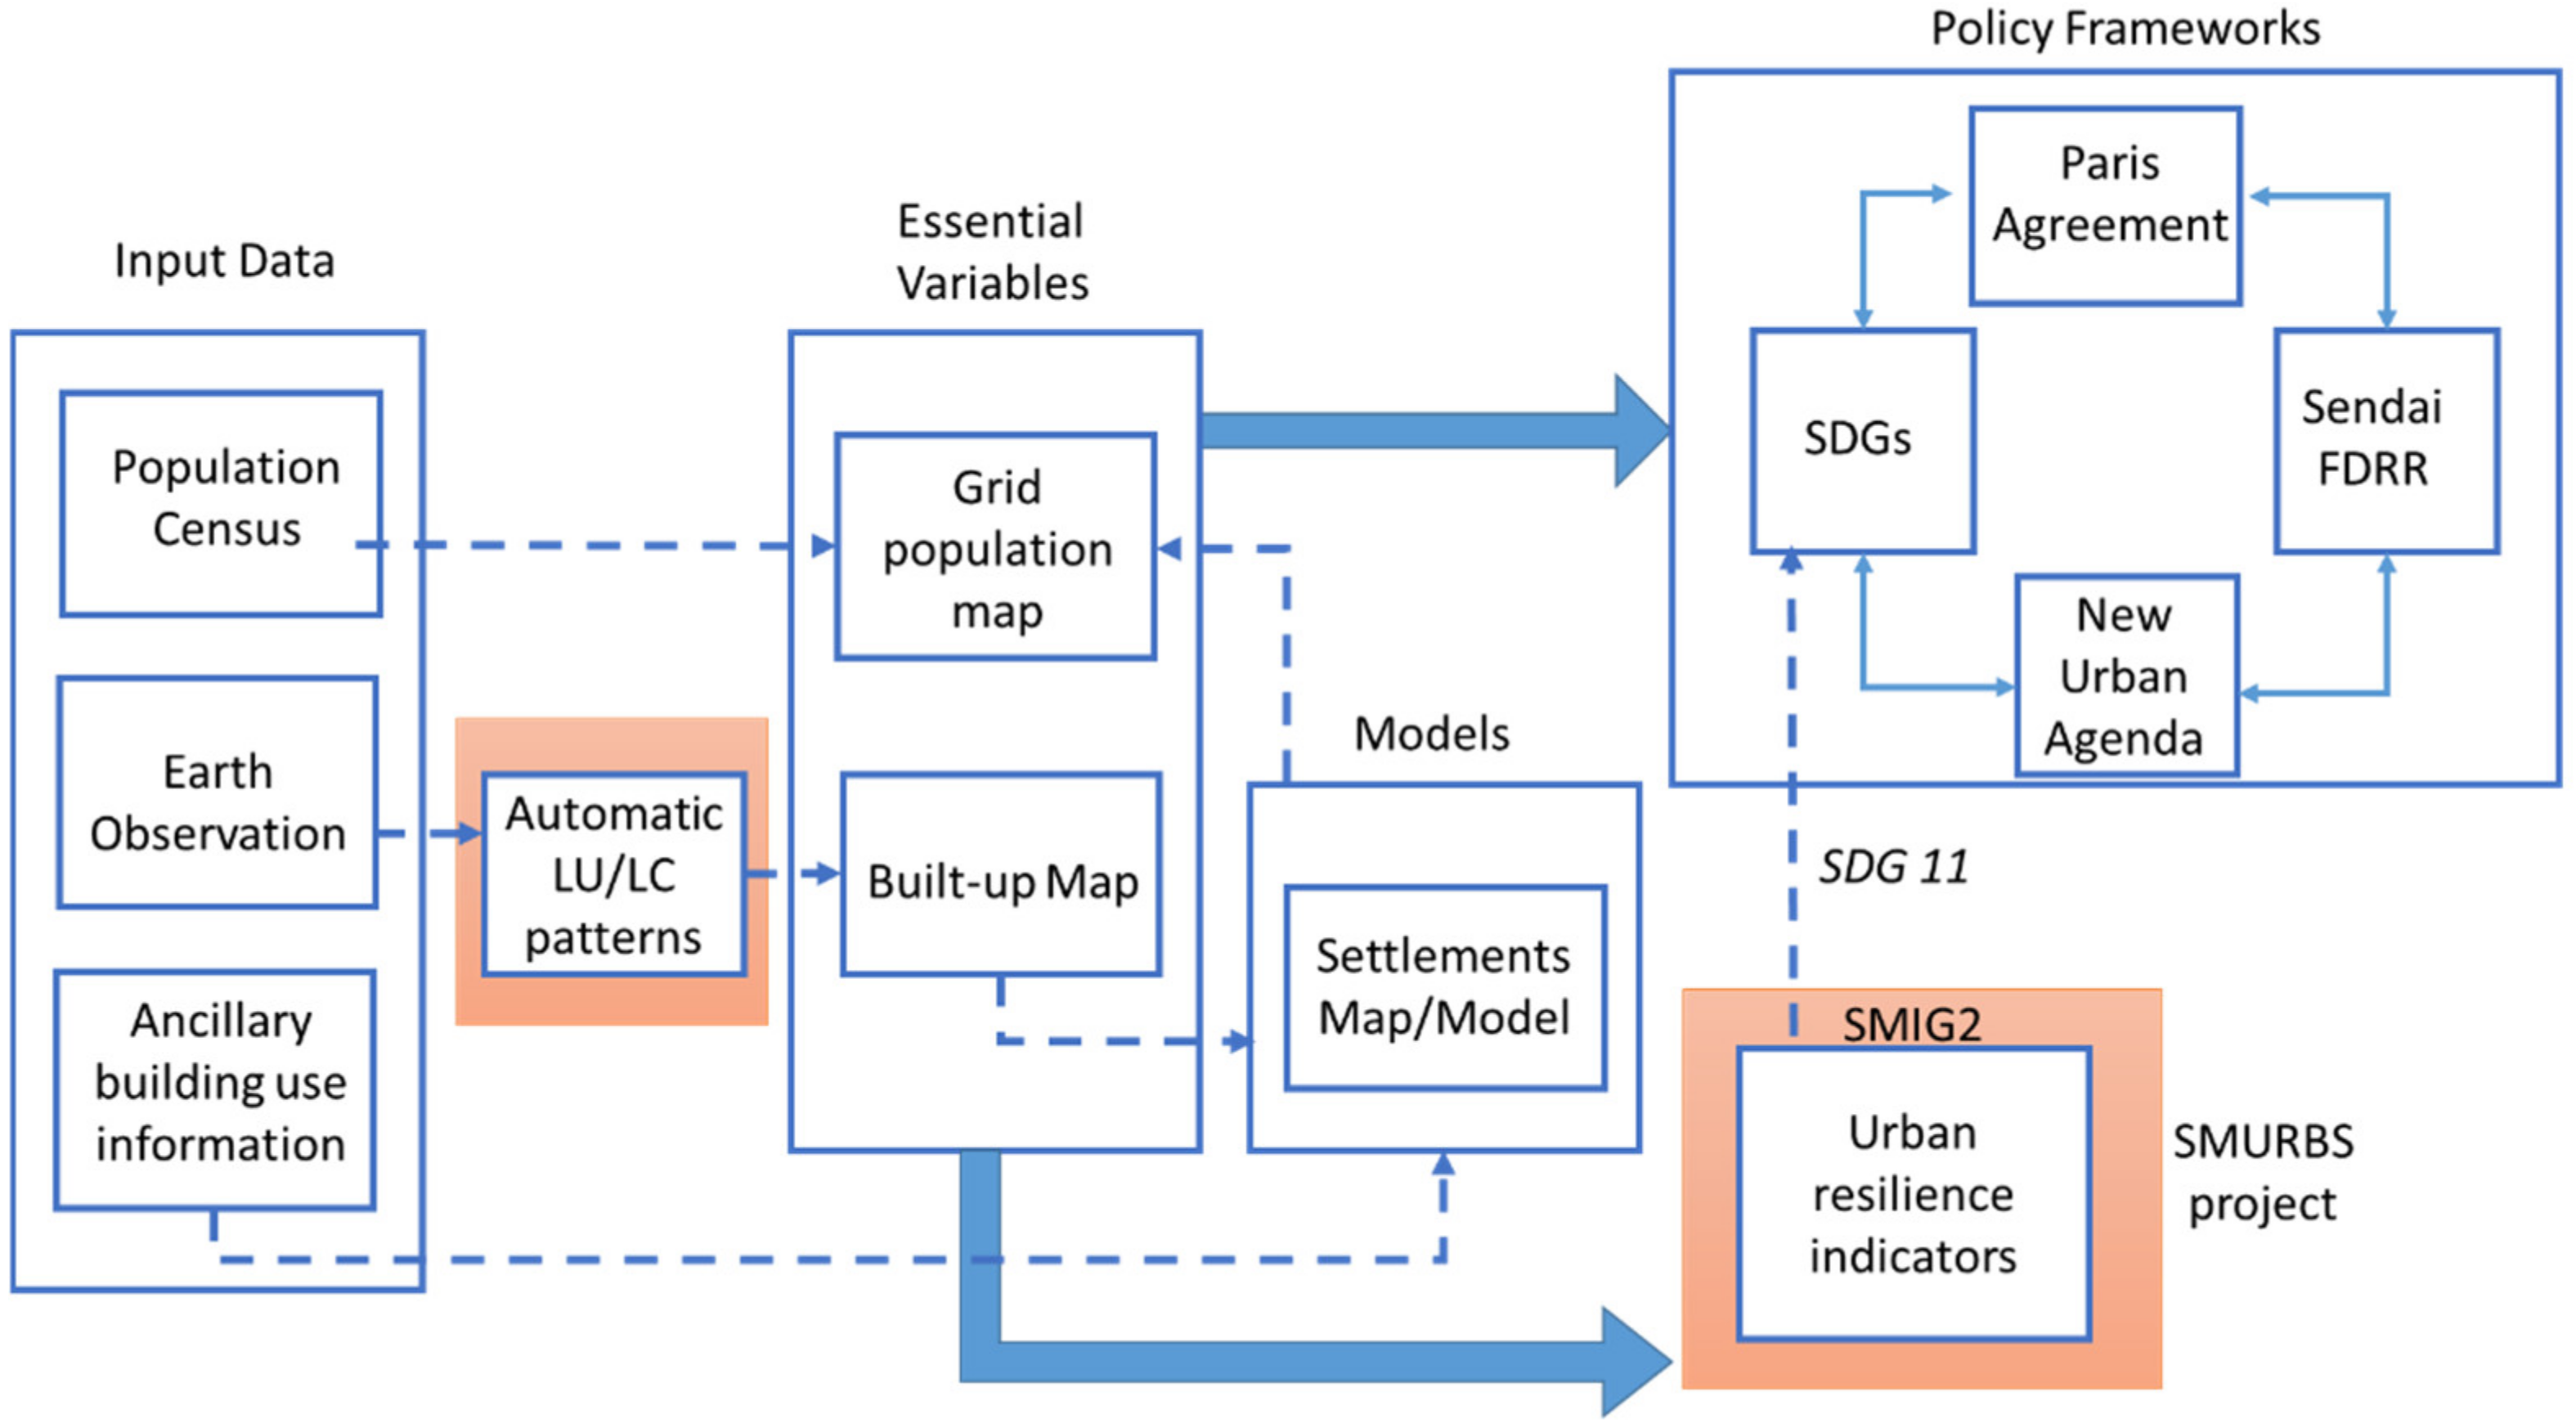
2.4. Conceptualization of SMIG2 Solution

This section describes the list of actions taken to conceptualize the solution on the basis of the users’ needs and existing gaps, gathered through the interaction with local immigration authorities, such as the headquarters of the Hellenic League for Human Rights (HLHR) in Athens (Greece), and the municipalities of Bari and Lampedusa (Italy). A detailed report on the stakeholder’s surveys was provided in the SMURBS deliverable “D2.4—Gap Analysis” [78].
Regarding the Bari case study, a first meeting with the Bari Urban Planning Councilor, Carla Tedesco, took place on 12 December 2018. In 2019 and 2020, several technical meetings with the Departments for Technological Innovation and Demographic Services occurred. In October 2020, a formal collaboration with the staff of the General Director, Davide Pellegrino, was activated.
The dialog with local representatives revealed a scarce awareness of the migrant communities’ growth and the residential segregation phenomenon that is being established in Bari city, in accordance with data from the National Association of Italian Municipalities (ANCI) and ISTAT reports [79,80].
The gaps enhanced from the above preliminary activities allowed us to define the users’ needs, and to translate them into specific aims to be achieved at the end of the project (Table 3).
Subtasks 1 through 5 include preparatory activities, such as a baseline-status analysis of the indicator policy frameworks, and data collection for the case study. Subtasks 6 through 10 were related to the development phase of the solution. Subtask 11 is a horizontal activity alongside the entire duration of the project (approximately 3 years).
According to this recent literature [81], a conceptual model of the SMIG2 solution within the relevant policy frameworks is presented in Figure 2.
The approach adopted for estimating the SDG 11 indicators consists of deriving and updating, with the use of EO data, some essential variables for the urban ecosystem as the spatial distribution and density of the urban population (including a migration component) and settlement maps. By integrating these essential variables with other domain-specific information (i.e., particulate-pollutant maps, public transportation networks, information on inadequate housing in the city neighborhood), specific indicators and sub-indicators were produced (Section 3.4).

3. Results

This section describes the results obtained for each subtask in Table 3, except for ST11, on dissemination activities.

3.1. Regulations for Measuring Indicators within Existing Policy Frameworks

Resilience is the capacity of a city or community to be prepared for responding or adapting to dangerous and disruptive events, such as natural disasters, economic crises, demographic changes, health epidemics, and others [21]. Because resilience is a multidimensional phenomenon, local authorities should design and implement strategies for urban resilience that integrate economic, social, environmental, and institutional aspects. In 2018, within the paper entitled “Indicators for Resilient Cities” [23], the OECD already reported different types of indicators and discussed the contexts that should be considered.
In order to accomplish these recommendations, the SMIG2 solution attempted to create a linkage between the various existing regulatory frameworks with a twofold aim:
(i)
To support local authorities in choosing indicators tailored to their policy priorities;
(ii)
To develop guidelines for the effective use of indicators within a broader governance framework.
In Table 4, some examples of environmental-resilience indicators and their equivalent/closest SDG 11 indicator are presented.
The European ISO 37123:2019 [85] on Sustainable cities and communities—Indicators for resilient cities was considered the official regulatory reference framework in force in Europe.

3.2. Data, Local Layers, and Regulations/Plans in Support of Resilience Targets and Indicators

The spatial distributions of the resident population and settlement layer (i.e., only buildings) were recently recognized as essential societal variables requested for quantifying the SDG 11 indicators [81,86]. The purpose of the SMIG2 solution is to use such variables as input to implement SDG 11.3.1 “Ratio of land consumption rate to population growth rate” indicator (i.e., land-use-efficiency (LUE) indicator). By the integration with other domain-specific information, (e.g., cadastral-data, street-network, air-particle-pollutants, and natural-hazard maps), additional SDG 11 indicators were proposed at the local level for Bari city. In Table 5, the list of selected targets, indicators, and subindicators, and the requested information (both essential and auxiliary data) needed to perform them, are reported.
All relevant information about the territory (i.e., a collection of environmental and ancillary socioeconomic data) was organized in a geographical-information-system environment. The Landscape Protection Plan of Apulian Region (PPTR) [87] was adopted as the main source of data for describing the vulnerabilities and weaknesses in the area of study. Such areas are exposed to flooding hazard. Bari natural-hazard maps were collected through a formal request to the Basin Authorities and Civil Protection Body. Other ancillary data were obtained from the Bari municipality open-data website [88].

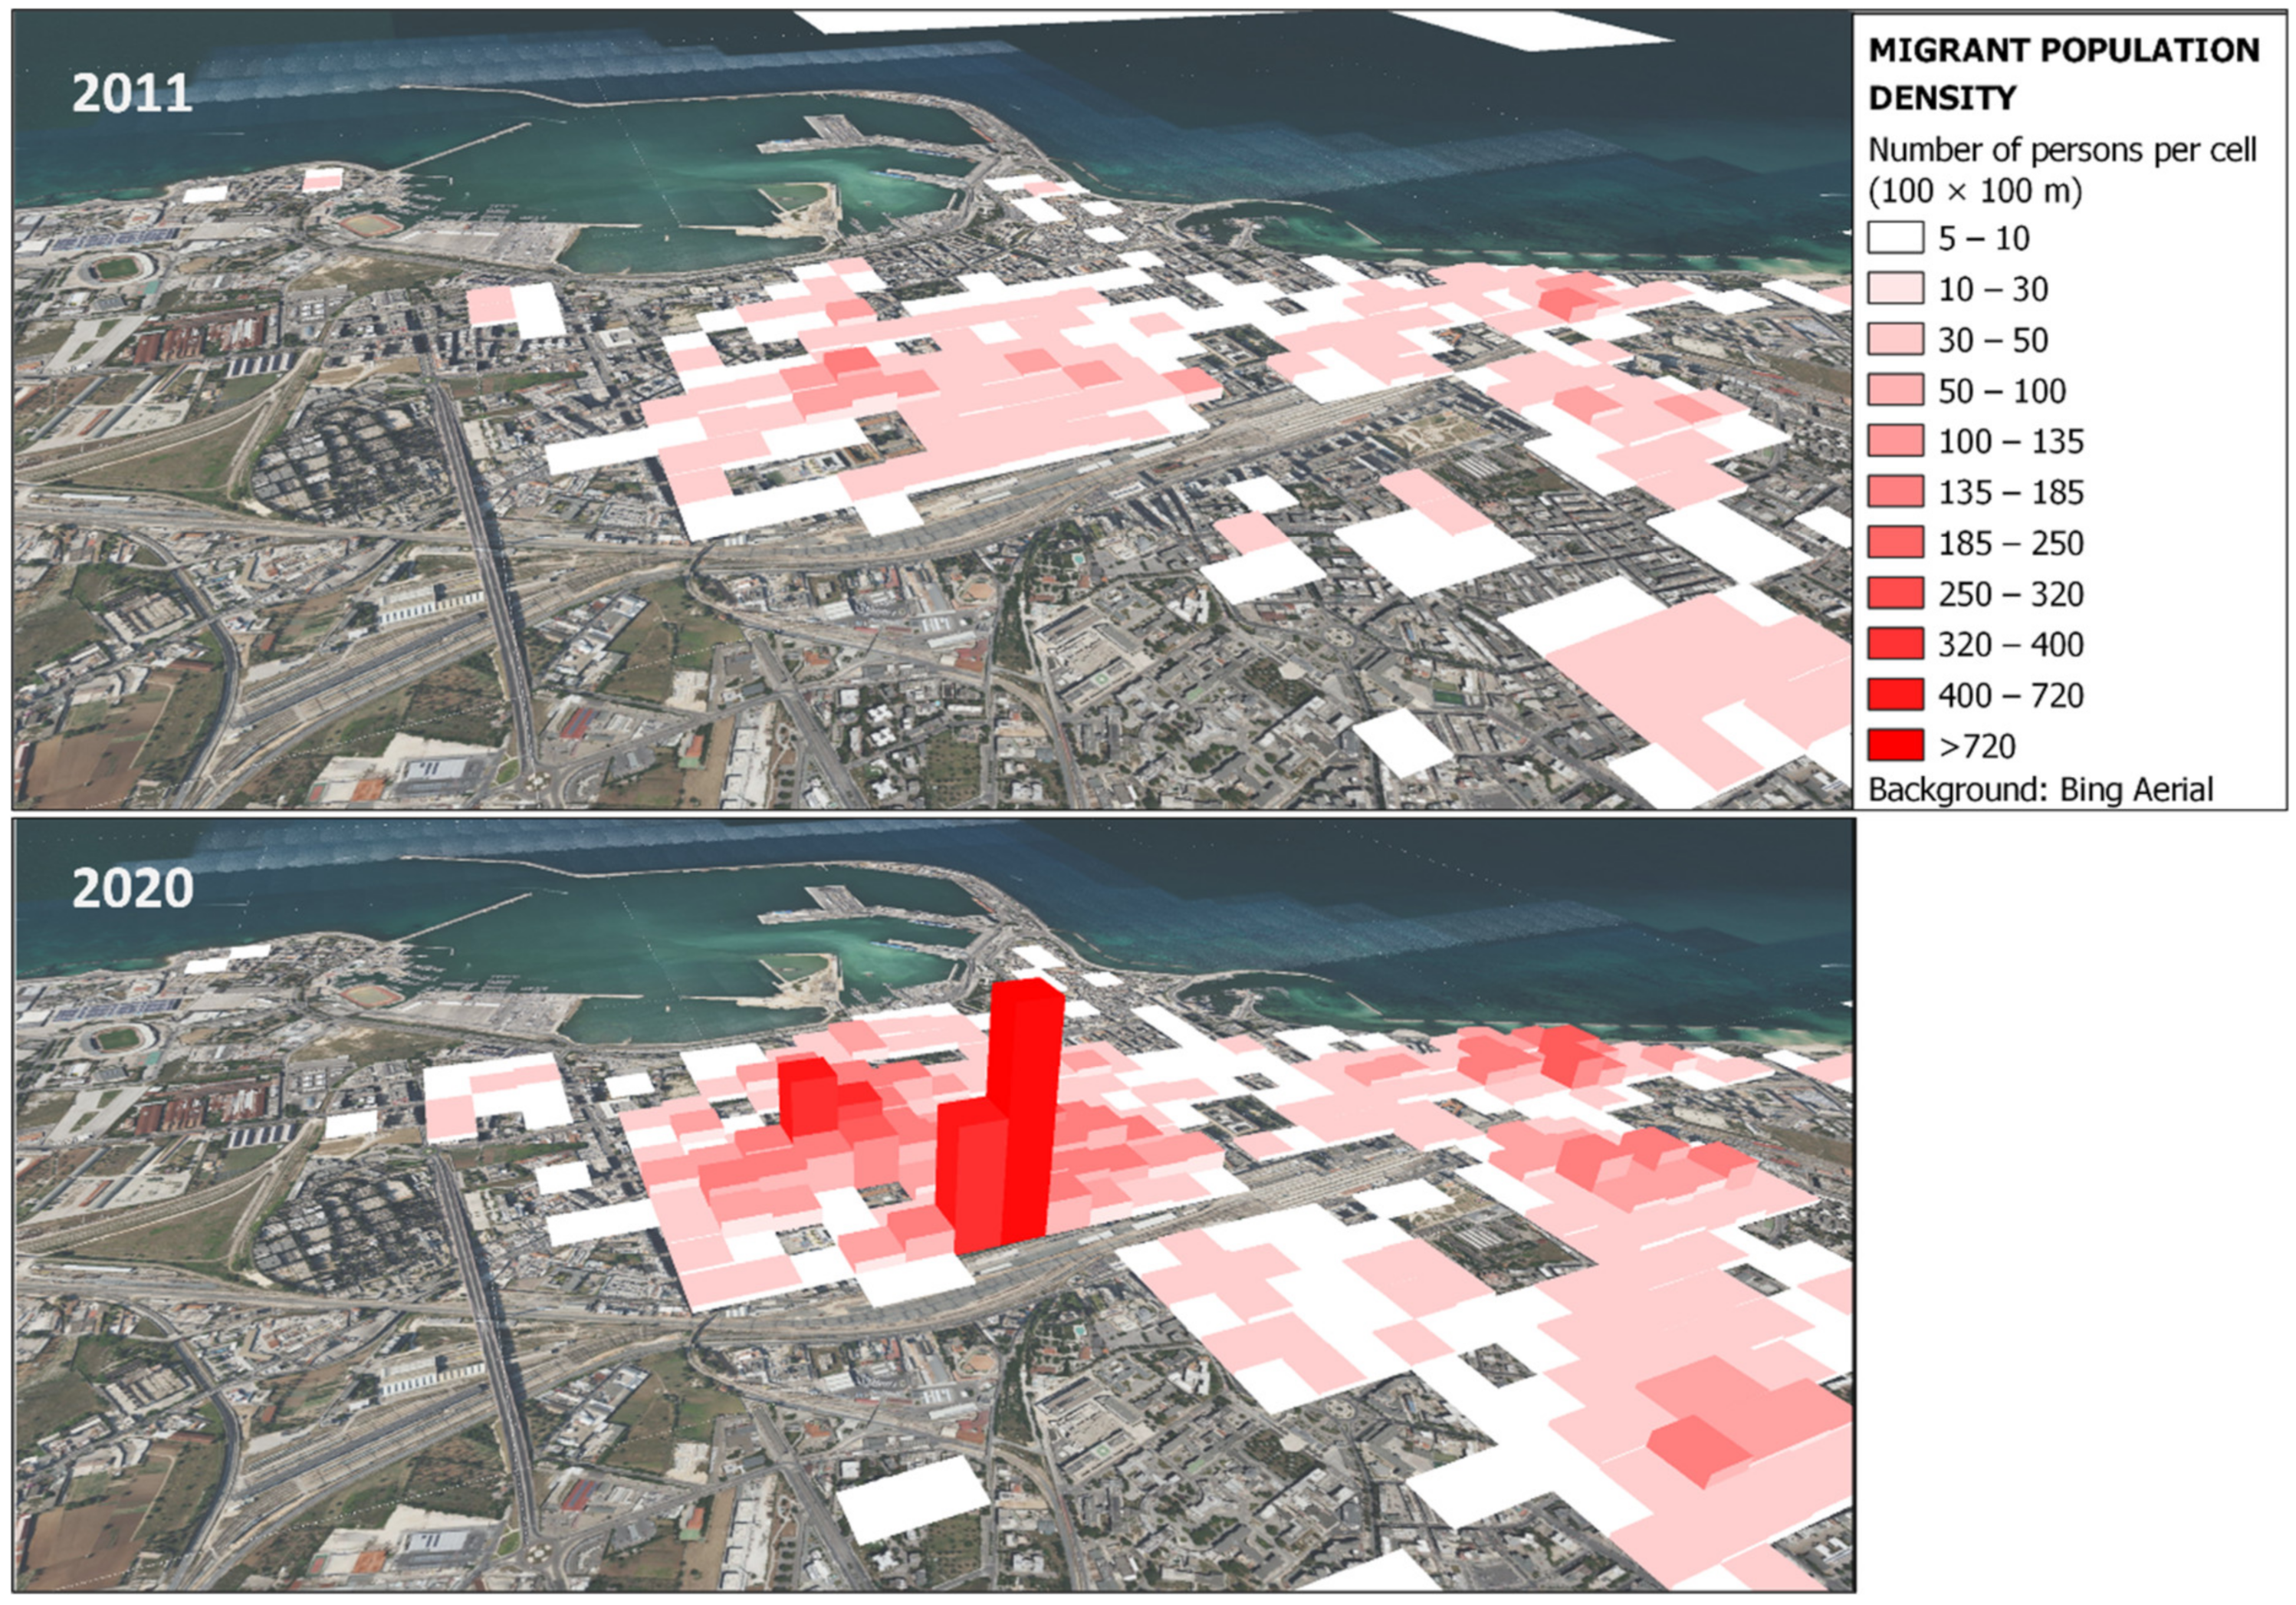
3.3. SMIG2 Land-Dynamics and Population-Flux Mapping

The distribution of fine-scale population data through the use of EO data is increasingly important in the support of the demography and monitoring of human settlements [9]. Thus, the core of the SMIG2 solution purpose was twofold:
(1)
To update the built-up layer and the population density of regular migrants in the city of Bari from 2011 to 2020;
(2)
To implement SDG 11 indicators for both the total and regular migrant populations. Two discrete automatic approaches of land-cover classification from EO satellite data (Sentinel 2) at a 10 m spatial resolution were proposed for obtaining an up-to-date settlement map [29,30]. Such an update can allow us to overcome the time lag that exists between satellite-imagery acquisition and the product validation/delivery of official products. For instance, the latest release of the ESM layer was published in 2019, even though it was extracted from 2015 satellite data. In some cases and areas, this temporal latency cannot satisfy the rapid monitoring requirements of population flows (both migrant and native components).
The proposed dasymetric method (Figure 3), which is available in more versions and implementations [29,30], was designed to compute grid population maps at an intra-urban scale (100 × 100 m). Building-height information, introduced in [29], allows us to distinguish between greater- or lesser-density residential areas. Based on the building height, the built-up area in historical areas, characterized by buildings with a maximum of three floors, were differentiated from modern multifloor buildings and villas/independent houses with from one to two floors. Additional advantages of the dasymetric method proposed in [29] are the configurable weighting factors (depending on the building use) and the flexibility/capability of accepting various types of data and formats in the input. Most of the Open Geospatial Consortium standard formats can be accepted (GeoTiff, Erdas Image, JPEG2000, Shapefile, Geopackage, etc.). These features facilitate the calibration and adaptation of the method to others study areas.
The findings from the EO-data processing—along the application of the dasymetric method [29,30] to the demographic data—provided insights into the spatial distribution of the increased regular migrant population per zone within the study area (Figure 4).
According to the uncertainty-assessment metrics proposed in recent literature [89,90], a high accuracy performance was achieved for the population-density map obtained according to the method proposed in [29], with a low total absolute error (0.9 number of people) and mean absolute error (7 × 10⁻⁴ number of people). This means that the final count of the total persons after the application of the dasymetric method was close to the initial total number of persons. The root mean square error (RMSE) value was about 10−3, whereas the mean absolute percentage error (MAPE) was 8.6% [29].
The outcoming map on the migrant growth rate by continent (Figure 5) in Bari indicated the strengthening of the urban social-segregation process, according to what was evidenced in 2011 [70].
A comprehensive investigation of migrant citizenship revealed the tendency of people sharing a common language, culture, and religion to be aggregated in the same urban district. Migrants from the Asian continent appeared to be dominant in the central area of the city. The most represented countries included Pakistan, Afghanistan, Bangladesh, Georgia, and Iraq. Asiatic communities from China and the Philippines represented minorities in the residential areas of the southeast city. Although less numerous, African communities, mainly from Ghana, Somalia, Nigeria, Senegal, Gambia, Mali, and Eritrea, overlapped with the Asian groups. The non-Italian Europeans came mainly from Albania, Romania, and Bosnia [29].

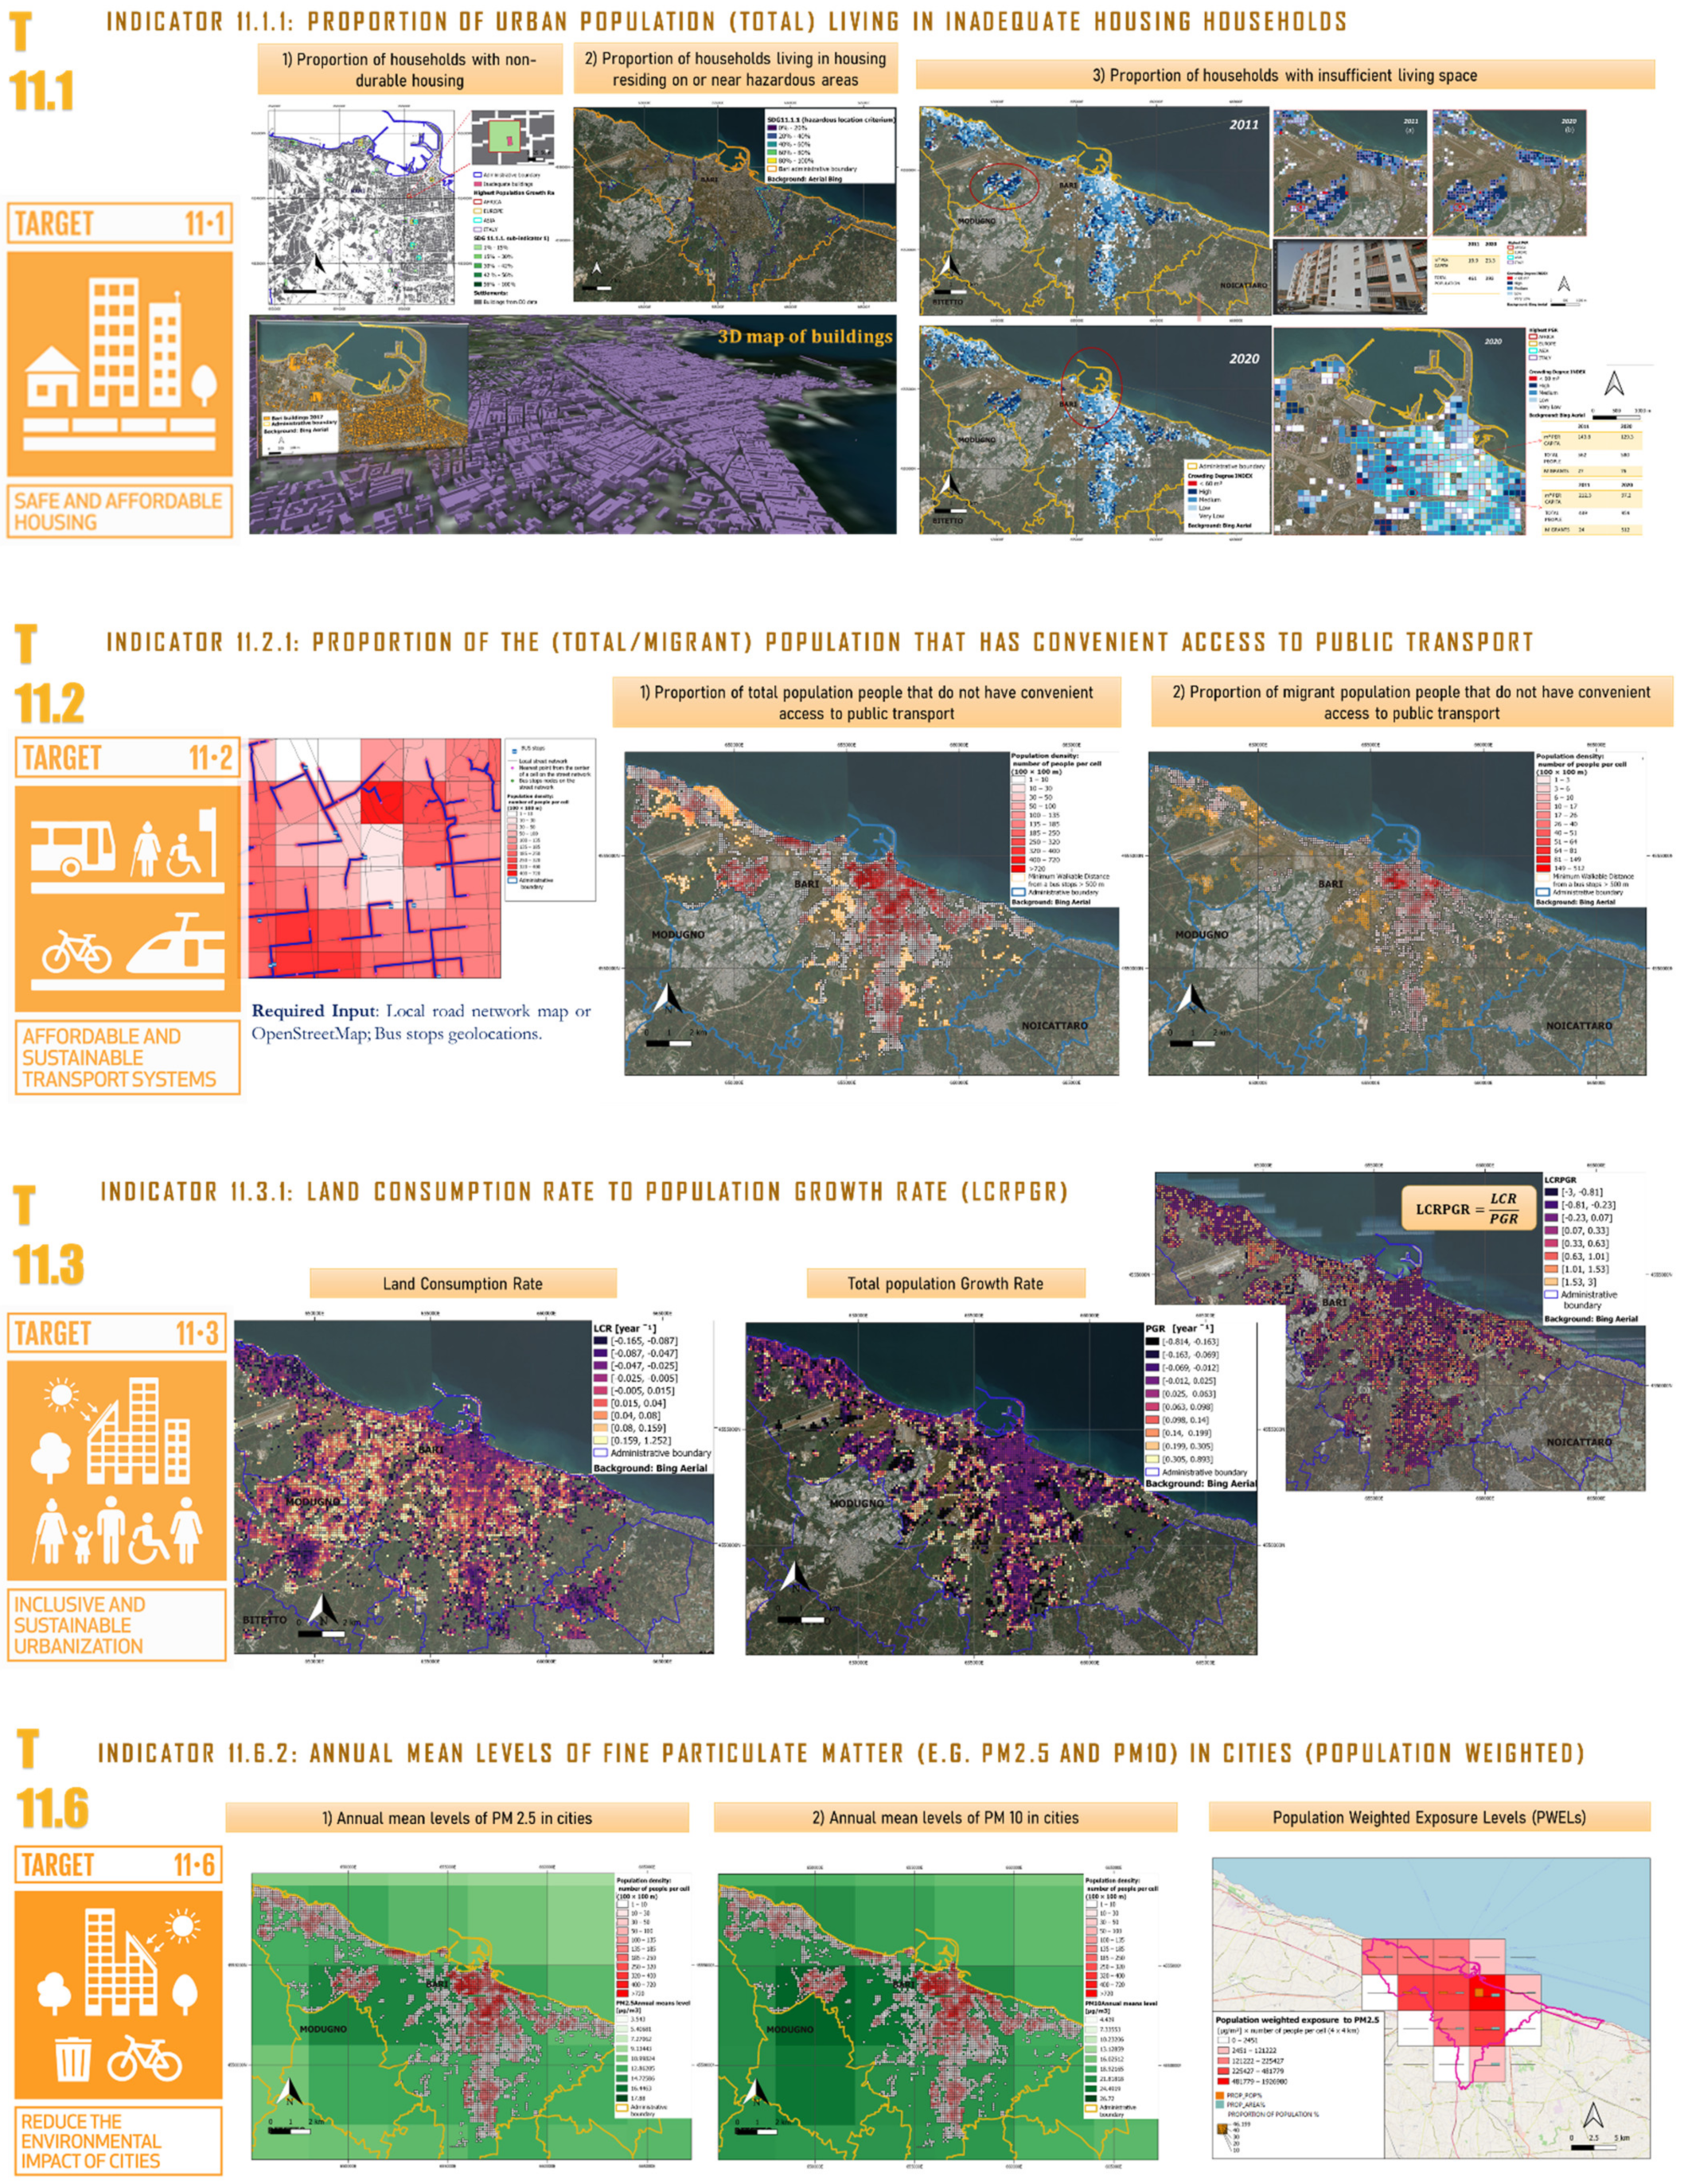
3.4. Urban-Resilience-Indicator Estimates

A complete list of the SDG 11 indicators developed for the case study, along with the metrics, derivatives, and the ancillary data used for measuring them, is provided in [28,29]. In Table 6, a list of all the metrics evaluated on 1 January 2020 for both the total- and migrant-population components is reported.
The knowledge acquired from the spatial visualization of the indicators (Figure 6) can enable a better understanding of the local migration aspects, the planning of adequate services, and improving the living conditions and resilience of both native citizens and migrants.
The project deliverable “D5.4—EO in migration case studies” and [28,29] are open-access documents that provide the methodologies adopted for any subindicators as a guideline to compute them in other geographical areas. A recap of all the used metrics is also provided in the Supplementary Materials.
Regarding the SDG 11.1.1 indicator on affordable housing, many inadequate houses due to structural or sanitary deficiencies, overcrowding, or proximity to areas prone to natural hazards, resulted in the central area of the city, where there are positive growth rates of the regular migrant populations from different continents. Due to the confidentiality constraints, it was impossible to verify whether people were living in the ruined buildings or in the adjacent ones (as each cell may contain both types of buildings). However, such cases should be highlighted by local authorities, as they are relevant to social-inclusion issues. Additionally, such persons, in many cases, are not registered in the official population-data statistics. Referring to the case of Bari, for example, homeless people, as well as numerous irregular migrants, were excluded from the data used in this study. These people may improperly occupy abandoned or decaying buildings, which are present in large numbers in historic districts. This had a direct impact on the estimation of the SDG 11.1.1 indicator, and indirectly affected the estimations for all the indicators. The migrant population living in urban areas, for these reasons, was inevitably underestimated [29].
Focusing on the SDG 11.2.1. indicator, convenient access to public transport appeared to favor the growth of migrant communities in the central areas of the city, as well as in proximity to schools, hospitals, and other essential services.
A comparison of the migrant and native PGRs with respect to the land-consumption rate for the SDG 11.3.1 indicator revealed the tendency of migrants to reuse poorly preserved or ancient buildings nearby or inside the old town. Native residents, instead, appeared to have moved to the newly built residential areas of the suburbs. The settlement patterns of the former appeared more sustainable than those of the latter. This trend is noteworthy for the proper planning of new services for the city in the upcoming years.
Both the total and migrant populations were exposed to the same levels of pollution (SDG 11.6.2. indicator), as the highest annual population exposure levels to PM2.5 and PM10 are in the central area of the city, where about 50 percent of the total number of residents live, including most migrants.

3.5. Reusable Workflows

To facilitate the reproducibility of the results obtained in the SMIG2 pilot city (i.e., Bari, southern Italy), the dasymetric mapping model [29,30] was published using the Virtual Earth Laboratory (VLab) framework [91] in two versions (a basic one, and an advanced one for expert users).
VLab is accessible through a cloud-based platform [92] for sharing and facilitating the invocation of such scientific workflows from urban planners or technical employers of public administration without extensive expertise in the EO domain. VLab implements all the required orchestration functionalities to automate the technical tasks required to execute a model on different computing infrastructures, minimizing the possible interoperability requirements for both model developers and users.
The automatic workflows developed within the SMIG2 solution are based on a processing chain, modeled in the QGIS environment and described in detail in [29]. The code was written in the Python 3.7 programming language by mainly using pyQGIS libraries for Python 3.7. Table 7 shows the main differences between the basic and advanced versions, namely, the Dasy tool, and the links to the respective GitHub repositories.
An experimental plugin for QGIS was also developed as an additional open-source tool for sharing the dasymetric method with QGIS community users, which include urban planners, statisticians, and the technical employees of local and regional authorities. Dasy QGIS Plugin is available at the official repository of QGIS as an experimental plugin [93].

4. Discussion

To assess the achievement of the SMIG2 solution within the SMURBS project, the coherence checklist [94] in Table 8 was used as a tool for evaluating the consistency of the actions carried out in addressing any specific subtask listed in Table 3. Similar tools have been recently proposed as a good practice for the evaluation of plans/projects within the EU’s URBACT program [94], and by the recent Italy’s National Action Plan for Policy Coherence for Sustainable Development [95].
For each objective pursued, Table 8 includes a summary of the findings, a symbolic score classification (the Achievement column), and some additional notes.
All user-related gaps, evidenced in Table 3, were partially or fully filled (the Achievement column, Table 8). The last column (Table 8) includes the references to the inherent results and discussion subsections, and some aspects that need to be further investigated. They will also be discussed hereafter in two separate subsections. Section 4.1 is an integrated analysis of all the remaining issues in the collection of the input data; Section 4.2 considers the limits in the mapping method and the uncertainties, which affect the indicator estimates.

4.1. Data Collection and Harmonization

With regard to the adopted solution recommendations, further efforts need to be made toward improving the quality and consistency of the statistical data on demography at various levels. This point requires a continuous flow of information and data across stakeholder groups and levels for city-level urban planners and national-level statisticians. In order to implement this transfer of knowledge, the following are essential:
  • To facilitate collaboration and mutual learning between local and national organizations;
  • To consider new pathways for linking the local to the national and global entities;
  • To facilitate interactions between the urban context and its surrounding area.
In Italy, the National Registry of Resident Population (ANPR) [96], which should collect and harmonize the demographic data from all the administrative municipalities, is not yet operational, and not all the municipalities have been included. For more than one municipality, no statistical agency provides, for example, graphic data at the intra-urban scale. Furthermore, the data delivered from different demographic offices are highly fragmented and miss a common standardization template. This makes it difficult to analyze the rural–urban-migration component in an urban context wider than a single city, and wider than that in metropolitan areas. The lack of standardization in the aggregation levels, geometries, definitions, as well as confidentiality requirements are common in Italy, as well as in other European countries.
The local dimension of the SMIG2 solution requires the need to acquire auxiliary input data by turning to local providers. However, these data are often not up to date or presented in the same format. This may require time-consuming data preprocessing or can impact the final accuracy values. Currently, the diffusion of open databases serves as a promising prelude to the acquisition of data with the same information content, although in different formats, for other cities or geographical realities [29].

4.2. Lessons Learned and Recommendations for Future Studies

The mapping approach for tracking changes in population data and land, illustrated in [29,30] and synthesized in Section 3.3, has the advantage of being suitable for measuring indicators at an intra-urban scale, whereas the current literature is geared toward providing national- or global-scale indicators [77,86,97,98,99]. Such indicators enable the study of the local aspects of migration in a bottom-up logic that could effectively achieve global policy objectives.
The automatic tools developed, described in Section 3.5, were designed to be flexible to a wide variety of formats and geographic-coordinate reference systems as input, and to be fine-tuned to best suit the study area (the correction factors adopted for the building-use weights are customizable). This could be especially helpful in areas with a lack of well-structured and standardized data, and in situations when time is an important factor for both the gathering of more reliable and verified data, as well as its processing. This is especially true for localities facing the Mediterranean Sea, which are experiencing intensive migration flows.
New updated datasets, such as the GHS-composite dataset released in 2020 by the JRC (for the years 2017–2018) [52,53], at a 10 m spatial resolution, could be considered in future studies as input for testing the dasymetric method proposed in [29,30] on a larger scale.
In order to counteract the local phenomenon of residential segregation, the framework of indicators, produced within the scope of this study (see Figure 6 and Table 6), can provide valuable indications on which areas are most suitable for the short- and long-term accommodation of migrants in the future. However, such a list is not exhaustive and does not consider, for instance, indicators related to the SDG 11.5 and SDG 11.7 targets. The former aims to estimate people exposed to natural hazards, while the latter assesses people who lack access to open spaces in cities.
Nevertheless, further improvements are needed to improve the accuracy of the indicators. According to the authors of [100,101], there are inherent uncertainties in population estimates that are difficult to eliminate. A recent study on SDG 15.2, which has developed metrics to measure the number of people impacted by natural disasters [102], considers crucial the accuracy’s evaluation of the grid population map in estimating the exposure terms of the risk equations and inherent indicators.
Regarding the Bari case study, as an example, homeless people and numerous irregular migrants were not included in the regular statistics. This discrepancy has a direct impact on the estimation of all the population-weighted SDG 11 indicators [29]. Concerning EO, free very high spatial resolution (VHR) satellite data are required for management authorities and researchers. However, the acquisition of such data is available on demand and is costly. Based on the analysis of the state of the art, VHR data combined with light detection and ranging (LiDAR) data can introduce significant improvements in the automatic mapping of the urban environment. Such data can discriminate artificial structures, such as multistory buildings, villas, rural buildings, and slums, and can quantify their heights. Height information can improve estimates [29] for the three-dimensional modeling of urban areas, with accurate results in the population-density-map estimates and population-weighted SDG 11-indicator measurements.

5. Conclusions

The results achieved from the SMIG2 solution, “Urban resilience indicators and suitability maps for short- and long-term host areas”, within the SMURBS project, have provided useful information on the current situation of the regular migrants who live in Bari (southern Italy). The analysis of migrant citizenship revealed the tendency of people sharing a common language, culture, and religion to be aggregated in the same urban district.
The linkage between EO data and inclusiveness policies for cities that was articulated in the context of the SDG 11 indicators, and the dasymetric methods to generate a map of the population density and distribution on a 100 m × 100 m grid, developed over the project lifetime [29,30], were useful in establishing a fairly comprehensive framework of the urban resilience indicators.
Such acquired knowledge could be helpful to:
  • Identify those areas to be carefully monitored as affected by degradation or security problems;
  • Identify the general criteria used by the migrant population to choose the areas for settlement.
The findings can also allow us to understand what type of migration fluxes should be expected in the future, and how the growth/sprawl type of city is changing over time, as well as which land-planning decisions could drive this change. However, further studies need to be carried out to identify the most suitable areas to host migrants, and particularly in the long term.
To effectively support policymakers in future choices, additional research efforts, focusing on predictive modeling and scenario analyses on population and preferential settling areas, should be encouraged at the local level, as well as at the global scale.
The porting of the Dasymetric v2.0 method (in support of the SMIG2 solution) on the Virtual Laboratory platform [92] can allow the reproducibility of fine-grid population maps for all cities with freely available intra-urban demographic statistics data. Further datasets for Reggio Calabria city (southern Italy) and Bologna city (northern Italy) were collected to be processed. They will be considered for further studies to be conducted within the new e-SHAPE project (https://e-shape.eu/, accessed on 13 July 2022), as the SMURBS legacy. The implementation of additional workflows for the implementation of the SDG 11 resilience indicators at the local/regional level is already ongoing within e-SHAPE. Specifically, the e-SHAPE Health showcase focuses on the human exposure (per different population groups) to the air-pollution-related risks profiled in the urban environment.

Supplementary Materials

The following supporting information can be downloaded at: https://www.mdpi.com/article/10.3390/rs14174295/s1, File S1: Metrics for Indicators [29,36,82,83,84,103].

Author Contributions

Conceptualization, M.A. (Mariella Aquilino) and P.B.; methodology, M.A. (Mariella Aquilino); software, M.A. (Mariella Aquilino); validation, M.A. (Mariella Aquilino); formal analysis, M.A. (Mariella Aquilino), C.T. and M.A. (Maria Adamo); investigation, M.A. (Mariella Aquilino), C.T. and G.Q.; resources, M.A. (Mariella Aquilino) and S.F.; data curation, M.A. (Mariella Aquilino); writing—original draft preparation, M.A. (Mariella Aquilino), P.B., G.Q. and S.F.; writing—review and editing, M.A. (Mariella Aquilino), P.B., M.A. (Maria Adamo), E.A., E.G. and C.T.; visualization, C.T. and M.A. (Mariella Aquilino); supervision, M.A. (Maria Adamo); project administration, M.A. (Maria Adamo); funding acquisition, P.B. All authors have read and agreed to the published version of the manuscript.

Funding

The work was funded by the Horizon 2020 E-SHAPE project—EuroGEO Showcases: Applications Powered by Europe (www.e-shape.eu, accessed on 1 July 2022), Grant Agreement: 820852 and by the project SMURBS—SMart URBan Solutions for air quality, disasters and city growth (www.smurbs.eu accessed on 4 December 2018) funded by the European Commission in the framework of program “The European network for observing our changing planet (ERA-PLANET)”, Grant Agreement: 689443.

Data Availability Statement

Data sharing not yet available.

Acknowledgments

The authors are grateful to the following institutions for their valuable support: Demographic Services and Information Technology Offices of Bari municipality, “Autorità di bacino distrettuale dell’Appennino Meridionale”, and Regional Agency of Environmental Protection (ARPA Puglia).

Conflicts of Interest

The authors declare no conflict of interest. The funders had no role in the design of the study; in the collection, analyses, or interpretation of data; in the writing of the manuscript, or in the decision to publish the results.

References

  1. United Nations Framework Convention on Climate Change (UNFCCC). Paris Agreement. 2016. Available online: https://unfccc.int/sites/default/files/resource/parisagreement_publication.pdf (accessed on 10 July 2022).
  2. European Parliament Resolution of 3 June 2015 on Sendai Framework for Disaster Risk Reduction 2015–2030 (2020/2116(INI)). Available online: https://www.preventionweb.net/files/resolutions/N1516716.pdf (accessed on 10 July 2022).
  3. United Nations Department of Economic and Social Affairs (UNDESA), Population Division. World Population Prospects 2018: Press Release. Available online: https://population.un.org/wpp/Publications/Files/WPP2017_KeyFindings.pdf (accessed on 10 July 2022).
  4. UNHCR. UNHCR Global Trends–Forced Displacement in 2020. Available online: https://www.unhcr.org/60b638e37/unhcr-global-trends-2020 (accessed on 10 July 2022).
  5. United Nations General Assembly (UNGA). Transforming Our World: The 2030 Agenda for Sustainable Development; United Nations: New York, NY, USA. 2015. Available online: https://www.un.org/sustainabledevelopment/sustainable-development-goals/ (accessed on 10 July 2022).
  6. UN Habitat. New Urban Agenda. United Nations Conference on Housing and Sustainable Urban Development (Habitat III) in Quito, Ecuador, on 20 October 2016. Available online: https://unhabitat.org/sites/default/files/2020/12/nua_handbook_14dec2020_2.pdf (accessed on 10 July 2022).
  7. International Organization for Migration (IOM); Joint Migration and Development Initiative (JMDI). White Paper: Mainstreaming Migration into Local Development Planning and Beyond; International Organization for Migration: Geneva, Switzerland, 2015. [Google Scholar]
  8. European Parliament Resolution of 19 May 2021 on Human Rights Protection and the EU External Migration Policy (2020/2116(INI)). Available online: https://www.europarl.europa.eu/doceo/document/TA-9-2021-0242_EN.html (accessed on 10 July 2022).
  9. Gaughan, A.E.; Stevens, F.R.; Linard, C.; Patel, N.N.; Tatem, A.J. Exploring Nationally and Regionally Defined Models for Large Area Population Mapping. Int. J. Digit. Earth 2015, 8, 989–1006. [Google Scholar] [CrossRef]
  10. Freire, S.; Schiavina, M.; Florczyk, A.J.; MacManus, K.; Pesaresi, M.; Corbane, C.; Borkovska, O.; Mills, J.; Pistolesi, L.; Squires, J.; et al. Enhanced Data and Methods for Improving Open and Free Global Population Grids: Putting ‘Leaving No One behind’ into Practice. Int. J. Digit. Earth 2020, 13, 61–77. [Google Scholar] [CrossRef]
  11. Hagenlocher, M.; Lang, S.; Tiede, D. Integrated Assessment of the Environmental Impact of an IDP Camp in Sudan Based on Very High Resolution Multi-Temporal Satellite Imagery. Remote Sens. Environ. 2012, 126, 27–38. [Google Scholar] [CrossRef]
  12. Kranz, O.; Sachs, A.; Lang, S. Assessment of Environmental Changes Induced by Internally Displaced Person (IDP) Camps in the Darfur Region, Sudan, Based on Multitemporal MODIS Data. Int. J. Remote Sens. 2015, 36, 190–210. [Google Scholar] [CrossRef]
  13. Lang, S.; Füreder, P.; Riedler, B.; Wendt, L.; Braun, A.; Tiede, D.; Schoepfer, E.; Zeil, P.; Spröhnle, K.; Kulessa, K.; et al. Earth Observation Tools and Services to Increase the Effectiveness of Humanitarian Assistance. Eur. J. Remote Sens. 2020, 53, 67–85. [Google Scholar] [CrossRef]
  14. Leyk, S.; Gaughan, A.E.; Adamo, S.B.; de Sherbinin, A.; Balk, D.; Freire, S.; Rose, A.; Stevens, F.R.; Blankespoor, B.; Frye, C.; et al. The Spatial Allocation of Population: A Review of Large-Scale Gridded Population Data Products and Their Fitness for Use. Earth Syst. Sci. Data 2019, 11, 1385–1409. [Google Scholar] [CrossRef]
  15. Friedrich, H.K.; Van Den Hoek, J. Breaking Ground: Automated Disturbance Detection with Landsat Time Series Captures Rapid Refugee Settlement Establishment and Growth in North Uganda. Comput. Environ. Urban Syst. 2020, 82, 101499. [Google Scholar] [CrossRef]
  16. Van Den Hoek, J.; Ballasiotes, A.D.; Friedrich, H. The Geography of Exclusion: Assessing Refugee Settlement Presence across Global Remote Sensing-Derived Settlement Datasets. In Proceedings of the AGU Fall Meeting, San Francisco, CA, USA, 9–13 December 2019; Volume 2019, p. IN51G-0726. [Google Scholar]
  17. Braun, A.; Fakhri, F.; Hochschild, V. Refugee Camp Monitoring and Environmental Change Assessment of Kutupalong, Bangladesh, Based on Radar Imagery of Sentinel-1 and ALOS-2. Remote Sens. 2019, 11, 2047. [Google Scholar] [CrossRef]
  18. Kemper, T.; Heinzel, J. 10 Mapping and Monitoring of Refugees and Internally Displaced People Using EO Data. In Global Urban Monitoring and Assessment through Earth Observation; CRC Press: Boca Raton, FL, USA, 2014; p. 195. [Google Scholar]
  19. Copernicus Emergency Management Service-Mapping. Available online: https://emergency.copernicus.eu/mapping/#zoom=2&lat=16.54693&lon=10.87901&layers=0BT00 (accessed on 10 July 2022).
  20. OECD Web Portal. Better Policies for Better Life. Available online: https://www.oecd.org/ (accessed on 4 July 2022).
  21. Figueiredo, L.; Honiden, T.; Schumann, A. Indicators for Resilient Cities. In OECD Regional Development Working Papers; OECD Publishing: Berlin, Germany, 2018; Volume 2018. [Google Scholar]
  22. Tsinganos, K.; Gerasopoulos, E.; Keramitsoglou, I.; Pirrone, N. The ERA-PLANET Team ERA-PLANET, a European Network for Observing Our Changing Planet. Sustainability 2017, 9, 1040. [Google Scholar] [CrossRef]
  23. Gerasopoulos, E.; Bailey, J.; Athanasopoulou, E.; Speyer, O.; Kocman, D.; Raudner, A.; Tsouni, A.; Kontoes, H.; Johansson, C.; Georgiadis, C.; et al. Earth Observation: An Integral Part of a Smart and Sustainable City. Environ. Sci. Policy 2022, 132, 296–307. [Google Scholar] [CrossRef]
  24. Razmjoo, A.; Gandomi, A.; Mahlooji, M.; Astiaso Garcia, D.; Mirjalili, S.; Rezvani, A.; Ahmadzadeh, S.; Memon, S. An Investigation of the Policies and Crucial Sectors of Smart Cities Based on IoT Application. Appl. Sci. 2022, 12, 2672. [Google Scholar] [CrossRef]
  25. Razmjoo, A.; Østergaard, P.A.; Denaï, M.; Nezhad, M.M.; Mirjalili, S. Effective Policies to Overcome Barriers in the Development of Smart Cities. Energy Res. Soc. Sci. 2021, 79, 102175. [Google Scholar] [CrossRef]
  26. Razmjoo, A.A.; Sumper, A. Investigating Energy Sustainability Indicators for Developing Countries. Int. J. Sustain. Energy Plan. Manag. 2019, 21, 59–76. [Google Scholar] [CrossRef]
  27. Razmjoo, A.; Sumper, A.; Davarpanah, A. Energy Sustainability Analysis Based on SDGs for Developing Countries. Energy Sources Part A Recovery Util. Environ. Eff. 2020, 42, 1041–1056. [Google Scholar] [CrossRef]
  28. SMURBS-ERA PLANET. Deliverable D5.4–EO in Migration Case Studies. Available online: https://drive.google.com/file/d/18YCUpXyoEoeXDrh6juhG2Gn80zXxyeZ4/view (accessed on 11 July 2022).
  29. Aquilino, M.; Adamo, M.; Blonda, P.; Barbanente, A.; Tarantino, C. Improvement of a Dasymetric Method for Implementing Sustainable Development Goal 11 Indicators at an Intra-Urban Scale. Remote Sens. 2021, 13, 2835. [Google Scholar] [CrossRef]
  30. Aquilino, M.; Tarantino, C.; Adamo, M.; Barbanente, A.; Blonda, P. Earth Observation for the Implementation of Sustainable Development Goal 11 Indicators at Local Scale: Monitoring of the Migrant Population Distribution. Remote Sens. 2020, 12, 950. [Google Scholar] [CrossRef]
  31. Copernicus Land Monitoring Services (CLMS). Available online: https://land.copernicus.eu/ (accessed on 28 June 2022).
  32. SMURBS-ERA PLANET. Deliverable D2.3–Policy and Legal Framework. Available online: https://drive.google.com/file/d/1K3nhu4qljOI-w_IUj9vic_UpVnfnTUFu/view (accessed on 11 July 2022).
  33. Repubblica Italiana. Ministero del Lavoro e delle Politiche Sociali. La Presenza Dei Migranti Nella Città Metropolitana Di Bari. Available online: https://www.lavoro.gov.it (accessed on 20 June 2022).
  34. SMURBS-ERA PLANET. Deliverable D3.6 EO-Platform Synergies. Available online: https://drive.google.com/file/d/1Iw3QJ3Zs4XkZLbi0yaLfR5C1wWnrW1jr/view (accessed on 11 July 2022).
  35. USGS Portal. Available online: https://earthexplorer.usgs.gov/ (accessed on 9 May 2018).
  36. QGIS.org. QGIS Geographic Information System. QGIS Association. 2022. Available online: http://www.qgis.org (accessed on 15 June 2022).
  37. European Commission (EC). A European Agenda on Migration. Available online: https://eur-lex.europa.eu/legal-content/EN/TXT/PDF/?uri=CELEX:52015DC0240&from=EN (accessed on 13 July 2022).
  38. European Parliament and the Council. Regulation of the European Parliament and of the Council Amending Regulation (EC) No 862/2007 of the European Parliament and of the Council on Community Statistics on Migration and International Protection. Available online: https://eur-lex.europa.eu/legal-content/EN/TXT/PDF/?uri=CELEX:02007R0862-20210701&from=EN (accessed on 11 July 2022).
  39. United Nations General Assembly (UNGA). Resolution N. 71/1 “New York Declaration for Refugees and Migrants”. Available online: https://www.un.org/en/development/desa/population/migration/generalassembly/docs/globalcompact/A_RES_71_1.pdf (accessed on 11 July 2022).
  40. United Nations General Assembly (UNGA). Resolution N. 73/195 “Global Compact for Safe, Orderly and Regular Migration”. Available online: https://www.un.org/en/development/desa/population/migration/generalassembly/docs/globalcompact/A_RES_73_195.pdf (accessed on 13 July 2022).
  41. Repubblica Italiana. Decreto Legislativo 18 Agosto 2015 n. 142. Available online: https://www.normattiva.it/uri-res/N2Ls?urn:nir:stato:decreto.legislativo:2015;142 (accessed on 30 June 2022).
  42. European Commission. EU Action Plan on Integration and Inclusion (2021-2027). Available online: https://eur-lex.europa.eu/legal-content/EN/TXT/PDF/?uri=CELEX:52020DC0758&from=EN (accessed on 13 July 2022).
  43. European Parliament and the Council. Directive 2013/32/EU of the European Parliament and of the Council of 26 June 2013 on Common Procedures for Granting and Withdrawing International Protection. Available online: https://eur-lex.europa.eu/legal-content/EN/TXT/PDF/?uri=CELEX:32013L0032&from=en (accessed on 9 July 2022).
  44. European Parliament and the Council. Directive 2013/33/EU of the European Parliament and of the Council of 26 June 2013 Laying down Standards for the Reception of Applicants for International Protection (Recast). Available online: https://eur-lex.europa.eu/legal-content/EN/TXT/PDF/?uri=CELEX:32013L0033&from=EN (accessed on 9 July 2022).
  45. Repubblica Italiana. Legge Del 18 Dicembre 2020 n.173. Available online: https://www.gazzettaufficiale.it/eli/id/2020/12/19/20G00195/sg (accessed on 13 July 2022).
  46. Repubblica Italiana. Ministero dell’Interno. Sistema Di Accoglienza e Integrazione. Available online: https://www.retesai.it/ (accessed on 11 July 2022).
  47. European Commission (EC). Knowledge Center on Migration and Demography. Available online: https://knowledge4policy.ec.europa.eu/migration-demography_en (accessed on 13 July 2022).
  48. EC. INSPIRE Interactive Data Specification Portal: Building Definition. Available online: https://inspire-regadmin.jrc.ec.europa.eu/dataspecification/SearchResults.action?search=building&selectedObjectTypes=all (accessed on 31 May 2022).
  49. EC; Joint Research Center (JRC). ESM Validation Report. Available online: https://land.copernicus.eu/user-corner/technical-library/theeuropean-settlement-map-validation-report/view (accessed on 9 July 2017).
  50. Copernicus Land Monitoring Services (CLMS). European Settlement Map (ESM). Available online: https://land.copernicus.eu/pan-european/GHSL/european-settlement-map (accessed on 20 January 2022).
  51. Florczyk, A.J.; Corbane, C.; Ehrlich, D.; Freire, S.; Kemper, T.; Maffenini, L.; Melchiorri, M.; Pesaresi, M.; Politis, P.; Schiavina, M.; et al. GHSL Data Package 2019. Luxemb. EUR 2019, 29788, 290498. [Google Scholar]
  52. Corbane, C.; Politis, P. GHS-Composite-S2 R2020A-Sentinel-2 Global Pixel Based Image Composite from L1C Data for the Period 2017-2018; European Commission: Brussels, Belgium; Joint Research Centre: Brussels, Belgium, 2020. [Google Scholar]
  53. Corbane, C.; Politis, P.; Kempeneers, P.; Simonetti, D.; Soille, P.; Burger, A.; Pesaresi, M.; Sabo, F.; Syrris, V.; Kemper, T. A Global Cloud Free Pixel- Based Image Composite from Sentinel-2 Data. Data Brief 2020, 31, 105737. [Google Scholar] [CrossRef]
  54. Copernicus Land Monitoring Services (CLMS). Urban Atlas (UA). Available online: https://land.copernicus.eu/local/urban-atlas (accessed on 20 January 2022).
  55. German Aerospace Center (DLR). Global Urban Footprint (GUF)-TSX/TDX-Global. 2016. Available online: https://www.dlr.de/eoc/en/desktopdefault.aspx/tabid-9628/16557_read-40454/Slovenia (accessed on 13 July 2022).
  56. Marconcini, M.; Metz-Marconcini, A.; Üreyen, S.; Palacios-Lopez, D.; Hanke, W.; Bachofer, F.; Zeidler, J.; Esch, T.; Gorelick, N.; Kakarla, A.; et al. Outlining Where Humans Live, the World Settlement Footprint 2015. Sci. Data 2020, 7, 242. [Google Scholar] [CrossRef]
  57. OECD. International Migration Outlook 2011, In International Migration Outlook; OECD: Paris, France, 2011; ISBN 978-92-64-11260-5. [Google Scholar]
  58. Center For International Earth Science Information Network (CIESIN). Columbia University Gridded Population of the World, Version 4 (GPWv4): Population Count Adjusted to Match 2015 Revision of UN WPP Country Totals; Revision 11; NASA Socioeconomic Data and Applications Center (SEDAC): New York, NY, USA, 2018.
  59. Freire, S.; Pesaresi, M. GHS Population Grid, Derived from GPW4, Multitemporal (1975, 1990, 2000, 2015); European Commission: Brussels, Belgium; Joint Research Centre (JRC): Brussels, Belgium, 2015. [Google Scholar]
  60. WorldPop (School of Geography and Environmental Science, University of Southampton; Department of Geography and Geosciences, University of Louisville; Departement de Geographie, Universite de Namur); Center for International Earth Science Information Network (CIESIN), Columbia University. Global High Resolution Population Denominators Project-Funded by The Bill and Melinda Gates Foundation (OPP1134076). 2018. Available online: www.worldpop.org (accessed on 13 July 2022).
  61. Oak Ridge National Laboratory. Landscan 2000 Global Population Database. 2019. Available online: http://sedac.ciesin.columbia.edu/plue/gpw/landscan (accessed on 13 July 2022).
  62. European Commission. Big Data for Migration Alliance (BD4M). Harnessing the Potential of New Data Sources and Innovative Methodologies for Migration (Brussels, 2018). Available online: https://bluehub.jrc.ec.europa.eu/bigdata4migration/uploads/attachments/cjio8ha96019f99zvr9xq6025-big-data-for-migration-alliance-concept-note.pdf (accessed on 13 July 2022).
  63. European Commission (EC). Commission Regulation (EU) No 216/2010 of 15 March 2010 Implementing Regulation (EC) No 862/2007 of the European Parliament and of the Council on Community Statistics on Migration and International Protection, as Regards the Definitions of Categories of the Reasons for the Residence Permits. Available online: https://eur-lex.europa.eu/legal-content/EN/TXT/PDF/?uri=CELEX:32010R0216&from=HR (accessed on 9 July 2022).
  64. UNDESA, Population Division. International Migration. 2019. Available online: https://www.un.org/en/development/desa/population/migration/data/estimates2/estimates19.asp (accessed on 9 July 2022).
  65. The World Bank. International Migration Stock: 2012 Revision. Available online: https://data.worldbank.org/indicator/SM.POP.TOTL (accessed on 14 June 2022).
  66. Abel, G.J. Estimates of Global Bilateral Migration Flows by Gender between 1960 and 2015 1. International Migration Review 2018, 52, 809–852. [Google Scholar] [CrossRef]
  67. UNHCR. UNHCR Global Trends–Forced Displacement in 2018. Available online: https://www.unhcr.org/5d08d7ee7.pdf (accessed on 10 July 2022).
  68. EUROSTAT. European Statistics Portal. Available online: https://ec.europa.eu/eurostat/data/database (accessed on 13 July 2022).
  69. GALLUP Portal. Available online: https://www.gallup.com/analytics/318875/global-research.aspx (accessed on 13 July 2022).
  70. EC; JRC. Data for Integration (D4I). Available online: https://ec.europa.eu/knowledge4policy/migration-demography/data-integration-d4i_en (accessed on 11 July 2022).
  71. KCMD European Migration Data Hub. Available online: https://migration-demography-tools.jrc.ec.europa.eu/data-hub/ (accessed on 1 July 2022).
  72. UNDESA, Population Division. World Population Prospects 2019: Press Release. Available online: https://reliefweb.int/sites/reliefweb.int/files/resources/WPP2019_Highlights.pdf (accessed on 30 June 2022).
  73. UNDESA, Population Division. World Population Prospects 2019. Online Edition. Available online: https://population.un.org/wpp/ (accessed on 30 June 2022).
  74. Natale, F. United nations expert group meeting for the review and appraisal of the programme of action of the international conference on population and development and its contribution to the follow-up and review of the 2030 agenda for sustainable development. In Proceedings of the Population Division Department of Economic and Social Affairs, United Nations Secretariat, New York, NY, USA, 1–2 November 2018. [Google Scholar]
  75. European Commission; Joint Research Centre; Alessandrini, A.; Natale, F.; Sermi, F.; Vespe, M. High Resolution Map of Migrants in the EU; JRC Technical Reports EUR; Publications Office of the European Union: Luxembourg, 2017; Volume 28770, Available online: https://op.europa.eu/en/publication-detail/-/publication/feb7f53a-c500-11e7-9b01-01aa75ed71a1/language-en (accessed on 12 July 2022). [CrossRef]
  76. Pesaresi, M.; Huadong, G.; Blaes, X.; Ehrlich, D.; Ferri, S.; Gueguen, L.; Halkia, M.; Kauffmann, M.; Kemper, T.; Lu, L.; et al. A Global Human Settlement Layer from Optical HR/VHR RS Data: Concept and First Results. IEEE J. Sel. Top. Appl. Earth Obs. Remote Sens. 2013, 6, 2102–2131. [Google Scholar] [CrossRef]
  77. Wang, Y.; Huang, C.; Feng, Y.; Zhao, M.; Gu, J. Using Earth Observation for Monitoring SDG 11.3.1-Ratio of Land Consumption Rate to Population Growth Rate in Mainland China. Remote Sens. 2020, 12, 357. [Google Scholar] [CrossRef]
  78. SMURBS-ERA PLANET. Deliverable D2.4 Gap Analysis. Available online: https://drive.google.com/file/d/1euwSUlHlSyqo0XO-6i9YEHIq5EsU7V_r/view (accessed on 15 June 2022).
  79. ANCI. Italian National Municipalities Association Rapporto Cittalia 2013; Le Città Metropolitane, Digitalia Lab: Roma, Italy, 2013; ISBN 978-88-6306-035-5. [Google Scholar]
  80. ISTAT Demographic Indicators. 2020. Available online: http://dati.istat.it/Index.aspx?QueryId=18462 (accessed on 15 April 2022).
  81. Ehrlich, D.; Kemper, T.; Pesaresi, M.; Corbane, C. Built-up Area and Population Density: Two Essential Societal Variables to Address Climate Hazard Impact. Environ. Sci. Policy 2018, 90, 73–82. [Google Scholar] [CrossRef]
  82. UN Habitat. SDG 11.1.1. Metadata (2018 Release). Available online: https://unhabitat.org/sites/default/files/2020/06/metadata_on_sdg_indicator_11.1.1.pdf (accessed on 10 January 2022).
  83. UN Habitat. SDG 11.2.1. Metadata (2020). Available online: https://unhabitat.org/sites/default/files/2020/06/metadata_on_sdg_indicator_11.2.1.pdf (accessed on 10 January 2022).
  84. UN Habitat. SDG 11.3.1. Metadata (2018 Release). Available online: https://unhabitat.org/sites/default/files/2020/07/metadata_on_sdg_indicator_11.3.1.pdf (accessed on 10 January 2022).
  85. International Organization for Standardization. European ISO 37123:2019 on Sustainable Cities and Communities-Indicators for Resilient Cities. Available online: https://www.iso.org/standard/70428.html (accessed on 13 July 2022).
  86. Melchiorri, M.; Pesaresi, M.; Florczyk, A.; Corbane, C.; Kemper, T. Principles and Applications of the Global Human Settlement Layer as Baseline for the Land Use Efficiency Indicator—SDG 11.3.1. IJGI 2019, 8, 96. [Google Scholar] [CrossRef]
  87. Apulia Region, Italy. Apulia Regional Landscape Plan; 2013. Available online: http://www.sit.puglia.it/portal/portale_pianificazione_regionale/Piano%20Paesaggistico%20Territoriale (accessed on 13 July 2022).
  88. Comune di Bari-Italy Open Data Portal. Available online: http://opendata.comune.bari.it/ (accessed on 11 July 2022).
  89. Calka, B.; Bielecka, E. GHS-POP Accuracy Assessment: Poland and Portugal Case Study. Remote Sens. 2020, 12, 1105. [Google Scholar] [CrossRef]
  90. Kuffer, M.; Owusu, M.; Oliveira, L.; Sliuzas, R.; van Rijn, F. The Missing Millions in Maps: Exploring Causes of Uncertainties in Global Gridded Population Datasets. IJGI 2022, 11, 403. [Google Scholar] [CrossRef]
  91. Santoro, M.; Mazzetti, P.; Nativi, S. The VLab Framework: An Orchestrator Component to Support Data to Knowledge Transition. Remote Sens. 2020, 12, 1795. [Google Scholar] [CrossRef]
  92. Mazzetti, P.; Santoro, M.; Guigoz, Y. Virtual Earth Laboratory (VLAB). Available online: https://vlab.geodab.org/ (accessed on 13 July 2022).
  93. Aquilino, M. Dasy QGIS Plugin. Available online: https://plugins.qgis.org/plugins/dasy/ (accessed on 13 July 2022).
  94. European Union. European Region Development Fund. URBACT Programme. European Exchange and Learning Programme Promoting Sustainable Urban Development. Available online: https://urbact.eu/coherence-checklist (accessed on 11 July 2022).
  95. OECD. Italy’s National Action Plan for Policy Coherence for Sustainable Development; OECD Publishing: Berlin, Germany, 2022; ISBN 978-92-64-63344-5. [Google Scholar]
  96. Anagrafe Nazionale Popolazione Residente (ANPR). Available online: https://www.anagrafenazionale.interno.it/ (accessed on 30 June 2022).
  97. Shelestov, A.; Kussul, N.; Yailymov, B.; Shumilo, L.; Bilokonska, Y. Assessment of Land Consumption for SDG Indicator 11.3.1 Using Global and Local Built-Up Area Maps. In Proceedings of the IGARSS 2020-2020 IEEE International Geoscience and Remote Sensing Symposium; Waikoloa, HI, USA, 26 September–2 October 2020, IEEE: Waikoloa, HI, USA, 2020; pp. 4971–4974. [Google Scholar]
  98. Schiavina, M.; Melchiorri, M.; Corbane, C.; Florczyk, A.; Freire, S.; Pesaresi, M.; Kemper, T. Multi-Scale Estimation of Land Use Efficiency (SDG 11.3.1) across 25 Years Using Global Open and Free Data. Sustainability 2019, 11, 5674. [Google Scholar] [CrossRef]
  99. Stokes, E.C.; Seto, K.C. Characterizing Urban Infrastructural Transitions for the Sustainable Development Goals Using Multi-Temporal Land, Population, and Nighttime Light Data. Remote Sens. Environ. 2019, 234, 111430. [Google Scholar] [CrossRef]
  100. Kuffer, M.; Persello, C.; Pfeffer, K.; Sliuzas, R.; Rao, V. Do We Underestimate the Global Slum Population? In Proceedings of the 2019 Joint Urban Remote Sensing Event (JURSE), Vannes, France, 22–24 May 2019; IEEE: Waikoloa, HI, USA, 2019; pp. 1–4. [Google Scholar]
  101. Kuffer, M.; Wang, J.; Nagenborg, M.; Pfeffer, K.; Kohli, D.; Sliuzas, R.; Persello, C. The Scope of Earth-Observation to Improve the Consistency of the SDG Slum Indicator. IJGI 2018, 7, 428. [Google Scholar] [CrossRef] [Green Version]
  102. Tuholske, C.; Gaughan, A.E.; Sorichetta, A.; de Sherbinin, A.; Bucherie, A.; Hultquist, C.; Stevens, F.; Kruczkiewicz, A.; Huyck, C.; Yetman, G. Implications for Tracking SDG Indicator Metrics with Gridded Population Data. Sustainability 2021, 13, 7329. [Google Scholar] [CrossRef]
  103. UN Habitat. SDG 11.6.2. Metadata (2017). Available online: https://unhabitat.org/sites/default/files/2020/07/metadata_on_sdg_indicator_11.6.2.pdf (accessed on 13 July 2022).
Figure 1. Schematic representation of the links between policy frames, and state of the art with respect to EO usage and the solutions proposed for the migration theme (Solutions for MIGration—SMIG) within the SMURBS project.
Remotesensing 14 04295 g001
Figure 2. Conceptual model of SMIG2 solution in support of the relevant policy frameworks.
Remotesensing 14 04295 g002
Figure 3. Graphical scheme of the dasymetric method proposed in [29].
Remotesensing 14 04295 g003
Figure 4. The numbers of regular migrant residents in 2011 and 2020 in the Bari central area: three-dimensional elaboration of migrant-population density calculated in [29]. The height of each parallelepiped is proportional to the number of resident migrants, whereas the color changes according to the classes shown in the legend.
Remotesensing 14 04295 g004
Figure 5. Migrant fluxes in Bari: spatial distribution and average annual population-growth rate (PGR) from 2011 to 2020. Reprinted with permission from [29].
Remotesensing 14 04295 g005
Figure 6. Summary of all SDG11 indicators computed for Bari city in [28,29].
Remotesensing 14 04295 g006
Table 1. The collection of EO-based cities and settlement datasets from EU providers.
Product NameProviderBrief DescriptionGeographical Coverage/Spatial ResolutionLast Update/Release
The European Settlement Map (ESM) Copernicus Land Monitoring Services. Produced by the EC, JRC, Institute for the Protection and Security of the Citizen, and Global Security and Crisis Management Unit.Spatial raster dataset that is mapping human settlements in Europe based on SPOT5- and SPOT6-satellite imagery of 2012.Europe, 10 mUp to date to 2015. Last release published in 2019 [50].
Global Human Settlement Layer (GHSL)The JRC and DG for Regional Development (DG REGIO) of the EC, together with the international partnership GEO Human Planet Initiative.Information about the built-up and settlement boundaries from satellite imagery: Sentinel 1 and Sentinel 2GHS-BUILT: from 10 m to 1 km GHS-BUILT: 2018
GHS-SMOD: 1 km global coverage.GHS-SMOD: based on 2015 population data. Last release: 2019 [51].
GHS-composite-S2: 10 mGHS-composite-S2 based on 2017–2018 Sentinel-2 imagery. Release: 2020 [52,53].
Urban AtlasThe Copernicus Land Monitoring Service, and more specifically, the Urban Atlas service.Pan-European comparable land-use and land-cover data for functional urban areas (FUAs). Corresponding to the Atlas of Urban Expansion, the platform provides data for functional urban areas, which are defined as areas with more than 100.000 inhabitants, as defined by the Urban Audit.Europe: 17 urban classes with minimum mappable units (MMUs) (0.25 ha), and 10 rural classes with MMUs (1ha)Up to date to 2018.
Last release published in 2020 [54].
Global Urban Footprint German Aerospace Center (DLR) under ESA’s Urban Exploitation Platform (U-TEP).Worldwide mapping of settlements from SAR data.
A total of 180,000 TerraSAR-X and TanDEM-X scenes have been processed to create the GUF. The resulting map shows the Earth in three colors only: black for “urban areas”, white for “land surface”, and grey for “water”.
Global coverage.
Spatial resolution:
~84 m, near the equator.
~75 m, in mid-latitudes.
High-resolution data (~12 m, near the equator) are available only for scientific research.
Up to date to 2012. Last release: [55].
World Settlement FootprintGerman Aerospace Center (DLR) under ESA’s Urban Exploitation Platform (U-TEP).Global human settlement mask in, so far, unique spatial detail and consistency, derived from Landsat-8 and Sentinel-1 data.Global coverage. Spatial resolution: 10 m.Up to date to 2015.
Last release: [56]
Table 2. Collection of reference bibliographies on population datasets from EO data.
TopicEO Data (Input) and Applied MethodologiesReferenceGeographical Coverage/Spatial Resolution (Output)
Map of Migrants in the EU.Dasymetric mapping based on European Settlements Map (Source: CLMS; spatial resolution: 10 m) and GHSL
  • Data 4 Integration [62,70];
  • European migration-data Hub [71].
Pan-European coverage. Spatial resolution:
  • 100 m × 100 m;
  • 1 km × 1 km.
Grid population mapping at various scales.
  • Dataset reporting the growth of built-up and population in the last 40 years;
  • Satellite imagery at various scales;
  • Geo-positioning tools for field surveys;
  • Allocation of population methods;
  • Machine-learning algorithms to downscale the street-level population distribution to the grid level.
  • Gridded Population of the World [71];
  • GHS population [59,76];
  • Global Urban Footprint [55,56];
  • WorldPop [60];
  • LandScan Global Population Dataset [61].
Local, regional, global. From 1 to 110 km.
Grid population map in support of SDG 11.3.1. indicator.Disaggregation of population-census-data weighting with respect to built-up area by a regression model. Input: land-use/land-cover (LULC) datasets obtained from Landsat imagery (1990, 2000, and 2010).[77]Local and regional.
A 1 km × 1 km grid.
Spatial human settlement patterns from GHSL nightlights.Correlation between socioeconomic data at subnational level and nightlights measured from EO (i.e., VIIRS sensor, etc.)[51]Global. From 250 m to 1 km.
Population estimates by Urban Atlas polygon.Urban Atlas (2020 release for 2018) provides reliable intercomparable high-resolution LULC data with integrated population estimates for 788 functional urban areas (FUAs) with more than 50,000 inhabitants for the 2018 reference year in European-economic-area countries (EU, European Free Trade Association, Western Balkan countries, as well as Turkey) and the United Kingdom.Urban Atlas [54]Europe coverage. Minimum mappable unit (MMU):
  • 0.25 ha for 17 urban classes;
  • 1 ha for 10 rural classes.
Table 3. List of subtasks in relation to user needs.
ID SubtaskDescriptionUser-Related GAPS 1
ST1Identify regulations for measurements/indicators/metrics within existing policy frameworks.L
ST2Identify regulations/plans on housing and environmental dimensions (i.e., natural-hazard constraints, decaying neighborhoods and buildings, etc.).L
ST3Inventory of targets and specific resilience indicators.DB
ST4Identify essential variables for indicators.M
ST5Identify ancillary data needed.DB
ST6Mapping land cover and changes over time.O
ST7Mapping settlements and changes over time.O
ST8Mapping migrant population communities and population changes (fluxes).M
ST9Create guidelines for indicator implementation.M
ST10Make the procedures (for mapping both populations and indicators) reproducible.M, O
ST11Strengthen awareness, dissemination initiatives.O
1 Type of need: L: legal; M: methodological; DB: database; O: other.
Table 4. OECD and corresponding SDG 11 indicators.
DimensionOECD Resilience IndicatorsSDG 11 IndicatorOther Related SDG Indicators
(a1) Housing “Infrastructure is adequate and reliable”Percentage of housing units exposed to a high level of hazard that have been designed or retrofitted to withstand the force of the hazard.11.1.1—Proportion of urban population living in slums, informal settlements, or inadequate housing.
“Inadequate” is defined according to structural-quality, durability, and location criteria (Table 1 in Metadata SDG Indicator 11.1.1 [82]).
N/A
(a2) Water “Infrastructure is adequate and reliable”Proportion of population using safely managed drinking-water services.11.1.1—Proportion of urban population living in slums, informal settlements, or inadequate housing.
“Inadequate” is defined according to the “access to water” criterium (Table 1 in Metadata SDG Indicator 11.1.1 [82]).
6.1.1—Proportion of population using safely managed drinking-water services.
(a3) Transport “Infrastructure is adequate and reliable”Proportion of population that has convenient access to public transport, by sex, age, and persons with disabilities.11.2.1—Proportion of population that has convenient access to public transport, by sex, age, and persons with disabilities [83].N/A
(b) Sustainable urban development: “Adequate natural resources are available”Green area (hectares) per 100,000 population or average percentage of pervious surfaces (International Organization for Standardization).11.3.1—Ratio of land-consumption rate to population-growth rate [84].15.1.1—Forest area as a proportion of total land area.
Table 5. List of SDG 11 targets and indicators and requested data for quantifying them.
SDG 11 TargetsSDG 11 IndicatorsQuantifiable Derivatives (Subindicators)Requested Data
T11.1: Safe and affordable housing-transport systems11.1.1. Proportion of urban population living in slums, informal settlements, or inadequate housing.
(1)
Proportion of households with nondurable housing;
Grid population map *
Building layer with information on building use (i.e., residential, commercial, industrial, decaying buildings).
(2)
Proportion of households living in housing located on or near hazardous areas;
Grid population map *
Building-layer/settlement maps *
Hazard maps
(3)
Proportion of households with insufficient living space.
Grid population map *
Building-layer/settlement maps *
Building-height layer *
T11.2: Affordable and sustainable 11.2.1. Proportion of population that has convenient access to public transport by sex, age, and persons with disabilities.
(1)
Proportion of population that has convenient access to public transport;
Grid population map *
Street-network layer
Bus-stop map
Metro/tramway-stop map
T11.3: Inclusive and sustainable urbanization11.3.1. Ratio of land-consumption rate to population-growth rate.
(2)
Ratio of land-consumption rate to population-growth rate (LCRPGR);
Grid population map *
Settlement map *
T11.6: Reduce the environmental impacts of cities11.6.2. Annual mean levels of fine particulate matter (e.g., PM2.5 and PM10) in cities (population-weighted).
(3)
Annual average exposure to PM2.5 (population-weighted);
Grid population map *
(4)
Annual average exposure to PM10 (population-weighted).
Annual mean levels of fine-particulate-matter maps. Source: Local Agency of Environmental Protection.
* Input that can be retrieved from EO data.
Table 6. List of indicators/subindicators estimated for both the total and migrant populations.
SDG 11 IndicatorsQuantifiable Derivatives (Subindicators)Other Ancillary Data RequiredEstimates with Respect to the Total PopulationEstimates with Respect to the Migrant-Population Component
11.1.1. Proportion of urban population living in slums, informal settlements, or inadequate housing
  • Proportion of households with nondurable housing;
  • Building layer with information on building use (i.e., residential, commercial, industrial, decaying buildings);
0.2%
(596 people)
0.1% with respect the total migrant population
2.
Proportion of households living in housing located on or near hazardous areas;
  • Building-layer/settlement maps;
  • Hazard maps;
1%
(3043 people)
1% with respect the total migrant population (133 migrant people)
3.
Proportion of households with insufficient living space.
  • Building-layer/settlement maps;
  • Building-height layer (optional).
0.88%
(2848 people)
No people from official statistics
11.2.1. Proportion of population that has convenient access to public transport by sex, age, and persons with disabilities
  • Proportion of population that does not have convenient access to public transport
  • Street-network layer;
  • Bus-stop map.
3%
(10,535 people)
2%
(286 people)
11.3.1. Ratio of land-consumption rate to population-growth rate
  • Ratio of land-consumption rate to population-growth rate (LCRPGR)
  • Settlement map
0.40
(average value)
N/A
11.6.2. Annual mean levels of fine particulate matter (e.g., PM2.5 and PM10) in cities (population-weighted)
  • Annual average exposure to PM2.5 (population-weighted);
  • Annual mean levels of fine-particulate-matter maps. Source: Local Agency of Environmental Protection;
13.5 µg/m313.5 µg/m3
2.
Annual average exposure to PM10 (population-weighted).
  • Annual mean levels of fine-particulate-matter maps. Source: Local Agency of Environmental Protection.
22.1 µg/m322.2 µg/m3
Table 7. Differences in setting options between basic and advanced workflow implementations.
Setting OptionsDasy2 (Basic Implementation) (https://github.com/AM-IIA/DasymetricV2.2, accessed on 12 July 2022)Dasy3 (For Advanced Users) (https://github.com/AM-IIA/Dasymetric3.git, accessed on 12 July 2022)
Building-use layerUrban Atlas as input,
building-use classes not configurable.
Generic land-use map,
building-use classes configurable.
Building heightsRequiredOptional
Weight-correction factorsFixedConfigurable
Table 8. Assessment analysis of SMIG2 solution.
ID STsDescriptionFindingsAchievement 1Additional Notes
ST1Identify regulations for measurements/indicators/metrics within existing policy frameworks.
  • SDG 11 indicators;
  • OECD indicators [21];
  • European ISO 37123:2019 on Sustainable cities and communities—Indicators for resilient cities [85].
Remotesensing 14 04295 i003The existing regulations are reported (Section 3.1).
ST2Identify regulations/plans on housing and environmental dimensions (i.e., natural-hazard constraints, decaying neighborhoods and buildings, etc.).Landscape Protection Plan of Apulian Region (PPTR), natural-hazard maps, open-dataset providers.Remotesensing 14 04295 i003The existing regulations are reported (Section 3.2).
ST3Inventory of targets and specific resilience indicators.[29]Remotesensing 14 04295 i003The list of indicators can be extended (reported in Section 3.2 and further discussed in Section 4.2).
ST4Identify essential variables for indicators.According to [81,86], settlement and population maps are recognized as essential variables.Remotesensing 14 04295 i003The list of essential variables (Section 3.2) could be extended if new indicators are considered (see discussion recommendations in Section 4.2).
ST5Identify ancillary data needed.[29]Remotesensing 14 04295 i003The list of ancillary data (Section 3.2) could be extended if new indicators are considered. This topic has not been addressed in this study.
ST6Mapping land cover and changes over time.Two automatic-classification procedures based on availability of/missing training data: data-driven and pixel-based, and knowledge-driven and object-based. Remotesensing 14 04295 i004A map was produced only for the case study (as reported in Section 3.3). The procedure is fully reproducible for other geographic areas.
ST7Mapping settlements and changes over time.Automatic extraction of built-up trends in large areas.Remotesensing 14 04295 i004A map was produced only for the case study (Section 3.3). The procedure is fully reproducible for other geographic areas.
ST8Mapping migrant-population communities and population changes (fluxes).The dasymetric mapping method [29,30].Remotesensing 14 04295 i003A map was produced only for the case study. Further uncertainty analysis needs to be applied to all procedures through more detailed checks, the estimation of errors, and samples for verification (discussed in Section 4.2).
ST9Create guidelines for indicator implementation.Research articles [29,30] and document [28] include an exhaustive description of all implemented procedures.Remotesensing 14 04295 i003These guidelines (reported, in brief, in the Supplementary Materials) could be extended and made more understandable. Uncertainties are reported in Section 3.3. Further analysis needs to be applied to all procedures through more detailed checks, the estimation of errors, and samples for verification (discussed in Section 4.2).
ST10Make the procedures (for mapping both populations and indicators) reproducible.VLab implementation and scripts shared on GitHub repository(QGIS plugin).Remotesensing 14 04295 i003See Section 3.5. The development of additional modules is still in progress.
ST11Strengthen awareness, dissemination initiatives.Workshops, conferences.Remotesensing 14 04295 i003Partially limited by COVID-19 pandemic emergency.
1 Legend: Remotesensing 14 04295 i001 : GAPS NOT FILLED; Remotesensing 14 04295 i002: INDIFFERENT TO THE GAPS; Remotesensing 14 04295 i003 : GAPS PARTIALLY FILLED; Remotesensing 14 04295 i004 : GAPS FULLY FILLED.
Publisher’s Note: MDPI stays neutral with regard to jurisdictional claims in published maps and institutional affiliations.

