Article

Role of the Nyainrong Microcontinent in Seismogenic Mechanism and Stress Partitioning: Insights from the 2021 Nagqu Mw 5.7 Earthquake

1
School of Geosciences and Info-Physics, Central South University, Changsha 410083, China
2
The Department of Land Surveying and Geo-Informatics, The Hong Kong Polytechnic University, Hong Kong 999077, China
3
National Institute of Natural Hazards, Ministry of Emergency Management of China, Beijing 100085, China
4
College of Geological Engineering and Geomatics, Chang’an University, Xi’an 710054, China
*
Author to whom correspondence should be addressed.
Remote Sens. 2022, 14(15), 3834; https://doi.org/10.3390/rs14153834
Submission received: 13 July 2022 / Revised: 3 August 2022 / Accepted: 4 August 2022 / Published: 8 August 2022

Abstract

:
The Nyainrong microcontinent carries key information about the ongoing evolution of the central Tibetan Plateau. The 2021 Mw 5.7 Nagqu earthquake is the largest instrumentally recorded event inside this microcontinent, which provides an ideal opportunity to elucidate the influence of this ancient microcontinent on the seismogenic mechanisms, stress heterogeneity and strain partitioning across the Tibetan Plateau. Here, we constrain the seismogenic fault geometry and distributed fault slip using Interferometric Synthetic Aperture Radar (InSAR) observations. By using the regional focal mechanism solutions, we invert the stress regimes surrounding the Nyainrong microcontinent. Our analysis demonstrates that the mainshock was caused by a normal fault with a comparable sinistral strike-slip component on a North-West dipping fault plane. The Nyainrong microcontinent is surrounded by a dominant normal faulting stress regime to the northeast and a dominant strike-slip stress regime to the southwest. Moreover, the clockwise rotation of the maximum horizontal stress (SHmax) from the southwest to the northeast is ~20°. This indicates that the Nyainrong microcontinent is involved in the mainshock occurrence as well as regional stress heterogeneity, and strain partitioning. Our results highlight the significance of the ancient microcontinent in the tectonic evolution of the Tibetan Plateau.

1. Introduction

The Nyainrong microcontinent, which is also called the Amdo basement/terrane, is located at the juncture of the Qiangtang terrane and Lhasa terrane in the central Tibetan Plateau [1,2]. Previous paleoecology and geochemistry studies have demonstrated that the Nyainrong microcontinent is an older tectonic unit, with an age of between ~170 to ~900 million years (Ma) [1,2,3,4]. It appeared much earlier than the initiation age (~50 Ma) of the India–Eurasia collision [5]. The lower intercept age of 170 Ma corresponds to the timing of low-grade metamorphism during the initial Lhasa–Qiangtang collision due to the Bangong Ocean closing [1]. As shown in Figure 1, the ancient basement rock in the Nyainrong microcontinent differs from the surrounding sedimentary rocks [3]. The Nyainrong microcontinent is an east–west-trending eye-shaped terrane, covering an area of ~8000 km2 (Figure 1). Although it is widely acknowledged that Tibet’s thick crust and high elevation originated from the India–Eurasia collision, the role of the older tectonics is less understood [6]. However, previous investigations of the Nyainrong microcontinent were mainly focused on long-term (i.e., geological time of Ma) tectonic evolution based on petrological, geochronological, and geochemical methods [1,2,3,4]. Therefore, a study of the kinematics and stress regime of the Nyainrong microcontinent from geodetic and seismological data is further required for elucidating the short-term tectonic evolution of the central Tibetan Plateau.
The Nagqu Mw 5.7 earthquake occurred in the east corner of the Nyainrong microcontinent on 19 March 2021, which is the largest earthquake inside the microcontinent during its instrumental history. This earthquake offers an unprecedented opportunity to explore the kinematics and stress regime of this microcontinent based on the Interferometric Synthetic Aperture Radar (InSAR) images and well-recorded seismic data. Geodetic and seismological data were previously used by various research institutions, which revealed the focal mechanisms of this earthquake, consistently characterized by normal faulting with a moderate strike-slip component (Table 1). Li et al. (2021) investigated the fault geometry and mechanisms of this earthquake using Sentinel-1 data, and the stress-loading effects of historical large M > 7 earthquakes on the mainshock [11]. Li et al. (2022) examined the stress and strain characteristics in the seismic region of the 2021 Nagqu Mw 5.7 earthquake based on stress data, focal mechanisms, and the GNSS data [12]. However, these studies did not consider the effect of the Nyainrong microcontinent on the seismic dynamics and surrounding stress and strain. Thus, it remains unclear what role the Nyainrong microcontinent played in the occurrence of the mainshock and the regional tectonic evolution, which is crucial for better understanding the mechanisms of earthquake and faulting [13,14].
Here, we use Sentinel-1 SAR images to produce the coseismic InSAR displacement caused by the 2021 Nagqu Mw 5.7 earthquake. With both ascending and descending InSAR observations, we decompose the 2D displacements including horizontal components along the fault trace and vertical deformation. We further constrain the seismogenic fault geometry and distributed fault slip to explore the faulting kinematics within the Nyainrong microcontinent. Local focal mechanisms are used to perform the stress inversion and investigate the role of the Nyainrong microcontinent in the regional stress heterogeneity and strain partitioning. Our results highlight the significant role of ancient special structures such as the Nyainrong microcontinent in the tectonic evolution and stress/strain state of the Tibetan Plateau.

2. InSAR Observation and Fault Slip Inversion

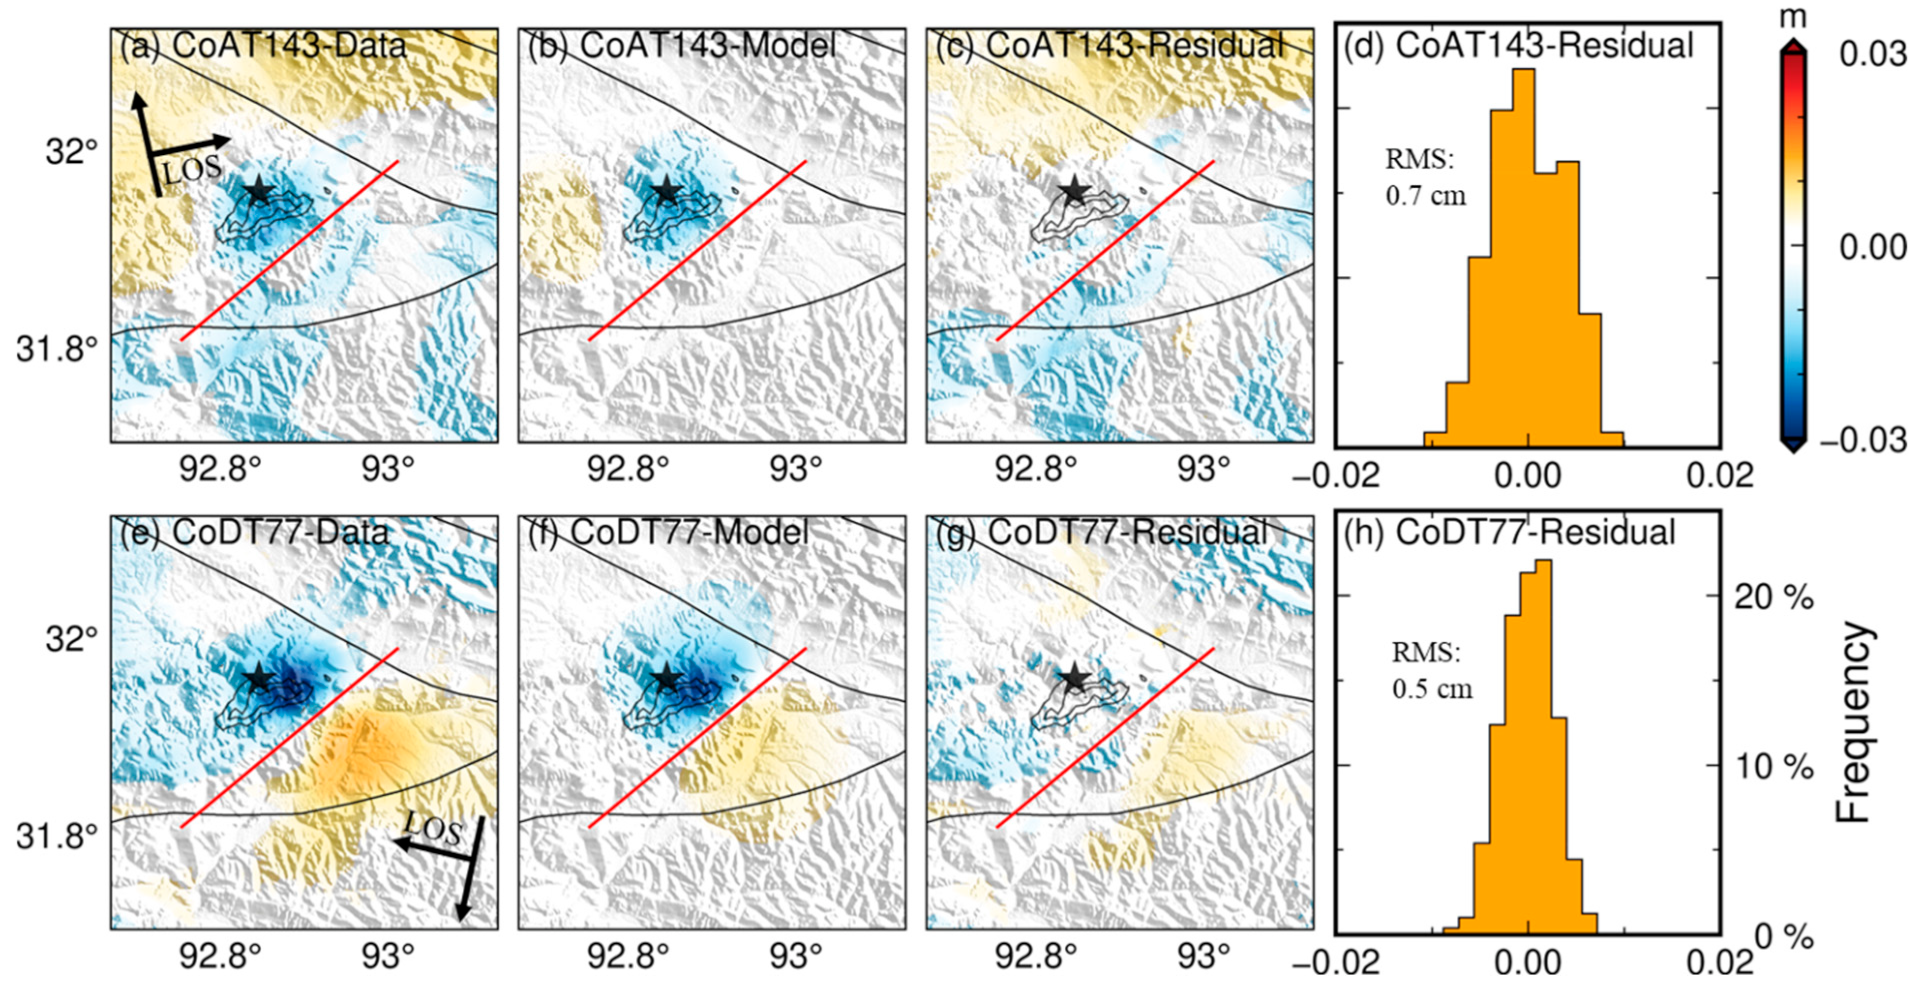
2.1. InSAR Observations

The 2021 Nagqu earthquake occurred in the center of Tibet, where there are arid climate conditions (average monthly precipitation ~20 mm) [15] and sparse vegetation coverage. Such conditions are conducive to applying InSAR technology to obtain the completed displacements over the epicenter region [16,17]. The constellation of Sentinel-1 satellites is operated by the European Space Agency with a shortened revisiting period (6/12 days), which strengthens their capacity to capture millimeter-level surface displacement. Here, we use C-band Sentinel-1 SAR data from one ascending track 143 (AT143) and one descending track 77 (DT77) to map coseismic interferograms of the 2021 Nagqu earthquake (Figure 1 and summarized in Table 2). Relying on the precise Sentinel-1 orbits, high-accuracy coregistration between the primary and secondary Single Look Complex (SLC) was carried out with the Gamma software [18]. Then, two coseismic interferograms were generated with the coregistered SLCs. Furthermore, the one arc-sec digital elevation model from the Shuttle Radar Topography Mission [19] and an improved power spectrum filter method [20] was applied to mitigate the effect of topography and the phase noise in the interferograms, respectively. Finally, the coseismic surface displacement fields were retrieved by unwrapping the filtered interferograms by a minimum cost flow method [21]. In addition, given the topographic relief in the epicenter region, the potential topography-dependent tropospheric delay was estimated and removed [22].
Given the excellent coherence and somewhat low noise level in the epicenter region, the obtained coseismic interferograms characterize well-defined surface displacements caused by the Nagqu earthquake (Figure 2). The displacements are concentrated in the east corner of the Nyainrong microcontinent. The descending coseismic interferogram revealed a symmetric double-lobe pattern with a peak subsidence value of ~3 cm away from the satellite line of sight (LOS) direction. The southeastern region is characterized by uplift (LOS range decrease), while the northeastern region is characterized by subsidence (LOS range increase). However, the ascending coseismic interferogram reveals only one subsidence lobe with up to ~2 cm LOS displacement. These distinct displacement patterns between the two tracks can be potentially attributed to the less favorable viewing geometry associated with the ascending orbit. Furthermore, we do not discern any remarkable ruptures from the displacement maps, which indicates a blind fault in the SW–NE orientation.

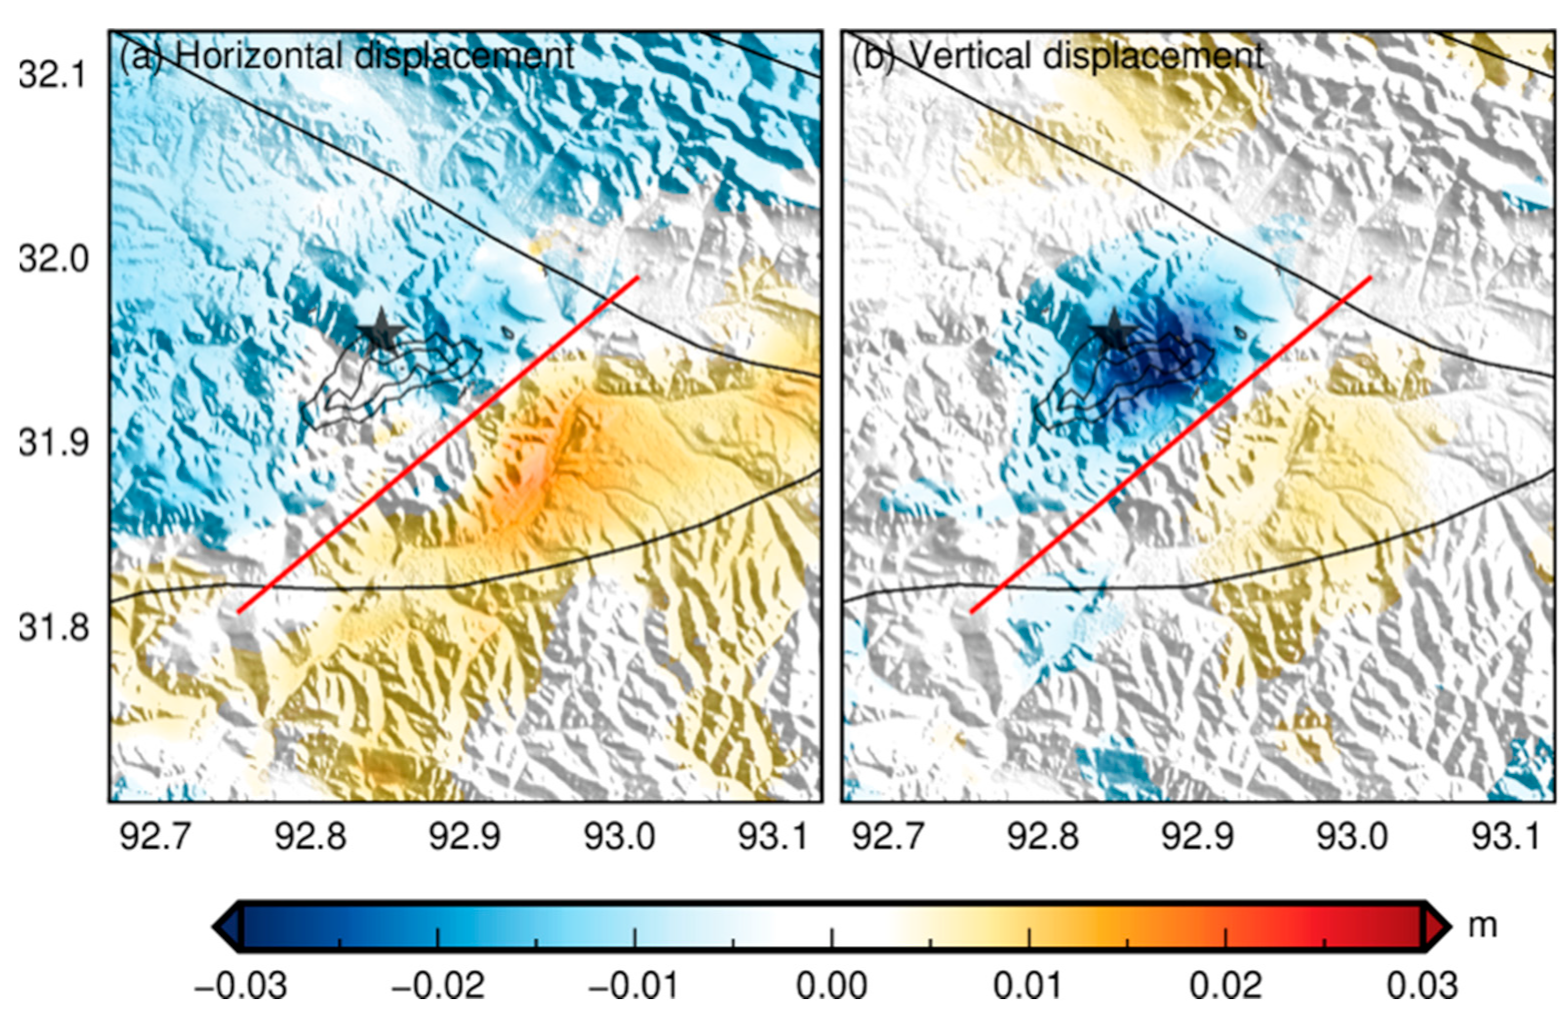
2.2. Two-Dimensional Displacement

As the LOS displacement represents only one-dimensional (1D) manifestation along the satellite viewing direction, it provides only limited constraints on the real pattern of crustal deformation (e.g., dextral or sinistral strike-slip, thrust or dip-slip) [23]. In this context, 2D (two-dimensional) displacement can improve our understanding of the characteristics of crustal deformation caused by the 2021 Mw 5.7 Nagqu earthquake. To this end, the 2D coseismic ground deformation fields are decomposed from the ascending and descending coseismic interferograms to better constrain the characteristics of the fault deformation [23]. The decomposed 2D displacements are characterized by southwest horizontal motion along the strike direction and subsidence in the northwestern lobe, and northeast horizontal motion along the strike direction and uplift in the southeast lobe (Figure 3). This identified pattern suggests that the crust deformation during the 2021 Nagqu earthquake is characterized by both normal and sinistral fault slips, corresponding to a transtensional fault slip during the earthquake.

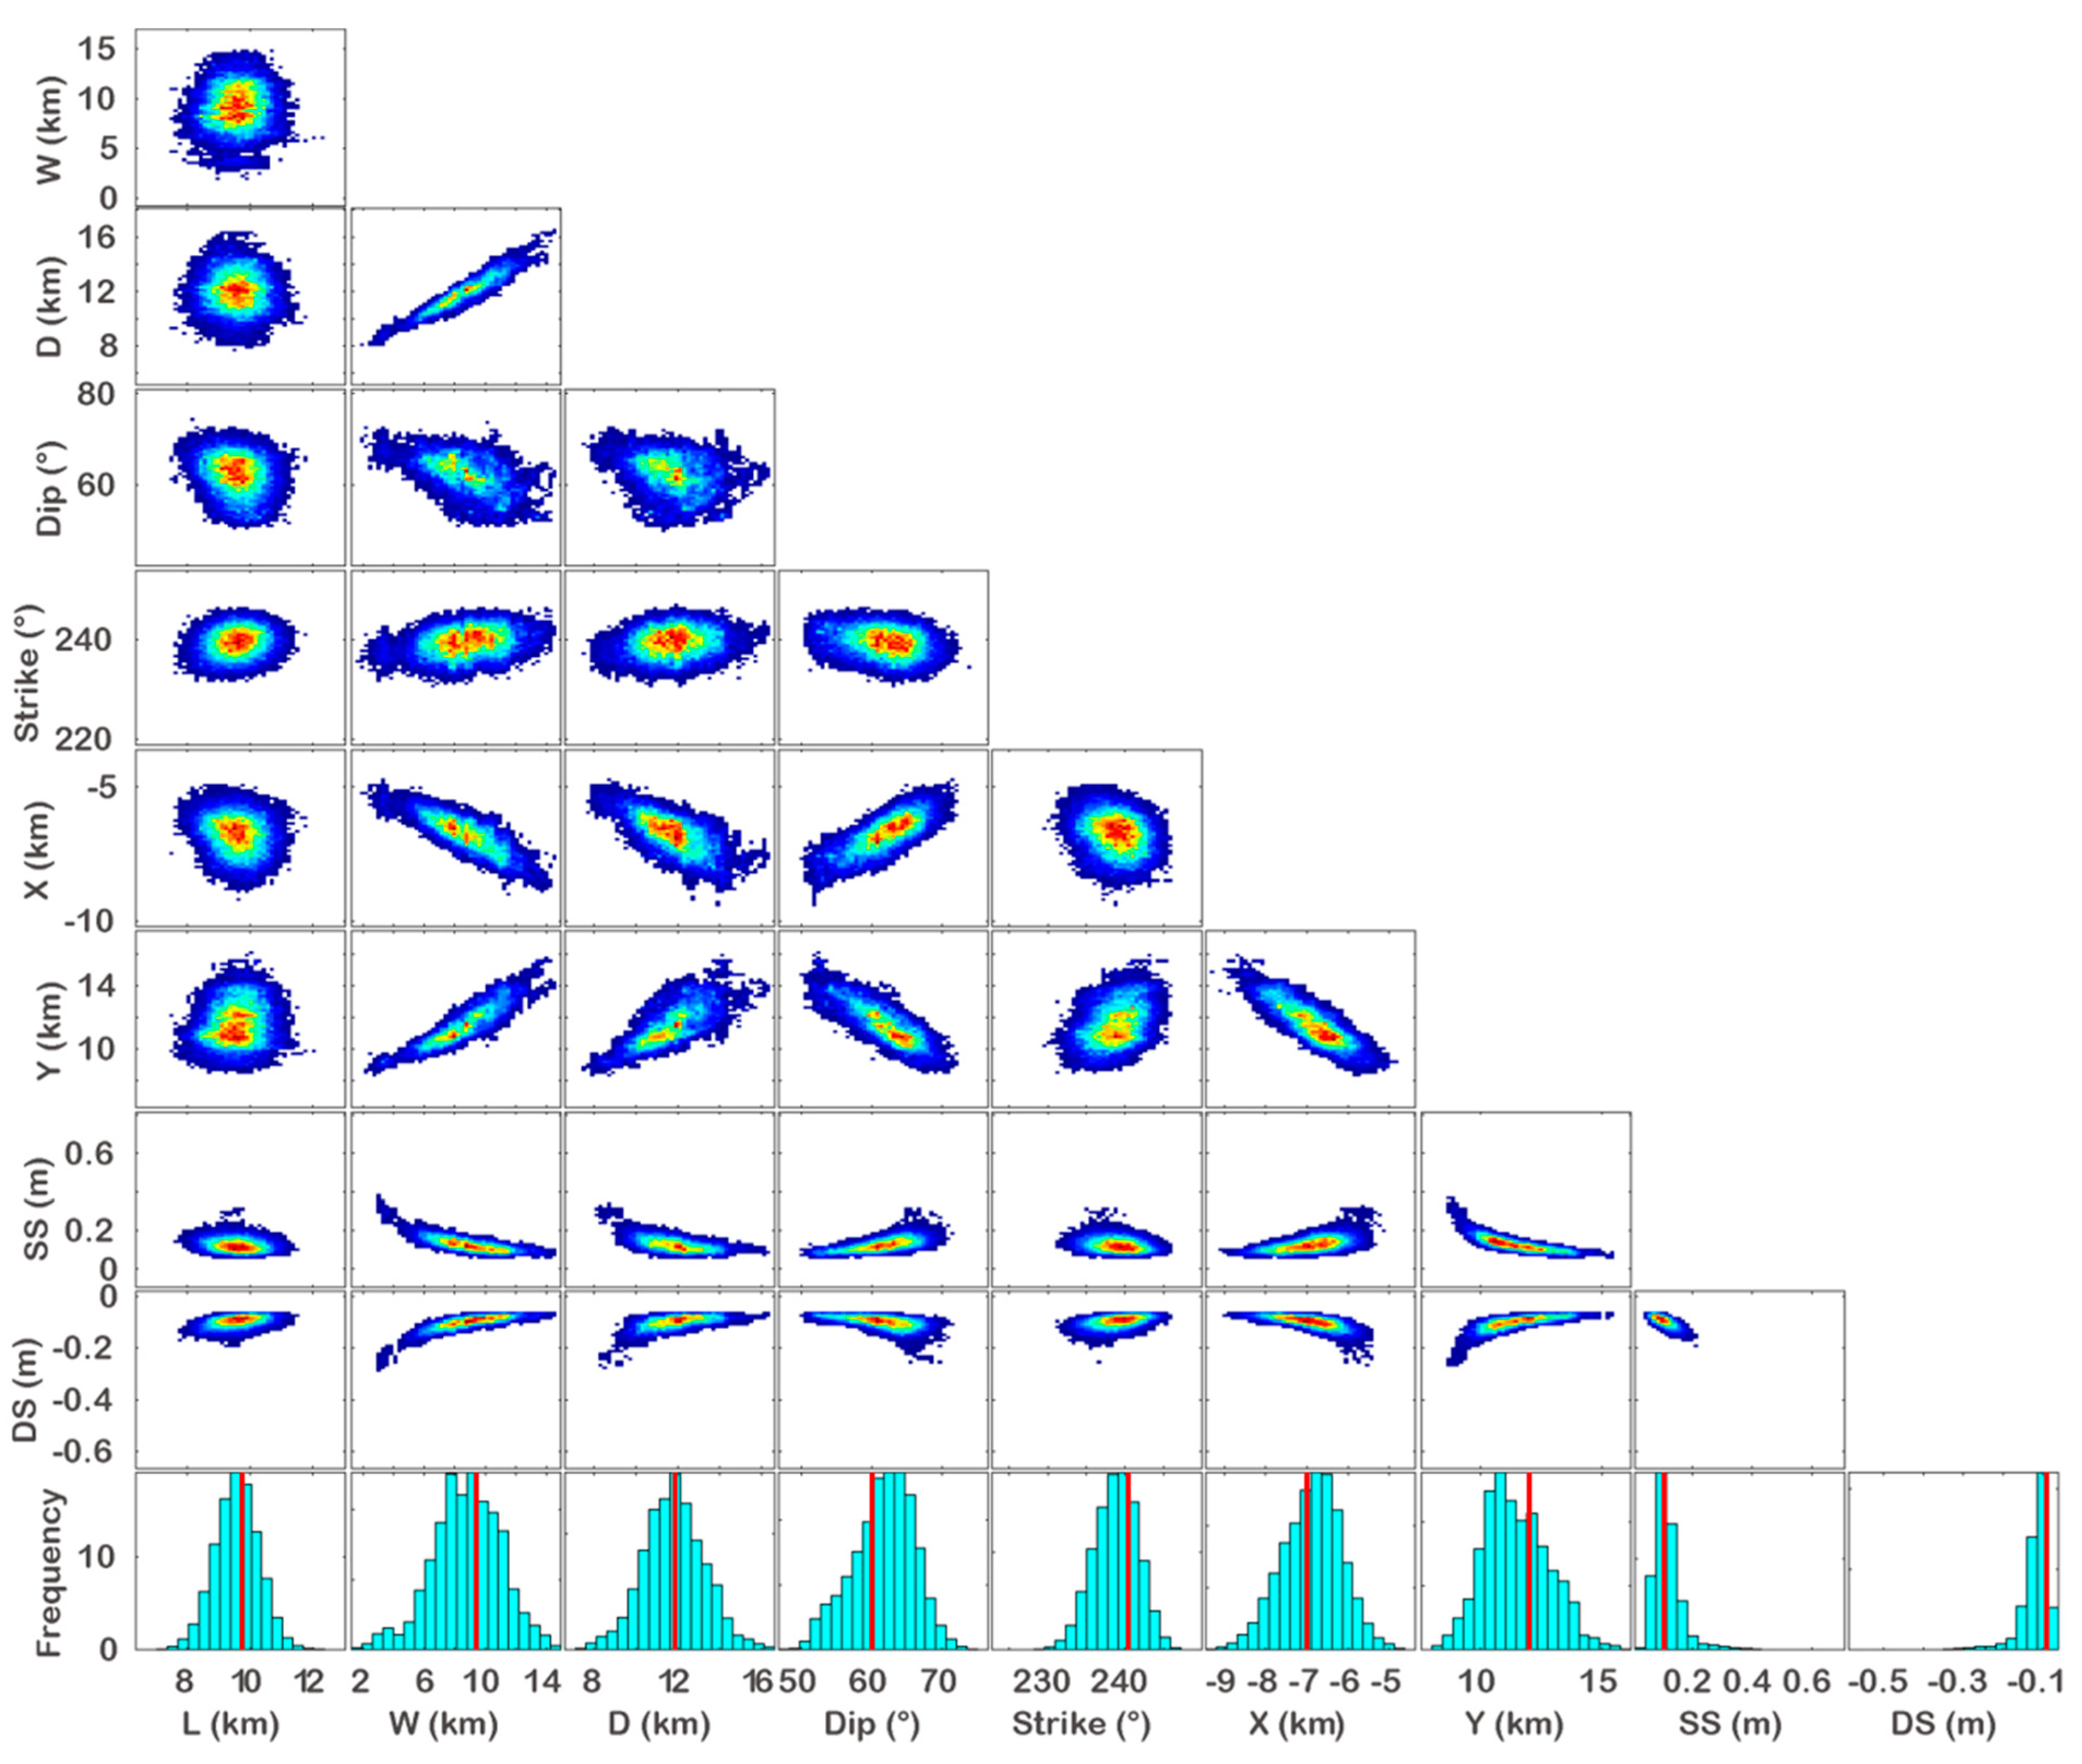
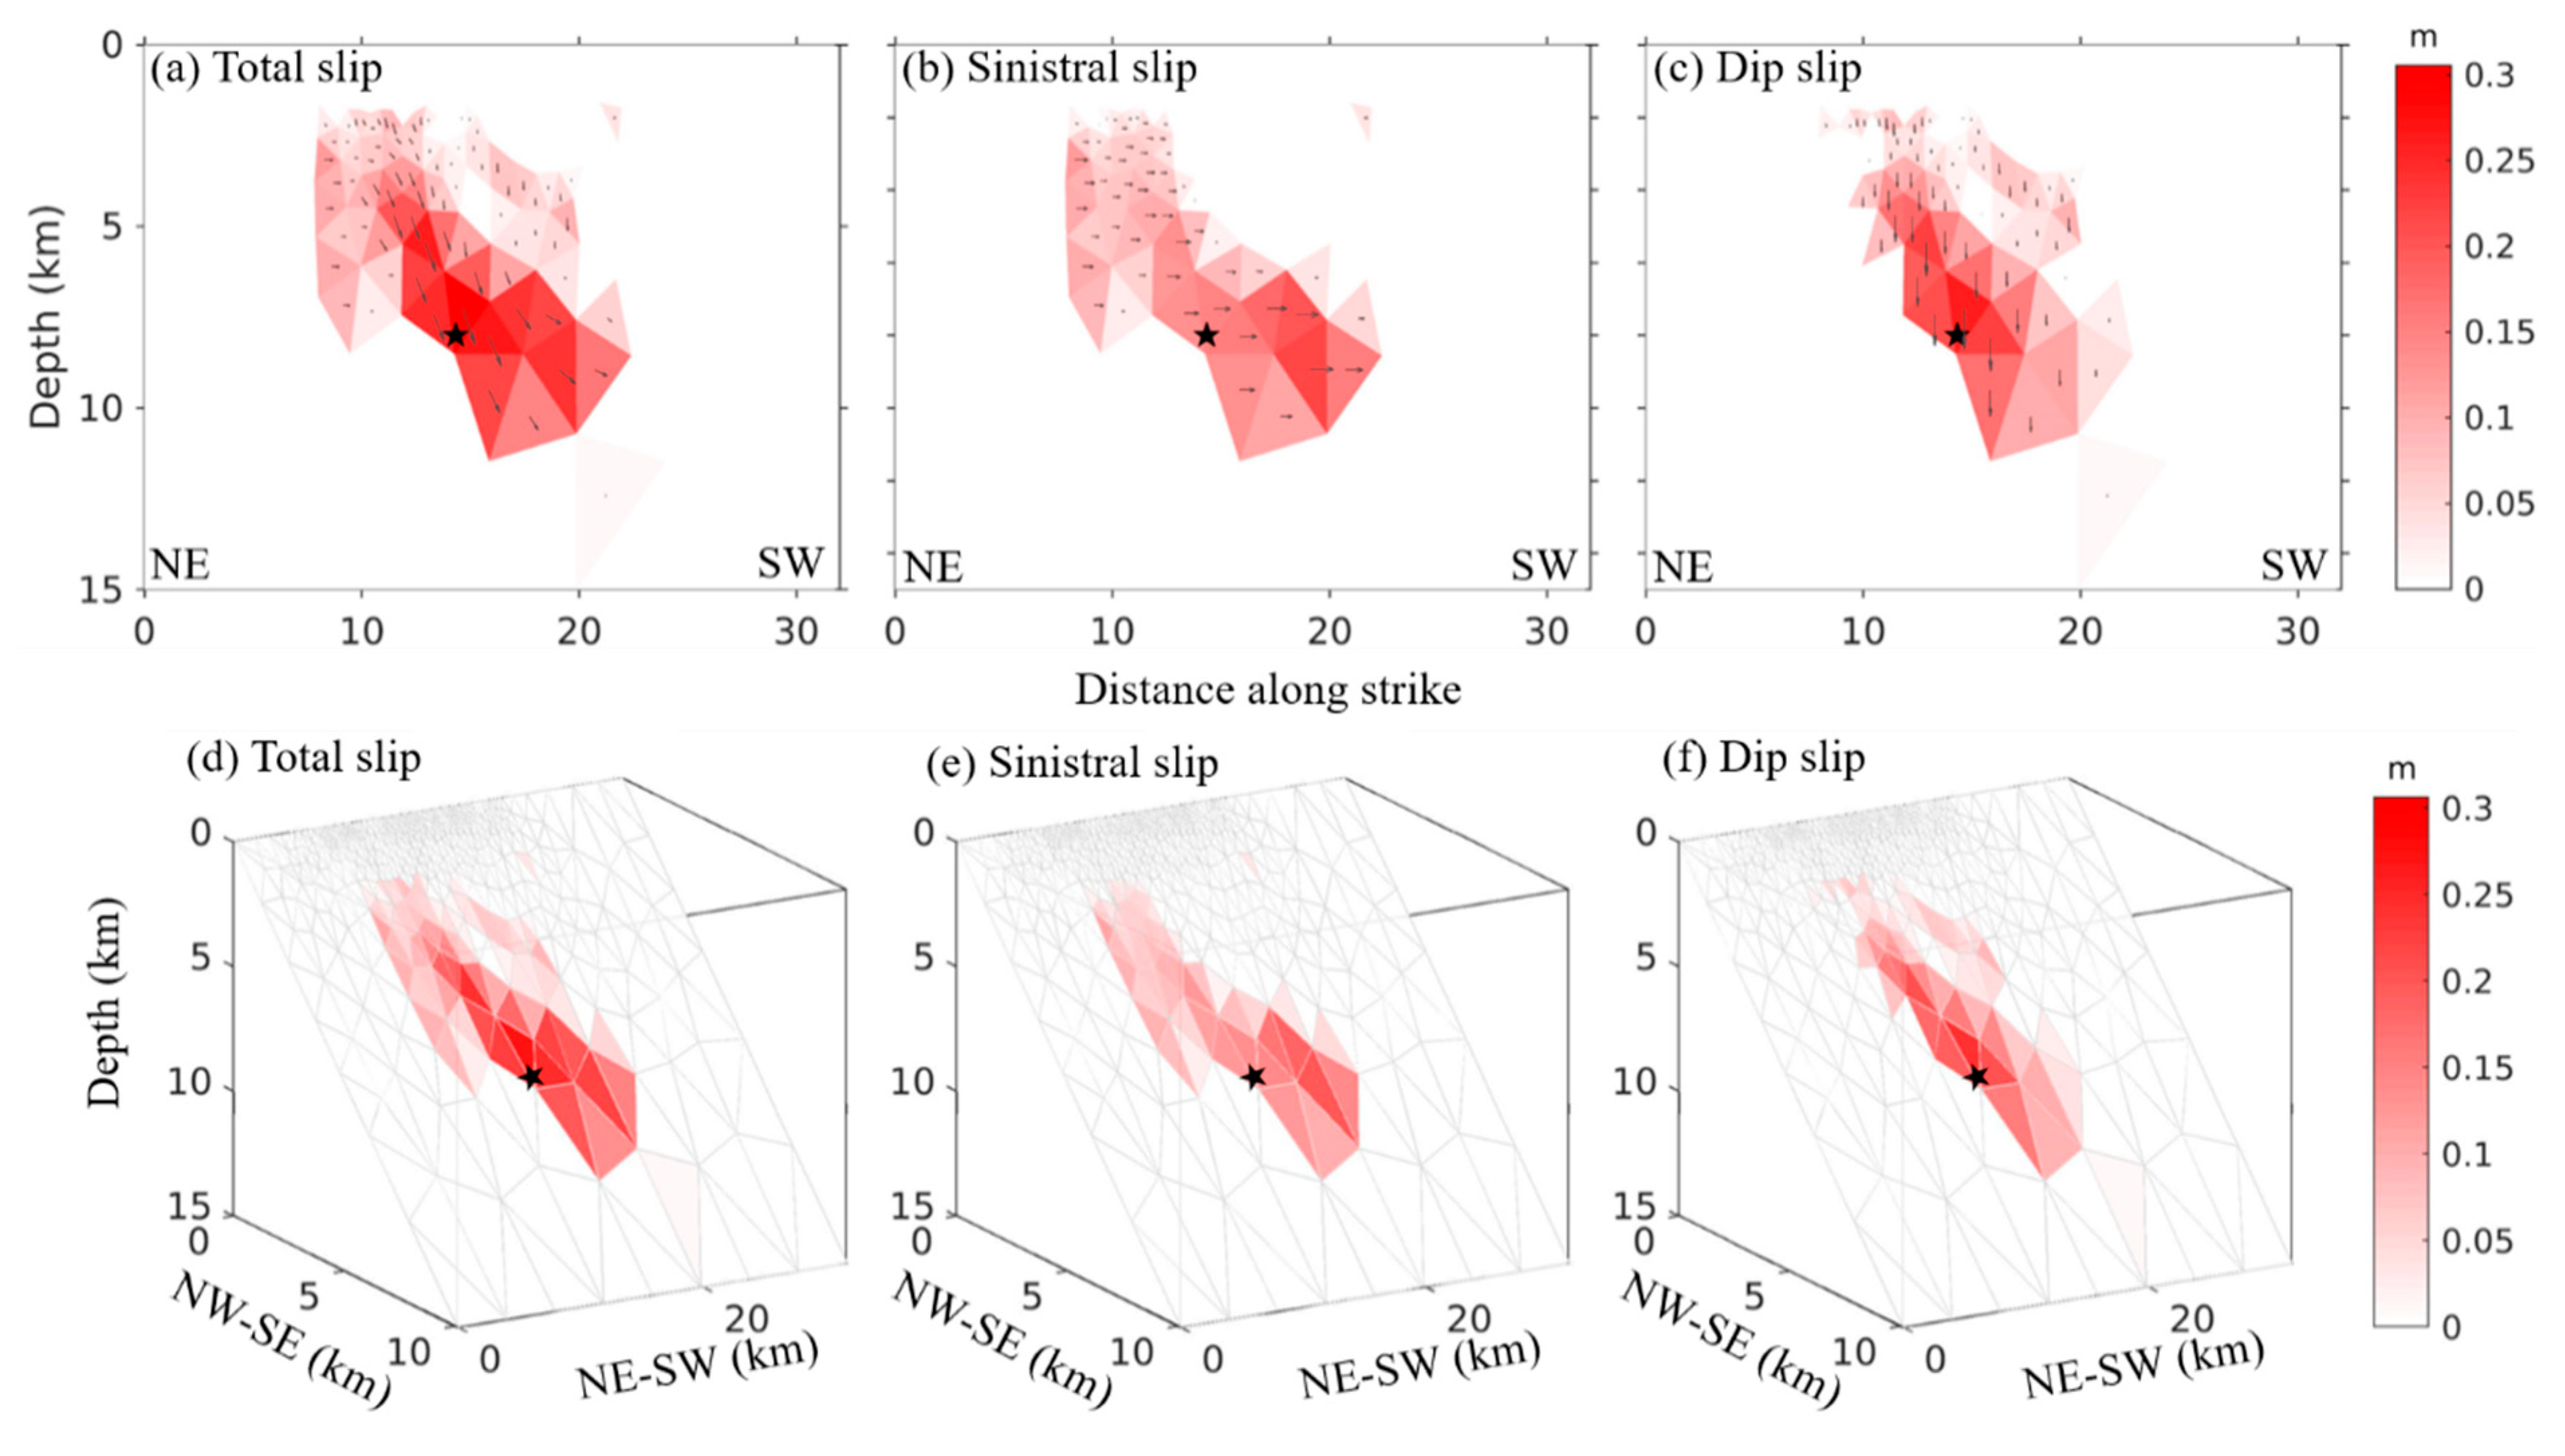
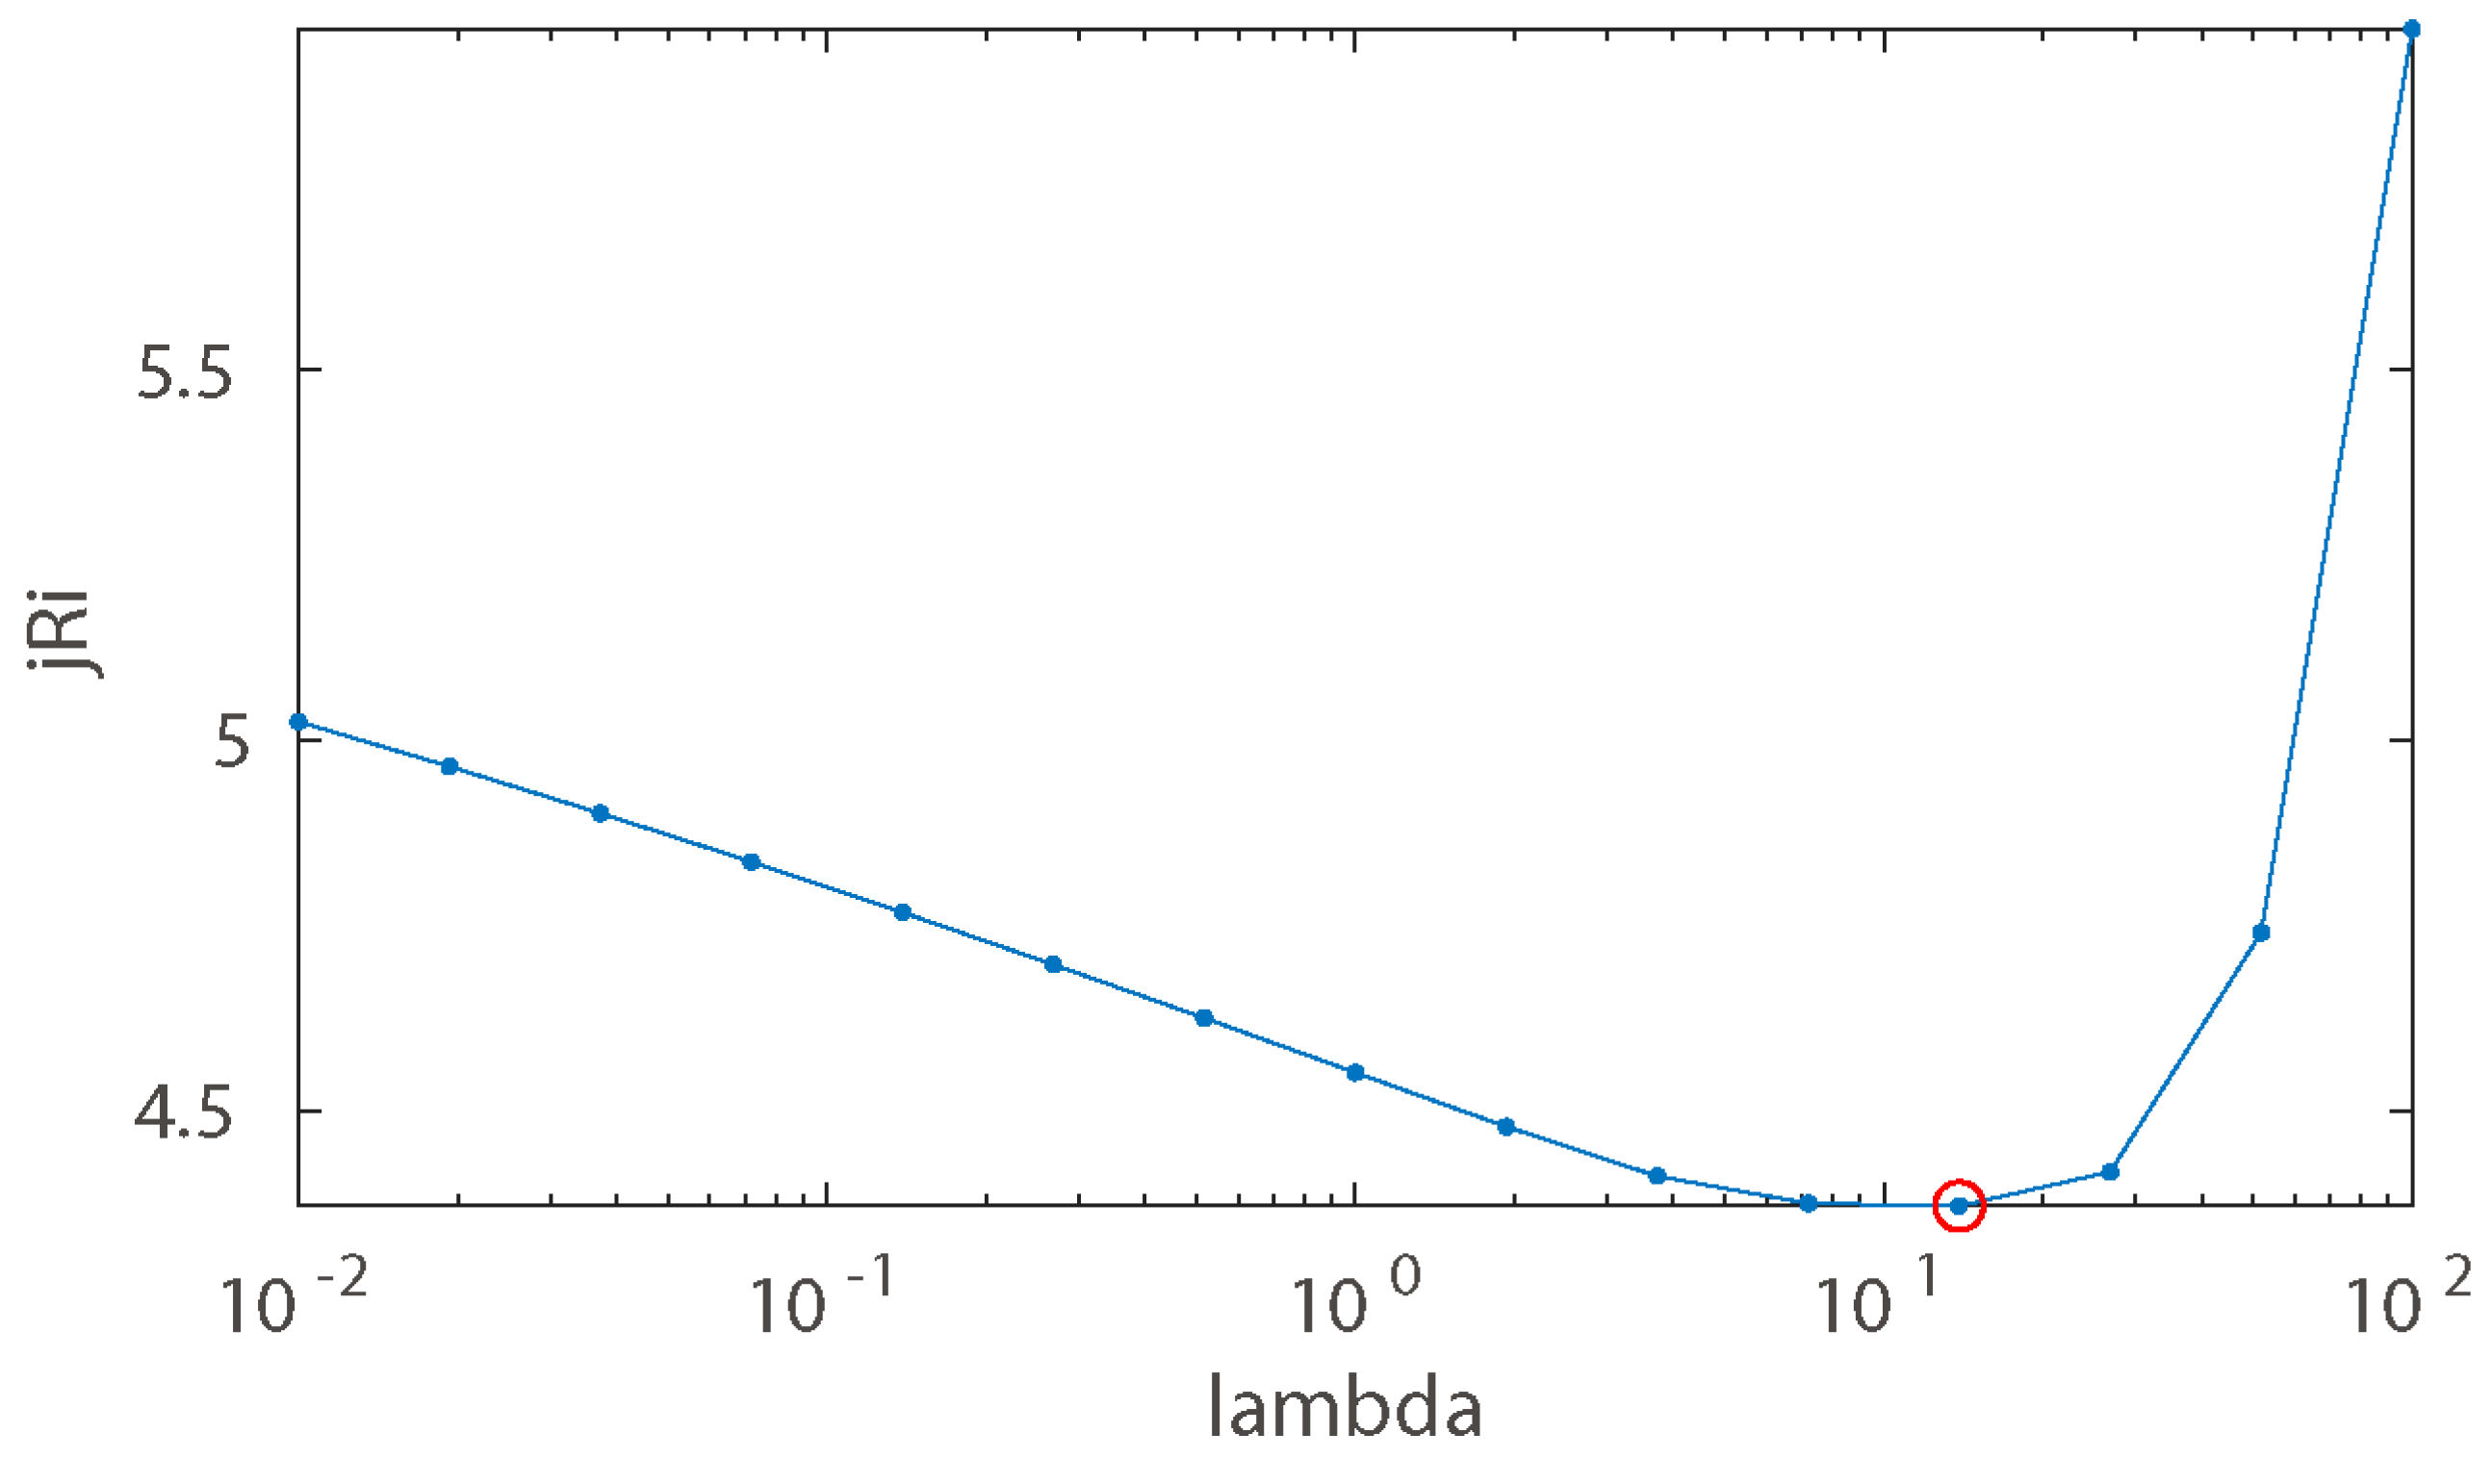
2.3. Seismogenic Fault Geometry and Distributed Slip

To reconstruct the source parameters of the seismogenic fault (longitude and latitude of fault location, length, width, depth, strike angle, dip angle, strike-slip and dip-slip), we applied the Geodetic Bayesian Inversion Software (GBIS), which had been previously proposed by Bagnardi and Hooper [24]. Before implementing the source inversion, we calculated the experimental semivariogram to quantify the covariance with tropospheric delay and topographic residuals in the interferograms [24]. Moreover, to achieve a tractable computational burden, we applied an adaptive gradient-based quadtree sampling method to downsample the coseismic interferograms to ~400 grids [25]. By assuming that the seismogenic fault was a rectangular plane with a uniform slip, the elastic half-space dislocation model was utilized. In this way, we determined the Green function, linking the down-sampled InSAR observations with the uniform fault slip [26].
Two NW–SW and SW–NE-orientated fault plane solutions for the Nagqu earthquake were previously issued by different agencies (Table 1). Given the prior information of double-lob coseismic displacement features (Figure 2), the decomposed 2D displacement fields (Figure 3), and the consistent normal or transtensional faulting from different agencies (Table 1), we preferred the SW–NE orientated fault plane dipping northwest. Thus, we set the sampling boundary for a strike angle (180, 300) and a dip angle (0, 90), and loose sampling boundaries were provided for other source parameters to broadly cover the solution space. In the Bayesian inverse approach, the optimal model parameters were determined by finding the maximum-a-posteriori probability solution from the posterior probability density functions, which were obtained by sampling with the Markov chain Monte Carlo method [27]. More detailed information about the inversion was provided in a previous study [24].
After 5 × 10⁶ iterations, we obtained well-converged Markov chains, indicating it did explore the parameter space sufficiently. The maximum-a-posteriori probability uniform slip model solution reveals the optimal fault plane of 9.8 km long and 9.3 km wide with a strike angle of 240.4° and a dip angle of 59.2° (Table 3). Trade-offs between the fault parameters are somewhat inconspicuous (i.e., strike and dip angles), as indicated by the histograms of posterior probability distributions (Figure 4). These parameters of fault geometry are consistent with previous studies that used either geodetic or seismological data (Table 1).
To resolve a distributed coseismic slip model, while also improving the fitness of the data and models, we fixed the fault geometry, derived from GBIS non-linear inversion. Moreover, we extended the fault length and the width to 30 km and 18 km (i.e., to 15 km depth), respectively. In this context, we utilized an automated fault discretization method to invert the finite coseismic slip model [28]. This approach iteratively discretizes the fault plane to account for the spatial variations of model resolution during the distributed slip inversion. The higher order Tikhonov Regularization strategy was adopted to stabilize the slip estimation, and the regularization factor was determined using the jRi strategy (Figure 5) to balance the regularization and perturbation errors [28]. Note that the regularization and perturbation errors reflect the difference between noise-free observations and regularized model results and the influence of observation noise on the inversion results, respectively.
The coseismic slip inversion results on a northwest dipping fault configuration indicate that the 2021 Nagqu earthquake ruptured on a fault structure with a length of ~15 km and a width of ~12 km (Figure 6). Coseismic slip mainly concentrates at 2−12 km in depth, and the maximum slip (~0.3 m) is located at a depth of ~8 km (Figure 6a). The coseismic fault slip reveals the comparable components of dip-slip and sinistral slip (Figure 6b,c) with a mean rake angle of −56° within the slip zone (>0.1 m). This illustrates that the 2021 Nagqu earthquake occurred within local transtensional tectonics. The absence of remarkable coseismic slip in shallow depth (0−2 km) suggests that the Nagqu earthquake may not have ruptured the surface (Figure 6). The predicted displacements from the best-fitting model explain both the ascending and descending coseismic observations well, with a Root Mean Square of ~0.7 cm (ascending) and ~0.5 cm (descending), respectively (Figure 2). The remaining residuals can be potentially explained by the residual topography and atmospheric artifacts. Assuming the average shear moduli of 33 GPa in the epicenter region [29], we calculated a geodetic moment as ~4.5 × 10¹⁷ Nm, corresponding to Mw 5.7. Our estimated coseismic slip distribution and moment magnitude are comparable with those reported in previous studies using the geodetic or seismological dataset (Table 1).

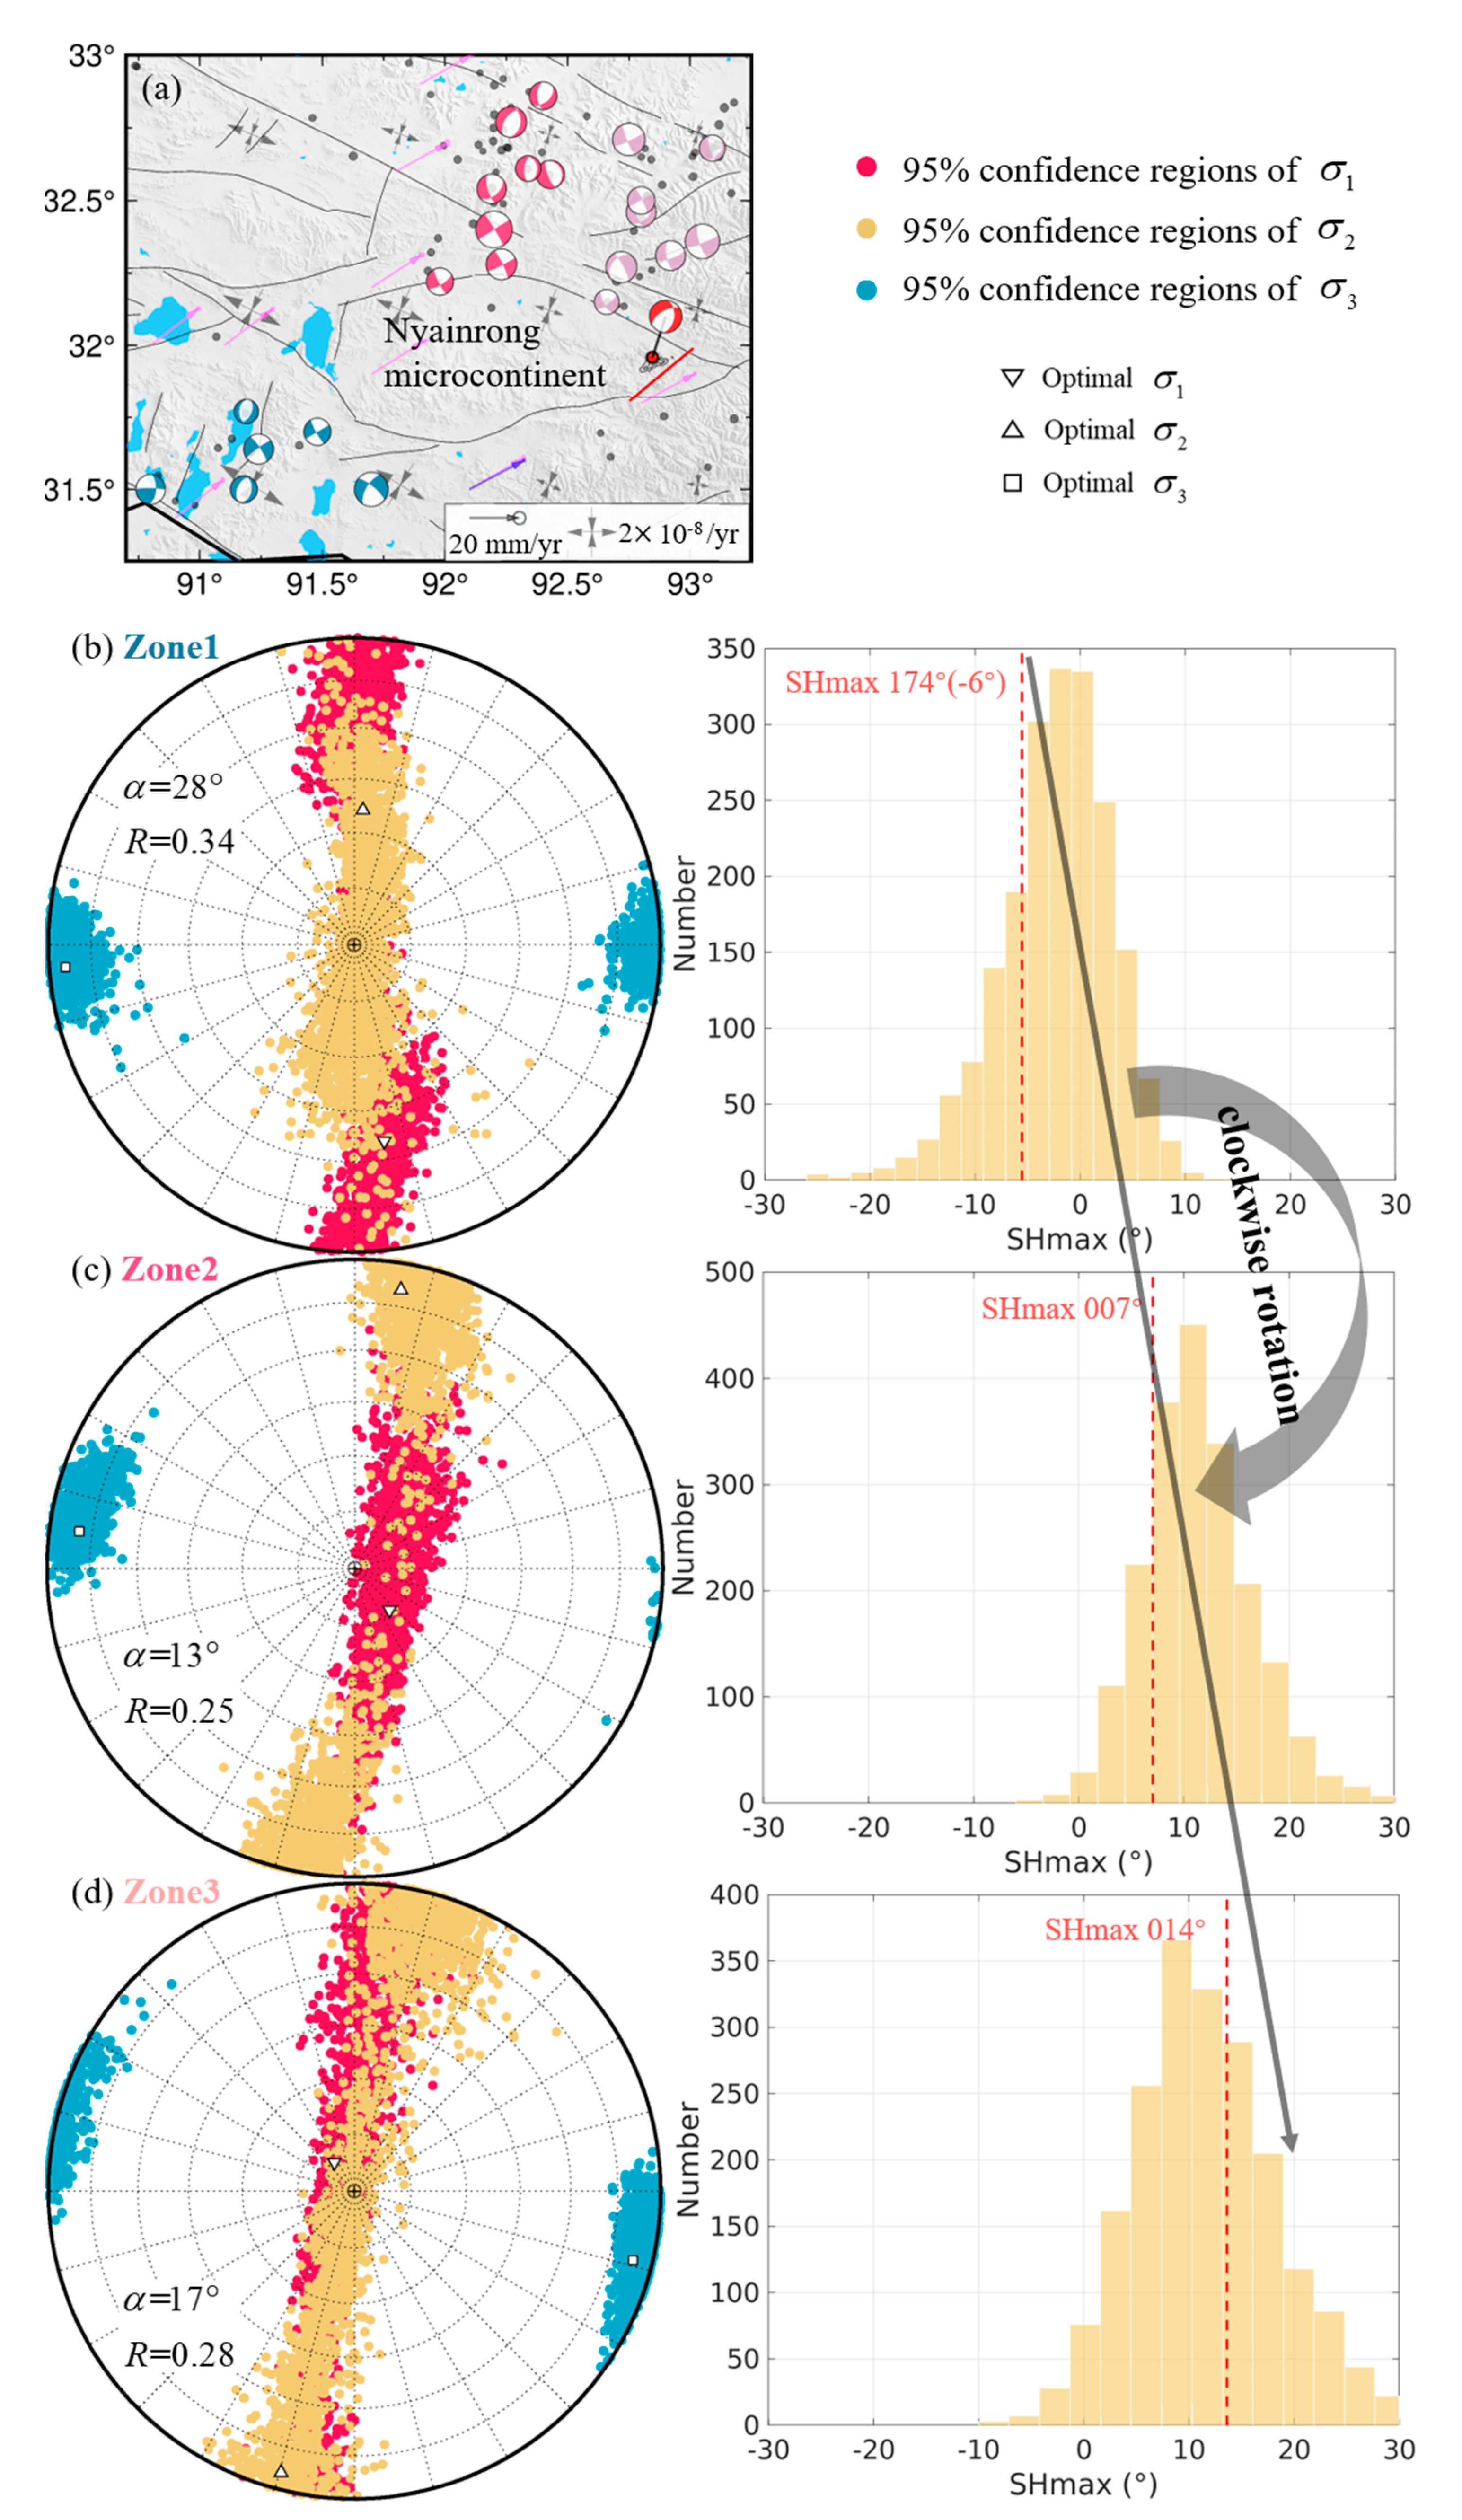
3. Stress Inversion from Local Focal Mechanisms

We estimated the local stress fields by the focal mechanisms during 1990−2019 from a previous study [11]. We focused on three event clusters (M 4.3), namely Zone 1–3, surrounding the Nyainrong microcontinent (Figure 7). Zone 1 is adjacent to the southwest region of the Nyainrong microcontinent, while Zone 2 and Zone 3 are adjacent to the northeastern region of the Nyainrong microcontinent (Figure 7). In total, 22 focal solutions were classified as six, eight, and eight records in Zone 1, Zone 2 and Zone 3, respectively (Table 4). We utilized an iterative joint inversion method [30] to calculate principal stresses σ 1 , σ 2   , σ 3 , and the stress ratio R = σ 1   σ 2 / σ 1   σ 3 , 0 < R < 1 representing the relative magnitudes of the principal stresses [31]. With the bootstrap resampling approach [32], this method allows for determining the 95% confidence intervals of an optimal stress tensor. To obtain the optimal stress parameters (Table 4), we estimated 2000 bootstrap samples with random noise of 10°. The average misfit angle α is the difference between the observed and predicted fault slip directions, which can be used to reflect the degree of stress heterogeneity and evaluate the performance of stress inversion.
Zone 1 is characterized by a near EW σ 1   orientation with a 36° plunge angle, a low R (0.34) value and near horizontal σ 3   (Figure 7b and Table 4). This implies that Zone 1 is dominated by a strike-slip (SS) stress regime according to Zoback’s classification scheme [33]. However, the plunge angles (~80°) of σ 1 axes in Zone 2 and Zone 3 are substantially larger than those in Zone 1. In addition, the near horizontal σ 2   and σ 3 in Zone 2 and Zone 3 also indicate that the northeastern zones are dominated by normal fault (NF) stress regime (Figure 7 and Table 4). However, the typical girdle distributions of the σ 1 / σ 2 samples and relatively low stress ratio R (~0.25), especially in Zone 3, indicate a stress permutation between σ 1   and σ 2 (Figure 7) [34]. These switches between σ 1   and σ 2   reflect the close correlation between strike-slip and normal faulting behaviors [34], resonating with different faulting behaviors in the study region (Figure 7). Considering the used focal mechanisms are within acceptable uncertainties, the larger misfit angle of 28° in Zone 1 than that of ~15° in Zone 2 and Zone 3, indicates the background tectonic stress fields in Zone 1 are higher heterogeneous [35]. The maximum horizontal stress (SHmax), estimated based on the method proposed by Lund and Townend [36], shows the directions of SHmax in the three subzones are directed on near north–south (Figure 7 and Table 4). However, the striking clockwise rotation of SHmax is obvious from Zone 1 to Zone 3. This stress clockwise rotation from southwest to northeast is consistent with the clockwise rotation of GNSS velocity [8].

4. Discussion

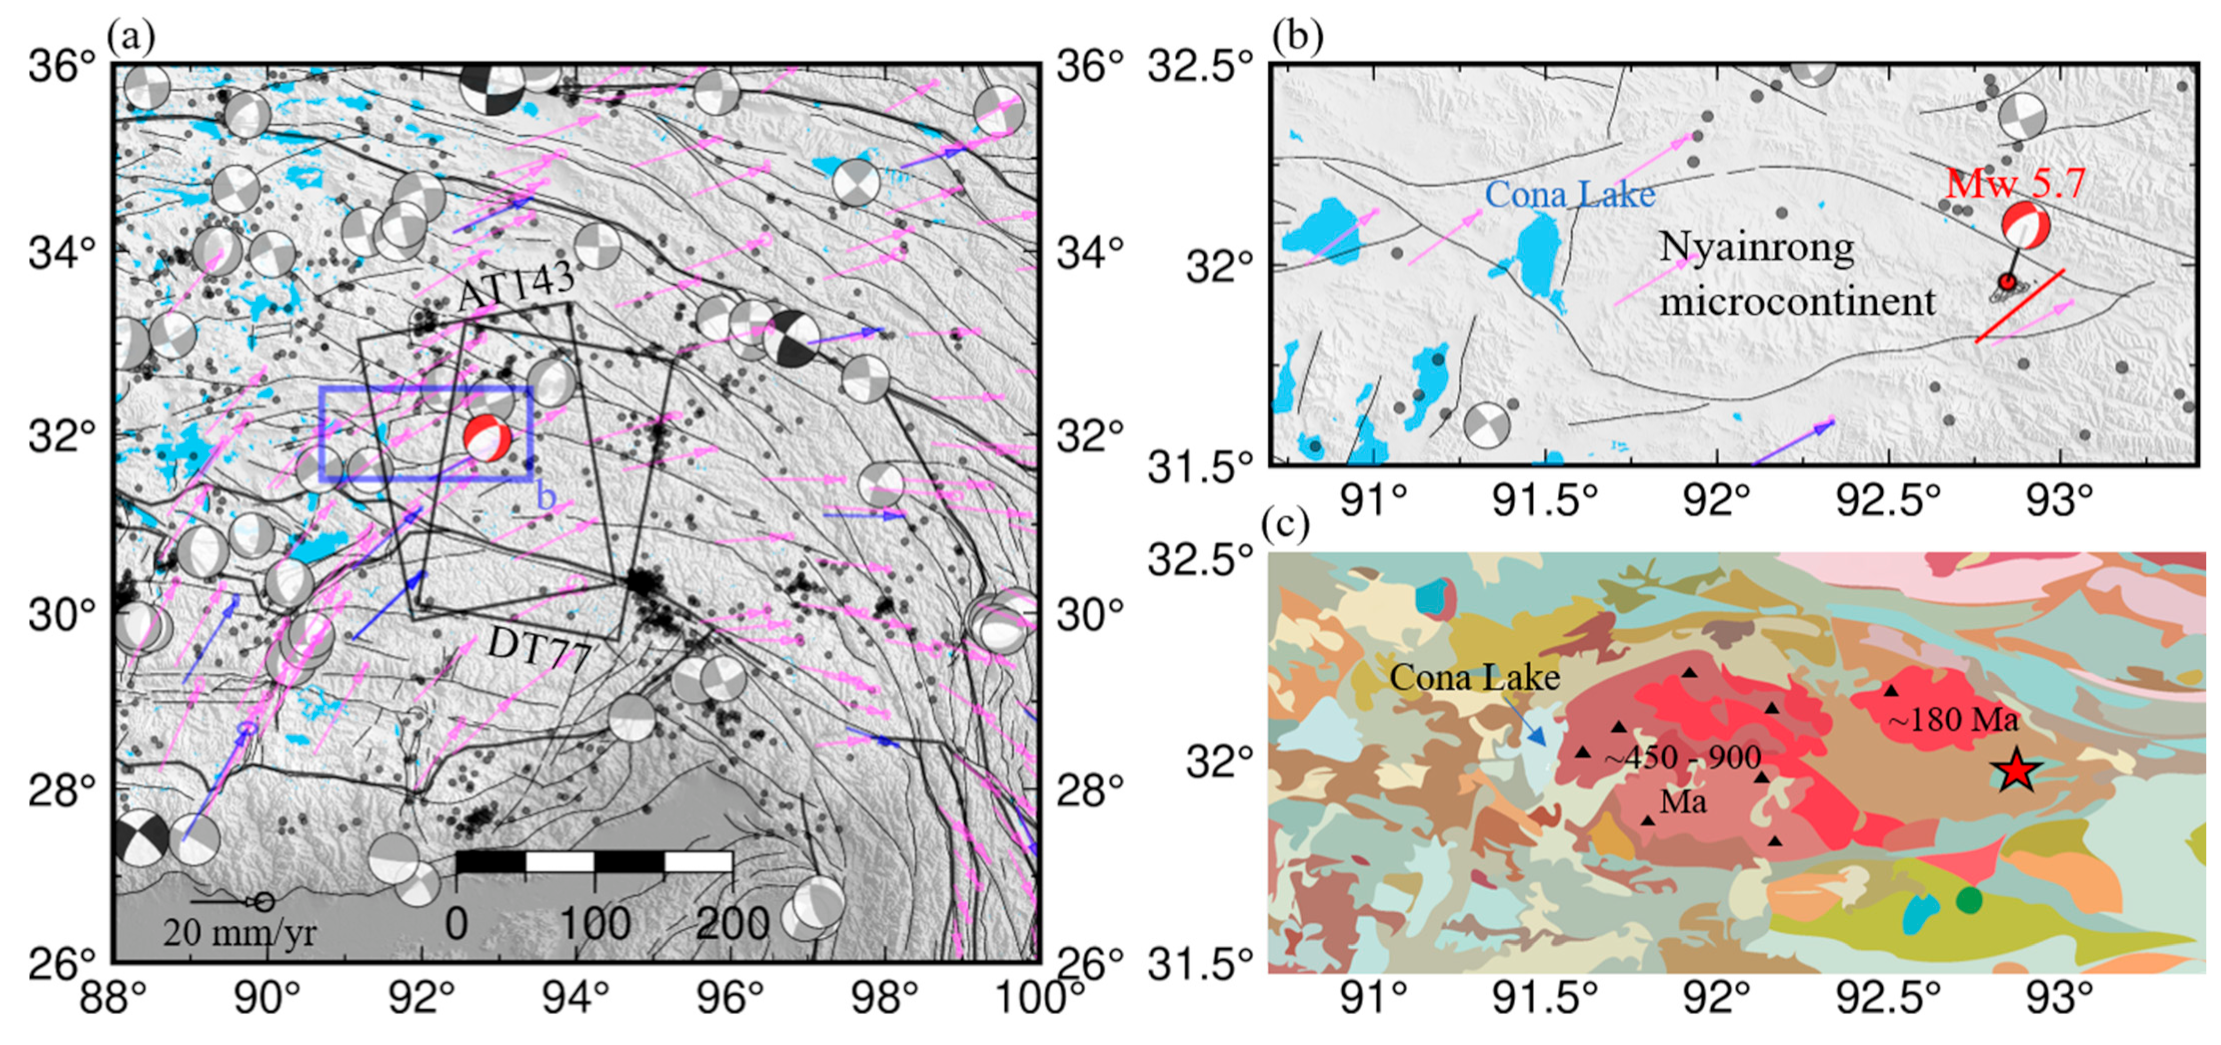
4.1. Origins of the 2021 Nagqu Earthquake

The collision of the India–Eurasia plates caused widespread Cenozoic deformation throughout the Tibetan Plateau and its surrounding regions [37,38]. The east–west extension and the north–south shortening has dominated crust deformation in the Tibetan Plateau from the Neogene to the present day, along with the ongoing convergence that occurs at the Tibetan Plateau margin [39,40]. Thus, the forces driving the India–Eurasia plate collision are suggested as the fundamental driving force for the occurrence of the 2021 Nagqu event. Seismo-tomographic results corroborate the suggestion that the eastward extension resulted from the eastward movement of the lower crust and/or upper mantle [41,42]. In addition, the fact that about 85% of movement release of normal faulting over the last half century has occurred in the region with high altitudes (>5 km), suggests variations in the gravitational potential energy of the lithosphere are likely responsible for material extension [43].
As the 2021 Nagqu Mw 5.7 earthquake is the largest ever recorded event within the Nyainrong microcontinent, this indicates a relatively low frequency of strong earthquakes inside the microcontinent. The earthquake occurred within the ancient (~170−900 Ma) Nyainrong microcontinent [1,2,3,4], containing rocks with a distinct lithology (e.g., orthogneiss) from the surrounding sedimentary rocks (Figure 1). Thus, the Nyainrong microcontinent may impede lateral material movement, forcing the material to detour around it. Consequently, the accumulated tectonic strain at the boundary modulates the local geodynamic process, which helps explain why strong earthquakes are rare within the Nyainrong microcontinent. This is similar to the special structure, namely the Emeishan large igneous province, in the southeast Tibetan Plateau. Few strong earthquakes occurred in this special structure with similar detoured crustal flow [44,45], which played a vital role in the occurrence of the 2021 Mw 6.1 Yangbi earthquake [46]. Similarly, the microplates Shillong Plateau and Assam Basin play an essential role in controlling the regional seismicity patterns (i.e., sparse seismic activity and small magnitude), as previously indicated by the numerical block-and-fault dynamics model [47]. This provides a reasonable explanation for the rare moderate–strong earthquakes recorded inside the Nyainrong microcontinent.
In light of the above analysis, we suggest that the north–south shortening, the east–west extension, and the ancient Nyainrong microcontinent are jointly involved in controlling the occurrence of the 2021 Nagqu Mw 5.7 earthquake. The north–south shortening and east–west extension formed stress on the Nyainrong microcontinent (Figure 8), which is constituted of rigid basement rock that has substantially lower tensile strength than compressive strength [48] and is vulnerable to normal faulting behavior. This explains the normal faulting with a strike-slip component in the interior of the Nyainrong microcontinent, especially in the corner region where the strike direction of boundary faults changes considerably and is conducive to stress accumulation and eventually becomes the nucleation site of the 2021 Nagqu earthquake. Interestingly, this phenomenon is consistent with the normal faulting (i.e., Cona Lake) in the west counterpart of the Nyainrong microcontinent (Figure 8).

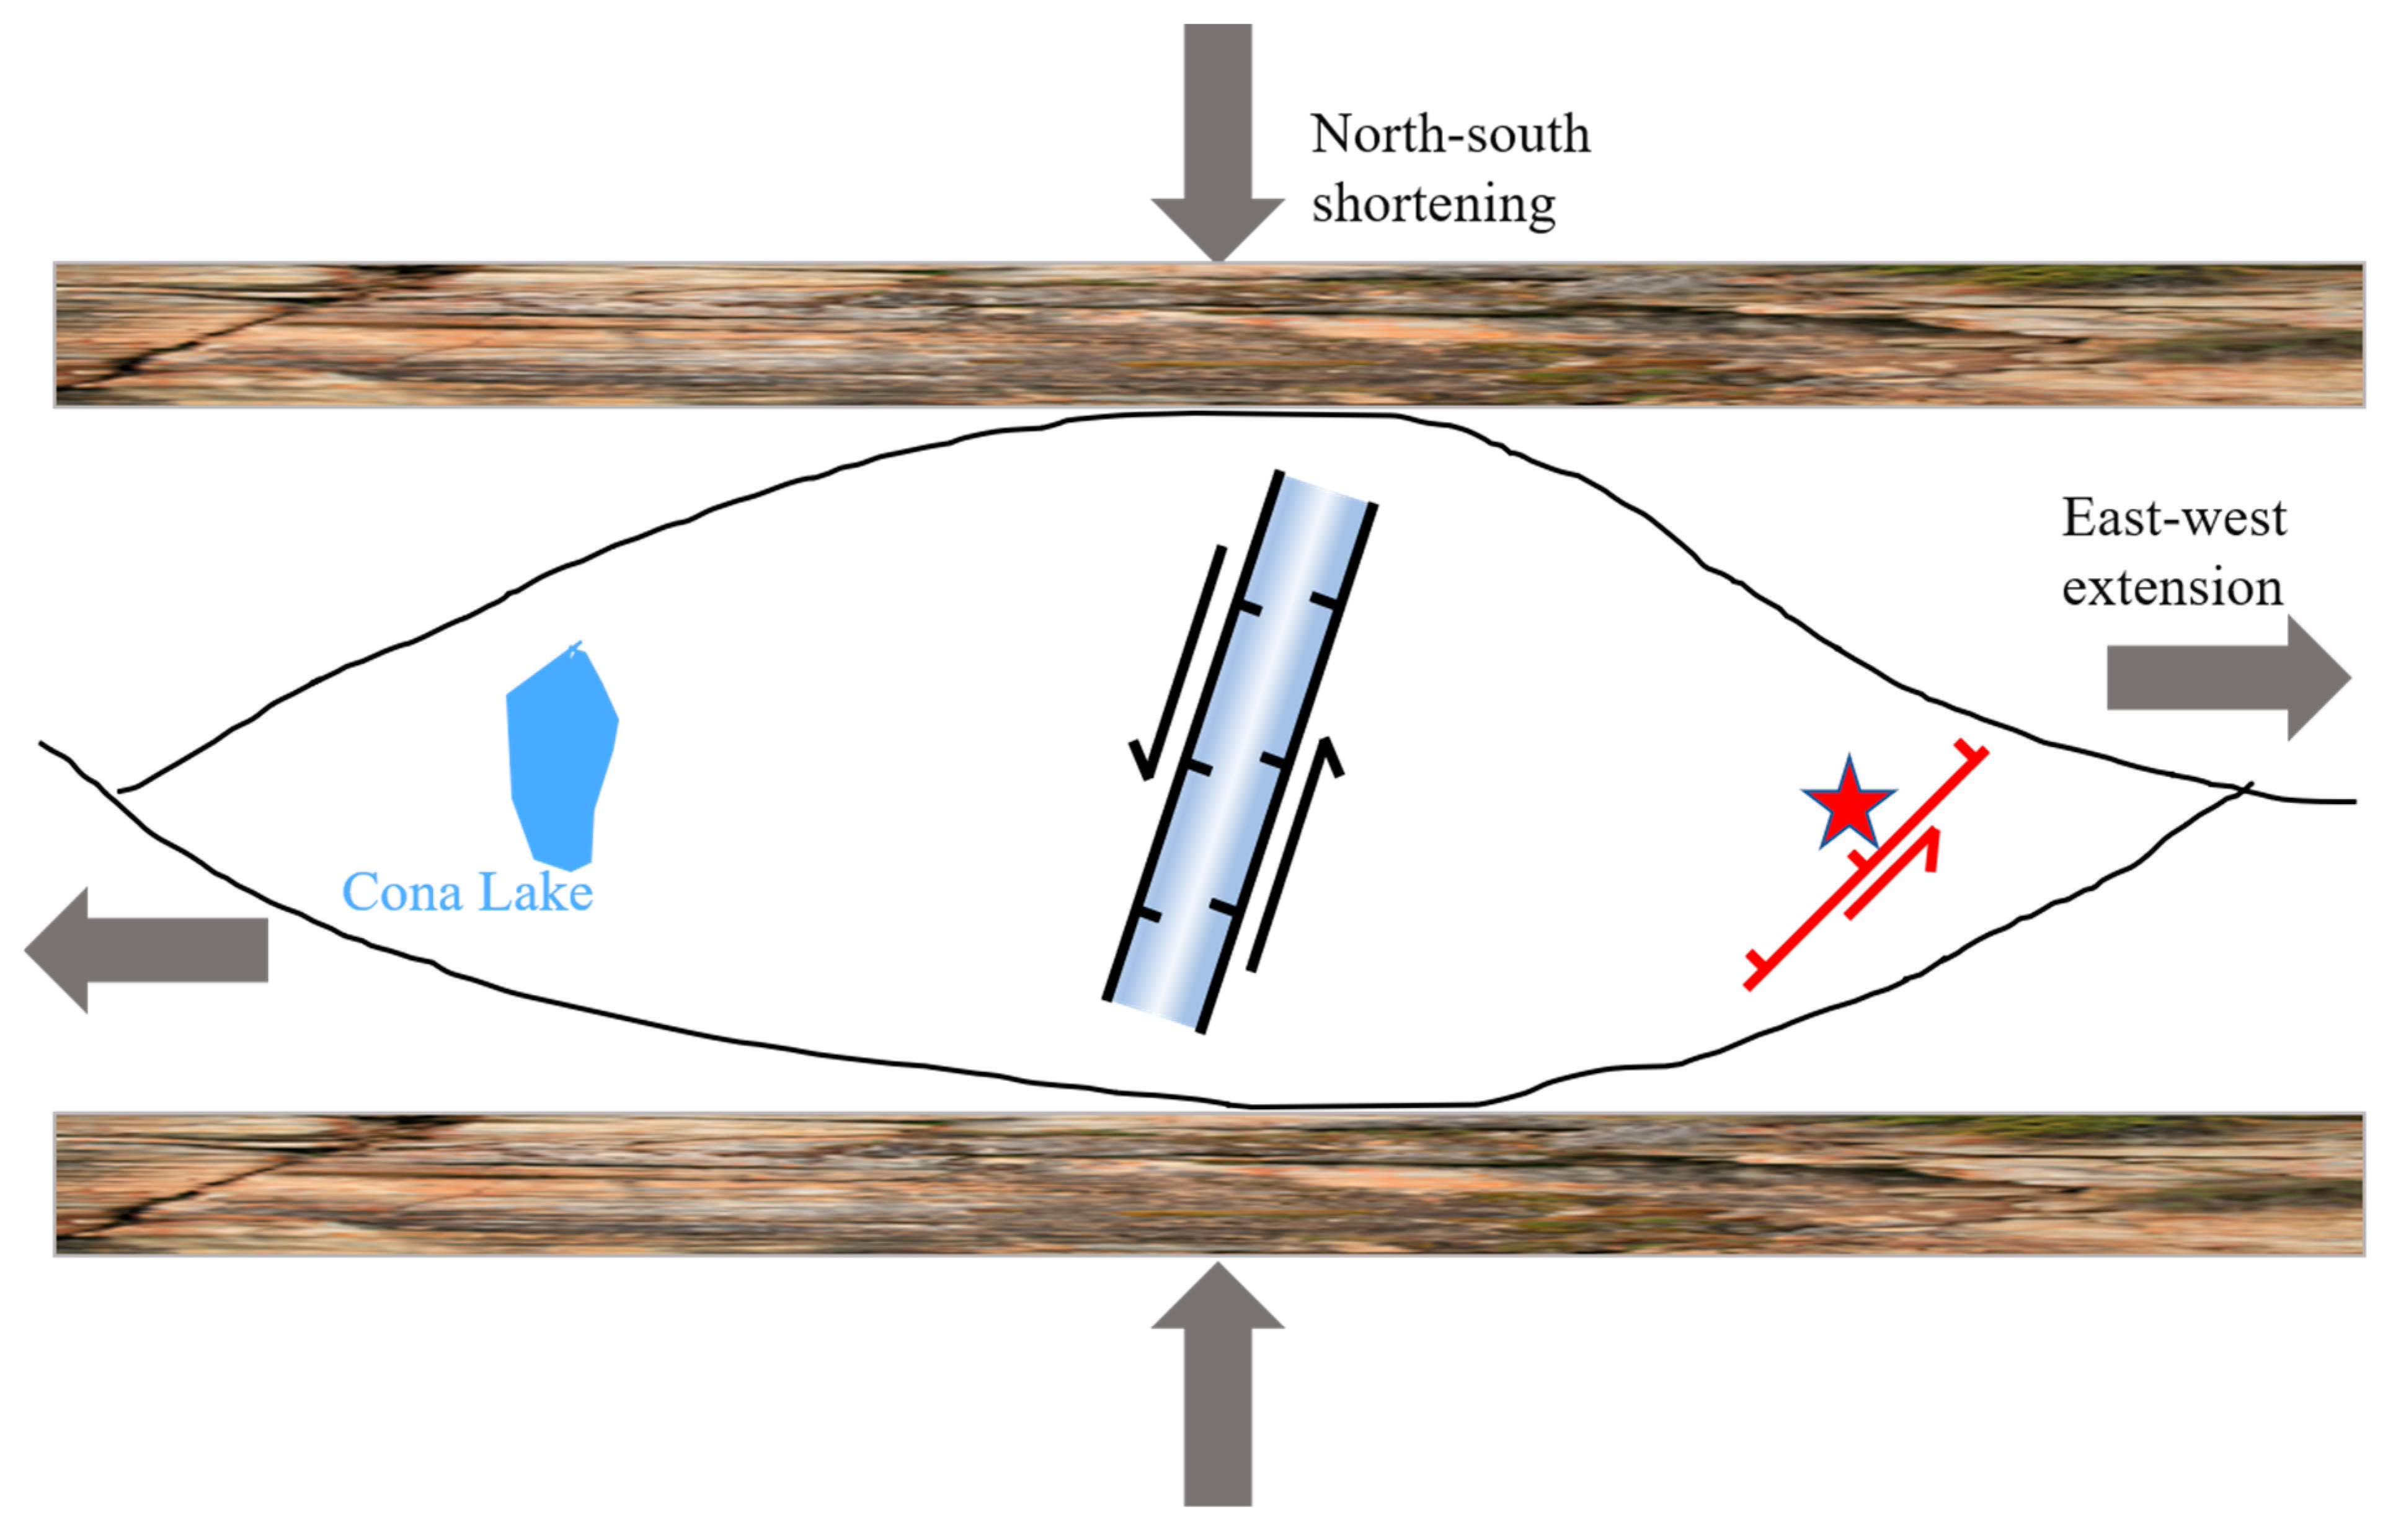
4.2. Implication of the Nyainrong Microcontinent on Strain Partitioning and Stress Heterogeneous

Previous studies have reported that strain partitioning across faults is a widespread phenomenon in the Tibetan Plateau [42,49,50,51,52,53]. According to wave speed models derived from dense seismographs, significant differences in structure and rheology are discerned across large faults in the eastern Tibetan Plateau [42], which indicates strain partitioning across major faults. Block kinematic modeling based on the GNSS velocity field reveals strain partitioning on major fault structures in the northeast Tibetan Plateau [49]. Joint GNSS–InSAR data models reveal strain partitioning along the Altyn Tagh Fault and the Jinsha suture zone in the northwestern Tibetan Plateau [51]. In the southeast Tibetan Plateau, quantitative kinematical data of main faults along the Sichuan–Yunnan block from photogrammetric, geomorphological, and chronological methods, reveal dip-slip components in many fault segments while they are strike-slip dominated [52]. Earthquake focal mechanisms in the Tibetan Plateau indicate that deformation is dominated by thrust faulting in the margin of the Tibetan Plateau, normal faulting in the southern Tibetan Plateau and strike-slip faulting in the northern Tibetan Plateau (Figure 1) [45,50,51].
The inverted stress fields of three subzones surrounding the Nyainrong microcontinent (Figure 7) allow for exploring the effect of local structure (i.e., the Nyainrong microcontinent) on stress/strain partitioning. Zone 1 is under a strike-slip regime, which contrasts with the widespread normal faulting and dip-slip events in the further southwest region (Figure 1 and Figure 7). While both Zone 2 and Zone 3 are under the stress regime of normal faulting, which contrasts with the widespread strike-slip faulting and events in the further northeast region (Figure 1 and Figure 7). In comparison, our slip model indicates a transtensional slip in the interior of the Nyainrong microcontinent (Figure 6). The NE–SW variation in faulting behavior across the Nyainrong microcontinent is potentially associated with the obstruction of the Nyainrong microcontinent, which transforms the strain behavior around the margin of the Nyainrong microcontinent. This implies that the Nyainrong microcontinent may play an important role in the transformation of stress/strain behavior (i.e., different faulting behaviors). In addition, a striking clockwise rotation (~20°) of SHmax from Zone 1 to Zone 3 (Figure 7) shows a good agreement with the clockwise rotation of GNSS velocity [8]. Small magnitude events (M < 6.2) are not statistically considered to induce SHmax rotation [54,55]. Thus, stress rotation, caused by a coseismic slip is unlikely to be the scenario observed in this study due to the small event magnitude (M < 6.2) in these three subzones. The spatial relationship between the three subzones and the Nyainrong microcontinent indicates that special structures with distinctly different lithology compared to the surrounding region play an essential role in controlling the stress rotation. This is consistent with the structure controls (e.g., fault structure geometry, contrasting rheology/lithology) in stress behavior proposed in other regions [56,57,58,59,60,61,62].
Thus, being inspired by the 2021 Nagqu Mw 5.7, we conclude that the Nyainrong microcontinent plays a key role in controlling the occurrence of the earthquake and the surrounding strain partitioning (i.e., different faulting behaviors), as well as affecting the stress heterogeneity. Although these ancient structures are not susceptible to internal nucleation of strong earthquakes, the surrounding and corner regions are more prone to stress accumulation and represent highly seismic areas. The 1:1.5 million geological maps of the Tibetan Plateau and its surrounding areas demonstrate multiple similar structures such as the Nyainrong microcontinent [10]. Thus, it is of great significance to consider the effect of these special structures on strain partitioning in future research for deepening our understanding of the evolution, seismogenic mechanism and the dynamic process of the Tibetan Plateau.

5. Conclusions

In this study, we use surface displacement fields retrieved from InSAR data to explore the seismogenic fault geometry and distributed coseismic slip for the 2021 Mw 5.7 Nagqu earthquake that occurred in the east corner zone of the Nyainrong microcontinent. The 2D displacement maps decomposed with both ascending and descending InSAR data, reveal the maximum surface subsidence of ~3 cm at the hanging wall as well as up to 1.5 cm displacement in the strike direction. We find that the InSAR observations can be best explained by the fault slip on a seismogenic fault with a strike of 240° and a dip angle of 59°. Coseismic slip is featured by normal faulting and a comparable sinistral strike-slip component with a peak value of 0.3 m at 8 km depth. The ancient Nyainrong microcontinent, as well as the north–south shortening and east–west extension during the India–Eurasia collision both contribute to the occurrence of the 2021 Nagqu Mw 5.7 earthquake. The stress inversion results of three subzones surrounding the Nyainrong microcontinent reveal a distinct strike-slip stress regime in the southwest region and a normal faulting stress regime in the northeast region. This regional stress and strain heterogeneity highlights the significant modulation from the Nyainrong microcontinent on the occurrence of the 2021 Nagqu earthquake. Thus, the Nyainrong microcontinent plays an essential role in the regional tectonic evolution. Despite these promising results, further studies are needed to quantify the effect of special structures such as the Nyainrong microcontinent on the earthquake nucleation process, strain partitioning and stress heterogeneity through numerical simulation using the finite element method and laboratory experiments in rock physics.

Author Contributions

Conceptualization, X.L.; Data curation, X.L.; Formal analysis, X.L., L.X. and Y.L.; Funding acquisition, W.X.; Investigation, X.L.; Methodology, X.L.; Resources, X.L., L.X., Y.L. and W.X.; Software, X.L.; Supervision, W.X.; Validation, X.L., L.X. and Z.C.; Visualization, X.L. and B.H.; Writing—original draft, X.L.; Writing—review and editing, X.L., L.X., Y.L., B.H., Z.C. and W.X. All authors have read and agreed to the published version of the manuscript.

Funding

This work was supported by the National Natural Science Foundation of China (No. 42174023).

Data Availability Statement

The Sentinel-1 data used in this study are available from the European Space Agency (https://scihub.copernicus.eu/dhus/#/home). The local focal mechanisms used for stress inversion are available from the National Earthquake Data Center (https://data.earthquake.cn/datashare/report.shtml?PAGEID=datasourcelist&dt=40280d0453e5add30153e5c06392000b). The GAMMA commercial software was obtained from https://www.gamma-rs.ch/software. The GBIS software was obtained from https://comet.nerc.ac.uk/gbis/. The distributed slip inversion package is available from https://myweb.uiowa.edu/wbarnhart/software.html. The iterative joint stress inversion software was obtained from https://www.ig.cas.cz/en/stress-inverse/. Regional faults were obtained from http://datashare.igl.earthquake.cn/map/ActiveFault/introFault.html. All the data and websites were last accessed on 15 July 2022.

Acknowledgments

The authors are deeply indebted to the Editor and four anonymous reviewers for their constructive reviews and comments. The authors would also like to extend our sincere thanks to Xingjun Luo and Xianghua Liu for their valuable suggestions, data sharing and communications during the development of this work. Figures were created using the Generic Mapping Tools [63] and Matlab software (https://www.mathworks.com/products/matlab.html).

Conflicts of Interest

The authors declare no conflict of interest.

References

  1. Guynn, J.H.; Kapp, P.; Pullen, A.; Heizler, M.; Gehrels, G.; Ding, L. Tibetan basement rocks near Amdo reveal “missing” Mesozoic tectonism along the Bangong suture, central Tibet. Geology 2006, 34. [Google Scholar] [CrossRef]
  2. Xie, C.; Li, C.; Su, L.; Wu, Y.; Xie, Y. Pan-African and early Paleozoic tectonothermal events in the Nyainrong microcontinent: Constraints from geochronology and geochemistry. Sci. China Earth Sci. 2013, 56, 2066–2079. [Google Scholar] [CrossRef]
  3. Zhang, X.; Shi, R.; Huang, Q.; Liu, D.; Gong, X.; Chen, S.; Wu, K.; Yi, G.; Sun, Y.; Ding, L. Early Jurassic high-pressure metamorphism of the Amdo terrane, Tibet: Constraints from zircon U–Pb geochronology of mafic granulites. Gondwana Res. 2014, 26, 975–985. [Google Scholar] [CrossRef]
  4. Chen, S.-S.; Shi, R.-D.; Fan, W.-M.; Gong, X.-H.; Wu, K. Early Permian mafic dikes in the Nagqu area, central Tibet, China, associated with embryonic oceanic crust of the Meso-Tethys Ocean. J. Geophys. Res. Solid Earth 2017, 122, 4172–4190. [Google Scholar] [CrossRef]
  5. Pusok, A.E.; Stegman, D.R. The convergence history of India-Eurasia records multiple subduction dynamics processes. Sci. Adv. 2020, 6, eaaz8681. [Google Scholar] [CrossRef]
  6. Yin, A.; Harrison, T.M. Geologic evolution of the Himalayan-Tibetan orogen. Annu. Rev. Earth Planet. Sci. 2000, 28, 211–280. [Google Scholar] [CrossRef] [Green Version]
  7. Global Centroid Moment Tensor. Available online: https://www.globalcmt.org/ (accessed on 13 July 2022).
  8. Zhao, B.; Huang, Y.; Zhang, C.; Wang, W.; Tan, K.; Du, R. Crustal deformation on the Chinese mainland during 1998–2014 based on GPS data. Geod. Geodyn. 2015, 6, 7–15. [Google Scholar] [CrossRef] [Green Version]
  9. National Tibetan Plateau Data Center. Available online: https://data.tpdc.ac.cn/zh-hans/data/7fee8675-d4ab-4f97-8bbf-269e20b7ac16/?q= (accessed on 13 July 2022).
  10. 1:1.5 Million Geological Map of Tibetan Plateau and Its Surrounding Areas; National Tibetan Plateau Data Center, Geological Publishing House GPH.: Beijing, China, 2019.
  11. Li, Y.; Li, Y.; Hu, X.; Liu, H. Fault Geometry and Mechanism of the Mw 5.7 Nakchu Earthquake in Tibet Inferred from InSAR Observations and Stress Measurements. Remote Sens. 2021, 13, 5142. [Google Scholar] [CrossRef]
  12. Li, Y.; Shao, Z.; Hu, X.; FuQiang, S.; Liu, H.; Chen, L. Stress and strain characteristics in the seismic region of the M6. 1 Nakchu earthquake on March 19, 2021 and their geodynamic implications. Chin. J. Geophys. 2022, 65, 673–685. [Google Scholar] [CrossRef]
  13. Arsen’yev, S.A.; Eppelbaum, L.V.; Meirova, T. Earthquake Processes: A View from Synergetics and the Theory of Catastrophes. Pure Appl. Geophys. 2019, 176, 3377–3390. [Google Scholar] [CrossRef]
  14. Scholz, C.H. The Mechanics of Earthquakes and Faulting; Cambridge University Press: Oxford City, UK, 2019. [Google Scholar]
  15. World Weather Online. Available online: https://www.worldweatheronline.com (accessed on 13 July 2022).
  16. Liu, X.; Xu, W. Logarithmic Model Joint Inversion Method for Coseismic and Postseismic Slip: Application to the 2017 Mw 7.3 Sarpol Zahāb Earthquake, Iran. J. Geophys. Res. Solid Earth 2019, 124, 12034–12052. [Google Scholar] [CrossRef] [Green Version]
  17. Li, S.; Xu, W.; Li, Z. Review of the SBAS InSAR Time-series algorithms, applications, and challenges. Geod. Geodyn. 2022, 13, 114–126. [Google Scholar] [CrossRef]
  18. Wegnüller, U.; Werner, C.; Strozzi, T.; Wiesmann, A.; Frey, O.; Santoro, M. Sentinel-1 Support in the GAMMA Software. Procedia Comput. Sci. 2016, 100, 1305–1312. [Google Scholar] [CrossRef] [Green Version]
  19. Farr, T.G.; Rosen, P.A.; Caro, E.; Crippen, R.; Duren, R.; Hensley, S.; Kobrick, M.; Paller, M.; Rodriguez, E.; Roth, L.; et al. The Shuttle Radar Topography Mission. Rev. Geophys. 2007, 45. [Google Scholar] [CrossRef] [Green Version]
  20. Li, Z.W.; Ding, X.L.; Huang, C.; Zhu, J.J.; Chen, Y.L. Improved filtering parameter determination for the Goldstein radar interferogram filter. ISPRS J. Photogramm. Remote Sens. 2008, 63, 621–634. [Google Scholar] [CrossRef]
  21. Chen, C.W.; Zebker, H.A. Two-dimensional phase unwrapping with use of statistical models for cost functions in nonlinear optimization. J. Opt. Soc. Am. A Opt. Image Sci. Vis. 2001, 18, 338–351. [Google Scholar] [CrossRef] [PubMed] [Green Version]
  22. Xu, W.; Rivalta, E.; Li, X. Magmatic architecture within a rift segment: Articulate axial magma storage at Erta Ale volcano, Ethiopia. Earth Planet. Sci. Lett. 2017, 476, 79–86. [Google Scholar] [CrossRef]
  23. Hu, J.; Li, Z.W.; Ding, X.L.; Zhu, J.J.; Zhang, L.; Sun, Q. Resolving three-dimensional surface displacements from InSAR measurements: A review. Earth-Sci. Rev. 2014, 133, 1–17. [Google Scholar] [CrossRef]
  24. Bagnardi, M.; Hooper, A. Inversion of Surface Deformation Data for Rapid Estimates of Source Parameters and Uncertainties: A Bayesian Approach. Geochem. Geophys. Geosystems 2018, 19, 2194–2211. [Google Scholar] [CrossRef]
  25. Decriem, J.; Árnadóttir, T.; Hooper, A.; Geirsson, H.; Sigmundsson, F.; Keiding, M.; Ófeigsson, B.; Hreinsdóttir, S.; Einarsson, P.; LaFemina, P. The 2008 May 29 earthquake doublet in SW Iceland. Geophys. J. Int. 2010, 181, 1128–1146. [Google Scholar] [CrossRef] [Green Version]
  26. Okada, Y. Surface deformation due to shear and tensile faults in a half-space. Bull. Seismol. Soc. Am. 1985, 75, 1135–1154. [Google Scholar] [CrossRef]
  27. Mosegaard, K.; Tarantola, A. Monte Carlo sampling of solutions to inverse problems. J. Geophys. Res. Solid Earth 1995, 100, 12431–12447. [Google Scholar] [CrossRef]
  28. Barnhart, W.; Lohman, R. Automated fault model discretization for inversions for coseismic slip distributions. J. Geophys. Res. Solid Earth 2010, 115. [Google Scholar] [CrossRef]
  29. Laske, G.; Masters, G.; Ma, Z.; Pasyanos, M. Update on CRUST1. 0—A 1-degree global model of Earth’s crust. Geophys. Res. Abstr. 2013, 15, 2658. [Google Scholar]
  30. Vavryčuk, V. Iterative joint inversion for stress and fault orientations from focal mechanisms. Geophys. J. Int. 2014, 199, 69–77. [Google Scholar] [CrossRef]
  31. Warren-Smith, E.; Fry, B.; Wallace, L.; Chon, E.; Henrys, S.; Sheehan, A.; Mochizuki, K.; Schwartz, S.; Webb, S.; Lebedev, S. Episodic stress and fluid pressure cycling in subducting oceanic crust during slow slip. Nat. Geosci. 2019, 12, 475–481. [Google Scholar] [CrossRef]
  32. Michael, A.J. Use of focal mechanisms to determine stress: A control study. J. Geophys. Res. 1987, 92, 357–368. [Google Scholar] [CrossRef]
  33. Zoback, M.L. First- and second-order patterns of stress in the lithosphere: The World Stress Map Project. J. Geophys. Res. 1992, 97, 11703–11728. [Google Scholar] [CrossRef]
  34. Hu, J.-C.; Angelier, J. Stress permutations: Three-dimensional distinct element analysis accounts for a common phenomenon in brittle tectonics. J. Geophys. Res. Solid Earth 2004, 109. [Google Scholar] [CrossRef] [Green Version]
  35. Michael, A.J. Spatial variations in stress within the 1987 Whittier Narrows, California, aftershock sequence: New techniques and results. J. Geophys. Res. Solid Earth 1991, 96, 6303–6319. [Google Scholar] [CrossRef]
  36. Lund, B.; Townend, J. Calculating horizontal stress orientations with full or partial knowledge of the tectonic stress tensor. Geophys. J. Int. 2007, 170, 1328–1335. [Google Scholar] [CrossRef] [Green Version]
  37. Molnar, P.; Tapponnier, P. Cenozoic tectonics of Asia: Effects of a continental collision. Science 1975, 189, 419–426. [Google Scholar] [CrossRef] [PubMed]
  38. Avouac, J.P.; Tapponnier, P. Kinematic model of active deformation in central Asia. Geophys. Res. Lett. 1993, 20, 895–898. [Google Scholar] [CrossRef] [Green Version]
  39. Zhang, P.-Z.; Shen, Z.; Wang, M.; Gan, W.; Buürgmann, R.; Molnar, P.; Wang, Q.; Niu, Z.; Sun, J.; Wu, J. Continuous deformation of the Tibetan Plateau from global positioning system data. Geology 2004, 32, 809–812. [Google Scholar] [CrossRef]
  40. Ge, W.P.; Molnar, P.; Shen, Z.K.; Li, Q. Present-day crustal thinning in the southern and northern Tibetan plateau revealed by GPS measurements. Geophys. Res. Lett. 2015, 42, 5227–5235. [Google Scholar] [CrossRef]
  41. XU, J.; ZHAO, Z. Normal faulting type earthquake activities in the Tibetan plateau and its tectonic implication. Acta Geol. Sin. -Engl. Ed. 2010, 84, 135–144. [Google Scholar] [CrossRef]
  42. Liu, Q.Y.; van der Hilst, R.D.; Li, Y.; Yao, H.J.; Chen, J.H.; Guo, B.; Qi, S.H.; Wang, J.; Huang, H.; Li, S.C. Eastward expansion of the Tibetan Plateau by crustal flow and strain partitioning across faults. Nat. Geosci. 2014, 7, 361–365. [Google Scholar] [CrossRef]
  43. Elliott, J.R.; Walters, R.J.; England, P.C.; Jackson, J.A.; Li, Z.; Parsons, B. Extension on the Tibetan plateau: Recent normal faulting measured by InSAR and body wave seismology. Geophys. J. Int. 2010, 183, 503–535. [Google Scholar] [CrossRef] [Green Version]
  44. Liu, Y.; Yao, H.J.; Zhang, H.J.; Fang, H.J. The Community Velocity Model V.1.0 of Southwest China, Constructed from Joint Body- and Surface-Wave Travel-Time Tomography. Seismol. Res. Lett. 2021, 92, 2972–2987. [Google Scholar] [CrossRef]
  45. Huang, Z.; Ji, C.; Wu, H.; Shi, Y.; Geng, J.; Xu, M.; Han, C.; Wang, L. Reviews on the crustal structures and deformations in the southeastern margin of the Tibetan plateau. Rev. Geophys. Planet. Phys. 2021, 52, 291–307. [Google Scholar] [CrossRef]
  46. Liu, X.; Xu, W.; He, Z.; Fang, L.; Chen, Z. Aseismic Slip and Cascade Triggering Process of Foreshocks Leading to the 2021 Mw 6.1 Yangbi Earthquake. Seismol. Res. Lett. 2022, 93, 1413–1428. [Google Scholar] [CrossRef]
  47. Vorobieva, I.; Gorshkov, A.; Mandal, P. Modelling the seismic potential of the Indo-Burman megathrust. Sci. Rep. 2021, 11, 1–13. [Google Scholar] [CrossRef] [PubMed]
  48. Cadoni, E. Dynamic Characterization of Orthogneiss Rock Subjected to Intermediate and High Strain Rates in Tension. Rock Mech. Rock Eng. 2010, 43, 667–676. [Google Scholar] [CrossRef] [Green Version]
  49. Pan, Z.; Zhang, Z.; Shao, Z.; Zhao, G. Block motions and strain partition on active faults in Northeast Tibet and their geodynamic implications. Terra Nova 2021, 33, 356–363. [Google Scholar] [CrossRef]
  50. Seeber, L.; Pêcher, A. Strain partitioning along the Himalayan arc and the Nanga Parbat antiform. Geology 1998, 26, 791–794. [Google Scholar] [CrossRef]
  51. Daout, S.; Doin, M.P.; Peltzer, G.; Lasserre, C.; Socquet, A.; Volat, M.; Sudhaus, H. Strain partitioning and present-day fault kinematics in NW Tibet from Envisat SAR interferometry. J. Geophys. Res. Solid Earth 2018, 123, 2462–2483. [Google Scholar] [CrossRef]
  52. Gui-Hua, C.; Xi-Wei, X.; Xue-Ze, W.; Ya-li, W. Kinematical transformation and slip partitioning of northern to eastern active boundary belt of Sichuan-Yunnan block. Seismol. Egology 2008, 30, 58. [Google Scholar]
  53. Li, Y.C.; Shan, X.J.; Qu, C.Y.; Zhang, Y.F.; Song, X.G.; Jiang, Y.; Zhang, G.H.; Nocquet, J.M.; Gong, W.Y.; Gan, W.J.; et al. Elastic block and strain modeling of GPS data around the Haiyuan-Liupanshan fault, northeastern Tibetan Plateau. J. Asian Earth Sci. 2017, 150, 87–97. [Google Scholar] [CrossRef]
  54. Sheng, S.; Meng, L. Stress Field Variation During the 2019 Ridgecrest Earthquake Sequence. Geophys. Res. Lett. 2020, 47, e2020GL087722. [Google Scholar] [CrossRef]
  55. Hardebeck, J.L.; Okada, T. Temporal stress changes caused by earthquakes: A review. J. Geophys. Res. Solid Earth 2018, 123, 1350–1365. [Google Scholar] [CrossRef]
  56. Liu, X.; Xu, W.; Radziminovich, N.A.; Fang, N.; Xie, L. Transtensional coseismic fault slip of the 2021 Mw 6.7 Turt Earthquake and heterogeneous tectonic stress surrounding the Hovsgol Basin, Northwest Mongolia. Tectonophysics 2022, 836, 229407. [Google Scholar] [CrossRef]
  57. Petit, C.; Déverchère, J.; Houdry, F.; San'kov, V.A.; Melnikova, V.I.; Delvaux, D. Present-day stress field changes along the Baikal rift and tectonic implications. Tectonics 1996, 15, 1171–1191. [Google Scholar] [CrossRef] [Green Version]
  58. Yale, D.P. Fault and stress magnitude controls on variations in the orientation of in situ stress. Geol. Soc. Lond. Spec. Publ. 2003, 209, 55–64. [Google Scholar] [CrossRef]
  59. Wileveau, Y.; Cornet, F.; Desroches, J.; Blumling, P. Complete in situ stress determination in an argillite sedimentary formation. Phys. Chem. Earth Parts A/B/C 2007, 32, 866–878. [Google Scholar] [CrossRef]
  60. Barbot, S.; Fialko, Y.; Sandwell, D. Three-dimensional models of elastostatic deformation in heterogeneous media, with applications to the Eastern California Shear Zone. Geophys. J. Int. 2009, 179, 500–520. [Google Scholar] [CrossRef] [Green Version]
  61. Wilson, P.; Hodgetts, D.; Rarity, F.; Gawthorpe, R.L.; Sharp, I.R. Structural geology and 4D evolution of a half-graben: New digital outcrop modelling techniques applied to the Nukhul half-graben, Suez rift, Egypt. J. Struct. Geol. 2009, 31, 328–345. [Google Scholar] [CrossRef]
  62. McNamara, D.D.; Massiot, C.; Lewis, B.; Wallis, I.C. Heterogeneity of structure and stress in the Rotokawa Geothermal Field, New Zealand. J. Geophys. Res. Solid Earth 2015, 120, 1243–1262. [Google Scholar] [CrossRef] [Green Version]
  63. Wessel, P.; Luis, J.; Uieda, L.; Scharroo, R.; Wobbe, F.; Smith, W.H.; Tian, D. The generic mapping tools version 6. Geochem. Geophys. Geosyst. 2019, 20, 5556–5564. [Google Scholar] [CrossRef] [Green Version]
Figure 1. (a) Regional seismotectonic context around the 2021 Nagqu Mw 5.7 earthquake. Red focal mechanism is the hypocenter of the 2021 Nagqu event. Gray focal mechanisms are historical events with Mw > 5.5 from Global Centroid Moment Tensor (GCMT) [7]. Black focal mechanisms are Mw > 7 historical earthquakes. Black dots are historical earthquakes with Mw between 4 and 5.5. Purple and black vectors are, respectively, continuous and campaign Global Navigation Satellite System (GNSS) velocities from 1998 to 2014 [8]. Blue polygons are lakes with area larger than 1 km2 from National Tibetan Plateau Data Center [9]. Black rectangles represent the spatial coverages of Sentinel-1 SAR data from one ascending track 143 (AT143) and one descending track 77 (DT77). Blue rectangle bounds the extent of enlarged (b). (b) The zoom-in of blue box in (a). (c) Geological map covering a similar region of (b) modified from the 1:1.5 million geological maps of the Tibetan Plateau and detailed lithology properties are available [10]. The lithology age marked in (c) is adopted from Xie et al. (2014) [2].
Remotesensing 14 03834 g001
Figure 2. Observed and modeled coseismic ground displacement in satellite line of sight (LOS) in both (ad) AT143 and (eh) DT77 tracks. Positive values indicate relative motion of the ground surface toward the satellite (LOS range decrease). First column: the observed surface displacement fields; Second column: model predictions; Third and fourth columns: residuals between observations and models and the histograms of residuals. Black contour with a 0.1 m interval is the coseismic slip model. Red line and black star represent the surface trace of the modeled seismogenic fault and the epicenter estimated in this study based on InSAR data, respectively.
Remotesensing 14 03834 g002
Figure 3. Two-dimensional coseismic surface displacement maps. (a) Horizontal displacement in the strike direction (red line). Positive values represent the motion toward to northeast along the strike direction. (b) Vertical displacement. Negative values represent subsidence. Black contour with a 0.1 m interval is the coseismic slip model.
Remotesensing 14 03834 g003
Figure 4. Marginal posterior probability distributions for the source parameters for the 2021 Nagqu Mw 5.7 earthquake. Scatter plots are contoured according to frequency (warm and cold colors for high frequency and low frequency, respectively). Red lines represent the maximum-a-posteriori probability solution (see also Table 1).
Remotesensing 14 03834 g004
Figure 5. The jRi curves for coseismic slip inversion. Red cycle on jRi curves is the corresponding jRi and lambda values used to weight the smoothing of coseismic slip inversion.
Remotesensing 14 03834 g005
Figure 6. Distributed coseismic slip. (a) Total coseismic slip; (b) sinistral slip component; and (c) dip-slip component. Black stars represent the hypocenter of the 2021 Mw 5.7 Nagqu earthquake estimated in this study based on InSAR data. Black arrows indicate the slip vector. (df) are 3D views of (ac), respectively.
Remotesensing 14 03834 g006
Figure 7. Stress tensor inversion. (a) Blue, red, and purple focal mechanisms used in the stress inversion for Zone 1 (b); Zone 2 (c); and Zone 3 (d), respectively. Right column shows the histograms of SHmax from 2000 bootstrap samples for three subzones, respectively. Dashed red lines are the optimal SHmax. Clockwise rotation of SHmax is discerned from Zone 1 to Zone 3. The black arrow pairs in (a) represent GPS-derived principal strain rates adopted from Li et al. (2021) [11].
Remotesensing 14 03834 g007
Figure 8. Schematic illustration of the seismogenic mechanisms of the 2021 Nagqu Mw 5.7 earthquake.
Remotesensing 14 03834 g008
Table 1. Source parameters for the 2021 Nagqu earthquake.
SourceLon (°)Lat (°)Depth
(km)
Strike
(°)
Dip
(°)
Rake
(°)
Mw
USGS92.91531.92511.517/22537/56−113/−745.7
GCMT92.9231.8519.4354/23750/62−142/−475.8
GFZ92.8931.8810358/23339/64−138/−585.7
IPGP92.89931.906107/23243/56−126/−615.7
Li et al. (2021)--~723769−705.7
This study92.84631.9587.524059−565.7
Table 2. Details of the coseismic Sentinel-1 SAR data used in this study. Bperp is the perpendicular baseline.
InterferogramPrimary
(yyyymmdd)
Secondary
(yyyymmdd)
PathDirectionHeading Angle (°)Incidence Angle (°)Bperp (m)
AT1432021031220210324143Ascending349.839.712
DT77202103072021031977Descending189.943.312
Table 3. The optimal solution and searching intervals of the fault geometry parameters in the non-linear GBIS inversion.
ParametersLength
(km)
Width
(km)
DepthStrike
(°)
Dip
(°)
Strike-Slip (cm)Dip-Slip
(cm)
E-Shift
(km)
N-Shift
(km)
Lower boundary0001800−1−1−20−20
Upper boundary20202030090112020
Optimal Para.9.89.311.7240.459.20.10−0.09−7.112.0
2.5%8.24.09.0233.152.70.06−0.22−8.39.1
97.5%11.013.115.0244.169.30.25−0.08−5.614.0
Note: E-shift and N-shift are differential E–W and N–S distances with respect to the GCMT epicenter location. Depth is the lower depth of uniform fault. The optical solutions are maximum-a-posteriori probability solutions, and a 95% confidence interval (between 2.5% and 97.5% percentiles) of posterior probability density functions of fault parameters.
Table 4. Stress tensor parameters as obtained from focal mechanisms inversion.
SubzonesN a σ 1 ° az . / pl .   b σ 2 ° az . / pl . σ 3 ° az . / pl . R c α °   d Stress RegimeSHmax e
Zone16171/364/54266/60.3428SS174 (−6)
Zone28140/769/9278/110.2513NF007
Zone38325/81195/6104/70.2817NF014
a Number of focal mechanisms; b Azimuth and plunge angles; c stress ratio R = σ 1   σ 2 / σ 1   σ 3 , 0 < R < 1 ; d misfit angle; e maximum horizontal compressive stress orientation.
Publisher’s Note: MDPI stays neutral with regard to jurisdictional claims in published maps and institutional affiliations.

