Article

Assessment and Hydrological Validation of Merged Near-Real-Time Satellite Precipitation Estimates Based on the Gauge-Free Triple Collocation Approach

1
China Institute of Water Resources and Hydropower Research, Beijing 100038, China
2
Hydrology Center of Jinan, Jinan 250014, China
3
School of Civil Engineering and Transportation, State Key Laboratory of Subtropical Building Science, South China University of Technology, Guangzhou 510641, China
*
Author to whom correspondence should be addressed.
Remote Sens. 2022, 14(15), 3835; https://doi.org/10.3390/rs14153835
Submission received: 10 June 2022 / Revised: 27 July 2022 / Accepted: 3 August 2022 / Published: 8 August 2022

Abstract

:
Obtaining accurate near-real-time precipitation data and merging multiple precipitation estimates require sufficient in-situ rain gauge networks. The triple collocation (TC) approach is a novel error assessment method that does not require rain gauge data and provides reasonable precipitation estimates by merging data; this study assesses the TC approach for producing reliable near-real-time satellite-based precipitation estimate (SPE) products and the utility of the merged SPEs for hydrological modeling of ungauged areas. Three widely used near-real-time SPEs, including the Integrated Multi-satellite Retrievals for Global Precipitation Measurement (IMERG) early/late run (E/L) series, and the Precipitation Estimation from Remotely Sensed Information Using Artificial Neural Networks-Dynamic Infrared Rain Rate (PDIR) products, are used in the Beijiang basin in south China. The results show that the TC-based merged SPEs generally outperform all original SPEs, with higher consistency with the in-situ observations, and show superiority over the simple equal-weighted merged SPEs used for comparison; these findings indicate the superiority of the TC approach for utilizing the error characteristics of input SPEs for multi-SPE merging for ungauged areas. The validation of the hydrological modeling utility based on the Génie Rural à 4 paramètres Journalier (GR4J) model shows that the streamflow modeled by the TC-based merged SPEs has the best performance among all SPEs, especially for modeling low streamflow because the integration with the PDIR outperforms the IMERG products in low streamflow modeling. The TC merging approach performs satisfactorily for producing reliable near-real-time SPEs without gauge data, showing great potential for near-real-time applications, such as modeling rainstorms and monitoring floods and flash droughts in ungauged areas.

1. Introduction

Reliable near-real-time precipitation data are essential for monitoring and early warning of natural disasters, such as rainstorms, floods, landslides, and drought [1,2]. Traditionally, precipitation data are derived from ground-based in-situ gauge observations, which typically have high accuracy and reliability; however, gauge observations have high maintenance costs, and harsh terrain and environment may prevent their installation. Therefore, gauge observations are typically sparse or unavailable in many remote areas and underdeveloped countries [3,4,5,6]; moreover, it is difficult to obtain accurate and representative precipitation estimates from sparse observations via spatial interpolation due to the high spatiotemporal heterogeneity of precipitation, especially in areas with complex terrain and atmospheric conditions [6,7]. Thus, monitoring and disaster prevention related to precipitation have remained a challenge in sparsely gauged and ungauged areas.
As a result of technological advances in spaceborne remote sensing and algorithms, several precipitation estimation products based on satellite-derived infrared (IR), passive microwave (PMW), and radar remote sensing information have been developed in recent years; these satellite-based precipitation estimate (SPE) products typically feature broad spatial coverage, high spatial continuity, and high resolution, with the potential for an alternative precipitation data source for ungauged areas [8]. Widely-used SPEs include the Tropical Rainfall Measuring Mission (TRMM) Multi-satellite Precipitation Analysis (TMPA) [9], the Integrated Multi-satellite Retrievals for Global Precipitation Measurement (IMERG) series [10,11], the Climate Prediction Center (CPC) MORPHing technique (CMORPH) [12], and the Precipitation Estimation from Remotely Sensed Information Using Artificial Neural Networks (PERSIANN) [13], which provide near-real-time data products. Nevertheless, due to external sensor disturbance, sampling errors, and limitations of the retrieving algorithms, SPEs typically have lower accuracy than ground observations [7]. Therefore, assessing the accuracy and applicability and performing adjustments and improvements to the SPEs are required before utilizing SPEs [3,14].
Merging multiple SPEs to integrate their advantages and generate a more accurate and reliable merged precipitation dataset is an effective approach to improving the performance of SPEs [15]. Several multi-SPE merging approaches based on machine learning [16,17], geophysical regression [18], or Bayesian-based weighted averaging approaches [14,19,20] have been proposed; these studies generally found that multi-SPE merged data exhibited higher robustness and outperformed most individual SPEs that were merged. Nevertheless, in-situ gauge observation data are still required for multi-SPE merging approaches to determine the error characteristics of SPEs. Therefore, using the merged approaches may not be suitable for ungauged areas.
The triple collocation (TC) approach is a novel error assessment method that does not require benchmarks [21] and provides a solution for estimating the error pattern of SPEs, enabling multi-SPE merging for ungauged areas. The TC approach tactfully exploits the statistical relationships between the estimations from independent sources to assess their accuracy; it requires three independent data sources as input (referred to as a triplet). Roebeling et al. [22] first used the TC approach to assess the errors of precipitation estimation products. McColl et al. [23] extended the assessment metrics of the TC approach from the root mean square error (RMSE) to the correlation coefficient (CC) between the estimates and the unknown ground truth. Alemohammad et al. [24] improved the TC approach for precipitation applications by introducing the multiplicative error model to replace the additive error model. Some studies also found that the multiplicative TC approach did not outperform the original additive TC approach [5,25]. Several studies have successfully employed the TC approach to quantitatively assess the error of precipitation estimation products including SPEs without taking gauge data as a benchmark [4,6,25,26,27].
The TC approach has also been used for merging multiple SPEs and other precipitation data to generate better precipitation estimates for ungauged areas because it is reliable for quantifying the error of precipitation estimates in the absence of in-situ observations. Dong et al. [28] applied a TC-based least-square-error approach to merge SPEs and re-analysis precipitation data for Europe and found that the merged product significantly outperformed the input data. Lyu et al. [29] further improved the TC merging approach by merging rainfall and snowfall separately and assessed its performance over mainland China. Chen et al. [4] evaluated the TC-based and other merging approaches over the Yangtze River basin; these studies demonstrated the substantial potential of the TC approach for producing the more robust multi-SPE merged data for ungauged areas. Nevertheless, the datasets to be merged are generally limited to a triplet input in the TC approach, typically including a re-analysis product and the SM2RAIN, an SPE product [6,25,30]. As a result, the record range of the merged precipitation data is limited to that of the two products, limiting the production of near-real-time merged precipitation data; moreover, few studies focused on the utility of TC-based multi-SPE merged precipitation data for hydrological modeling.
This study aims to (1) illustrate and evaluate a TC-based multi-SPE merging scheme for generating merged near-real-time SPE data with higher accuracy without the help of in-situ observation, and (2) validate the hydrological utility of the merged SPE data for ungauged areas. The Beijiang basin, a typical area prone to flood disasters threatening the economic center of South China, is used as a case study to evaluate the near-real-time version of the two widely used SPE products, including the IMERG series and the PERSIANN Dynamic Infrared (PDIR); this study is expected to provide a reference for performing near-real-time multi-SPE merging for hydrological applications such as flood and flash drought monitoring.

2. Study Area and Data

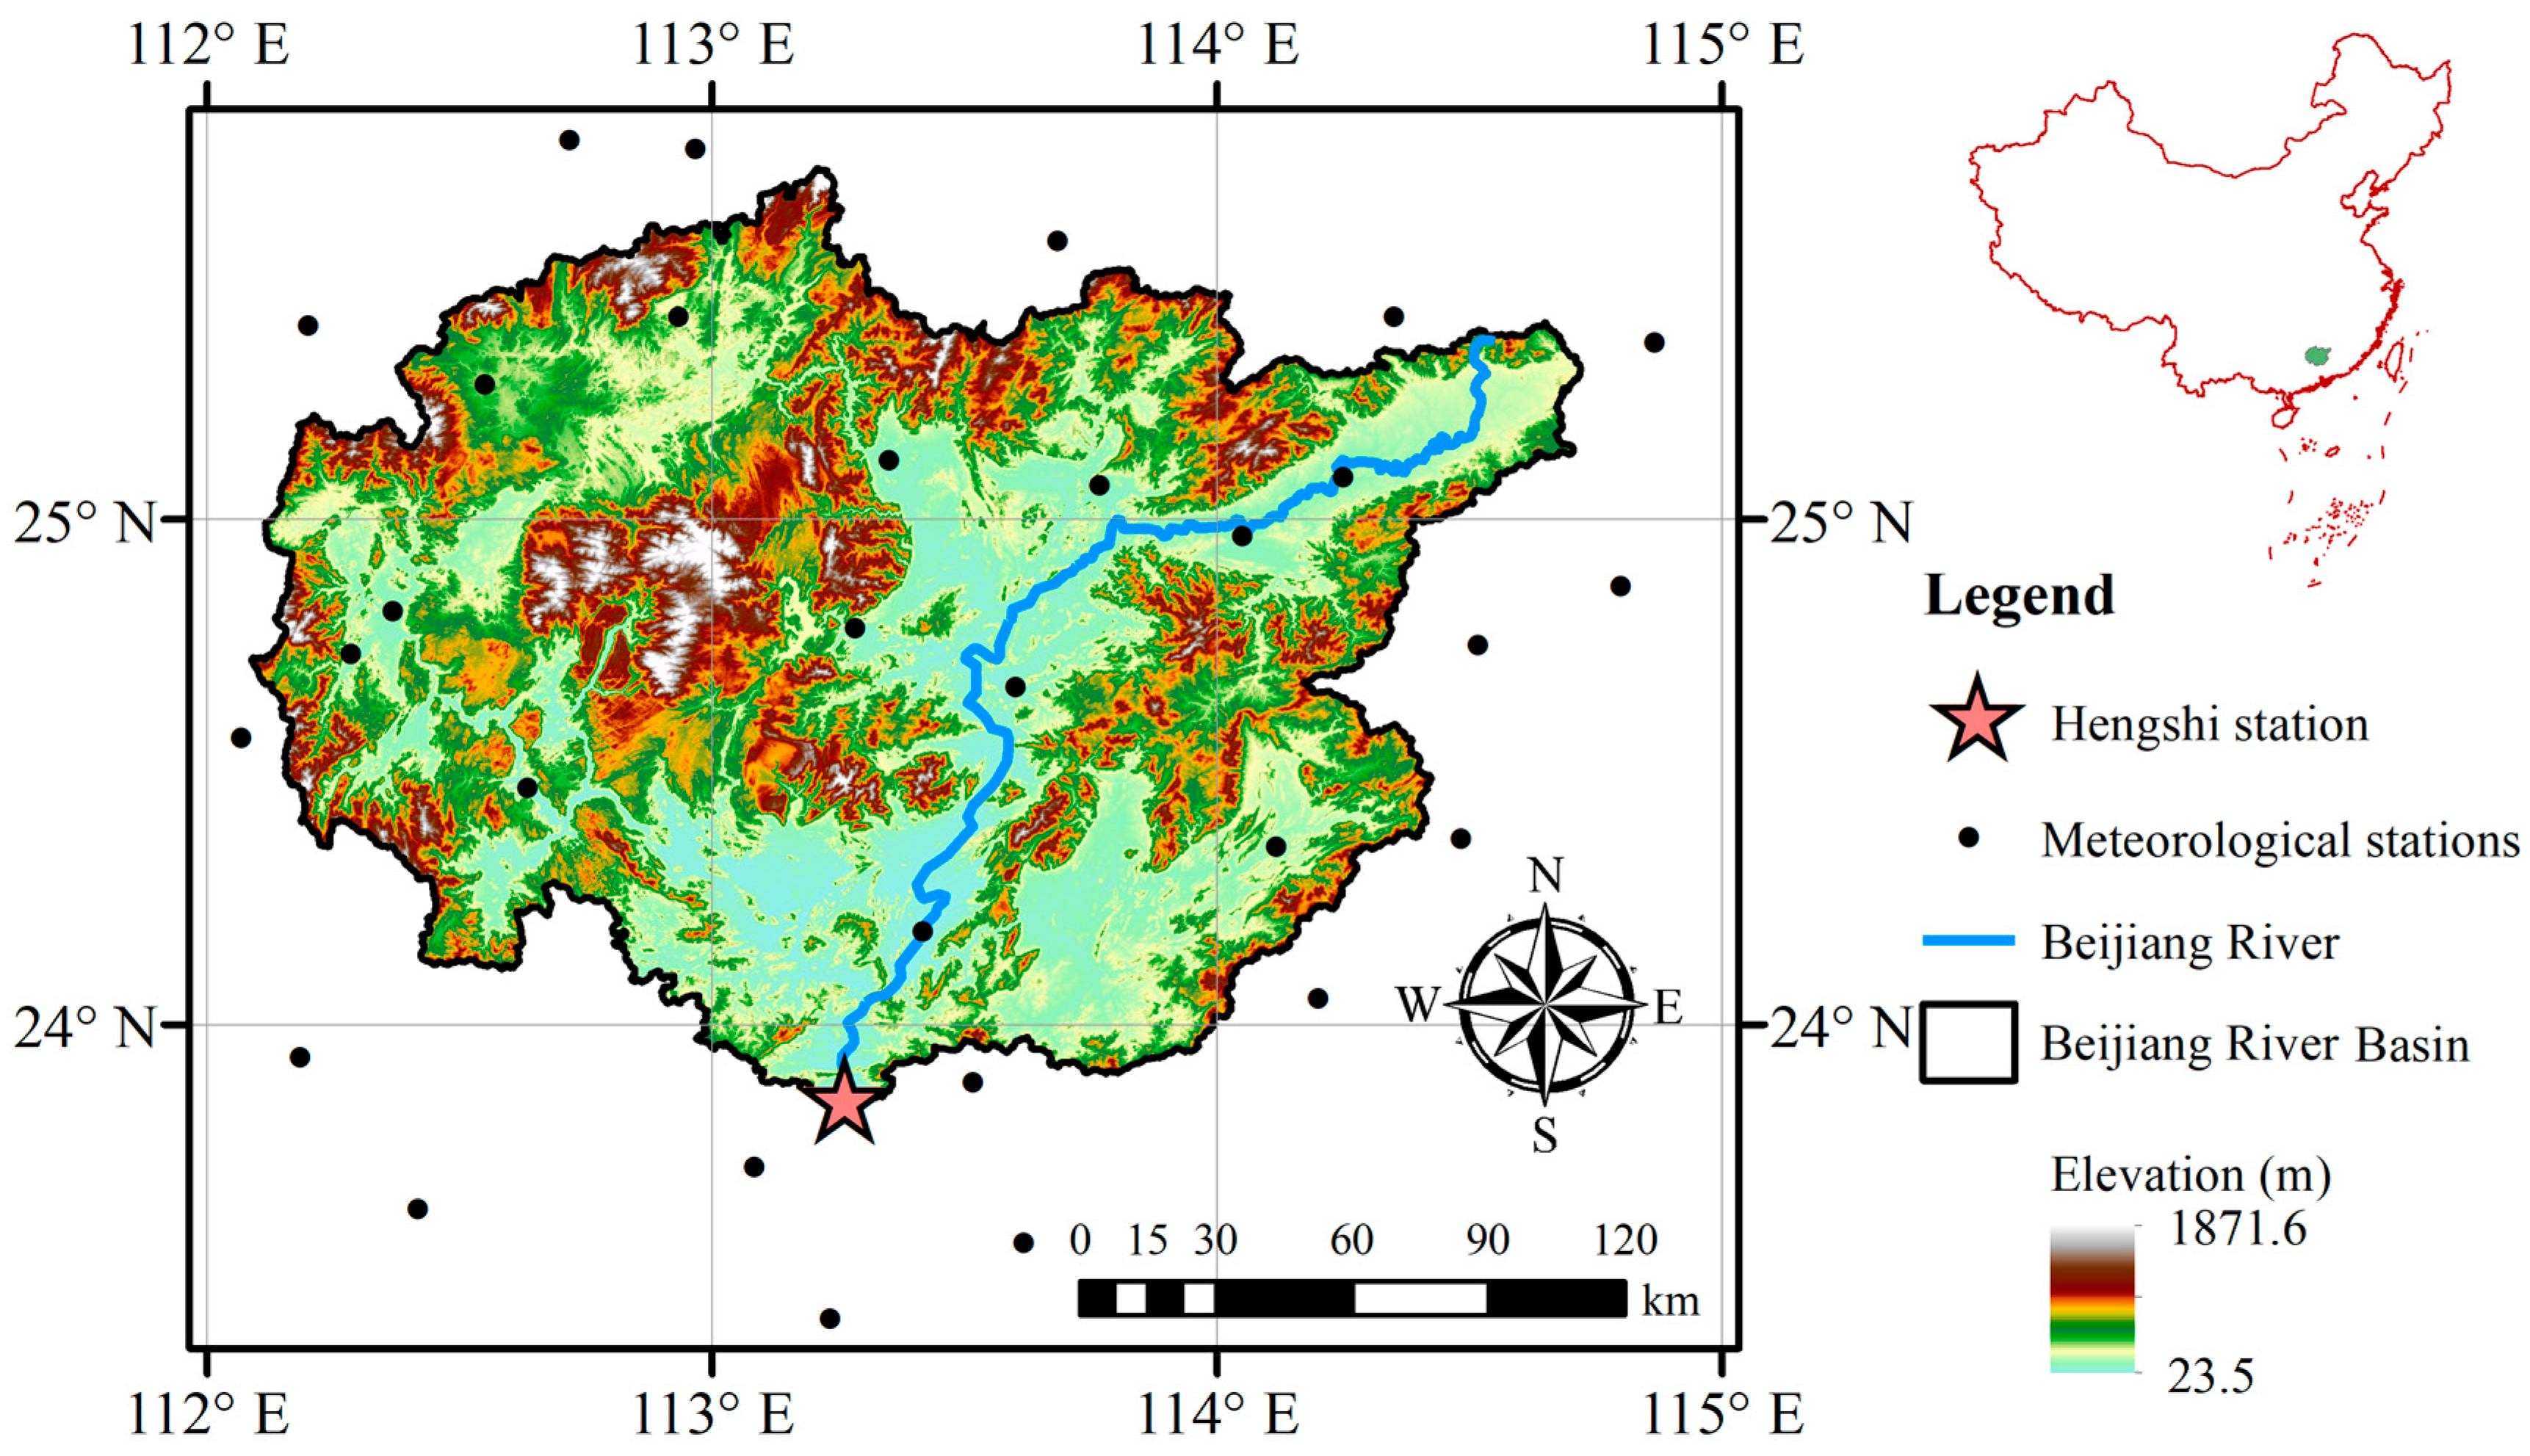
2.1. Beijiang River Basin

The Beijiang river is a major tributary to the Pearl River. The Beijiang river basin is located in northern Guangdong province in south China (Figure 1); it has a drainage area of 34,039 km² and an annual mean streamflow of 3.43 × 10 10 m³ at the Hengshi hydrological station. The basin has very complex terrain, and karst landforms occupy one-third of its area. The dominant climate of the basin is a subtropical humid monsoon climate, with annual mean precipitation of over 1800 mm. The precipitation is highly concentrated during the flood season. Therefore, severe flood disasters are frequent in the Beijiang river basin and even cause floods in the downstream Pearl River Delta, the most populated and developed area in southern China with many megacities, such as Guangzhou. Therefore, the Beijiang river basin is suitable as a case study to illustrate the near-real-time SPE merging approach and hydrological applications related to flood monitoring.

2.2. SPE Products

2.2.1. IMERG Series

The IMERG product series [11] is the level 3 product of the Global Precipitation Mission (GPM); it is the latest global SPE product that intercalibrates, merges, and interpolates most satellite precipitation estimates, including IR, PMW, and spaceborne radar data, providing reliable wide coverage and high spatiotemporal resolution precipitation data. Although the GPM was launched in early 2014, the latest IMERG version-06 further integrates satellite precipitation information of former precipitation measurement missions, such as the TRMM, extending the data record up to June 2000 [31]; this study used the two near-real-time products of IMERG, i.e., the IMERG Early run (IMERG-E, with a latency of 6 h) and the IMERG Late run (IMERG-L, with a latency of 18 h). The difference between the two products is that the IMERG-E is processed by forward propagation in the assimilation algorithm, whereas the IMERG-L is processed by forward and backward propagation; these daily IMERG products with a spatial resolution of 0.1° were obtained from the GPM website (https://gpm.nasa.gov/data/directory, accessed on 31 January 2022).

2.2.2. PDIR

The PDIR [1,2] is a near-real-time global high-resolution SPE developed by the Center for Hydrometeorology and Remote Sensing (CHRS) at the University of California, Irvine (UCI). The PDIR is based on the framework of the PERSIANN-Cloud Classification System (PERSIANN-CCS) product [32], which classifies the segmented cloud patches of the cloud images and adopts different cloud-top temperature-rain rate (Tb–RR) curves. Compared with the PERSIANN-CSS product, the PDIR better captures warm precipitation, has an improved cloud segmentation algorithm, expands the cloud classification system to include monthly cloud data sets, and improves the (Tb–RR) curve model by incorporating additional PMW and SPE data [2]. The PDIR provides near-real-time precipitation data from 2000 to the present with short latency (15–60 min), quasi-global coverage (60°S–60°N), and high spatiotemporal resolution (nearly 0.04° and hourly data). Daily PDIR data were downloaded from the CHRS website (http://chrsdata.eng.uci.edu/, accessed on 31 January 2022).

2.3. Other Inputs for the TC Approach

The TC approach is based on the zero error cross-correlation (ECC) concept and independent input data sources. Therefore, in addition to the SPEs used in this study, two other precipitation estimation products with different data sources and mechanisms were necessary as inputs for the TC approach [5] to estimate the error of the SPEs and facilitate multi-SPE merging. Model-based re-analysis data and the SM2RAIN-Advanced SCATterometer (ASCAT), a unique SPE with a different mechanism from the conventional SPEs, are widely used for the TC approach using SPEs.

2.3.1. ERA5 Reanalysis

ERA5 (the fifth generation European Centre for Medium-Range Weather Forecasts (ECMWF) ReAnalysis) [33] is the latest global atmospheric reanalysis data developed by the ECMWF to replace its predecessor ERA-Interim; it provides global precipitation reanalysis data from 1979 to the present, with a spatial resolution of 0.25° and an hourly temporal resolution. ERA5 is produced by a four-dimensional variational assimilation algorithm in the latest version of the Integrated Forecasting System (IFS Cycle 41r2). ERA5 has several improvements over the ERA-interim in its assimilation system, such as a higher spatial resolution (0.25°) and an improved variational bias scheme that uses more observational data. Because ERA5 is based on an atmospheric physical model and data assimilation, it is widely adopted as an input to the TC approach to assessing SPEs and other products. The daily ERA5 precipitation data were downloaded from the Copernicus Climate Change Service website (https://doi.org/10.24381/cds.f17050d7, accessed on 31 January 2022).

2.3.2. SM2RAIN-ASCAT

SM2RAIN-ASCAT [30] is an SPE based on a bottom-up algorithm, setting it apart from conventional SPEs. The SM2RAIN algorithm estimates precipitation using satellite-derived soil moisture data and the soil water balance model [34,35]. The main data source of the SM2RAIN-ASCAT is soil moisture data from the real-aperture radar instrument on the MetOp satellite ASCAT; the data are not used by other conventional SPEs. Thus, the SM2RAIN-ASCAT is produced using different algorithms than most other SPEs and re-analysis data, and its data source is independent of other SPEs. Therefore, SM2RAIN-ASCAT is also widely used in conjunction with the ERA5 as the input to the TC approach to assess other SPEs [6,25,27,30]. The SM2RAIN-ASCAT provides quasi-global daily terrestrial precipitation estimations from 2007 to the present with a high spatial resolution of about 12.5 km.

2.4. In-Situ Observations

Daily gauge precipitation observation data from 1990 to 2018 were obtained from 30 meteorological stations in and around the Beijiang river basin (Figure 1). The observation data were processed using strict quality control procedures, such as extreme value checks, internal and temporal consistency checks, and the use of quality code; these precipitation observation data were used as a benchmark to assess the original and merged SPEs and as the input to drive the hydrological model.
Daily meteorological observation data, including air temperature, solar radiation, and wind speed, were derived from the same meteorological stations as the precipitation data; they were used to calculate potential evapotranspiration (PET) using the Penman-Monteith equation [36] as input for the hydrological model. Before being input to the hydrological model, the station-based precipitation and calculated PET data were converted to basin-averaged values using Thiessen Polygon weighted averaging.
Daily streamflow observation data from 1991 to 2011 were obtained from the Hengshi station, i.e., the basin outlet of the study area; they were used as a reference to calibrate the hydrological model and as a benchmark to assess the modeled streamflow data obtained from the original and merged SPEs.
Note that besides that for saving the space, only IMERG series and PDIR are selected as cases in this study; this is also because of the limitation of the temporal range of the streamflow observations available for this study. Therefore, this study only selects the near-real-time SPEs with the longest and continuous overlapping periods with the observational data of this study.

3. Methods

3.1. Triple Collocation (TC) Approach

The TC approach requires three estimates from independent sources as input; they are denoted as R 1 , R 2 , and R 3 and are called triplet members. Following are the process of how we derive the formal formula of the TC approach:
The mechanism of TC approach is established on a linear error model, which can be represented by the equation as:
R i = α i + β i T + ε i
where R i is the ith precipitation estimate for i = 1 , 2 , 3 ; T is the actual precipitation; α i and β i are the ordinary least-squares intercept and slope, respectively; ε i is the random error; it is important to note that T is a temporally variable that helps to construct the equation set of TC theory so that finally derive the formal formulas of TC; it does not mean that any data representing actual precipitation (like gauge observations) are required.
The TC approach relies on the zero ECC between the triplet members. Specifically, the mean value of the error of each triplet member should be zero ( E ( ε i ) = 0 ), the errors are uncorrelated to the actual data ( C o v ( ε i , T ) = 0 ), and the errors of two different triplet members are uncorrelated ( C o v ( ε i , ε j ) = 0 when i j ). Therefore, the covariance between each two triplet members ( Q i j ) can be expressed as:
{ Q i j = C o v ( R i , R j ) = β i β j σ 2 ( T ) Q i i = σ 2 ( R i ) = β i 2 σ 2 ( T ) + σ 2 ( ε i )
Note that Equations (1) and (2) are the intermediate equation sets, instead of the calculation procedure of TC approach; they need to be solved to derive the final formal formula of TC approach:
By solving Equation (2), the error variance of the triplet members can be derived as:
{ σ 2 ( ε 1 ) = Q 11 Q 12 Q 13 Q 23 σ 2 ( ε 2 ) = Q 22 Q 12 Q 23 Q 13 σ 2 ( ε 3 ) = Q 33 Q 13 Q 23 Q 12
Let θ i = β i σ ( T ) ; then, we can also solve θ i as:
{ θ 1 = Q 12 Q 13 Q 23 θ 2 = Q 12 Q 23 Q 13 θ 3 = Q 13 Q 23 Q 12
Equations (3) and (4) are the finally derived formal formulas of TC approach for estimating the error of precipitation estimations without benchmark data.
It is can be found in the final formulas of TC that, only the covariances between the different precipitation estimations ( Q i j ) are required as input, while the data representing actual precipitation, like gauge observations, are not required. Instead, the terms involving actual precipitation T are the solutions of Equation (4), which are derived from the covariances of estimations as formula input.

3.2. TC-Based Merging Approach

The TC-based multi-source merging approach is based on the least-squares theory [37]; it is performed by using the weighted average of the multiple estimates as the merged result to minimize the error of the merged result:
R T C * = w 1 R 1 * + w 2 R 2 * + w i R i * + + w n R n *
where R T C * is the merged estimate; w i are the weights ( i = 1 n w i = 1 ); R i * is the ith estimate to be merged.
Note that different from the previous section, R i * denotes any precipitation estimates (at least two) to be merged, which is not limited to the triplet members input to the TC approach; n is the number of estimates to be merged, which can be only 2, 3, or more than 3. According to Yilmaz et al. [37], R i * is assumed to be:
R i * = β * T + ε i *
That is, the ordinary least-squares intercept and slope between R i * and T are the same for all R i * . Therefore, the error variance of R T C * , denoted as σ 2 ( ε T C ) , can be expressed as:
J = σ 2 ( ε T C * ) = w 1 2 σ 2 ( ε 1 * ) + w 2 2 σ 2 ( ε 2 * ) + + w n 2 σ 2 ( ε n * )
When σ 2 ( ε T C * ) is minimized by ensuring that J / w i = 0 , the weights w i can be solved.
For instance, for the merging of three estimates, the weights are solved as:
{ w 1 = σ 2 ( ε 2 * ) σ 2 ( ε 3 * ) σ 2 ( ε 1 * ) σ 2 ( ε 2 * ) + σ 2 ( ε 2 * ) σ 2 ( ε 3 * ) + σ 2 ( ε 1 * ) σ 2 ( ε 3 * ) w 2 = σ 2 ( ε 1 * ) σ 2 ( ε 3 * ) σ 2 ( ε 1 * ) σ 2 ( ε 2 * ) + σ 2 ( ε 2 * ) σ 2 ( ε 3 * ) + σ 2 ( ε 1 * ) σ 2 ( ε 3 * ) w 3 = σ 2 ( ε 1 * ) σ 2 ( ε 2 * ) σ 2 ( ε 1 * ) σ 2 ( ε 2 * ) + σ 2 ( ε 2 * ) σ 2 ( ε 3 * ) + σ 2 ( ε 1 * ) σ 2 ( ε 3 * )
where σ 2 ( ε i * ) can be derived from the TC approach using Equation (3).
For the merging of two estimates, weights are solved as follows:
{ w 1 = σ 2 ( ε 2 * ) σ 2 ( ε 1 * ) + σ 2 ( ε 2 * ) w 2 = σ 2 ( ε 1 * ) σ 2 ( ε 1 * ) + σ 2 ( ε 2 * )
The linear error model of the TC approach (Equation (1)) does not necessarily satisfy the assumption of Equation (6). Therefore, before being input to the TC approach, the estimates R i are normalized to unify their intercepts and slopes to the truth T as:
R i * = ( R i R i ¯ ) / β i + T ¯ = ( R i R i ¯ ) σ ( T ) / θ i + T ¯
where R i ¯ is the mean value of R i , T ¯ is the mean value of the ground truth T ; θ i can be derived by the TC approach using Equation (4).
Since σ ( T ) and T ¯ are unknown, we use the averages of the standard deviations and mean values of all estimates to substitute σ ( T ) and T ¯ :
R i * = ( R i R i ¯ ) σ ¯ / θ i + R ¯
where θ i can be derived from Equation (4); σ ¯ and R i ¯ are the averages of the standard deviations and mean values of all estimates to be merged:
{ σ ¯ = i = 1 n σ ( R i ) n R ¯ = i = 1 n R i ¯ n
where σ ( R i ) is the standard deviation of R i .
This study focuses on the merging of the near-real-time SPEs (IMERG-E, IMERG-L, and PDIR). The ERA5 and SM2RAIN-ASCAT do not participate in multi-source merging; instead, they are only utilized to construct the TC triplets together with each SPE respectively, so that helps to derive the θ i and σ 2 ( ε i * ) of each SPE by using TC. The TC-based multi-SPE merging is performed as follows:
(1)
Selecting the near-real-time SPEs to be merged (at least two SPEs), such as IMERG-E with PDIR, or IMERG-L with PDIR;
(2)
Estimating the θ i of each SPE respectively via Equation (4), by using ERA5 and SM2RAIN-ASCAT as the other two triplet members as input to the TC approach;
(3)
Normalizing each SPE using the estimated θ i via Equations (11) and (12) to ensure that R i becomes R i * ;
(4)
Estimating the σ 2 ( ε i * ) of each normalized SPE via Equation (3) using ERA5 and SM2RAIN-ASCAT as the other two triplet members;
(5)
Calculating the weights w i using the estimated σ 2 ( ε i * ) for each SPE via Equation (8) (for merging 3 SPEs) or Equation (9) (for merging 2 SPEs), then deriving the multi-SPE merged product R T C * via Equation (5).

3.3. Assessment Metrics

Several assessment metrics are used to evaluate the performance of the original and merged near-real-time SPEs and their hydrological modeling utility; these metrics also serve as the objective function for the calibration of the hydrological model. The assessment metrics include the CC, RMSE, Nash-Sutcliffe efficiency coefficient (NSE) and its logarithm version, the log_NSE, relative bias (RB), critical success index (CSI), Kling-Gupta efficiency coefficient (KGE) [38] and its logarithm version, the log_KGE.
The CC is used to quantify the linear correlation between the SPE data and the benchmark data. The RMSE quantifies the deviation between the SPE data and the benchmark data. The NSE and KGE quantify the general consistency between the SPE data and the benchmark data. The log_NSE and log_KGE are similar but are more sensitive to low values and are only used for assessing the modeled streamflow data. The RB describes the systematic bias of the estimates. The KGE is a widely-recognized effective objective function for hydrological model calibration. The CSI quantifies the ability of SPEs to capture specific precipitation events [4]. In this study, two thresholds of daily precipitation (≥1 mm and ≥25 mm) are used to determine the light and heavy precipitation events for the CSI calculation, respectively. The calculated CSI are denoted as CSI_1 and CSI_25, respectively. The calculation formulas of the assessment metrics are listed in Table 1.

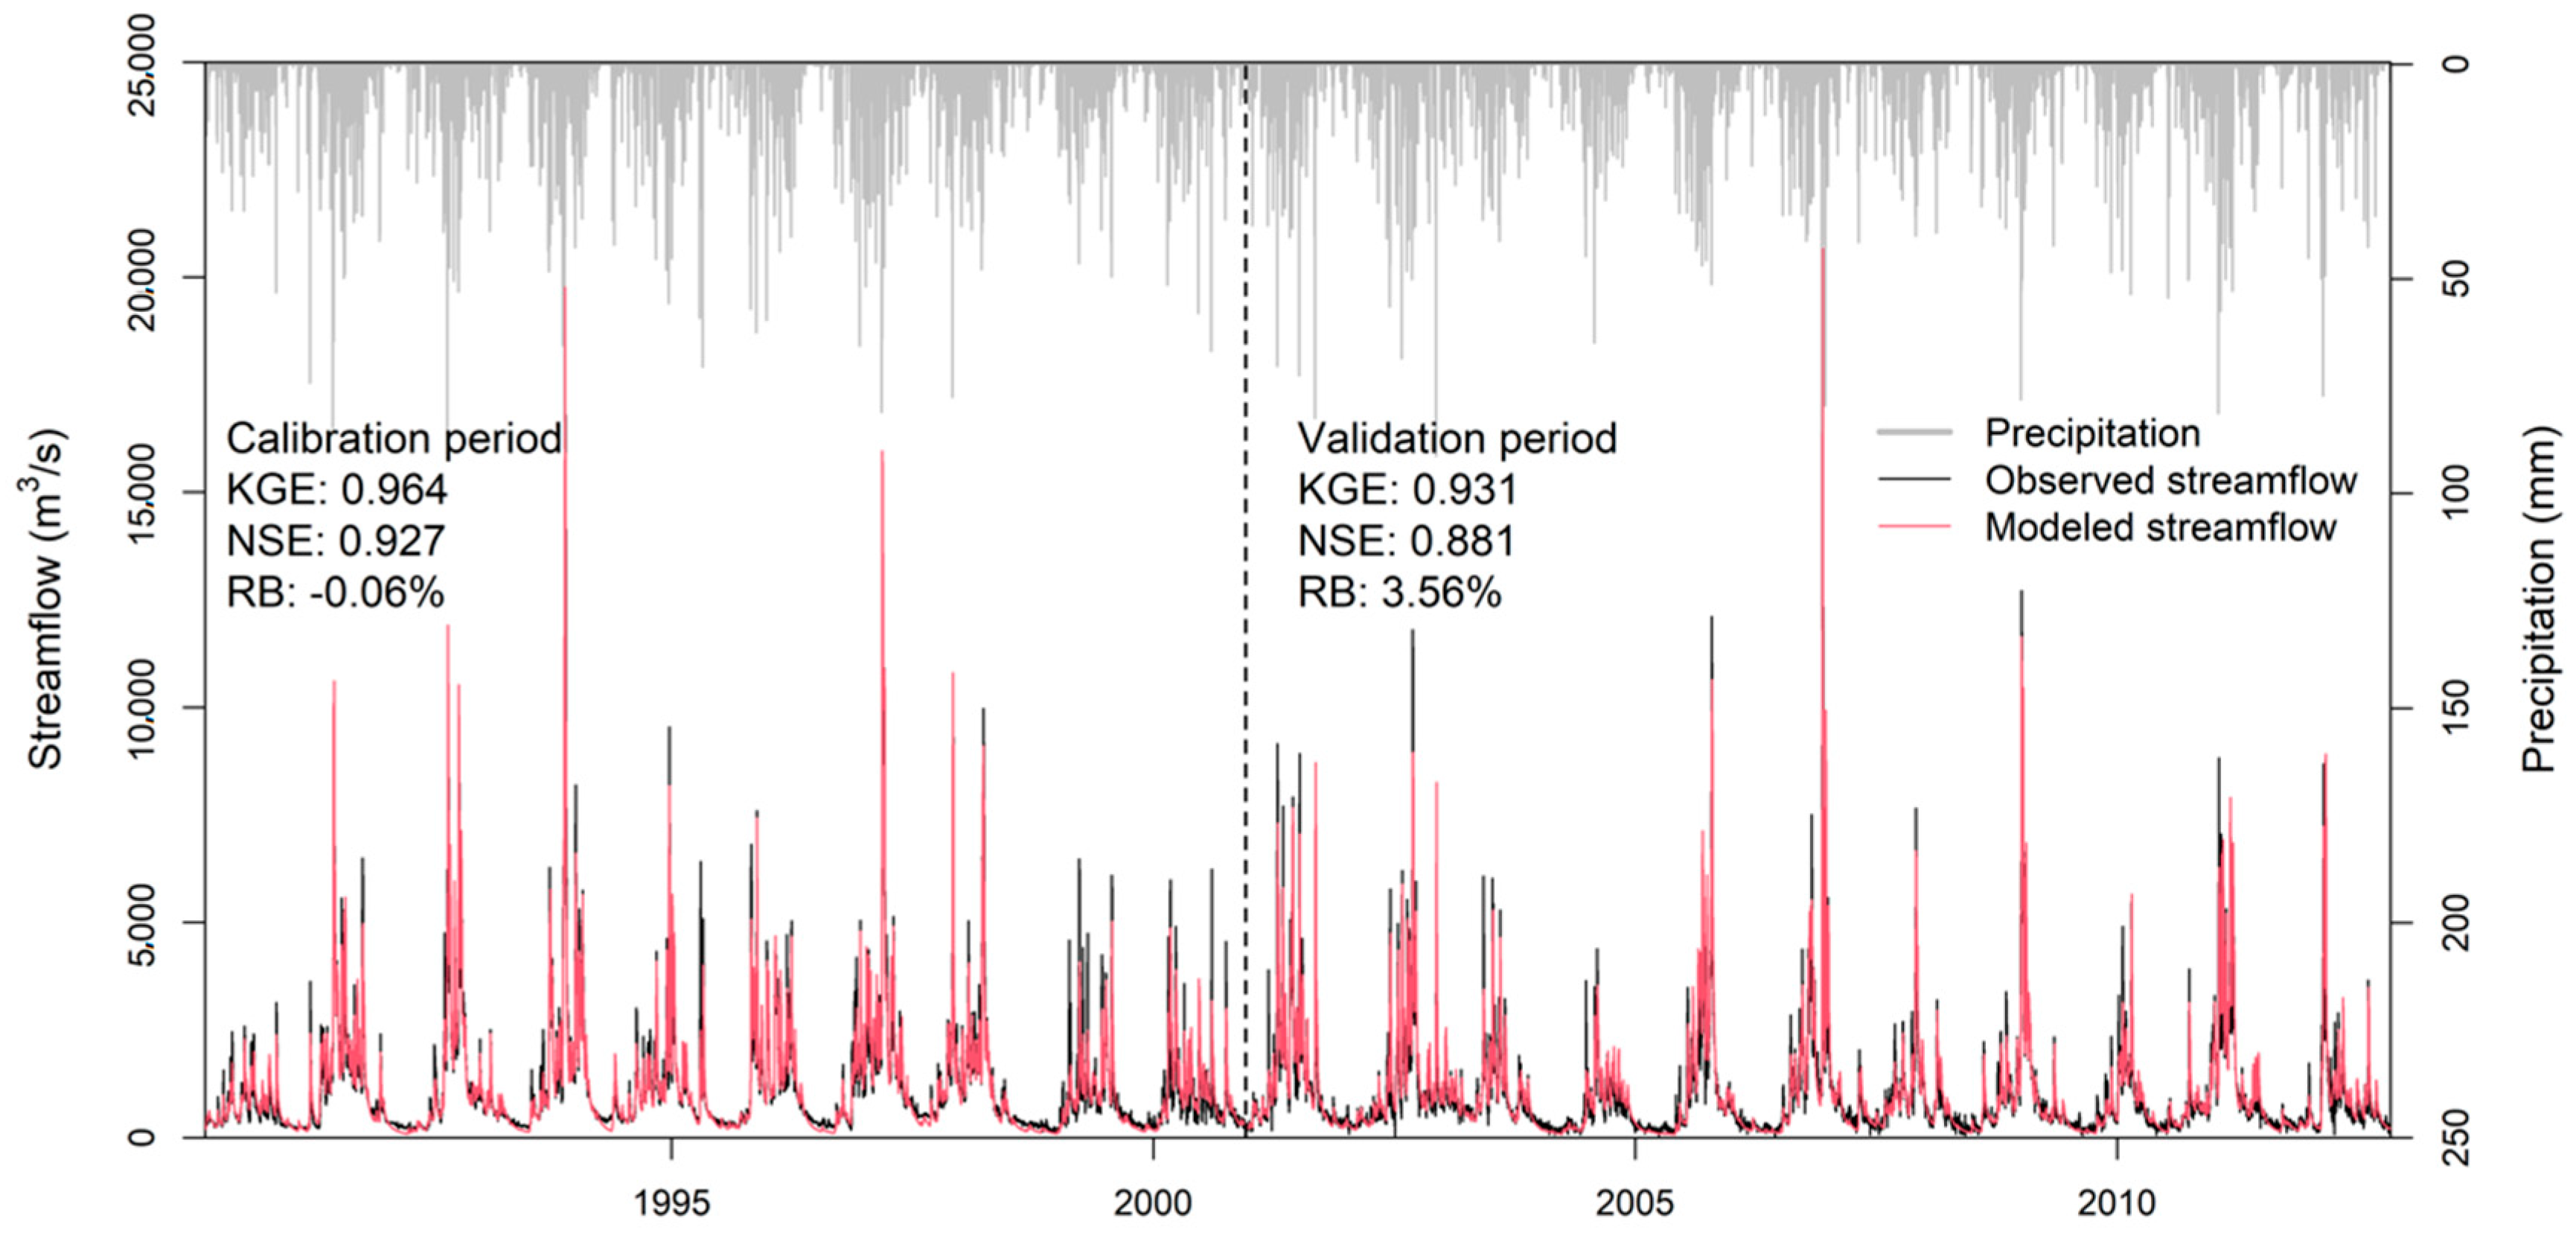
3.4. Hydrological Model and Calibration

The Génie Rural à 4 paramètres Journalier (GR4J) model [39] is used for validating the hydrological modeling utility of the original and merged SPEs in this study. The GR4J model is a simple but effective lumped daily hydrological model and only requires precipitation and PET as inputs. The GR4J model has been successfully used for streamflow modeling in many areas worldwide with various climate and geological conditions and has outperformed other complicated models [40,41,42]. The GR4J model must be calibrated before validating the hydrological utility of the SPEs. Only four parameters require calibration, including the maximum capacity of the production storage, the groundwater exchange coefficient, the maximum capacity of the routing storage, and the unit hydrograph time base coefficient. The GR4J model typically must be pre-run for at least one year as the “warm-up” period.
In this study, the GR4J model is calibrated and validated using the basin-averaged precipitation observations and the observed streamflow data at the Hengshi station utilizing the Shuffled Complex Evolution-University of Arizona (SCE-UA) optimization algorithm [43]. The KGE between the observed and modeled streamflow is used as the objective function to be maximized. The year 1990 is taken as the “warm-up” period; the period 1991 to 2000 is used as the calibration period, i.e., the objective function is calculated using the modeled data in this period. 2001 to 2011 is used as the validation period.
Figure 2 shows the calibration result of the GR4J model for the Beijiang river basin. The results show a satisfactory performance for daily streamflow modeling in the Beijiang river basin, with high KGEs of 0.96 and 0.93, high NSEs of 0.93 and 0.88, and an RB close to zero for the calibration and validation periods. The findings indicate that the calibrated GR4J model is suitable for assessing the hydrological modeling utility of the original and merged SPEs in this study.

3.5. Experimental Design

TC-based merging is performed for three near-real-time SPEs, i.e., the IMERG-E, IMERG-L, and PDIR, to generate an integrated near-real-time SPE. Since the IMERG-E and IMERG-L are derived from the same product series, and their differences are only the extent of data assimilation and the time latency [44], the two IMERG products are not merged together. Therefore, the PDIR is merged with the IMERG-E and IMERG-L separately using the TC-based merging approach to generate two merged SPEs, which are called TC-EP (IMERG-E with PDIR) and TC-LP (IMERG-L with PDIR). The merging and assessment of the SPEs are performed from 2001 to 2018, which is the intersection of the monitoring period of the three SPEs and the in-situ observations.
In the multi-SPE merging procedure, the three near-real-time SPEs and the SM2RAIN-ASCAT are resampled to obtain the same spatial resolution of ERA5, i.e., 0.25°. Next, the parameters of the TC-based merging approach for the SPEs, including the coefficients θ i , σ ¯ , and R ¯ for the normalization of the SPE and the weights w i for weighted averaging, are estimated for 2007–2018, which is the monitoring period of SM2RAIN-ASCAT, the shortest period of the triplet members. Subsequently, the near-real-time SPEs are merged for the entire period (2001 to 2018) using these parameters.
For the assessment of the original and merged SPEs, the gauge observations at the meteorological stations are used as the benchmark to assess the original and merged SPEs. The gridded SPE data are interpolated to the location of the meteorological stations using bilinear interpolation, and the output is used for comparison with the gauge observation using the assessment metrics. For the assessment of the hydrological utility of the SPEs, the gridded SPE data are spatially averaged over the Beijiang river basin to generate basin-averaged daily precipitation data; these are input into the calibrated GR4J model to generate the SPE-modeled streamflow data. Finally, the results are compared with the in-situ observed streamflow data at the Hengshi station using the assessment metrics.
Additionally, we use an arithmetic mean (AM)-based merging approach for the SPEs for comparison to evaluate the superiority of the TC-based merging approach:
R A M = i = 1 n R i n
where R A M is the arithmetic mean merged SPE, and n is the number of SPEs to be merged. The merged SPEs of IMERG-E with PDIR and IMERG-L with PDIR using AM merging are denoted as AM_EP and AM_LP, respectively.

4. Results

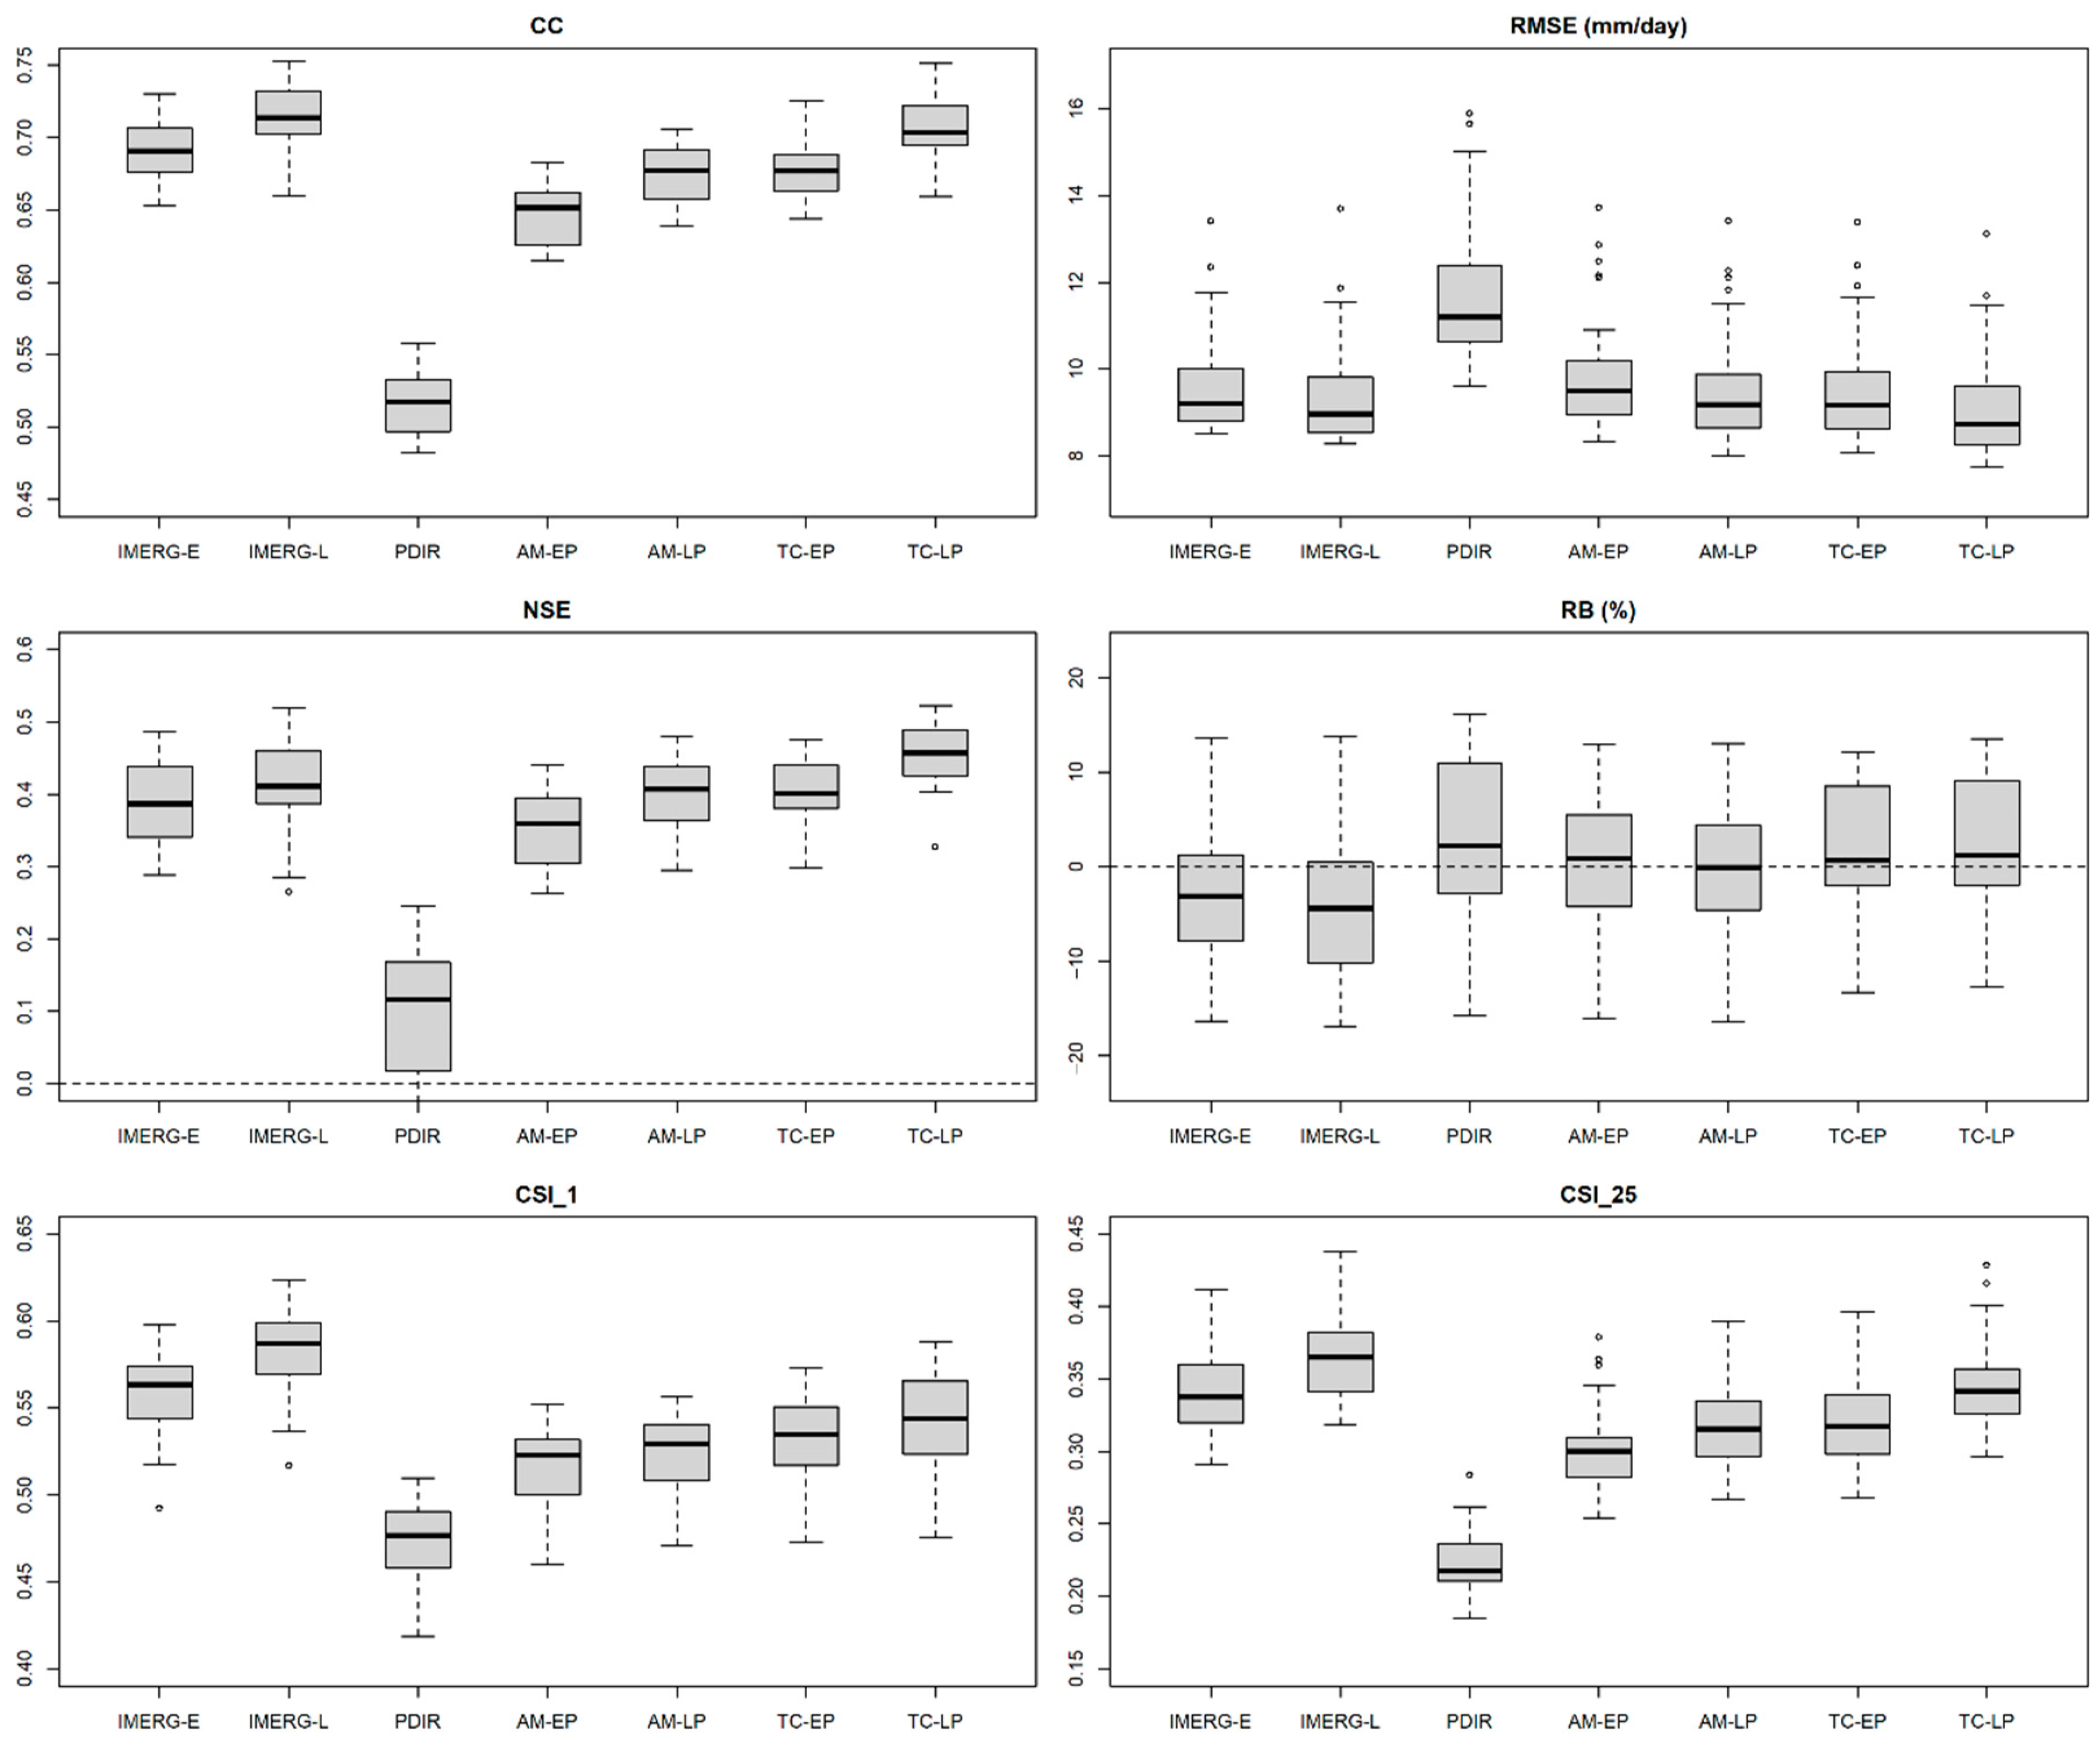
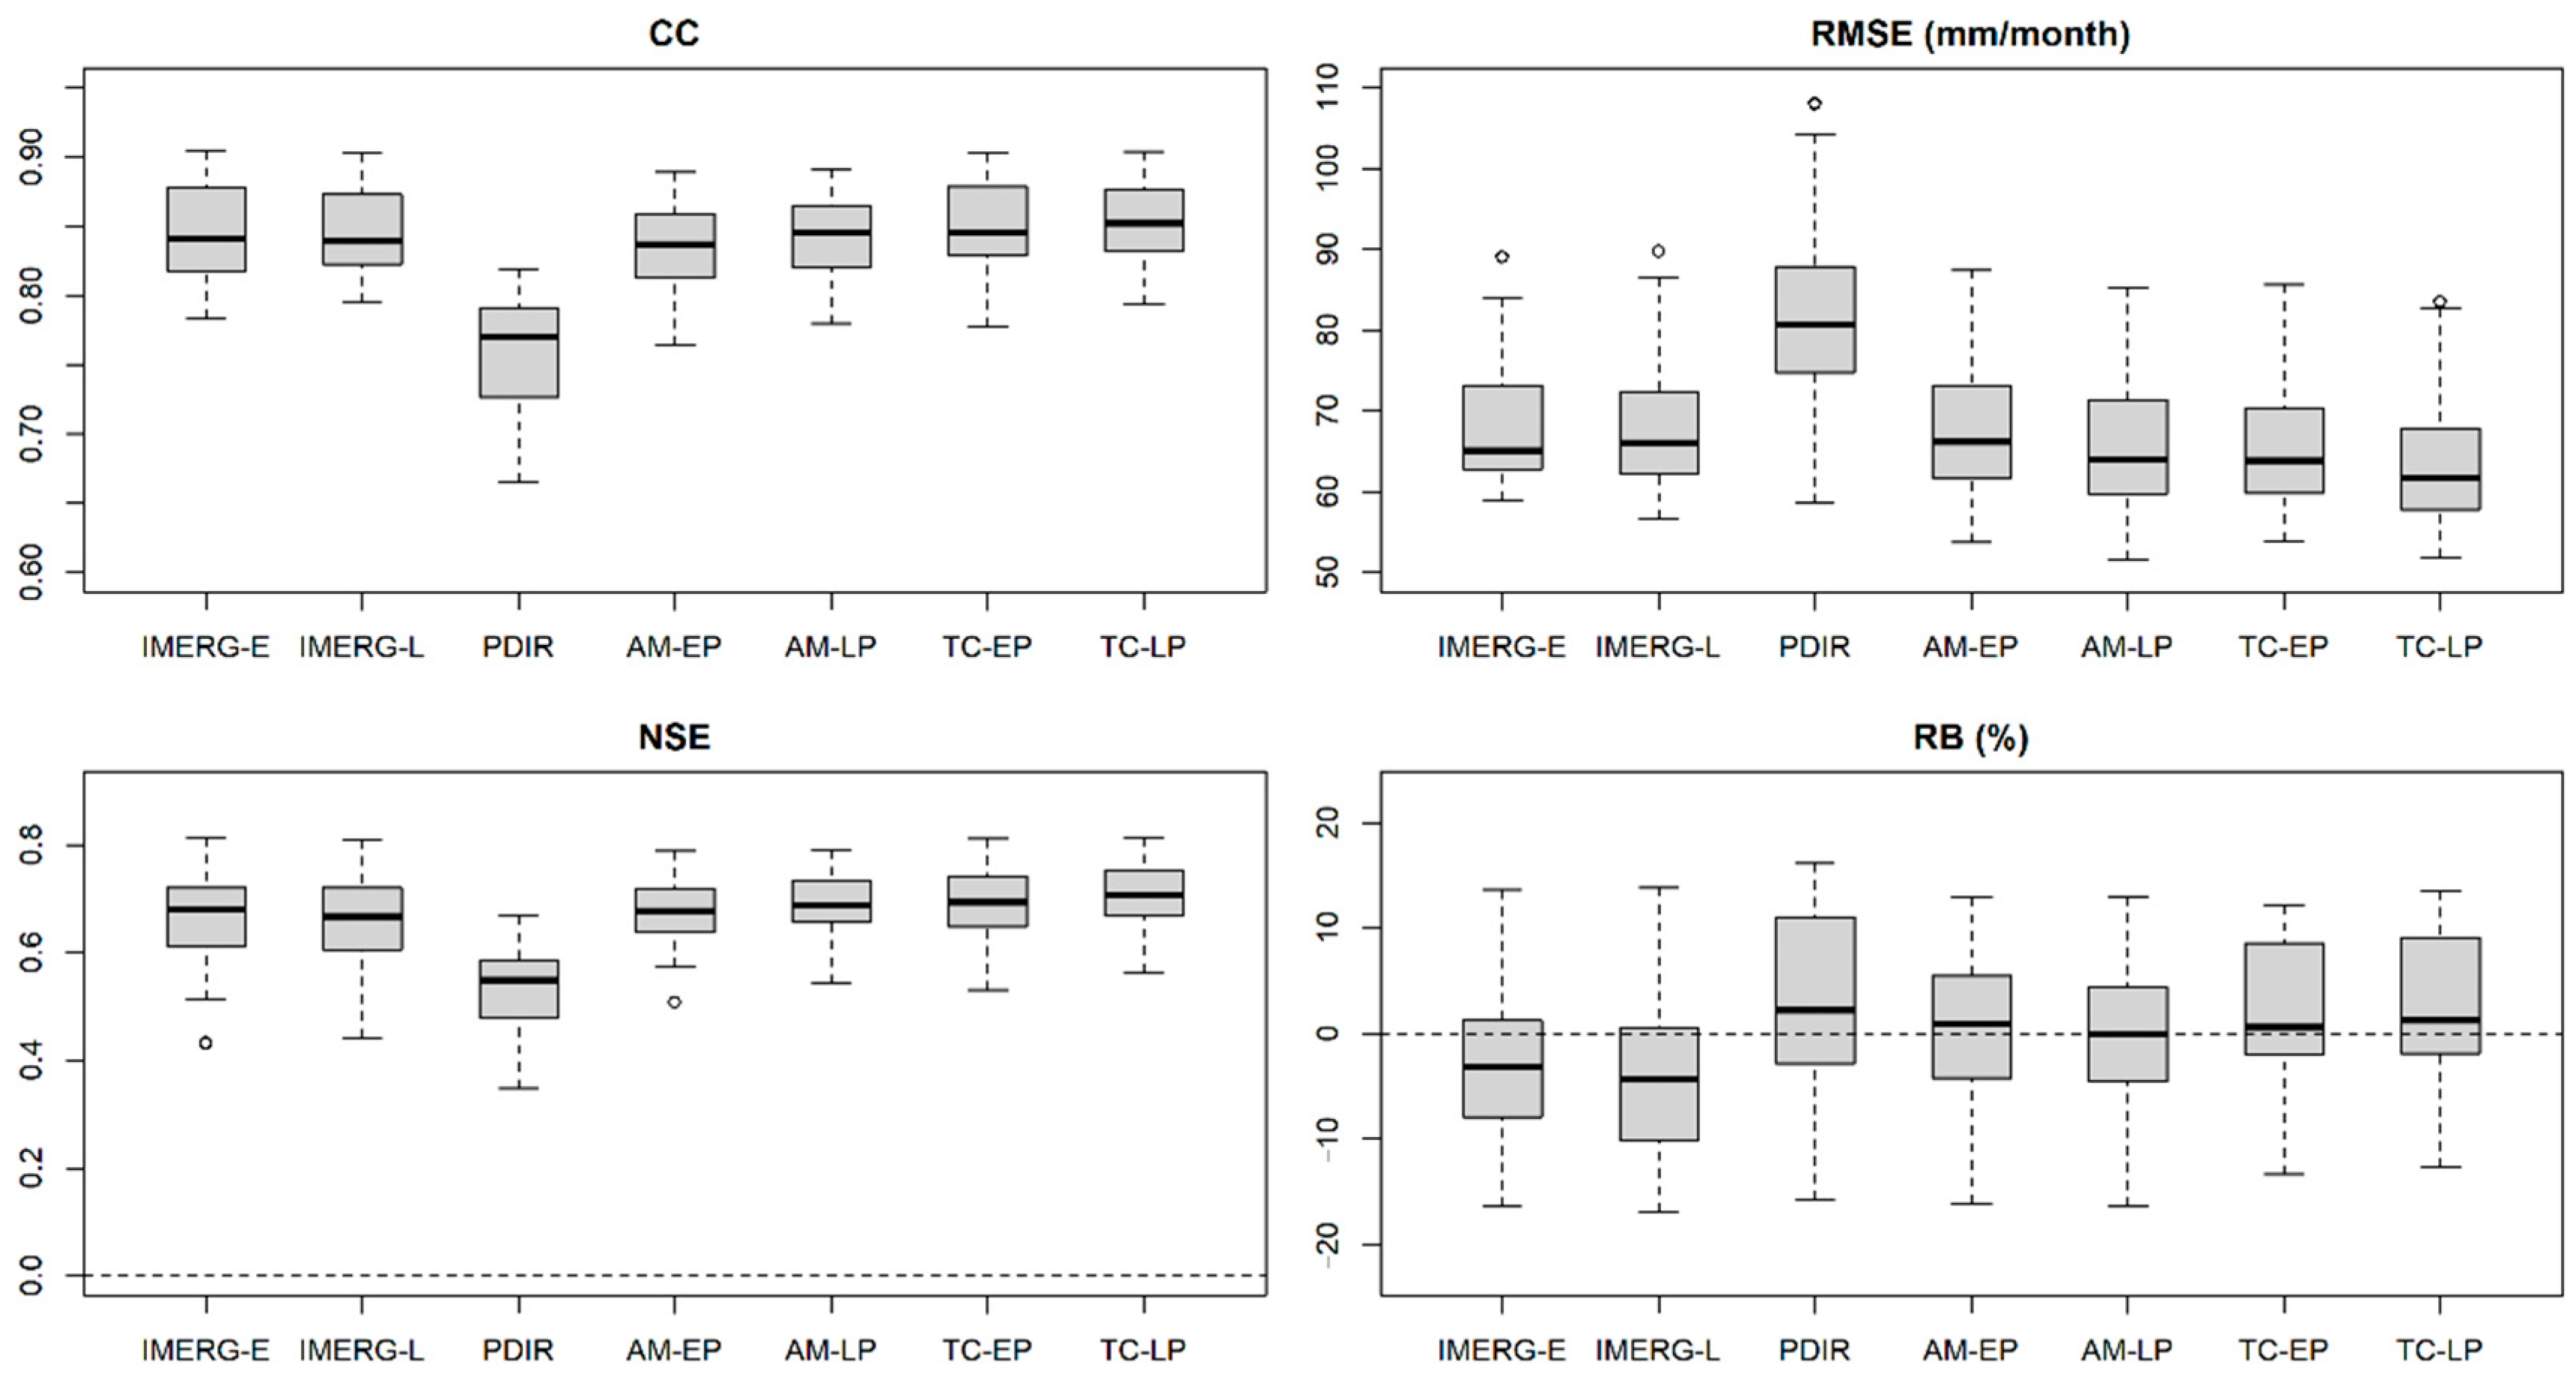
4.1. Assessment of the Near-Real-Time Merged SPEs

Table 2 lists the assessment metrics of the original SPEs and merged SPEs using the TC and AM approaches from 2001 to 2018 at all stations. For the three original SPEs, IMERG-L shows the highest accuracy, with a CC over 0.7, an NSE over 0.4, and the smallest RMSE. IMERG-E has slightly lower performance than IMERG-L with similar metric values. The PDIR shows the lowest accuracy among the three SPEs, with a CC of about 0.5 and an NSE close to zero. The likely reason is that the major data source of PDIR is IR data, whereas the IMERG series utilizes PMW and precipitation radar data. Both IMERG products underestimate precipitation while PDIR slightly overestimates precipitation.
For the merged SPEs, both TC-based merged SPEs exhibit improvements over the input original SPEs; however, the CC values are slightly lower, and the TC-EP and TC-LP have smaller RMSEs and RBs and higher NSEs (over 0.4 and 0.45 respectively) than the IMERG-E and IMERG-L, respectively; this result suggests that although the PDIR has lower accuracy than the other SPEs to be merged, its superiority (e.g., RB) results in higher overall performance of the merged product. TC-LP outperforms TC-EP, probably because the input IMERG-L for TC-LP has higher accuracy than the IMERG-E for TC-EP. A comparison of the TC-EP and TC-LP with the AM-EP and AM-LP also shows that the TC-based merged SPEs outperform the AM-based merged SPEs. The former has much higher CCs (e.g., about 0.64 for AM-EP and 0.68 for TC-EP) and higher NSEs (e.g., 0.35 for AM-EP and 0.4 for TC-EP) than the latter; this result indicates that the TC-based approach utilizes the error characteristic of the SPEs and finds suitable weights for multi-SPE merging, generating more reasonable merging products than the simple equal-weighted AM merging approach for ungauged areas. Therefore, the TC-based approach has great potential for generating more reliable multi-SPE merged near-real-time precipitation data for ungauged areas.
Nevertheless, the results of the CSIs show that multi-SPE merging provides no apparent improvements in the detection of light and heavy precipitation events. CSI_1 and CSI_25 of TC-EP and TC-LP are higher than those of AM-EP and AM-LP but somewhat lower than those of IMERG-E and IMERG-L as the merging inputs. Since the PDIR as an input of the merged SPEs has much lower CSIs, it might indicate that the TC-based merging approach is more easily influenced by low-quality inputs for detecting precipitation events.
Figure 3 shows the boxplots of the assessment metrics of the SPEs for the meteorological stations; it is observed that TC-EP and TC-LP have the best performances among all original and merged SPEs, except for the CSI. The PDIR exhibits the lowest accuracy of the SPEs and the widest range of the RMSE, NSE, and RB values, revealing relatively high instability over different spatial locations. In comparison, the TC-EP and TC-LP generally have a narrower range of the NSE than the other SPEs, indicating the relatively high stability of the performance of the TC-based merging approach.
Next, all the original and merged SPEs and the precipitation observations are temporally aggregated monthly, and the assessment metrics are calculated to evaluate the SPEs’ performance. The results are listed in Table 3 and shown in Figure 4. Note that CSI_1 and CSI_25 are used for assessing the skill of detecting daily precipitation events, thus they are not used to assess the monthly precipitation data and not shown in Table 3 and Figure 4. The accuracy of all SPEs shows an improvement from the daily to the monthly timescale, with CCs exceeding 0.8 (except for the PDIR) and NSEs close to 0.7. The TC-based TC-EP and TC-LP still show the best performance among all SPEs, indicating improvements over the IMERG series and the AM-based SPEs, with CCs of 0.86, NSEs of 0.73, and the smallest RMSE; these results indicate that, although the TC-based merged SPEs are processed at the daily scale, they exhibit superiority for monthly precipitation estimation, showing the potential of the TC-based merged SPEs for performing long-term near-real-time applications such as drought monitoring.
The RMSEs of the SPEs are calculated for each year from 2001 to 2018 to generate annual time series data based on the daily and monthly precipitation data to investigate the temporal variation of the performance of the TC-based merged SPEs. The results are shown in Figure 5. The PDIR generally has the largest RMSE, and the IMERG-E and IMERG-L show the lowest RMSEs in most years. In contrast, the merged SPEs, including the AM-EP/LP and TC-EP/LP, have slightly larger RMSE than the original IMERG products. Nevertheless, the original IMERG products show relatively larger errors in some years (e.g., 2007, 2013, and 2014); these errors are even larger than those of the PDIR, whereas the merged SPEs have a smaller error during these years; this result indicates that multi-SPE merging generates stable precipitation estimates with relatively small errors during periods when some SPE inputs have higher errors. The TC-based merged SPEs have smaller errors than the AM-based merged SPEs, demonstrating the superiority of the TC approach for merging SPEs without in-situ observations.

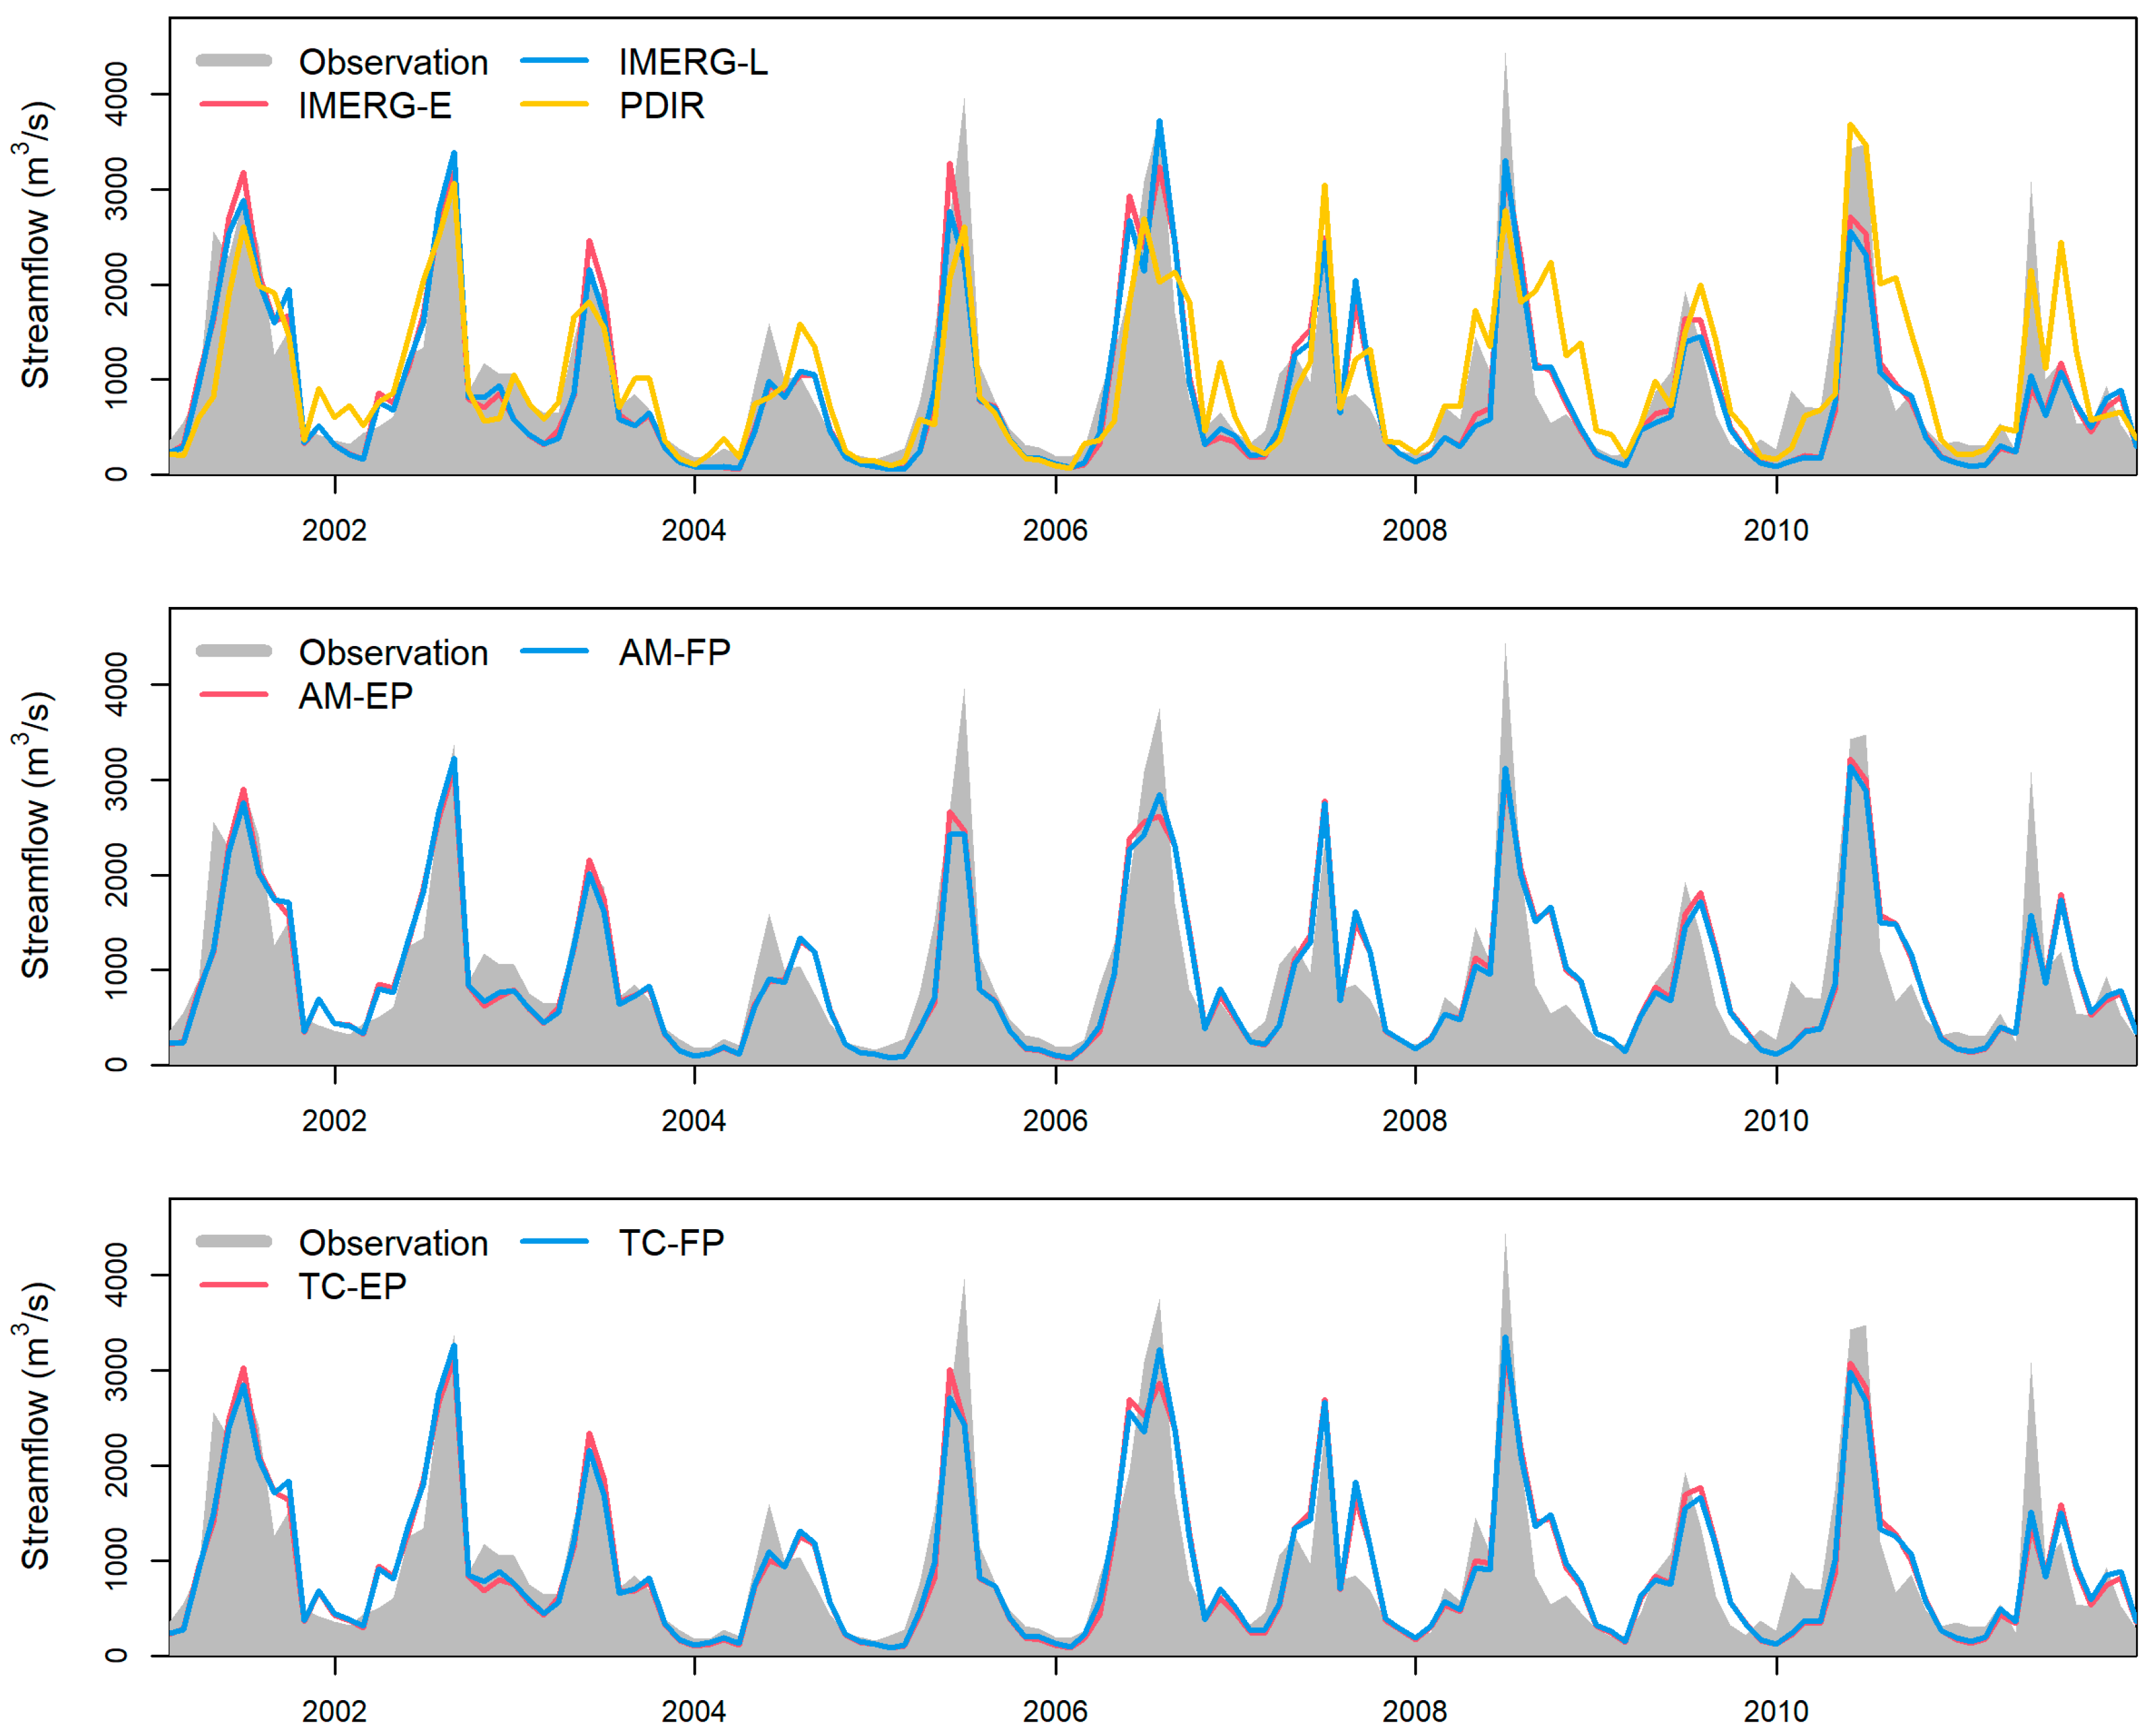
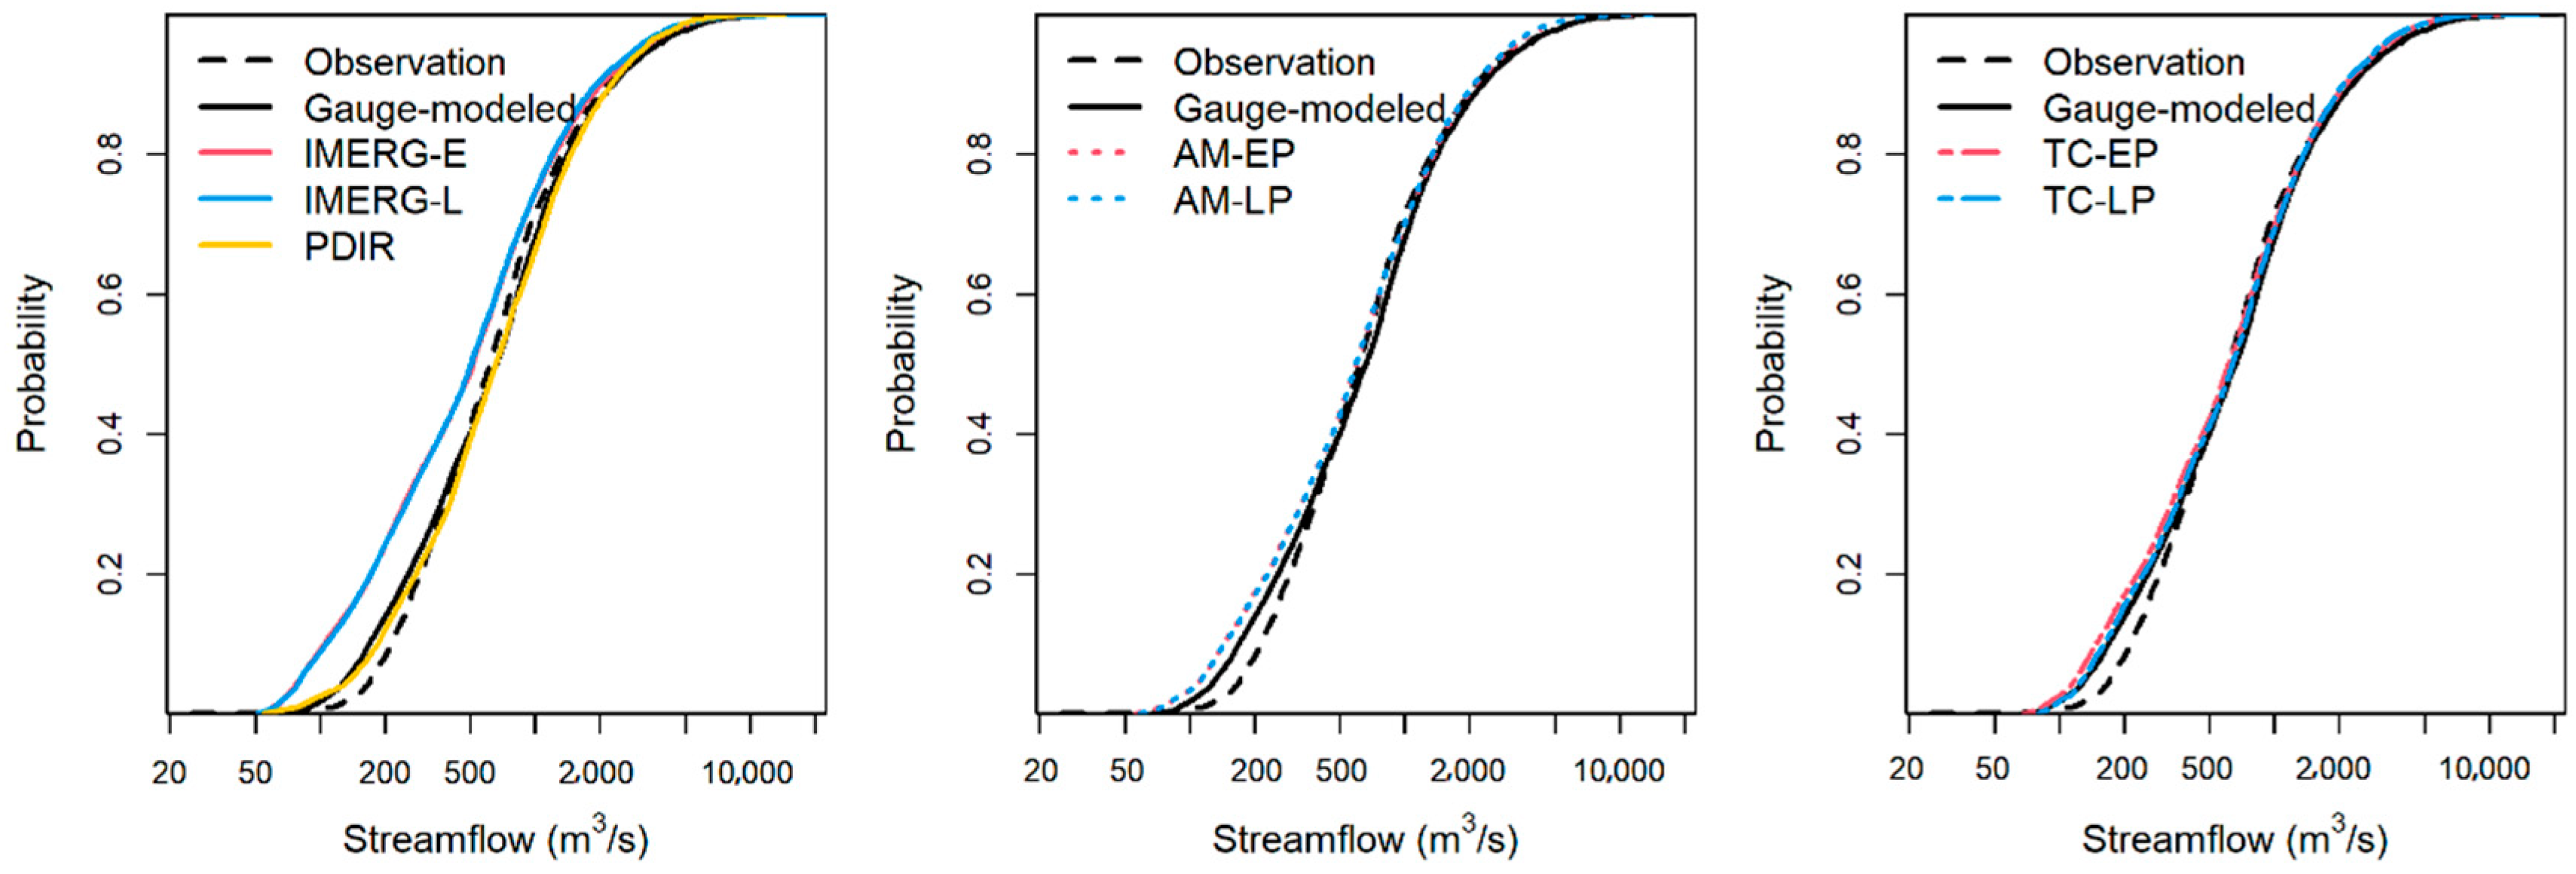
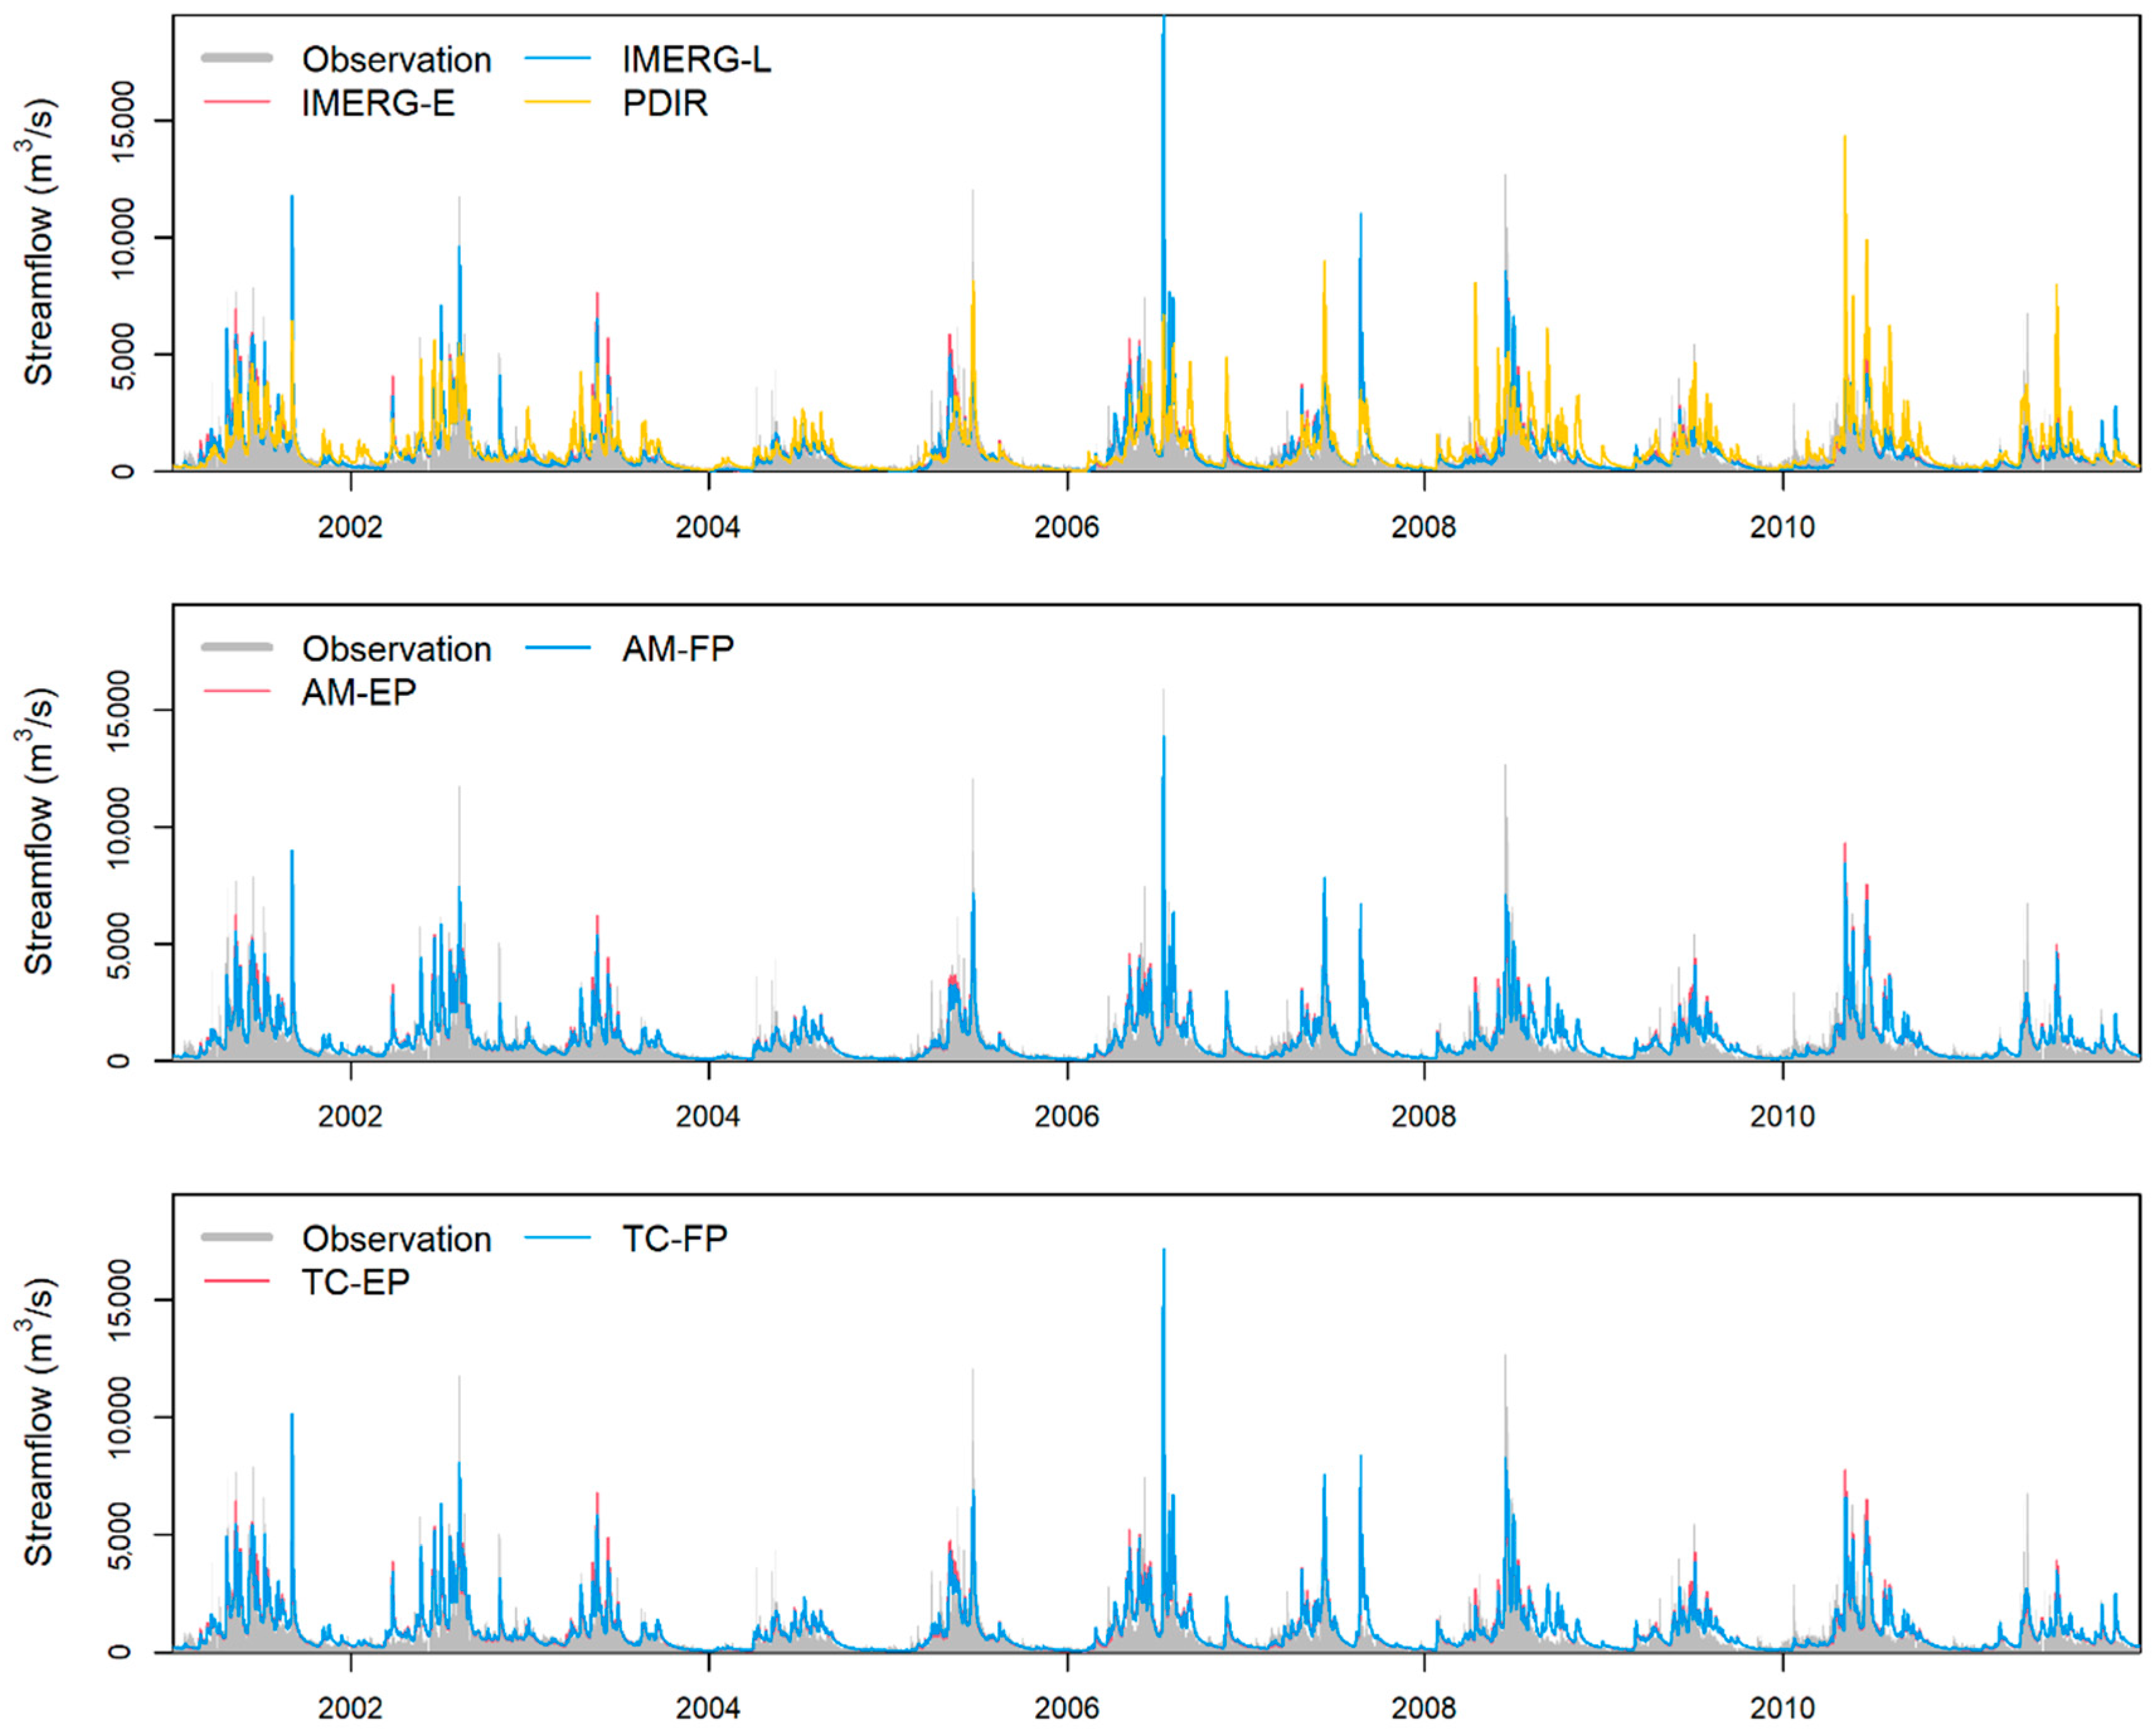
4.2. Assessment of the Hydrological Utility of the Merged SPEs

The original and merged SPEs are input to the calibrated GR4J hydrological model to generate daily and monthly streamflow data. The results are used to calculate the assessment metrics using the in-situ streamflow observations as a benchmark. The results of daily and monthly streamflow modeling are shown in Table 4/Figure 6 and Table 5/Figure 7, respectively. Note that “Gauge-modeled” in Table 4 and Table 5 represents the streamflow modeling results by using the basin-averaged precipitation observations, i.e., the modeled streamflow of the calibration result produced in Section 3.4.
The results in Table 4 show that the streamflow modeled by the TC-based merged SPEs outperforms the other SPEs, with high KGE values of about 0.75 and 0.78 and NSEs of about 0.68 and 0.72 for TC-EP and TC-LP, respectively; these values are up to 0.03 higher than the original IMERG products and up to about 0.05 higher than the AM-based merged SPEs. For the logarithmic metrics, the TC-EP and TC-LP show improvements over the original IMERG products and AM-based SPEs, with log_KGE values of about 0.84 and 0.82 and log_NSE values of about 0.68 and 0.72 for TC-EP and TC-LP, respectively; these values are 0.12 higher than those of the original IMERG products and 0.08 higher than those of the AM-based products. Since the log_KGE and log_NSE are more sensitive to low streamflow, these results indicate the superiority of the TC-based approach for modeling low-streamflow data. Note that although the PDIR shows lower KGE and NSE values for the modeled streamflow than the IMERG products, it has higher log_KGE and log_NSE values than the IMERG products. The likely reason is the superiority of the TC-based merging approach for improving low-streamflow modeling results because it utilizes the better low-flow modeling performance of the PDIR. Figure 6 also shows that the TC-based merged SPEs generally perform better for capturing both floods and low-flow conditions in the hydrograph (except for some cases), whereas the PDIR and IMERG products show lower performance in comparison with the in-situ observations.
Table 5 shows that the performance of the modeled streamflow of all SPEs has also improved at the monthly scale, with KGEs generally over 0.8 and NSEs close to 0.8. The TC-based TC-EP and TC-LP outperform all other SPEs, and the discrepancies in the metrics are larger. For instance, the KGEs and NSEs of the TC-EP and TC-LP are 0.05 higher than those of the IMERG products and 0.03 higher than those of the AM-EP and AM-LP. The PDIR also outperforms the IMERG products in low streamflow modeling, and its log_KGE is close to that of the TC-based SPEs. Therefore, the logarithmic metrics and the gap between the IMERG products and the TC-based merged SPEs are larger. The log_NSE values of TC-EP and TC-LP are 0.72 to 0.76, respectively, while those of the IMERG products are below 0.5, revealing the superiority of the TC-based merged SPEs for low streamflow modeling.
Figure 7 shows that the streamflow modeled by the TC-based merged SPEs is highly consistent with the hydrograph results at the monthly scale. In addition, the PDIR and the IMERG products have different performances for matching the hydrograph results in different periods. The PDIR generally captures smaller flows, while the IMERG products capture the mid and high flows more accurately. As the merged products of the PDIR and IMERG products, the TC-EP and TC-LP reasonably balance their advantages for low and high flow modeling, generating more reliable streamflow modeling results.
Figure 8 shows the exceedance probability curves of the streamflow modeled by the SPEs. The data are obtained from the sorted daily streamflow records and their corresponding quantiles, showing the discrepancies of the modeled streamflow at different quantiles, thereby revealing the systematic bias of SPEs for different magnitudes of streamflow. The results show that, for the original SPEs, both IMERG products generally underestimate low streamflow below 500 m³/s. Whereas, the PDIR generally exhibits smaller discrepancies with the in-situ observations for the low streamflow below 500 m³/s, indicating the smaller systematic bias in low streamflow modeling. Nevertheless, such a local superiority of PDIR has limited influence on the overall poorer accuracy of PDIR in general. The curves of the AM-based and TC-based SPEs, which integrate the PDIR data, are much closer to the in-situ observations than the original IMERG products, thus also indicating the better performance in systematic bias in low streamflow modeling.

5. Discussion

SPE is an important precipitation data source for the ungauged areas. Merging multiple SPEs can provide better precipitation estimates, because the advantages of different SPEs for different areas and seasons can be comprehensively utilized [14,15,17,20]. For example, the conventional SPEs perform better in the South China, and the SM2RAIN-ASCAT performs better in arid regions of China [15,26]. Ma et al. [14] proposed the dynamic Bayesian model averaging (BMA) merging approach to utilize the seasonal discrepancies of the error of SPEs. Nevertheless, in the conventional merging approaches like BMA, in-situ observations are necessary for the merging approaches and serve as a benchmark to ensure optimal performance of the merged products. Therefore, for the areas with sparse or even no gauge data, such gauge-relied merging approaches would be difficult to be performed.
The TC approach provides a solution for quantitatively estimating the error of the precipitation products and their weights without gauge data. In fact, the non-zero ECC assumption used in the TC approach cannot always be satisfied, since source data overlapping is typically inevitable when re-analysis data and SPEs are used [6,25,45]. Nevertheless, the assessment results of the TC approach have been widely found to be reasonable, as this method captures the error pattern of the SPEs, and the deviations from the traditional assessment approach are acceptable [5,25,26]. Because of the significantly different mechanisms, reanalysis data and SM2RAIN-ASCAT are usually utilized to constitute the TC triplet together with the SPEs thereby assess the SPEs using TC approach [6,25]. The success of the TC approach inspired researchers to utilize it and merge multiple precipitation products without requiring gauge data [4,28,29], demonstrating the feasibility of utilizing TC for multiple product merging. Chen et al. [4] found that the gauge-free TC-based merging approach performed comparably to the gauge-required Bayesian-based approach. Nevertheless, in the current studies, the data inputs to be merged are only limited to the TC triplet members, which also include the reanalysis and SM2RAIN-ASCAT. Such merging schemes are difficult to produce near-real-time precipitation data, because the reanalysis data and SM2RAIN-ASCAT as merging inputs are typically not hourly-scale near-real-time data (data release is several days later than real time), which delays the release of finally merged product; however, since the least-squares merging method of [37] requires the error variance of the estimates, this study only used the near-real-time SPEs for multi-SPE merging to obtain near-real-time merged SPE using the error variance of the SPEs separately derived by the TC approach. Thus, the ERA5 and SM2RAIN-ASCAT were merely used to complete the triplets, which are required for the TC approach.
Although the TC-based merging approach used in this study generally performed well, it could be further improved in follow-up studies. In this study, the average weights were estimated for each grid cell independently by the TC approach; thus, spatial variability occurred, although it was constant over time. Since the superiority of different SPEs has been found to vary seasonally in some areas [20], the TC-based merging approach can also be further improved by dynamically considering the seasonal discrepancies of the SPEs’ error; moreover, although the suitability of the TC for assessing SPEs has been confirmed, the ECC might be significant in some cases and might cause a bias in the estimated average. Therefore, Ref. [6] proposed an approach to correct the TC assessment results by limited gauge data; this method could be utilized for the TC-based merging approach to improve the merging performance.
For the near-real-time SPEs, latency to real time and resolution are also necessary to be considered. When the SPEs are derived by merging multiple other SPEs, it would inevitably match the longest latency of the input SPEs, and both the conventional gauge-relied merging approach and the gauge-free TC approach are no exception. Nevertheless, it is also should be note that there usually has tradeoff between accuracy and latency among near-real-time SPEs. For instance, the PDIR used in this study features shortest latency (15–60 min) but much poorer accuracy; the IMERG-E/L features apparently higher accuracy but longer latency (over 6 h). Therefore, when selecting the near-real-time SPEs, data accuracy and latency should be comprehensively considered according to the requirement of application. In this study, the TC-based merging approach still provides useful near-real-time SPEs which at least could be used to substitute IMERG-E/L in the accuracy-latency tradeoff, as they have the same long latency of IMERG-E/L, but generally have higher accuracy than IMERG-E/L; this indicate that the TC-based merging still has substantial improvement for near-real-time SPEs even when considering the latency of SPEs. While for the issue of different resolutions of the SPEs to be merged, downscaling the gridcells of coarse SPEs to fit the finer SPEs before merging might be a feasible solution. Such a downscaling approach might be geographical interpolation or introducing other auxiliary remote sensing images [46,47]. Since the aim of this study is improving the accuracy of SPEs over ungauged areas by multi-SPE merging, issues about resolution of SPEs are out of the scope of this study and thus not are further concerned in this study.

6. Conclusions

This study illustrated and evaluated the TC approach for merging multiple near-real-time SPEs and validated the hydrological modeling utility of the merged SPE products to provide more reliable near-real-time precipitation products for ungauged areas. The Beijiang river basin was used as a case study, and near-real-time IMERG-E/L and PDIR products were used. The simple AM was used for comparison.
The results showed that the TC-based approach was effective for merging multiple near-real-time SPEs and generated more reliable merged SPEs, with generally higher CCs and NSEs and smaller RMSEs than the original SPEs. The TC-based SPEs also outperformed the AM-based SPEs, demonstrating the superiority of the TC approach for determining the merging weights of the SPEs by estimating their error and indicating the suitability of the method for missing in-situ observations. Nevertheless, it should be noted that the TC-based merged SPEs did not show an improved ability to detect different precipitation events.
The TC-based merged SPEs also outperformed all other SPEs for hydrological modeling using the GR4J model. The method provided higher KGEs and NSEs than the original SPEs and the AM-based SPEs. The likely reason was the better performance of the PDIR for low streamflow modeling. The log_KGE and log_NSE metrics also showed the superiority of the TC-merged SPEs over the IMERG products for low streamflow modeling because the TC-based merging approach utilized the advantages of the input SPEs.
Overall, the TC-based multi-SPE merging approach improved the accuracy and hydrological modeling performance of the near-real-time SPEs. Since the TC approach does not require in-situ gauge observations, it has great potential for deriving more reliable near-real-time precipitation estimates, making it suitable for near-real-time applications, such as rainstorm, flood, and flash drought monitoring for areas with sparse or no gauges.

Author Contributions

Conceptualization, D.C. and C.L.; methodology, D.C.; software, D.C.; validation, D.C., H.L. and E.H.; formal analysis, D.C.; investigation, S.S.; resources, C.L.; data curation, H.L.; writing—original draft preparation, D.C.; writing—review and editing, C.L.; visualization, E.H.; supervision, C.L.; project administration, C.L.; funding acquisition, C.L. All authors have read and agreed to the published version of the manuscript.

Funding

The National Key R&D Program of China (2021YFC3001000), the Natural Science Foundation of Guangdong Province (2022A1515010019), and the Water Conservancy Science and Technology Innovation Project in Guangdong Province (2020-28).

Data Availability Statement

Not applicable.

Acknowledgments

We appreciate China Meteorological Administration, Guangdong Hydrographic Bureau, NASA, CHRS(UCI), and ECMWF for providing the data. We also acknowledge the handling editor and anonymous reviewers that helped improve this paper with their comments and suggestions.

Conflicts of Interest

The authors declare no conflict of interest.

References

  1. Nguyen, P.; Ombadi, M.; Gorooh, V.A.; Shearer, E.J.; Sadeghi, M.; Sorooshian, S.; Hsu, K.; Bolvin, D.; Ralph, M.F. PERSIANN Dynamic Infrared–Rain Rate (PDIR-Now): A Near-Real-Time, Quasi-Global Satellite Precipitation Dataset. J. Hydrometeorol. 2020, 21, 2893–2906. [Google Scholar] [CrossRef] [PubMed]
  2. Nguyen, P.; Shearer, E.J.; Ombadi, M.; Gorooh, V.A.; Hsu, K.; Sorooshian, S.; Logan, W.S.; Ralph, M. PERSIANN Dynamic Infrared–Rain Rate Model (PDIR) for High-Resolution, Real-Time Satellite Precipitation Estimation. Bull. Am. Meteorol. Soc. 2020, 101, E286–E302. [Google Scholar] [CrossRef]
  3. Bai, X.; Wu, X.; Wang, P. Blending long-term satellite-based precipitation data with gauge observations for drought monitoring: Considering effects of different gauge densities. J. Hydrol. 2019, 577, 124007. [Google Scholar] [CrossRef]
  4. Chen, C.; He, M.; Chen, Q.; Zhang, J.; Li, Z.; Wang, Z.; Duan, Z. Triple collocation-based error estimation and data fusion of global gridded precipitation products over the Yangtze River basin. J. Hydrol. 2022, 605, 127307. [Google Scholar] [CrossRef]
  5. Chen, Y.; Xu, M.; Wang, Z.; Gao, P.; Lai, C. Applicability of two satellite-based precipitation products for assessing rainfall erosivity in China. Sci. Total Environ. 2021, 757, 143975. [Google Scholar] [CrossRef]
  6. Wang, P.; Bai, X.; Wu, X.; Lai, C.; Zhang, Z. Spatially continuous assessment of satellite-based precipitation products using triple collocation approach and discrete gauge observations via geographically weighted regression. J. Hydrol. 2022, 608, 127640. [Google Scholar] [CrossRef]
  7. Wang, Z.; Zhong, R.; Lai, C.; Chen, J. Evaluation of the GPM IMERG satellite-based precipitation products and the hydrological utility. Atmos. Res. 2017, 196, 151–163. [Google Scholar] [CrossRef]
  8. Hong, Y.; Chen, S.; Xue, X.; Hodges, G. Global precipitation estimation and applications. In Multiscale Hydrologic Remote Sensing: Perspectives and Applications; Chang, N., Hong, Y., Eds.; CRC Press: Boca Raton, FL, USA, 2012; pp. 371–386. [Google Scholar]
  9. Huffman, G.J.; Bolvin, D.T.; Nelkin, E.J.; Wolff, D.B.; Adler, R.F.; Gu, G.; Hong, Y.; Bowman, K.P.; Stocker, E.F. The TRMM Multisatellite Precipitation Analysis (TMPA): Quasi-Global, Multiyear, Combined-Sensor Precipitation Estimates at Fine Scales. J. Hydrometeorol. 2007, 8, 38–55. [Google Scholar] [CrossRef]
  10. Hou, A.Y.; Kakar, R.K.; Neeck, S.; Azarbarzin, A.A.; Kummerow, C.D.; Kojima, M.; Oki, R.; Nakamura, K.; Iguchi, T. The Global Precipitation Measurement Mission. Bull. Am. Meteorol. Soc. 2014, 95, 701–722. [Google Scholar] [CrossRef]
  11. Huffman, G.J.; Bolvin, D.T.; Braithwaite, D.; Hsu, K.; Joyce, R.J.; Kidd, C.; Nelkin, E.J.; Sorooshian, S.; Stocker, E.F.; Tan, J.; et al. Integrated Multi-satellite Retrievals for the Global Precipitation Measurement (GPM) Mission (IMERG). In Satellite Precipitation Measurement; Levizzani, V., Kidd, C., Kirschbaum, D.B., Kummerow, C.D., Nakamura, K., Turk, F.J., Eds.; Springer International Publishing: Cham, Switzerland, 2020; Volume 1, pp. 343–353. [Google Scholar]
  12. Joyce, R.J.; Janowiak, J.E.; Arkin, P.A.; Xie, P. CMORPH: A Method that Produces Global Precipitation Estimates from Passive Microwave and Infrared Data at High Spatial and Temporal Resolution. J. Hydrometeorol. 2004, 5, 487–503. [Google Scholar] [CrossRef]
  13. Hsu, K.; Gao, X.; Sorooshian, S.; Gupta, H.V. Precipitation Estimation from Remotely Sensed Information Using Artificial Neural Networks. J. Appl. Meteorol. 1997, 36, 1176–1190. [Google Scholar] [CrossRef]
  14. Ma, Y.; Hong, Y.; Chen, Y.; Yang, Y.; Tang, G.; Yao, Y.; Long, D.; Li, C.; Han, Z.; Liu, R. Performance of Optimally Merged Multisatellite Precipitation Products Using the Dynamic Bayesian Model Averaging Scheme Over the Tibetan Plateau. J. Geophys. Res. Atmos. 2018, 123, 814–834. [Google Scholar] [CrossRef]
  15. Zhang, L.; Li, X.; Cao, Y.; Nan, Z.; Wang, W.; Ge, Y.; Wang, P.; Yu, W. Evaluation and integration of the top-down and bottom-up satellite precipitation products over mainland China. J. Hydrol. 2020, 581, 124456. [Google Scholar] [CrossRef]
  16. Wu, H.; Yang, Q.; Liu, J.; Wang, G. A spatiotemporal deep fusion model for merging satellite and gauge precipitation in China. J. Hydrol. 2020, 584, 124664. [Google Scholar] [CrossRef]
  17. Zhang, L.; Li, X.; Zheng, D.; Zhang, K.; Ma, Q.; Zhao, Y.; Ge, Y. Merging multiple satellite-based precipitation products and gauge observations using a novel double machine learning approach. J. Hydrol. 2021, 594, 125969. [Google Scholar] [CrossRef]
  18. Chen, S.; Xiong, L.; Ma, Q.; Kim, J.; Chen, J.; Xu, C. Improving daily spatial precipitation estimates by merging gauge observation with multiple satellite-based precipitation products based on the geographically weighted ridge regression method. J. Hydrol. 2020, 589, 125156. [Google Scholar] [CrossRef]
  19. Jiang, S.; Ren, L.; Hong, Y.; Yong, B.; Yang, X.; Yuan, F.; Ma, M. Comprehensive evaluation of multi-satellite precipitation products with a dense rain gauge network and optimally merging their simulated hydrological flows using the Bayesian model averaging method. J. Hydrol. 2012, 452–453, 213–225. [Google Scholar] [CrossRef]
  20. Ma, Y.; Sun, X.; Chen, H.; Hong, Y.; Zhang, Y. A two-stage blending approach for merging multiple satellite precipitation estimates and rain gauge observations: An experiment in the northeastern Tibetan Plateau. Hydrol. Earth Syst. Sci. 2021, 25, 359–374. [Google Scholar] [CrossRef]
  21. Stoffelen, A. Toward the true near-surface wind speed: Error modeling and calibration using triple collocation. J. Geophys. Res. Oceans. 1998, 103, 7755–7766. [Google Scholar] [CrossRef]
  22. Roebeling, R.A.; Wolters, E.L.A.; Meirink, J.F.; Leijnse, H. Triple Collocation of Summer Precipitation Retrievals from SEVIRI over Europe with Gridded Rain Gauge and Weather Radar Data. J. Hydrometeorol. 2012, 13, 1552–1566. [Google Scholar] [CrossRef]
  23. McColl, K.A.; Vogelzang, J.; Konings, A.G.; Entekhabi, D.; Piles, M.; Stoffelen, A. Extended triple collocation: Estimating errors and correlation coefficients with respect to an unknown target. Geophys. Res. Lett. 2014, 41, 6229–6236. [Google Scholar] [CrossRef] [Green Version]
  24. Alemohammad, S.H.; McColl, K.A.; Konings, A.G.; Entekhabi, D.; Stoffelen, A. Characterization of precipitation product errors across the United States using multiplicative triple collocation. Hydrol. Earth Syst. Sci. 2015, 19, 3489–3503. [Google Scholar] [CrossRef] [Green Version]
  25. Bai, X.; Wang, P.; He, Y.; Zhang, Z.; Wu, X. Assessing the accuracy and drought utility of long-term satellite-based precipitation estimation products using the triple collocation approach. J. Hydrol. 2021, 603, 127098. [Google Scholar] [CrossRef]
  26. Li, C.; Tang, G.; Hong, Y. Cross-evaluation of ground-based, multi-satellite and reanalysis precipitation products: Applicability of the Triple Collocation method across Mainland China. J. Hydrol. 2018, 562, 71–83. [Google Scholar] [CrossRef]
  27. Tang, G.; Clark, M.P.; Papalexiou, S.M.; Ma, Z.; Hong, Y. Have satellite precipitation products improved over last two decades? A comprehensive comparison of GPM IMERG with nine satellite and reanalysis datasets. Remote Sens. Environ. 2020, 240, 111697. [Google Scholar] [CrossRef]
  28. Dong, J.; Lei, F.; Wei, L. Triple Collocation Based Multi-Source Precipitation Merging. Front. Water 2020, 2, 1. [Google Scholar] [CrossRef]
  29. Lyu, F.; Tang, G.; Behrangi, A.; Wang, T.; Tan, X.; Ma, Z.; Xiong, W. Precipitation Merging Based on the Triple Collocation Method Across Mainland China. IEEE Trans. Geosci. Remote Sens. 2021, 59, 3161–3176. [Google Scholar] [CrossRef]
  30. Brocca, L.; Filippucci, P.; Hahn, S.; Ciabatta, L.; Massari, C.; Camici, S.; Schüller, L.; Bojkov, B.; Wagner, W. SM2RAIN–ASCAT (2007–2018): Global daily satellite rainfall data from ASCAT soil moisture observations. Earth Syst. Sci. Data 2019, 11, 1583–1601. [Google Scholar] [CrossRef] [Green Version]
  31. Tan, J.; Huffman, G.J.; Bolvin, D.T.; Nelkin, E.J. IMERG V06: Changes to the Morphing Algorithm. J. Atmos. Ocean. Technol. 2019, 36, 2471–2482. [Google Scholar] [CrossRef]
  32. Hong, Y.; Hsu, K.; Sorooshian, S.; Gao, X. Precipitation Estimation from Remotely Sensed Imagery Using an Artificial Neural Network Cloud Classification System. J. Appl. Meteorol. 2004, 43, 1834–1853. [Google Scholar] [CrossRef] [Green Version]
  33. Hersbach, H.; Bell, B.; Berrisford, P.; Hirahara, S.; Horányi, A.; Muñoz-Sabater, J.; Nicolas, J.; Peubey, C.; Radu, R.; Schepers, D.; et al. The ERA5 global reanalysis. Q. J. Roy. Meteor. Soc. 2020, 146, 1999–2049. [Google Scholar] [CrossRef]
  34. Brocca, L.; Ciabatta, L.; Massari, C.; Moramarco, T.; Hahn, S.; Hasenauer, S.; Kidd, R.; Dorigo, W.; Wagner, W.; Levizzani, V. Soil as a natural rain gauge: Estimating global rainfall from satellite soil moisture data. J. Geophys. Res. Atmos. 2014, 119, 5128–5141. [Google Scholar] [CrossRef]
  35. Brocca, L.; Moramarco, T.; Melone, F.; Wagner, W. A new method for rainfall estimation through soil moisture observations. Geophys. Res. Lett. 2013, 40, 853–858. [Google Scholar] [CrossRef]
  36. Allen, R.G.; Pereira, L.S.; Raes, D.; Smith, M. Crop Evapotranspiration-Guidelines for Computing Crop Water Requirements-FAO Irrigation and Drainage Paper 56; FAO: Rome, Italy, 1998; Volume 300, p. D05109. [Google Scholar]
  37. Yilmaz, M.T.; Crow, W.T.; Anderson, M.C.; Hain, C. An objective methodology for merging satellite- and model-based soil moisture products. Water Resour. Res. 2012, 4, W11502. [Google Scholar] [CrossRef]
  38. Gupta, H.V.; Kling, H.; Yilmaz, K.K.; Martinez, G.F. Decomposition of the mean squared error and NSE performance criteria: Implications for improving hydrological modelling. J. Hydrol. 2009, 377, 80–91. [Google Scholar] [CrossRef] [Green Version]
  39. Perrin, C.; Michel, C.; Andréassian, V. Improvement of a parsimonious model for streamflow simulation. J. Hydrol. 2003, 279, 275–289. [Google Scholar] [CrossRef]
  40. Demirel, M.C.; Booij, M.J.; Hoekstra, A.Y. Effect of different uncertainty sources on the skill of 10 day ensemble low flow forecasts for two hydrological models. Water Resour. Res. 2013, 49, 4035–4053. [Google Scholar] [CrossRef]
  41. Zhong, R.; Zhao, T.; Chen, X. Hydrological Model Calibration for Dammed Basins Using Satellite Altimetry Information. Water Resour. Res. 2020, 56, e2020WR027442. [Google Scholar] [CrossRef]
  42. Zhong, R.; Zhao, T.; Chen, X. Evaluating the tradeoff between hydropower benefit and ecological interest under climate change: How will the water-energy-ecosystem nexus evolve in the upper Mekong basin? Energy 2021, 237, 121518. [Google Scholar] [CrossRef]
  43. Duan, Q.; Sorooshian, S.; Gupta, V.K. Optimal use of the SCE-UA global optimization method for calibrating watershed models. J. Hydrol. 1994, 158, 265–284. [Google Scholar] [CrossRef]
  44. Kim, T.; Yang, T.; Zhang, L.; Hong, Y. Near real-time hurricane rainfall forecasting using convolutional neural network models with Integrated Multi-satellitE Retrievals for GPM (IMERG) product. Atmos. Res. 2022, 270, 106037. [Google Scholar] [CrossRef]
  45. Chen, F.; Crow, W.T.; Ciabatta, L.; Filippucci, P.; Panegrossi, G.; Marra, A.C.; Puca, S.; Massari, C. Enhanced Large-Scale Validation of Satellite-Based Land Rainfall Products. J. Hydrometeorol. 2021, 22, 245–257. [Google Scholar] [CrossRef]
  46. Kyriakidis, P.C. A Geostatistical Framework for Area-to-Point Spatial Interpolation. Geogr. Anal. 2004, 36, 259–289. [Google Scholar] [CrossRef]
  47. Duan, Z.; Bastiaanssen, W.G.M. First results from Version 7 TRMM 3B43 precipitation product in combination with a new downscaling-calibration procedure. Remote Sens. Environ. 2013, 131, 1–13. [Google Scholar] [CrossRef]
Figure 1. Location and topography of the Beijiang river basin.
Remotesensing 14 03835 g001
Figure 2. Calibration results of the GR4J model in the Beijiang river basin.
Remotesensing 14 03835 g002
Figure 3. Boxplots of the assessment metrics of the SPEs (daily estimates) for all meteorological stations. Note: The upper/lower edges of the box mark the 75%/25% quantiles, the line in the box marks the median, the horizontal lines denote the maximum and minimum, respectively, and the points indicate outliers.
Remotesensing 14 03835 g003
Figure 4. Boxplots of the assessment metrics of the SPEs at the monthly scale for all meteorological stations.
Remotesensing 14 03835 g004
Figure 5. RMSEs of the SPEs at daily and monthly scales for each year from 2001 to 2018.
Remotesensing 14 03835 g005
Figure 6. Time series of the modeled daily streamflow data for the original and merged SPEs.
Remotesensing 14 03835 g006
Figure 7. Time series of the modeled monthly streamflow data for the original and merged SPEs.
Remotesensing 14 03835 g007
Figure 8. Daily streamflow-exceedance probability plots of the modeled streamflow for the original and merged SPEs.
Remotesensing 14 03835 g008
Table 1. Assessment metrics used in this study.
MetricsFormulaPerfect ValueUsage
Correlation coefficient (CC) CC = ( S S ¯ ) ( O O ¯ ) ( S S ¯ ) ( O O ¯ ) 1Assessing accuracy of SPEs
Root mean square error (RMSE) RMSE = ( S O ) n 0Assessing accuracy of SPEs
Nash-Sutcliffe efficiency coefficient (NSE) NSE = 1 ( S O ) 2 ( O O ¯ ) 2 1Assessing accuracy of SPEs and modeled streamflow
log_NSE Log _ NSE = 1 ( log ( S ) log ( O ) ) 2 ( log ( O ) log ( O ) ¯ ) 2 1Assessing accuracy of SPEs and modeled streamflow
Relative bias (RB) RB = ( S ¯ O ¯ 1 ) × 100 % 0Assessing accuracy of SPEs’ modeled streamflow
Critical success index (CSI) CSI = H H + M + F 1Assessing accuracy of SPEs
Kling-Gupta efficiency coefficient (KGE) KGE = 1 ( r 1 ) 2 + ( α 1 ) 2 + ( β 1 ) 2
where:
{ r = CC α = σ ( S ) σ ( O ) β = S ¯ O ¯
1Assessing accuracy of SPEs’ modeled streamflow,
objective function of hydrological model calibration
log_KGESame as KGE, but logarithms of the inputs are used for calculation.1Assessing accuracy of SPEs’ modeled streamflow
Note: S and O are the SPE data to be assessed and the benchmark, respectively; S ¯ and O ¯ are their mean values; σ ( S ) and σ ( O ) are their standard deviation; n is the record length; for CSI, H (hits) denotes the number of precipitation events captured by both the SPEs and benchmark data, M (miss) denotes the precipitation event only captured by the benchmark data, and F (false alarms) denotes the precipitation event only captured by the SPEs.
Table 2. Assessment metrics of the original and merged SPEs at the daily scale.
SPEsCCRMSE (mm/day)NSERB (%)CSI_1CSI_25
IMERG-E0.6929.70.393−3.10.5590.347
IMERG-L0.7159.50.419−4.20.5820.370
PDIR0.51611.90.0961.90.4740.226
AM-EP0.64610.00.355−0.60.5170.305
AM-LP0.6729.60.401−1.20.5240.320
TC-EP0.6779.60.4050.90.5310.329
TC-LP0.7069.20.4561.50.5400.351
Table 3. Assessment metrics of the original and merged SPEs at the monthly scale.
SPEsCCRMSE (mm/month)NSERB (%)
IMERG-E0.85168.70.692−3.1
IMERG-L0.85268.40.695−4.2
PDIR0.76282.70.5531.9
AM-EP0.84068.20.696−0.6
AM-LP0.84766.70.709−1.2
TC-EP0.85365.80.7170.9
TC-LP0.85964.20.7311.5
Table 4. Assessment metrics of the modeled daily streamflow for the original and merged SPEs.
SPEsKGElog_KGENSElog_NSE RMSE   ( m 3 / s ) RB (%)
Gauge-modeled0.9310.8850.8810.848435.73.6
IMERG-E0.7460.7250.6650.467732.1−13.9
IMERG-L0.7570.7410.6850.487710.7−15.4
PDIR0.6600.7690.4530.523936.00.6
AM-EP0.7260.7970.6420.601757.3−7.0
AM-LP0.7370.8070.6730.618723.8−7.9
TC-EP0.7550.8180.6790.650717.0−5.8
TC-LP0.7810.8450.7180.696671.8−4.8
Table 5. Assessment metrics of the modeled monthly streamflow for the original and merged SPEs.
SPEsKGElog_KGENSElog_NSE RMSE   ( m 3 / s ) RB (%)
Gauge-modeled0.9190.8480.9690.926157.53.5
IMERG-E0.8100.6730.7570.475440.6−14.1
IMERG-L0.7930.6890.7640.486434.9−15.6
PDIR0.7880.8000.6610.611520.60.5
AM-EP0.8260.7890.7780.667421.0−7.2
AM-LP0.8170.7980.7860.676414.0−8.0
TC-EP0.8500.8090.8020.720397.8−5.9
TC-LP0.8480.8450.8200.764379.5−5.0
Publisher’s Note: MDPI stays neutral with regard to jurisdictional claims in published maps and institutional affiliations.

