Abstract
As a large-scale irrigation and water conservancy project in ancient times, karez are common in Central Asia and arid regions with a history of thousands of years. Turpan, which is located in the Xinjiang Uyghur Autonomous Region, has the most extensive and concentrated distribution of karez shafts in China. There are tens of thousands of shafts, some of which are in use and are living cultural heritage. According to radiocarbon (14C) dating, some karezs are over 600 years old. The karez is of great significance to the research on geology, hydrology, oasis, climate change, and development history of karez in Turpan. With the development of the population, arable land, industrialization, and urbanization, karez systems are facing the risk of abandonment. Detailed karez distribution mapping or dynamic monitoring data are important for their management or analysis; although there are related methods, due to Turpan’s large desert and “Gobi” environments, field surveys are time- and energy-consuming, and some areas are difficult to access. Precise shaft locations and distribution maps are scarce and often lack georeferencing. The distribution and preservation of karez have not yet been fully grasped. In this study, we evaluated the effectiveness of You Only Look Once version 5 (YOLOv5) in automatically detecting karez in high-resolution images of the Turpan region. We propose post-processing steps to reduce the false karez identified by YOLOv5. Our results demonstrate the feasibility of using YOLOv5 and post-processing techniques to detect karez automatically, and the detected results are sufficient to capture the linear alignment of karez. Target detection based on YOLOv5 and post-processing can greatly improve automatic shaft identification and is therefore useful for the fine mapping of karez. We also applied this method in Shanshan County (for which no detailed mapping data on karez has been obtained before) and successfully detected some karez that had not been archived before. The number of shafts in Turpan is 82,493. Through DBSCAN clustering, it was identified which karez line belonged to which shaft; the number of sections of karez that have been used is 5057, which have a total length of 2387.2 km. The karez line obtained was overlaid with the crop-land data, and the positional relationship between the karez line and the crop land was analyzed. The cultivated area is basically surrounded by karez. Our method can potentially be applied to construct an inventory for all karez shafts globally.
1. Introduction
A karez is a system for transporting water from an aquifer or well to the surface through an underground aqueduct. They are called “Kariz” in places such as Afghanistan and Central Asia, and are called “Kanatz-qanat (Kannaz)” in Iranian Persian. Iran now calls the karez “Qanat”. In Pakistan, karezes are called “karezes”; in North Africa, they are called “Foggaras”; in the United Arab Emirates, they are called “Aflaj” [1]. Constructed in arid or semi-arid areas, a karez allows water to be transported over long distances in hot and dry climates without much water loss due to evaporation. Furthermore, karez are unaffected by the amount of precipitation and can deliver an almost unvarying flow of water in both wet and dry years. Karez systems were constructed as a series of well-like vertical shafts connected by a gently sloping tunnel, as shown in Figure 1. These shafts tap into the underground water and deliver it to the surface by gravity, without the need for pumping. Vertical shafts located along the underground channel are used for maintenance and ventilation. Thus, karez provide a reliable supply of water for human settlements and are used for irrigation in hot arid and semi-arid climates. The outflow of karez depends directly on the quality and volume of available groundwater.
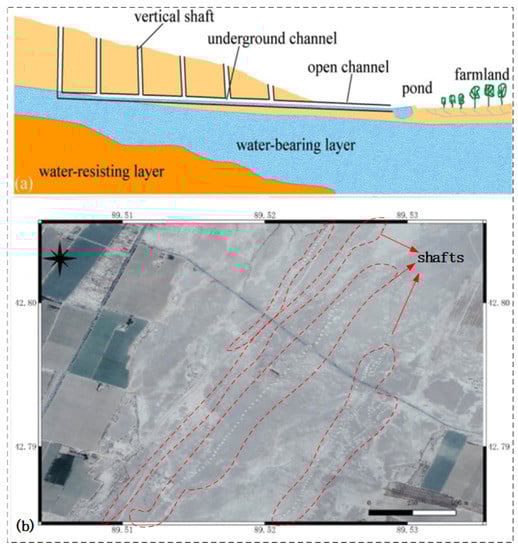
Figure 1.
(a) Cross-sectional view and (b) top view (satellite image) of a karez structure, the red dotted line in the figure indicates the location of the shaft. It can be seen from the cross-section that a karez is an underground culvert composed of vertical wells of different depths, with the parent well being connected to the underground aquifer. In the top view, the line formed by the shaft wellheads marks the course of the karez.
Karez systems are widely distributed in arid and semiarid areas. A karez, also known as qanat, is a water-harvesting system for irrigation and agricultural development. Karez systems are more than 3000 years old and are widely distributed in arid and semiarid areas of more than 40 other countries and regions globally, including those in Iran, Afghanistan, Pakistan, the Sinai Peninsula, the Arabian Peninsula, Central Asia, North Africa, Mexico, Peru, Chile, and Europe. Due to its long history and crucial role in agriculture, karez are also an important part of the agricultural cultural heritage of humanity, and are still used today. In addition to their great historical and cultural value [2], karez systems help maintain the agricultural and ecological water balance, promote tourism, and maintain the diversity of animals and plants [3]. In addition, as it is rich in minerals, karez water exhibits good quality. The Persian karez in Iran was inscribed on the World Heritage List by the United Nations Educational, Scientific, and Cultural Organization (UNESCO) in 2017, as it is considered to satisfy UNESCO’s criteria (iii) and (iv) in relation to outstanding universal value. Iran has established a Karez–Ancient Water Conservancy Engineering International Center, which has played a key role in the research and protection of karez. The Karez Research Association was established in the Xinjiang Uyghur Autonomous Region of China to conduct a general survey of karez and plan how they should be protected and utilized. The karez system in China constitutes a national key-cultural-relic protection unit and was included in UNESCO’s World Cultural Heritage Tentative List in 2008.
The karez of China are mainly distributed in the Tuha Basin of Xinjiang, with Turpan having the most karez. Turpan is located in the hinterland of Eurasia and the mountain basin in the southern part of the eastern section of the Tianshan Mountains. It is an important relay station on the Silk Road and Eurasian Land Bridge. In the history of communication between China and the West, there were three main roads from the Han to the Tang Dynasty, namely, “South Road”, “North Road” and “Xindao”, and Turpan (Che Shi Qian Guo, Gao Chang) was the starting point of “North Road”, and the end and new starting point of “Xindao”. With the transfer of the Silk Road from “South Road” to “North Road”, the Turpan region became an important hub on the route between China and the West. Many scenic spots and historic sites exist, including the ancient tombs of Astana, Jiaohe Ruins, Ancient City of Gaochang, and Flaming Mountains. The larger temperature difference between morning and evening and the longer sunshine time give rise to the scent of melons and grapes. The main crops grown in Turpan are watermelons, cotton, and grapes. With the expansion of the population and cultivated land, human efforts to develop natural resources have intensified. Glacier melting has accelerated in the context of global climate change. As the water source of various basins in Xinjiang, glaciers in the Tianshan Mountains also affect the water-resource environment of Turpan to a certain extent. In recent years, the area of Aiding Lake has shrunk [4]. The groundwater level of the Turpan Basin has decreased [5]. Some studies [6,7,8,9] predicted that, by 2030, karez in Turpan may completely disappear.
Aerospace remote sensing has provided new technical means for archaeological and cultural-heritage research. Luo et al. reviewed archaeological and cultural-heritage research with remote sensing in the past 100 years [10]. Many studies have been conducted on the automatic extraction of karez. Ref. [11] used the edge-detection algorithm of a morphological operator and the circular Hough transform method to automatically extract the top of the karez shaft. Ref. [12] used a deep convolutional neural network algorithm and CORONA images to automatically identify karez in Iraq. Ref. [13] distinguished between active and inactive karez in Afghanistan based on the presence or absence of shadows at the shaft entrance. Ref. [14] published a topographic map of Turpan during his exploration of Turpan in 1907, and 1914–1915. With contour lines as the background, the topographic map drew roads, rivers, karez, arable land, mosques, ruins, and watchtowers. However, the records of karez were incomplete and only some karez were mapped. Ref. [15] dated eight karez in Turpan for the first time by using C14 based on Setin’s karez map, and dated karez wells by using the innermost vegetation residue buried in karez mounds outside the karez shaft head. It shows that the earliest construction age of the eight karez is the early 15th century, which belongs to the Uighur Era (790-1755AD). Ref. [6] presented a research method for processing historical data sources for the karez landscape. Ref. [16] compared land use types and spatial and temporal changes in karez in the Turpan Basin in 1990, 2000, and 2010 based on GIS technology. Ref. [17] analyzed the influencing factors of the spatial distribution of karez. Ref. [18] discussed the origin and diffusion of karez. Ref. [19] studied karez from the perspective of ecological anthropology. Ref. [20] conducted a numerical simulation of karez. Mustafa analyzed the transition from karez to electromechanical wells in Pakistan [21]. Ref. [1] compared the engineering exploration and measurement methods of karez in China and Kazan, Iran. Ref. [22] used remote sensing and GIS to identify sites to reconstruct the military defense system of ancient Rome. Ref. [23] recreated the ancient water systems of Arabia based on remote sensing and GIS.
Deep-learning algorithms have brought new technical methods to remote-sensing image interpretation. In the field of computer vision for natural-scene image processing and recognition, The application of deep-learning algorithms is developing rapidly. There are some public datasets, including COCO [24], Cityscapes [25], VOC [26], etc., that allow scholars or scientific research communities to conduct algorithm research, algorithm testing, and accuracy evaluation. In addition, many excellent high-precision deep-learning algorithms have emerged. However, deep-learning algorithms applicable to natural-scene images may not be applicable to all remote-sensing images and scenes. The differences between pictures of natural scenes and remote-sensing images include: the natural scene is a close-range picture of an earth-surface scene taken by a mobile phone or a camera. The image pixels do not have a uniform resolution for the size of the object. Due to the close-range shooting, the number of pixels occupied by the object is relatively large. In addition, because of different shooting angles, the view of the same object may be different. In remote-sensing images, the scale of all objects is small, and the imaging results of the same object have certain differences due to different sensors, illumination, and atmospheric conditions. Therefore, when applying deep-learning algorithms to remote-sensing image interpretation, the characteristics of targets on remote-sensing images should be considered. However, even though there are some differences between natural-scene images and remote sensing, some deep-learning algorithms still show their potential in remote-sensing image interpretation. The research into deep-learning algorithms for remote-sensing image interpretation is as follows.
Deep-learning algorithms used for remote-sensing images are mainly divided into scene classification, image retrieval, and land-use classification. Scene classification and image retrieval refer to the classification of the entire image as a unit, whereas land use classification refers to the classification of each pixel in the image. Ref. [27] proposed RSNet, which can determine whether the identification task is scene classification or land use classification according to the training samples, and then enter the corresponding network structure for model construction. Ref. [28] summarized the application of deep learning in remote-sensing image classification and summarized resources. Ref. [29] analyzed the achievements and challenges of deep learning in environmental remote sensing. Ref. [30] used a backbone to detect rural dwellings in Indonesia for the ftp-rcnn of ResNet101. Ref. [31] constructed a CNN for detecting royal tombs. The network structure included three convolution layers and two full connection layers, and the results were superior to those of random guessing, SVM with a linear kernel, radial basis function, and SVM with an RBF kernel. A character-based target detection model with YOLOv3, laser and sonar data were used to detect shipwrecks on the seabed [32], achieving an value (explained later in the study) of 0.92 and a precision of 0.90, proving that YOLOv3 is reliable for underwater archaeological exploration. Berganzo-Besga et al. used the supervised classification method of the random forest model to perform binary classification of soil based on Sentinel-2 imagery, combined with the multi-scale relief model (MSRM), detected tumuli over an area of near 30,000 km2 using YOLOv3 deep learning [33]. Ref. [34] used faster R-CNN and laser data to automatically identify charcoal kilns, burial mounds, and traps. Ref. [35] used WorldView-2 and unmanned aerial vehicle (UAV) images and vegetation anomalies to identify historical sites. Ref. [36] proposed the mask region-based convolutional neural network (mask R-CNN) model for canopy detection. Davis et al. detected shell-ring ancient architecture based on lidar-derived DEM, hillshade, and slopes data. The deep-learning model used was mask R-CNN. The training and validation of the model were implemented on the ArcGIS Pro2.6 platform, and used Synthetic aperture radar (SAR), multispectral data, and a random forest probability to refine the detection results, identifying a large number of undocumented shell rings [37]. Ref. [38] conducted change detection in urban areas based on VHR. Kurgans (burial mounds of ancient civilizations) in the Altai region were detected based on the deep convolutional neural network (CNN) technique, and it was demonstrated that CNN-based object detection can largely narrow down the search area for archaeologists in unsurveyed regions; therefore, it is useful for preparing field-survey campaigns and guiding archaeological fieldwork [39]. In summary, deep learning is successfully applied in cultural heritage/archaeology and earth-observation remote-sensing tasks. Public datasets of remote-sensing images are mostly land-use-classification or scene-classification datasets. However, there is no public dataset related to the remote sensing of karez, and there are few relevant studies on the fine distribution of karez in Turpan.
2. Materials and Methods
2.1. Study Area
A karez is an irrigation system with a long history in Turpan, Xinjiang, China. It flows from the foot of the Tianshan Mountains to the basin oasis as an underground river. It is as famous as the Great Wall and the Beijing-Hangzhou Grand Canal and is known as one of the three major projects in Chinese history. A karez provides valuable water for agricultural irrigation, life, and ecology in arid regions. In 1957, the number of karez in Turpan reached a historical maximum of 1237, with a total length of more than 5000 km. In 1966, the annual net flow of karez was 661 million m3, and the irrigable land was 25,100 km2 (321,400 acres), accounting for 67% of the total arable land in the Turpan Basin [40]. The study area was the Turpan Basin, which is surrounded by mountains. The Turpan Basin (42.40°–43.86°N, 86.75°–91.46°E) is a mountain basin within the Xinjiang uyghur Autonomous Region, China. As shown in Figure 2, the location of the study area within the Xinjiang Uyghur Autonomous Region is indicated in Figure 2a. The topographic data used consisted of Shuttle Radar Topography Mission (SRTM) data, which had a resolution of 90 m. The Turpan Basin is located south of the eastern Tian Shan Mountain range. The Bogda Mountain lies to the north of the Turpan Basin and the Queletage Mountains lie to the west. The Turpan Basin has a typical continental arid-desert climate characterized as hot, dry, and windy. Due to the lack of precipitation, high rates of evaporation and high winds, Turpan has the nicknames of “Fire Island” and “Wind Reservoir”. An extremely low temperature of −29.9 °C and an extremely high temperature of 49.6 °C have been recorded. The average annual rainfall is less than 20 mm. In individual years, the amount of precipitation has ranged from 48.4 mm in 1958 to 2.9 mm in the drought year of 1968. The average annual sunshine is more than 190 days. The annual sunshine hours are 3000–3200 h. Winds of force 7 or 8 occur approximately 32 times a year; in Tuyere, this increases to more than 100 times. Lake Aydin is a salt swamp located within the Turpan Basin; it lies close to the second-lowest point on Earth, at an elevation of 154 m below sea level and it is at the lowest altitude in China [4]. From the foothills of Tian Shan to the shores of Lake Edin, the horizontal distance is only 60 km, but the height difference is more than 1400 m. Thus, the Turpan Basin is extremely closed.
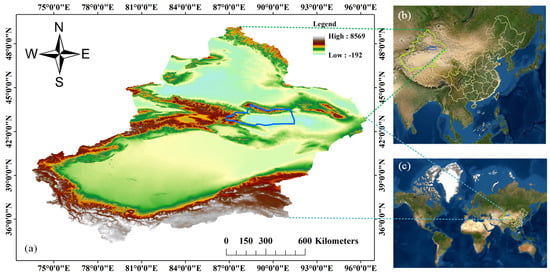
Figure 2.
The blue box indicates the Turpan Basin, which is the study area of this paper. (a) Map showing the geographical location of the study area in the Xinjiang Uyghur Autonomous Region. The background consists of SRTM DEM data with a resolution of 90 m. (b) Xinjiang’s location in China, the base map is World-Imagery in ArcGIS. (c) Xinjiang’s location in the world, the base map is World-Imagery in ArcGIS.
2.2. Google Earth Images
Images were obtained using Google Earth Pro. Google Earth Pro, according to the importance ranking of different regional locations, provides satellite images with different resolutions. Its finest spatial resolution is 0.3 m. For the Turpan Basin, coverage includes color IKONOS/QuickBird/GeoEye/WorldView VHR satellite images from the 2000 s–2010 s, representing different seasons and time periods of imagery. Google Earth Pro has tools to clip these images and save them at a “premium resolution” of 4800 dpi. Google Earth Pro images are only RGB renderings, so we are not looking for true DNs of the original images. The NIR band is also not available, and the original spatial resolution is reduced. In brief, they are not usable for quantitative remote-sensing applications, but are still interesting for archaeological-object recognition and visual applications. Using 15 m panchromatic orthorectified Landsat images as a base, all clips were geo-referenced in ArcGIS10.2.0 with minimal root mean square error (RMSE). Then, images were resampled to a resolution of 0.5 m, the resampling method was the nearest neighbor. Based on the known locations of karez obtained from earlier studies, images containing karez were downloaded based on a standard 1:50,000 map grid. A total of 24 grids were required to cover the potential karez area in the Turpan Basin, and the volume of data corresponding to each grid was approximately 4 GB. Images were based on the D_WGS_1984 coordinate system. In 1:50,000 scale tiles, karez were located in 24 tiles, including K45E007018, K45E008018, K45E007019, K45E008019, K45E007020, K45E008020, K45E006021, K45E007021, K45E008021, K45E006022, K45E007022, K45E008022, K45E006023, K45E007023, K454E008023, K454E009023, K45E007024, K45E008024, K45E009024, K46E007001, K46E006002, K46E007002, K46E006003, K46E007003. The height and width of 1:50,000 tiles were 15’ in longitude direction and 10’ in latitude direction, respectively. Figure 3 shows an overlay of the map tile with that of the Turpan Basin.
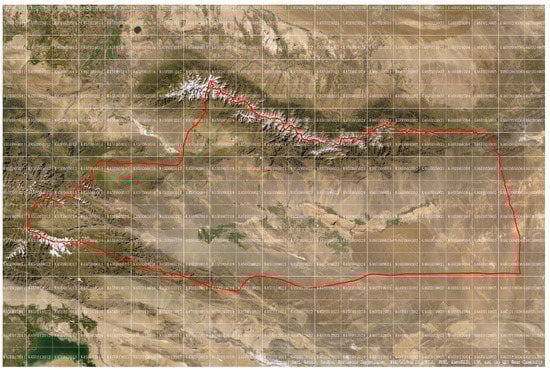
Figure 3.
1:50,000 tile range of Turpan Basin; base map is Esri base map.
Through the prediction of karez vertical shafts in 24 maps of Google Earth images, a fine map of karez in the entire Turpan Basin was obtained. It is impossible to have a different karez within 500 m because of the limitations of underground water [41].
2.3. Technical Framework
Depending on whether there was a prior bounding box, object-detection algorithms were divided into two categories: anchor-based and anchor-free algorithms. The object-detection algorithm of the anchor base was divided into two categories: one-stage and two-stage algorithms. The first-stage algorithm simultaneously predicted the object category and position of the rectangular bounding box. Category prediction belonged to the classification task, whereas the position of the rectangular bounding box belonged to the regression task. One-stage object detection algorithms included the YOLO series (YOLOv1, YOLOv2, YOLOv3 [42], YOLOV4 [43], YOLOv5 [44]), SSD [45] and EfficientDet [46]. YOLOv4 uses CSPDarknet53 (Cross Stage Partial Dartnet53) [42,47] as the backbone and PANet to enhance the feature extraction. EfficientDet uses EfficientNet as the backbone. The original image was downsampled seven times, the BiFPN network was used to enhance feature extraction, the attention mechanism was introduced, and the object category and rectangular box position were predicted using full connection. In the two-stage algorithm, the rough suggestion bounding box was first generated according to the prior frame, and then the feature graph in the suggestion frame was converted into a fixed size using a region of interest (ROI). That is, the function of ROI Pooling is to normalize candidate recognition regions with different sizes and shapes into target recognition regions of a fixed size. This increases the processing speed of the data. Then, the categories of objects in the suggestion bounding box were determined and adjusted to obtain an accurate prediction box. Typical two-stage object-detection algorithms included R-CNN [48], Fast R-CNN [49], and Faster-RCNN [50]. Faster-RCNN used ResNet50 or ResNet101 as the backbone and performs ROI pooling on feature maps based on the position of the suggestion boxes. The anchor-free object-detection algorithms included CornerNet [51] and CenterNet [52], which identified key points of objects in the form of bottom-up or up-down, and then found the upper left corner and lower right corner of objects to form a rectangular bounding box. CornerNet used CornerPooling in four directions.
This study uses YOLOv5 as a deep-learning model for object detection. YOLOv5 has 4 versions, namely, YOLOv5s, YOLOv5m, YOLOv5l, YOLOv5x, and YOLOv5’s backbone network is CSPDartnet53 (Cross Stage Partial Dartnet53) [42,47] with one SPP (spatial pyramid pooling) layer. The neck module is PANet (Path Aggregation Network) [53], and the head module is YOLO detection head [54]. An object-detection algorithm must classify and locate objects in an image. Convolution is an important operator for extracting information from an image. Feature maps of different depths contain features of different scales of the target, shallow feature maps of the network extract the target boundary information, and deep feature maps extract high-level semantic information of the target. The backbone network of YOLOv5 includes grouping convolution, SiLU (Sigmoid-Weighted Linear Units) activation function [55], and spatial pyramid pooling structure, and the prediction box position and the category of the object were calculated using the regression method. The role of the SiLU activation function was to add a nonlinear relationship to the deep-learning model. The calculation of SiLU was obtained by multiplying the sigmoid function and its input. CIOU [56] was used in YOLOv5 to calculate the loss function rather than the ordinary IOU. The advantage of CIOU is that it integrates the proportion of overlapping area of IOU, the loss of the center point offset of DIOU [56], and the loss of its own aspect ratio. YOLOv5 downsamples the original image four times to extract semantic information from deep feature layers. Figure 4 shows the technical route of automatic extraction of the karez shaft based on YOLOv5, which is an end-to-end target-detection algorithm. As the boundaries of adjacent vertical shafts may overlap, to ensure that the detected vertical shafts did not overlap and separate different vertical shafts, the relevant codes of the prediction box of the original YOLOv5 model were modified, and the shape of the prediction box was modified to include the central pixel of the vertical shaft and the polygon box of the upper, lower, and left pixels.
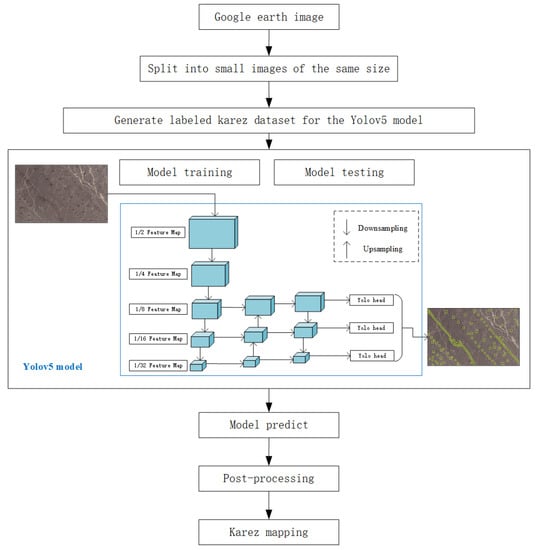
Figure 4.
Automatic extraction roadmap for karez shaft based on Google and YOLOv5.
The learning rate model of YOLOv5 is cosine annealing; the formula for calculating the learning rate is shown in Equation (1).
represents the newly obtained learning rate, represents the initial learning rate, represents the minimum learning rate, represents the current training epoch, and represents the the total number of epochs for training.
The loss function includes three parts: classification loss, rectangular box coordinate regression loss and confidence loss, where the rectangular box coordinate regression loss is shown in Equation (2),
where b and are the prediction boundingbox and the label boundingbox, respectively; , , w, h are the width and height of the label boundingbox and the width and height of the prediction boundingbox, respectively; c represents the length of the diagonal of the smallest bounding box of the predicted box and the ground-truth box. In addition, represents the distance between the center points of the two bounding boxes. The calculation of v in Equation (2) is shown in Equation (3).
The calculation formula of in Equation (2) is shown in Equation (4).
where v is used to measure the similarity of the ratio between the width and height of the predicted box and the ground-truth box. is the weight value, which measures the weight of the third and fourth terms in Equation (2). The larger the , the larger the . If the is large, v will be prioritized; the smaller the , the smaller the , and the third item, the distance ratio, will be prioritized when is small.
refers to intersection over union, the larger the value of , the more accurate the prediction bounding box. The calculation formula is shown in Equation (5).
The calculation formulas of classification loss and confidence loss are as Equation (6).
where represents classification loss, and represents confidence loss. n represents the number of objects in each frame.
The formula for calculating the total loss function of YOLOv5 is Equation (7).
where represents the total loss; , , and are the weights of the rectangular box coordinate regression loss, the confidence loss and the classification loss, which are hyperparameters and can be configured inside the model. N is the number of detection layers. B is the number of targets whose labels are assigned to a priori boxes, and is the number of grids at this scale.
The Google image was split into tiles of size [1206, 755], each tile was treated as a frame of image, A 1:50,000 google image can be cropped to 1638 titles. The splitting was conducted by the “SplitRaster_management” function of the ArcMap toolbox, and the sample set trained by YOLOv5 and the tiles predicted by the model were both [1206, 755], the following processing steps were performed on the prediction results of YOLOv5; image splitting and the following processing steps were all processed in batches using Python programs to reduce the workload involved in manual operations and improve processing efficiency. Batch processing of multiple images was performed using the “for” loop structure in the program code using ArcPy package in Python.
- The segmentation results were then converted from raster format to vector polygon format using the raster-to-polygon function in ArcToolbox in ArcGIS.
- The merge function in ArcToolbox was then used to merge multiple shapefiles into a single file.
- A feature-to-point tool was used to convert polygon features to point features, with each point representing a shaft.
After the point layer of karez vertical shaft was automatically extracted by YOLOv5, the false predicted karez shaft was removed by post-processing, and then the spatial database of point karez was constructed. In the karez point layer, each point represents a shaft; the shaft points are clustered by QGIS’s DBSCAN to generate linear karez. In the karez line layer, each line represents a karez. The main purpose of karez is to irrigate cultivated land, so karez and cultivated land are overlaid to analyze their spatial relationship. All GIS spatial-analysis and mapping operations in this study were performed in ArcMap of ArcGIS 10.2.0 version [57]. The QGIS version used in this study is 3.22.4 [58].
2.3.1. Dataset
Deep learning requires the use of sample datasets. In this study, the karez sample dataset was created. To improve the efficiency of sample annotation and model training, we clipped the input data to 1206 × 755 pixels, as this shape can be wholly visualized on most laptop computer screens. In addition, the open-source Python package Labelme was used to prepare the training samples.
The training samples were not subjected to any data augmentation before the deep-learning model was implemented, as the YOLOv5 model itself includes a lot of data-augmentation methods, the data-enhancement methods of YOLOv5 include Mosaic, Cutout, image perturbation, changing brightness, contrast, saturation, hue, adding noise, random scaling, random crop, flipping, rotating, random erasing, etc. In this study, the dataset was composed of a total of 639 images, of which 90% were used for training the model, and 10% were used for validating the model. That is, 575 frames were used for training, and 64 frames were used for verification. The labeled sample is shown in Figure 5. YOLOv5 was used to train and test karez because YOLOv5 downsamples the original image four times during feature extraction. After each downsampling, the feature image was reduced to half the size of the previous image. Therefore, when making the karez sample dataset, the width and height of the rectangular box could not be less than 16 pixels; otherwise, the target would be lost during the feature extraction of the model.
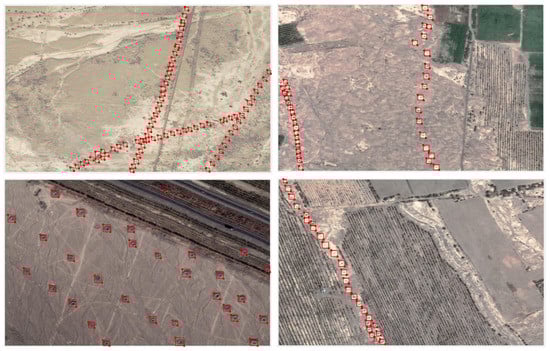
Figure 5.
Sample dataset of karez. The red rectangular box is the labeled box of the karez shaft.
2.3.2. Training Parameter Setting
If the default parameters of the training program are used during model training, there is no need to specify them when the Python program is started. If it is inconsistent with the default parameters, the values of specific parameters must be specified when starting the Python program. When running the training script in this study, the training commands were as follows: python train.py --img-size 1280 --batch-size 16 --epoch 300 --data data/karez1calss.yaml --cfg models/yolov5s.yaml --weights weights/yolov5s.pt. The default values and functions of each parameter were as follows:
(‘--weights’, type = str, default = ‘yolov5s.pt’, help = ‘initial weights path’)
(‘--cfg’, type = str, default = ”, help = ‘model.yaml path’)
(‘--data’, type = str, default = ‘data/coco128.yaml’, help = ‘data.yaml path’)
(‘--epochs’, type = int, default = 300)
(‘--batch-size’, type = int, default = 16, help = ‘total batch size for all GPUs’)
(‘--img-size’, nargs = ‘+’, type = int, default = [640, 640], help = ‘[train, test] image sizes’)
--cfg refers to the model configuration file, network structure. --img-size refers to the size of the input image. --epochs refers to the total number of epochs for training. --weights refers to the initial weights file. --data refers to the dataset configuration file, which specifies the path to the dataset and the name of the target category. --batch-size refers to the number of images per batch. In this study, a karez1calss.yaml file was created in the data folder to specify the path of the training and validation sample datasets, and the number and names of categories. The pre-training model YOLOv5s was used to start training the model. Parameters that are not specified use the default parameter values of the YOLOv5 model.
2.3.3. Evaluation Metrics
The identification of karez in this paper belongs to the binary classification task of image classification, in which karez is the positive class and the background is the negative class. This study uses , and to evaluate the training model of YOLOv5. The score considers both precision and recall. The higher the , , and , the higher the accuracy of the model. : the proportion of the number of objects that are correctly predicted to be positive classes to the total number of objects that are predicted to be positive classes. : the ratio of the number of correctly predicted positive objects to the total number of positive objects. , in Equations (8) and (9), refers to true positive, which refers to the number of pixels that are judged to be positive, and the ground-truth value is also positive. refers to false positive, which refers to the number of pixels that are judged to be positive, but the ground-truth value is negative. stands for false negative, which refers to the number of pixels that are judged to be negative, but the ground-truth value is positive. The calculation formula of precision is shown in Equation (8).
The calculation formula of recall rate is shown in Equation (9).
Formula of is shown in Equation (10).
2.3.4. Post-Processing
The post-processing was as follows: based on the point shaft data, the buffer was generated with the average distance between the shafts. If the distance between the shafts was less than the average distance, multiple shafts were fused into a large polygon, while there were no isolated shafts within the average distance range and the shape of the buffer generated at the average distance was maintained. As the buffer area was fixed, isolated points could be filtered according to the fixed area, which may be noise points, saving these noise points as a layer. ArcMap toolbox in ArcGIS 10.2.0 software was used for data post-processing, and the post-processing steps included the following:
- ArcGIS tool used: Spatial Statistics Tools\Analyzing Patterns\Average Nearest Neighbor to calculate the average distance observed between vertical wells.
- ArcGIS tool used: Analysis Tools\Proximity\Buffer to make buffer for shaft point based on average distance, and Dissolve Type was NONE.
- ArcGIS Data Management Tools\Generalization\Dissolve was used to fuse the buffer image obtained in the previous step, and the overlapping shafts in the buffer region were fused into a polygon. The image of the buffer without overlapping shafts in the buffer region did not change, and the area was fixed. The “area” field was added to the layer and Calculate Geometry of the fields was used to calculate the area of each object. The buffer area of the outliers was 4421.06 square meters. The outliers were saved in a separate layer based on this area.
- Using the Analysis Tools\Overlay\Erase tool, the outliers were erased on the karez layers predicted by YOLOv5 to obtain a more accurate vertical shaft database.
2.3.5. Karez Line Generation
The DBSCAN (Density-Based Spatial Clustering of Applications with Noise) clustering function in the open-source geographic information software Quantum GIS (QGIS) was used to cluster shafts belonging to different karez and obtain the cluster number ‘CLUSTER_ID’ for each shaft. If the clustering result was incorrect, it was corrected using human visual interpretation. The Convert points to line(s) tool in QGIS was used to generate karez line data from the shaft point data with different category numbers, with the CLUSTER_ID field used to distinguish between different karez. As all the karez were oriented roughly east—west or north—south, the x coordinates were used to order and connect the shafts into lines for the east—west karez, and the y-coordinates were used to do the same for the north—south karez. Thus, the shaft point data were converted to the karez line data.
2.3.6. Overlay of Karez Line and Crop
The dataset used for LUCC in this study was GlobeLand30 (http://www.globallandcover.com/, accessed on 26 November 2020). We converted the raster format LUCC into a vector format and extracted the crop-land vector according to the category code of the crop. Then, the karez line and crop-vector map were overlaid.
3. Experiments and Results
3.1. Quantitative Assessment of YOLOv5 Model
The YOLOv5 model was trained for 300 epochs, with a precision of 0.86 and recall of 0.83 reached, and this highest precision value occurred in the 201st epoch of the total 300 epochs. The training process for 300 epochs is shown in Figure 6. As shown in Figure 6, when the training reached approximately 50 epochs, the accuracy increased rapidly, and when the training reached approximately 200 epochs, the accuracy tended to stabilize. The change curves of precision, recall, precision-recall, and during the training process are shown in Figure 7.
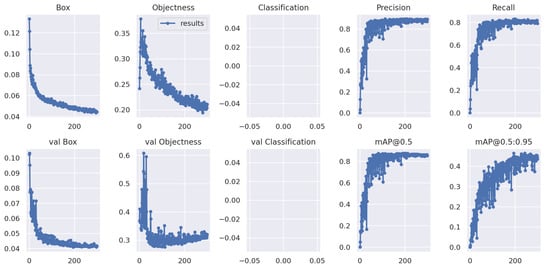
Figure 6.
Training process diagram of self-made karez dataset based on YOLOv5, EPOCHS = 300.
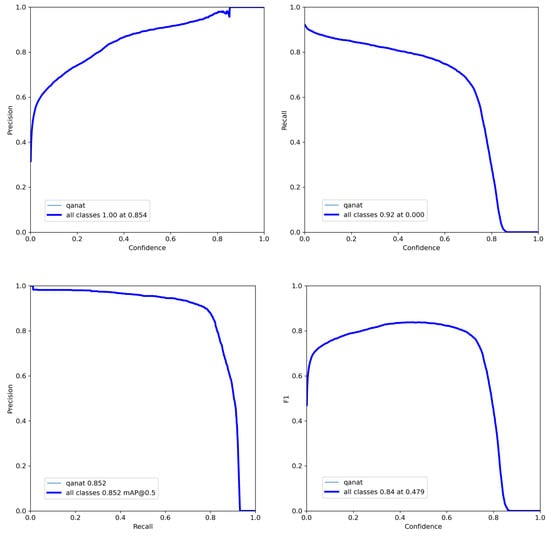
Figure 7.
Accuracy index diagram of YOLOv5 model.
3.2. YOLOv5 Shaft Detection
Karez shafts were predicted based on the trained YOLOv5 model. As shown in Figure 8, the predicted output result was the binary mask image, which was transformed from raster to polygon vector and then to point elements, and the point spatial distribution thematic map of the karez shaft was obtained.
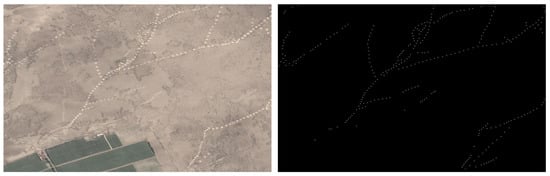
Figure 8.
Original image is shown on the left, and the karez map predicted by YOLOv5 on the right is a binary mask map.
3.3. Effect of Post-Processing
Some of the karez predicted by YOLOv5 were misidentified and had to be removed according to the post-processing steps. The processing steps were as follows: the mask image predicted by YOLOv5 was converted into a vector format in which each vertical shaft was represented as a polygon, and then the vertical shaft polygon was converted into a point-like vertical shaft from feature to point. According to the statistics of the average nearest neighbor, the average distance between adjacent vertical shafts is 37.58 m and a buffer map was generated according to this distance, as shown in Figure 9. A dissolution operation was carried out based on the buffer map. In the obtained dissolved map, the vertical shafts with adjacent vertical shafts within the average distance range were merged into a larger polygon, whereas the vertical shafts without adjacent vertical shafts within the average distance range remained in the original buffer, with a fixed area of 4421.06 square meters, as shown in Figure 10. Based on this feature, the false karez predicted by YOLOv5 was extracted.
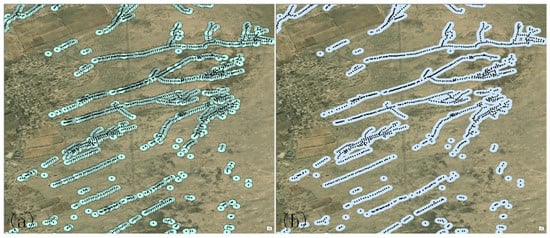
Figure 9.
(a): Buffer diagram generated based on the average distance between karez shafts predicted by YOLOv5. The point is the shaft predicted by YOLOv5, and the circle represents the buffer range of each shaft. (b): The result of buffer map of shaft after dissolve operation.
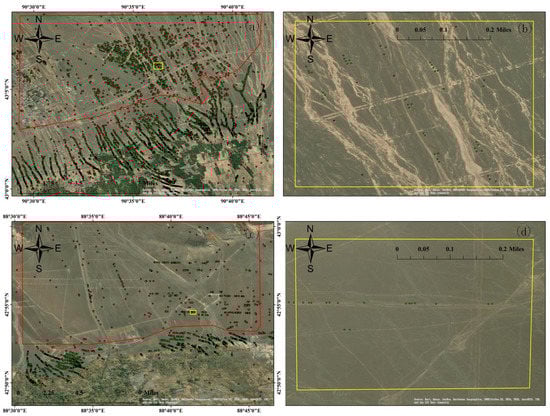
Figure 10.
Some karez in Shanshan and Toksun County, Turpan, the base map is World_Imagery in ArcGIS. The red points are the negative karez points identified in the post-processing step, and the green points are the karez shafts retained after the post-processing step. (b) is an enlarged view of the yellow box range in (a). (d) is an enlarged view of the yellow box range in (c).
After the post-processing steps, the karez database with the FP removed was obtained, the red points in the Figure 10 were removed during post-processing, and the green points were reserved karez points. As shown in Figure 10. However, after post-processing, there were still some false karez. Figure 10a,b shows the area of Shanshan County. The karez identified by YOLOv5 is shown in the red box. Figure 10b shows a magnified view of the yellow box in Figure 10a. It can be seen from Figure 10 that the features of the objects here were remarkably similar to those of karez; thus, they were identified as karez. Moreover, the adjacent distance between these features was smaller than the adjacent distance between karez predicted by YOLOv5; therefore, the post-processing operation still failed to remove them.
Figure 10c,d shows karez in Toksun County, Turpan. The false karez identified by YOLOv5 is shown in the red box. Figure 10d shows a magnified view of the yellow box in Figure 10c. It can be seen from Figure 10d that the features of the objects here were remarkably similar to those of karez; thus, they were misidentified as karez. That is, if the shape, texture and color of the karez shaft and the noise point are very similar, then the noise is misidentified as a karez shaft.
3.4. Karez Shaft Mapping of Turpan
Twenty-four maps with karez in Turpan were split and predicted. An image of the same size as the training sample was split to a size of 1205 × 755. The weights file was run to select the weights file best.pt for the best effect generated by training. Each 1:50,000 image was cropped into 1638 smaller images. The segmentation results were then converted from raster format to vector polygon format using the Raster to Polygon function in ArcToolbox in ArcGIS; the Merge function in ArcToolbox was then used to merge multiple shapefiles into a single file. A feature-to-point tool was used to convert polygon features to point features, with each point representing a shaft.
Mapping karez across the Turpan Basin, YOLOv5 predicted 93,584 shafts, as shown in Figure 11. A total of 4185 noise points were identified during the post-processing step. After the post-processing step, the number of karez shafts was 89,396. A map of karez over the entire Turpan is shown in Figure 12. However, there are still some deviation in this result. According to the third national survey of cultural relics, the total number of shafts in Turpan is approximately 100,000 [59]. However, the establishment of a detailed database of karez is important for the management and protection of karez cultural heritage, and it is suggested to establish a detailed database of karez.
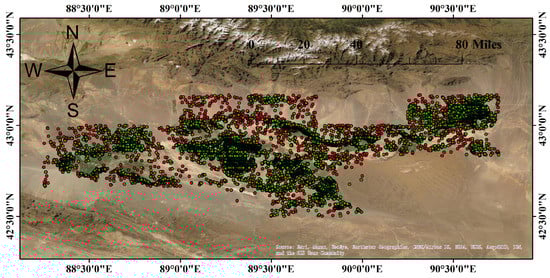
Figure 11.
Karez shaft of the whole Turpan Basin predicted by YOLOv5 (including solid red and green points with black boundaries, red points represent the false karez extracted by post-preprocessing operation, and the green points are the karez shafts retained after the post-processing step), and the base map is World-Imagery in ArcGIS.
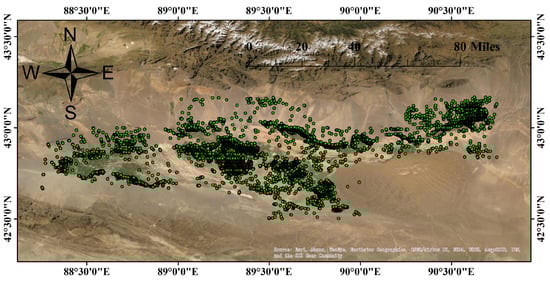
Figure 12.
Karez shaft of Turpan Basin obtained by YOLOv5 and post-processing, the solid green points with black boundaries are the karez shafts retained after the post-processing step; the base map is World-Imagery in ArcGIS.
According to experience, we can draw the range line of the area where the karez wells are located, and remove the misidentified karez wells outside the range line through the range line, and the number of karez wells is 82,493, as shown in Figure 13.
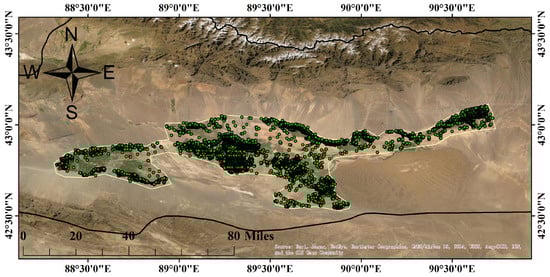
Figure 13.
Distribution map of shafts after removing the misidentified karez according to the boundary line of the karez. The solid green points represent the shafts within the range line of the Karez in Turpan, and are the final result of the shafts in this paper. Each shaft are represented by solid green points with black boundaries. After the dense green points overlap, the color may appear black. The base map is World-Imagery in ArcGIS.
3.5. Karez Line and Crop
If the distance between adjacent karez lines was smaller than the distance between vertical wells, the clustering results of different karez wells could be incorrect. In this case, the DBSCAN clustering results of the karez wells were manually corrected. Figure 14 shows a superimposed map of the karez line and crop map. Due to the expansion of arable land or urbanization, the historical karez were cut off. It is possible that multiple sections are the same karez, the number of sections of karez that was used is 5057, which has a total length of 2387.2 km. Pointing to the same piece of arable land, the karez in multiple segments should be the same karez. If there are multiple karez lines in the same direction, the end point where there is no cultivated land is the truncated position. It can be seen from the figure that karez wells are densely distributed in the periphery of the Turpan cultivated land. Figure 15 show enlarged views of the four rectangular boxes in Figure 14.
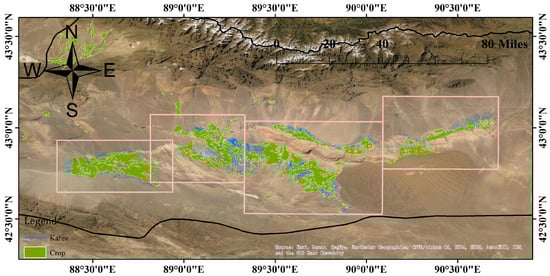
Figure 14.
Overlay of the karez line and crop map in the Turpan Basin.
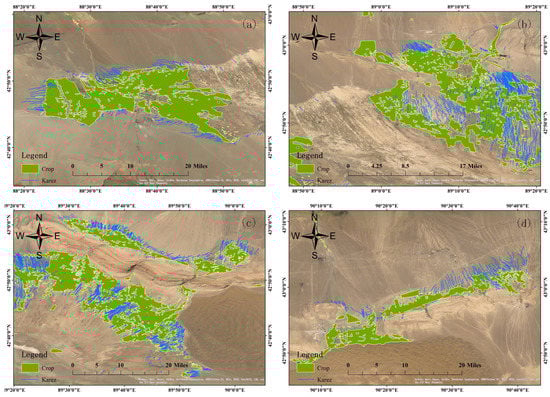
Figure 15.
(a–d) are enlarged views of the four rectangular boxes from the left in Figure 14, respectively.
4. Conclusions
Karez are an important irrigation system in arid and semi-arid areas, which are widely distributed throughout the world. Satellite remote sensing has the advantages of a large monitoring range, rapid information acquisition, and dynamic monitoring. Combined with neural network algorithms, intelligent interpretation of remote sensing can improve the automation degree of karez identification and provide a technical scheme for fine karez mapping. The shaft is an important part of karez, and is closely related to the engineering quantity of karez. Developing a fine karez map of the shaft can not only accurately elucidate the distribution and direction of the karez, but also be used for the maintenance, management, and protection of the karez. In recent years, there have been few studies on karez recognition using deep-learning algorithms in large areas. In this study, a karez-shaft recognition method based on YOLOv5 and post-processing was constructed to automatically identify the Karez shaft in the entire Turpan Basin. This demonstrates the feasibility of this scheme in identifying karez. The prediction results showed that the number of vertical shafts in the karez in Turpan was 82,493. For such a large number, if there is no intelligent algorithm or remote-sensing technology, the traditional surveying and mapping or remote-sensing visual interpretation will be time-consuming and laborious. The average distance of the karez shaft observed after post-processing was 21.55 m. According to this value, the total length of the karez in Turpan was 82,493 × 21.55 = 1777.72 km. After a certain karez has dried up, it may be abandoned, and other karez lines will be built next to it. By extracting the ground shafts, the total section number of karez lines excavated in Turpan was 5057, which has a total length of 2387.2 km. This length also shows the importance of karez in Turpan. The number of karez is more than the highest value of 1237 in the literature, because the same karez is truncated into multiple segments due to changes in land use.
Under the background of global climate change, with the expansion of modern agriculture and cities, the sustainable development of water resources is an important foundation of social sustainable development. Karez provide water for the survival of oases in arid areas and facilitate the sustainable development of water-resource utilization. This study on the karez development process is bound to provide better understanding regarding land-use and water-resource management. In the 1950s–mid-1970s, the number of karez stabilized between 1000–1237, and at the end of the 1970s, the number of karez declined rapidly, the type of land use changed, and many karez were partially cut off, so historical images can be used to reconstruct karez from 1960–1970s, which can restore the original form of the karez. The next research direction is to extract karez and cultivated land in the 1960s–1970s using CORONA images. Then, we can analyze the spatiotemporal variation characteristics of karez and Turpan oases. As a method for reference, our proposed method can be further extended to investigate the spatial distribution of karez cultural heritage on our planet (in China, Iran, Middle East, North Africa, Afghanistan, Pakistan, Spain, Italy, Greece, Peru, etc.), and was even able to generate the global karez inventory for the very first time.
Supplementary Materials
The following supporting information can be downloaded at: https://www.mdpi.com/article/10.3390/rs14143318/s1, the training sample of the Karez shaft.
Author Contributions
Conceptualization, L.L. and X.W.; Funding acquisition, H.G.; Investigation, L.L., X.W. and Q.L.; Methodology, L.L., X.W. and Q.L.; Project administration, H.G.; Resources, L.L.; Writing—original draft preparation, Q.L.; Writing—review & editing, X.W. and L.L. All authors have read and agreed to the published version of the manuscript.
Funding
This work was funded by the Strategic Priority Research Program of the Chinese Academy of Sciences (XDA19030502) and the National Natural Science Foundation of China (41801345).
Data Availability Statement
The YOLOv5 model used in this paper, the training sample of the Karez shaft, and the trained YOLOv5 model file has been made available as Supplementary Materials.
Acknowledgments
The authors would like to thank Jianli Ding and Hongwei Wang from Xinjiang University for providing karez information. The authors would like to express gratitude for the help and encouragement of teammates, including Shu Yang, Wu Lin and Yiyang Chen.
Conflicts of Interest
The authors declare no conflict of interest.
References
- Yujian, W.; Siming, W. Comparative Study on Qanat in Kazan of Iran and Turpan of Xinjiang. Agric. Archaeol. 2021, 1, 134–140. [Google Scholar]
- Hu, W.; Zhang, J.; Liu, Y. The qanats of Xinjiang: Historical development, characteristics and modern implications for envi-ronmental protection. J. Arid Land 2012, 4, 211–220. [Google Scholar] [CrossRef][Green Version]
- Ablimiti, N. Study on the Karez System and Its Influence on Ecological Environment in Turpan Area as an Example. Master’s Thesis, Xinjiang University, Urumqi, China, 2015. [Google Scholar]
- Yajun, W.; Sufen, W. Environment Change over the Aydingkol Lake Region in Turpan Basin, Xinjiang. J. Glaciol. Cryopedol. 2003, 25, 229–231. [Google Scholar]
- Yinglian, L. The Integrated Governance Research of Groundwater Over-Expolitation Region in Turpan Basin. Master’s Thesis, Xinjiang Agricultural University, Urumqi, China, 2017. [Google Scholar]
- Barbaix, S.; Kurban, A.; De Maeyer, P.; Chen, X.; Bourgeois, J. The use of historical sources in a multi-layered methodology for karez research in Turpan, China. Water Hist 2020, 12, 281–297. [Google Scholar] [CrossRef]
- Bertrand, A. The Hydraulic Systems in Turfan. Silk Road 2010, 8, 27–41. [Google Scholar]
- Deng, M.J. Kariz wells in arid land and mountain-front depressed ground reservoir. Shuikexue Jinzhan/Adv. Water Sci. 2010, 21, 748–756. [Google Scholar]
- Fu, R.; Shadeer, M.; Tiyipujiang, R. Study Breaking Mechanism of Karez Systems in Turpan Basin. Procedia Mater. Sci. 2014, 3, 1786–1791. [Google Scholar] [CrossRef]
- Luo, L.; Wang, X.; Guo, H.; Lasaponara, R.; Zong, X.; Masini, N.; Wang, G.; Shi, P.; Khatteli, H.; Chen, F.; et al. Airborne and spaceborne remote sensing for archaeological and cultural heritage applications: A review of the century (1907–2017). Remote Sens. Environ. 2019, 232, 111280. [Google Scholar] [CrossRef]
- Luo, L.; Wang, X.; Guo, H.; Liu, C.; Liu, J.; Li, L.; Du, X.; Qian, G. Automated Extraction of the Archaeological Tops of Qanat Shafts from VHR Imagery in Google Earth. Remote Sens. 2014, 6, 11956–11976. [Google Scholar] [CrossRef]
- Soroush, M.; Mehrtash, A.; Khazraee, E.; Ur, J.A. Deep Learning in Archaeological Remote Sensing: Automated Qanat Detection in the Kurdistan Region of Iraq. Remote Sens. 2020, 12, 500. [Google Scholar] [CrossRef]
- Stinson, P.T.; Naglak, M.C.; Mandel, R.D.; Hoopes, J.W. The remote-sensing assessment of a threatened ancient water technology in Afghanistan. J. Archaeol. Sci. Rep. 2016, 10, 441–453. [Google Scholar] [CrossRef]
- Stein, A. Note on a Map of the Turfan Basin. Geogr. J. 1993, 82, 236–246. [Google Scholar] [CrossRef]
- Mächtle, B.; Hecht, S.; Manke, N.; Kromer, B.; Lindauer, S.; Li, C.S.; Li, Y.; Wang, X.; Bubenzer, O. The age and origin of Karez systems of silk road oases around Turpan, Xinjiang, P.R. of China. In Socio-Environmental Dynamics along the Historical Silk Road; Springer: Berlin/Heidelberg, Germany, 2019; Chapter 17; pp. 359–378. [Google Scholar] [CrossRef]
- Harlick, G. The Influence of Land Use Changes in Time and Space in Turpan Basin on Karez. Master’s Thesis, Xinjiang Normal University, Urumqi, China, 2017. [Google Scholar]
- Beibei, Y.; Gui, M.; Yongcai, S.; Dina, M. An Analysis of the Influencing Factors of Spatial Distribution Pattern of Karez in Turpan City. China Rural. Water Hydropower 2017, 12, 198–203+208. [Google Scholar]
- Zhijia, L. Circumglobal Distribution of Groundwater Irrigation Systems: Origin and Diffusion of Qanat Technology. Agric. Archaeol. 2018, 1, 205–214. [Google Scholar]
- Adley, A. Study on Karez in Turpan Based on the Viewpoint of Ecological Anthology. J. Orig. Ecol. Natl. Cult. 2016, 8, 8–15. [Google Scholar]
- Azari Rad, M.; Ziaei, A.N.; Naghedifar, M.R. Three-Dimensional Numerical Modeling of Submerged Zone of Qanat Hydraulics in Unsteady Conditions. J. Hydrol. Eng. 2018, 23, 04017063. [Google Scholar] [CrossRef]
- Daanish Mustafa, M.U.Q. Transition from Karez to Tubewell Irrigation: Development, Modernization, and Social Capital in Balochistan, Pakistan. World Dev. 2007, 35, 1796–1813. [Google Scholar] [CrossRef]
- Bachagha, N.; Wang, X.; Luo, L.; Li, L.; Khatteli, H.; Lasaponara, R. Remote sensing and GIS techniques for reconstructing the military fort system on the Roman boundary (Tunisian section) and identifying archaeological sites. Remote Sens. Environ. 2020, 236, 111418. [Google Scholar] [CrossRef]
- Breeze, P.S.; Drake, N.A.; Groucutt, H.S.; Parton, A.; Jennings, R.P.; White, T.S.; Clark-Balzan, L.; Shipton, C.; Scerri, E.M.L.; Stimpson, C.M.; et al. Remote sensing and GIS techniques for reconstructing Arabian palaeohydrology and identifying archaeological sites. Quat. Int. 2015, 382, 98–119. [Google Scholar] [CrossRef]
- Lin, T.Y.; Maire, M.; Belongie, S.; Hays, J.; Perona, P.; Ramanan, D.; Dollár, P.; Zitnick, C.L. Microsoft COCO: Common Objects in Context. In Computer Vision—ECCV 2014, Proceedings of the 13th European Conference, Zurich, Switzerland, 6–12 September 2014; Fleet, D., Pajdla, T., Schiele, B., Tuytelaars, T., Eds.; Springer International Publishing: Cham, Switzerland, 2014; pp. 740–755. [Google Scholar]
- Cordts, M.; Omran, M.; Ramos, S.; Rehfeld, T.; Enzweiler, M.; Benenson, R.; Franke, U.; Roth, S.; Schiele, B. The Cityscapes Dataset for Semantic Urban Scene Understanding. In Proceedings of the IEEE Conference on Computer Vision and Pattern Recognition (CVPR), Las Vegas, NV, USA, 27–30 June 2016. [Google Scholar]
- Everingham, M.; Gool, L.V.; Williams, C.K.I.; Winn, J.M.; Zisserman, A. The Pascal Visual Object Classes (VOC) Challenge. Int. J. Comput. Vis. 2009, 88, 303–338. [Google Scholar] [CrossRef]
- Wang, J.; Zhong, Y.; Zheng, Z.; Ma, A.; Zhang, L. RSNet: The Search for Remote Sensing Deep Neural Networks in Recognition Tasks. IEEE Trans. Geosci. Remote Sens. 2021, 59, 2520–2534. [Google Scholar] [CrossRef]
- Zhu, X.X.; Tuia, D.; Mou, L.; Xia, G.S.; Zhang, L.; Xu, F.; Fraundorfer, F. Deep Learning in Remote Sensing: A Comprehensive Review and List of Resources. IEEE Geosci. Remote Sens. Mag. 2017, 5, 8–36. [Google Scholar] [CrossRef]
- Yuan, Q.; Shen, H.; Li, T.; Li, Z.; Li, S.; Jiang, Y.; Xu, H.; Tan, W.; Yang, Q.; Wang, J.; et al. Deep learning in environmental remote sensing: Achievements and challenges. Remote Sens. Environ. 2020, 241, 111716. [Google Scholar] [CrossRef]
- Monna, F.; Rolland, T.; Denaire, A.; Navarro, N.; Granjon, L.; Barbé, R.; Chateau-Smith, C. Deep learning to detect built cultural heritage from satellite imagery.—Spatial distribution and size of vernacular houses in Sumba, Indonesia. J. Cult. Herit. 2021, 52, 171–183. [Google Scholar] [CrossRef]
- Gino Caspari, P.C. Convolutional neural networks for archaeological site detection—Finding “princely” tombs. J. Archaeol. Sci. 2019, 110, 104998. [Google Scholar] [CrossRef]
- Leila Character, A.O.J.; Tim Beach, S.L.B. Archaeologic Machine Learning for Shipwreck Detection Using Lidar and Sonar. Remote Sens. 2021, 13, 1759. [Google Scholar] [CrossRef]
- Berganzo-Besga, I.; Orengo, H.A.; Lumbreras, F.; Carrero-Pazos, M.; Fonte, J.; Vilas-Estévez, B. Hybrid MSRM-Based Deep Learning and Multitemporal Sentinel 2-Based Machine Learning Algorithm Detects Near 10k Archaeological Tumuli in North-Western Iberia. Remote Sens. 2021, 13, 4181. [Google Scholar] [CrossRef]
- Trier, D.; Reksten, J.H.; Løseth, K. Automated mapping of cultural heritage in Norway from airborne lidar data using faster R-CNN. Int. J. Appl. Earth Obs. Geoinf. 2021, 95. [Google Scholar] [CrossRef]
- Calleja, J.F.; Requejo Pagés, O.; Díaz-Álvarez, N.; Peón, J.; Gutiérrez, N.; Martín-Hernández, E.; Cebada Relea, A.; Rubio Melendi, D.; Fernández Álvarez, P. Detection of buried archaeological remains with the combined use of satellite multispectral data and UAV data. Int. J. Appl. Earth Obs. Geoinf. 2018, 73, 555–573. [Google Scholar] [CrossRef]
- Yang, M.; Mou, Y.; Liu, S.; Meng, Y.; Liu, Z.; Li, P.; Xiang, W.; Zhou, X.; Peng, C. Detecting and mapping tree crowns based on convolutional neural network and Google Earth images. Int. J. Appl. Earth Obs. Geoinf. 2022, 108, 102764. [Google Scholar] [CrossRef]
- Davis, D.S.; Caspari, G.; Lipo, C.P.; Sanger, M.C. Deep learning reveals extent of Archaic Native American shell-ring building practices. J. Archaeol. Sci. 2021, 132, 105433. [Google Scholar] [CrossRef]
- Fang, H.; Du, P.; Wang, X. A novel unsupervised binary change detection method for VHR optical remote sensing imagery over urban areas. Int. J. Appl. Earth Obs. Geoinf. 2022, 108, 102749. [Google Scholar] [CrossRef]
- Chen, F.; Zhou, R.; Van de Voorde, T.; Chen, X.; Bourgeois, J.; Gheyle, W.; Goossens, R.; Yang, J.; Xu, W. Automatic detection of burial mounds (kurgans) in the Altai Mountains. ISPRS J. Photogramm. Remote Sens. 2021, 177, 217–237. [Google Scholar] [CrossRef]
- Maimaiti, R. Study on The Relationship Between the Karez and Turpan Oasis Ecological Environment. Master’s Thesis, Xinjiang University, Urumqi, China, 2014. [Google Scholar]
- Banks, D.; Soldal, O. Towards a policy for sustainable use of groundwater by non-governmental organisations in Afghanistan. Hydrogeol. J. 2002, 10, 377–392. [Google Scholar] [CrossRef]
- Joseph Redmon, A.F. YOLOv3: An Incremental Improvement. arXiv 2018, arXiv:1804.02767. [Google Scholar]
- Bochkovskiy, A.; Wang, C.Y.; Liao, H.Y.M. YOLOv4: Optimal Speed and Accuracy of Object Detection. arXiv 2020, arXiv:2004.10934. [Google Scholar]
- Jocher, G. ultralytics/yolov5. Website, 2022. Available online: https://github.com/ultralytics/yolov5 (accessed on 24 November 2021).
- Liu, W.; Anguelov, D.; Erhan, D.; Szegedy, C.; Reed, S.; Fu, C.Y.; Berg, A.C. SSD: Single Shot MultiBox Detector. In Computer Vision—ECCV 2016, Proceedings of the 14th European Conference, Amsterdam, The Netherlands, 11–14 October 2016; Leibe, B., Matas, J., Sebe, N., Welling, M., Eds.; Springer International Publishing: Cham, Switzerland, 2016; pp. 21–37. [Google Scholar]
- Tan, M.; Pang, R.; Le, Q.V. EfficientDet: Scalable and Efficient Object Detection. In Proceedings of the IEEE/CVF Conference on Computer Vision and Pattern Recognition, Seattle, WA, USA, 13–19 June 2020. [Google Scholar]
- Wang, C.Y.; Mark Liao, H.Y.; Wu, Y.H.; Chen, P.Y.; Hsieh, J.W.; Yeh, I.H. CSPNet: A New Backbone that can Enhance Learning Capability of CNN. In Proceedings of the 2020 IEEE/CVF Conference on Computer Vision and Pattern Recognition Workshops (CVPRW), Seattle, WA, USA, 14–19 June 2020; pp. 1571–1580. [Google Scholar] [CrossRef]
- Girshick, R.; Donahue, J.; Darrell, T.; Malik, J. Rich Feature Hierarchies for Accurate Object Detection and Semantic Segmentation. In Proceedings of the 2014 IEEE Conference on Computer Vision and Pattern Recognition, Columbus, OH, USA, 23–28 June 2014; pp. 580–587. [Google Scholar] [CrossRef]
- Girshick, R. Fast R-CNN. In Proceedings of the 2015 IEEE International Conference on Computer Vision (ICCV), Santiago, Chile, 7–13 December 2015; pp. 1440–1448. [Google Scholar] [CrossRef]
- Gavrilescu, R.; Zet, C.; Foșalău, C.; Skoczylas, M.; Cotovanu, D. Faster R-CNN:an Approach to Real-Time Object Detection. In Proceedings of the 2018 International Conference and Exposition on Electrical And Power Engineering (EPE), Iasi, Romania, 18–19 October 2018; pp. 165–168. [Google Scholar] [CrossRef]
- Law, H.; Deng, J. CornerNet: Detecting Objects as Paired Keypoints. Int. J. Comput. Vis. 2020, 128, 642–656. [Google Scholar] [CrossRef]
- Duan, K.; Bai, S.; Xie, L.; Qi, H.; Huang, Q.; Tian, Q. CenterNet: Keypoint Triplets for Object Detection. In Proceedings of the 2019 IEEE/CVF International Conference on Computer Vision (ICCV), Seoul, Korea, 27 October–2 November 2019; pp. 6568–6577. [Google Scholar] [CrossRef]
- Liu, S.; Qi, L.; Qin, H.; Shi, J.; Jia, J. Path Aggregation Network for Instance Segmentation. In Proceedings of the 2018 IEEE/CVF Conference on Computer Vision and Pattern Recognition, Salt Lake City, UT, USA, 18–23 June 2018; pp. 8759–8768. [Google Scholar] [CrossRef]
- Zhu, X.; Lyu, S.; Wang, X.; Zhao, Q. TPH-YOLOv5: Improved YOLOv5 Based on Transformer Prediction Head for Object Detection on Drone-captured Scenarios. In Proceedings of the 2021 IEEE/CVF International Conference on Computer Vision Workshops (ICCVW), Montreal, BC, Canada, 11–17 October 2021; pp. 2778–2788. [Google Scholar] [CrossRef]
- Elfwing, S.; Uchibe, E.; Doya, K. Sigmoid-Weighted Linear Units for Neural Network Function Approximation in Reinforcement Learning. Neural Netw. 2018, 107, 3–11. [Google Scholar] [CrossRef]
- Zheng, Z.; Wang, P.; Liu, W.; Li, J.; Ye, R.; Ren, D. Distance-IoU Loss: Faster and Better Learning for Bounding Box Regression. Proc. AAAI Conf. Artif. Intell. 2020, 34, 12993–13000. [Google Scholar] [CrossRef]
- Esri. ESRI ArcGIS Desktop; Esri: Redlands, CA, USA, 2013. [Google Scholar]
- QGIS Development Team. QGIS Geographic Information System. QGIS Association. 2021. Version 3.22.4. Available online: http://www.qgis.org.
- Maimaiti, A.W. From the perspective of cultural heritage management to protect Turpan water cultural heritage-Karez. CNKI 2014, 36, 133–134. [Google Scholar]
Publisher’s Note: MDPI stays neutral with regard to jurisdictional claims in published maps and institutional affiliations. |
© 2022 by the authors. Licensee MDPI, Basel, Switzerland. This article is an open access article distributed under the terms and conditions of the Creative Commons Attribution (CC BY) license (https://creativecommons.org/licenses/by/4.0/).