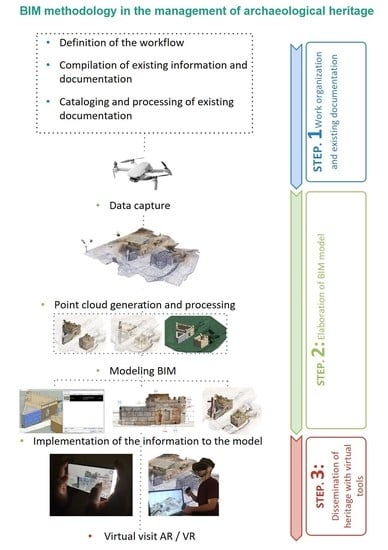
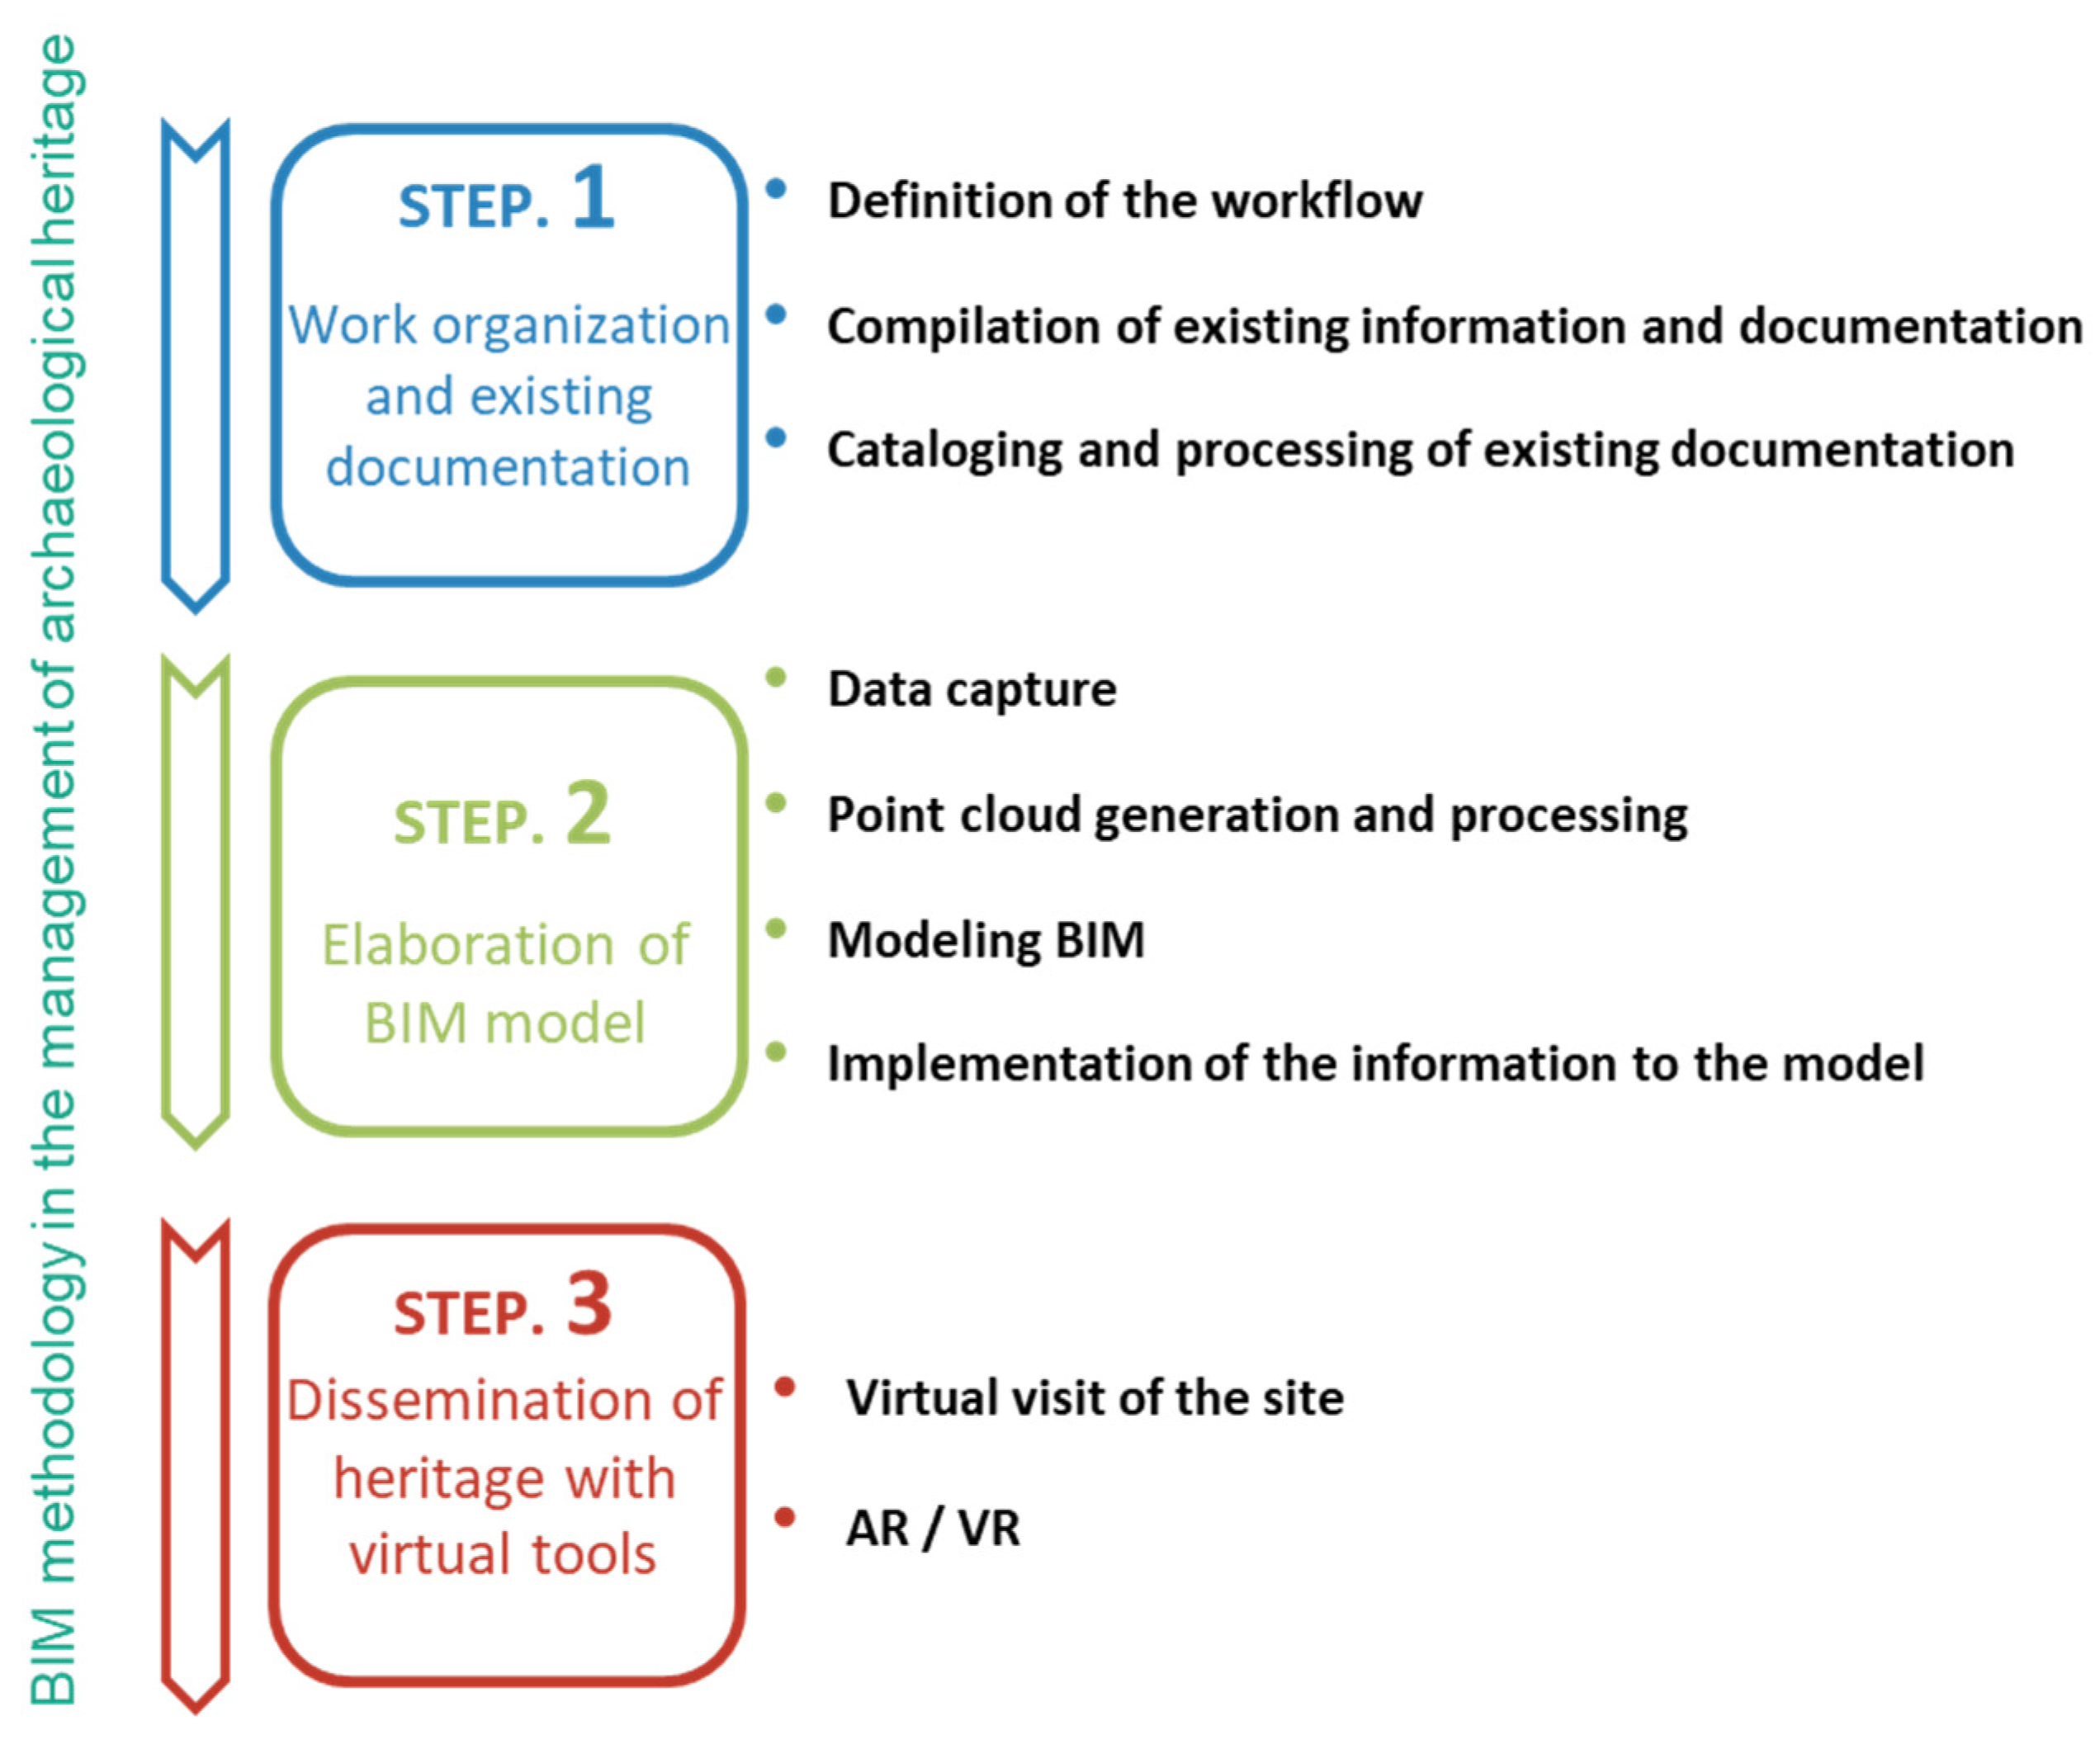
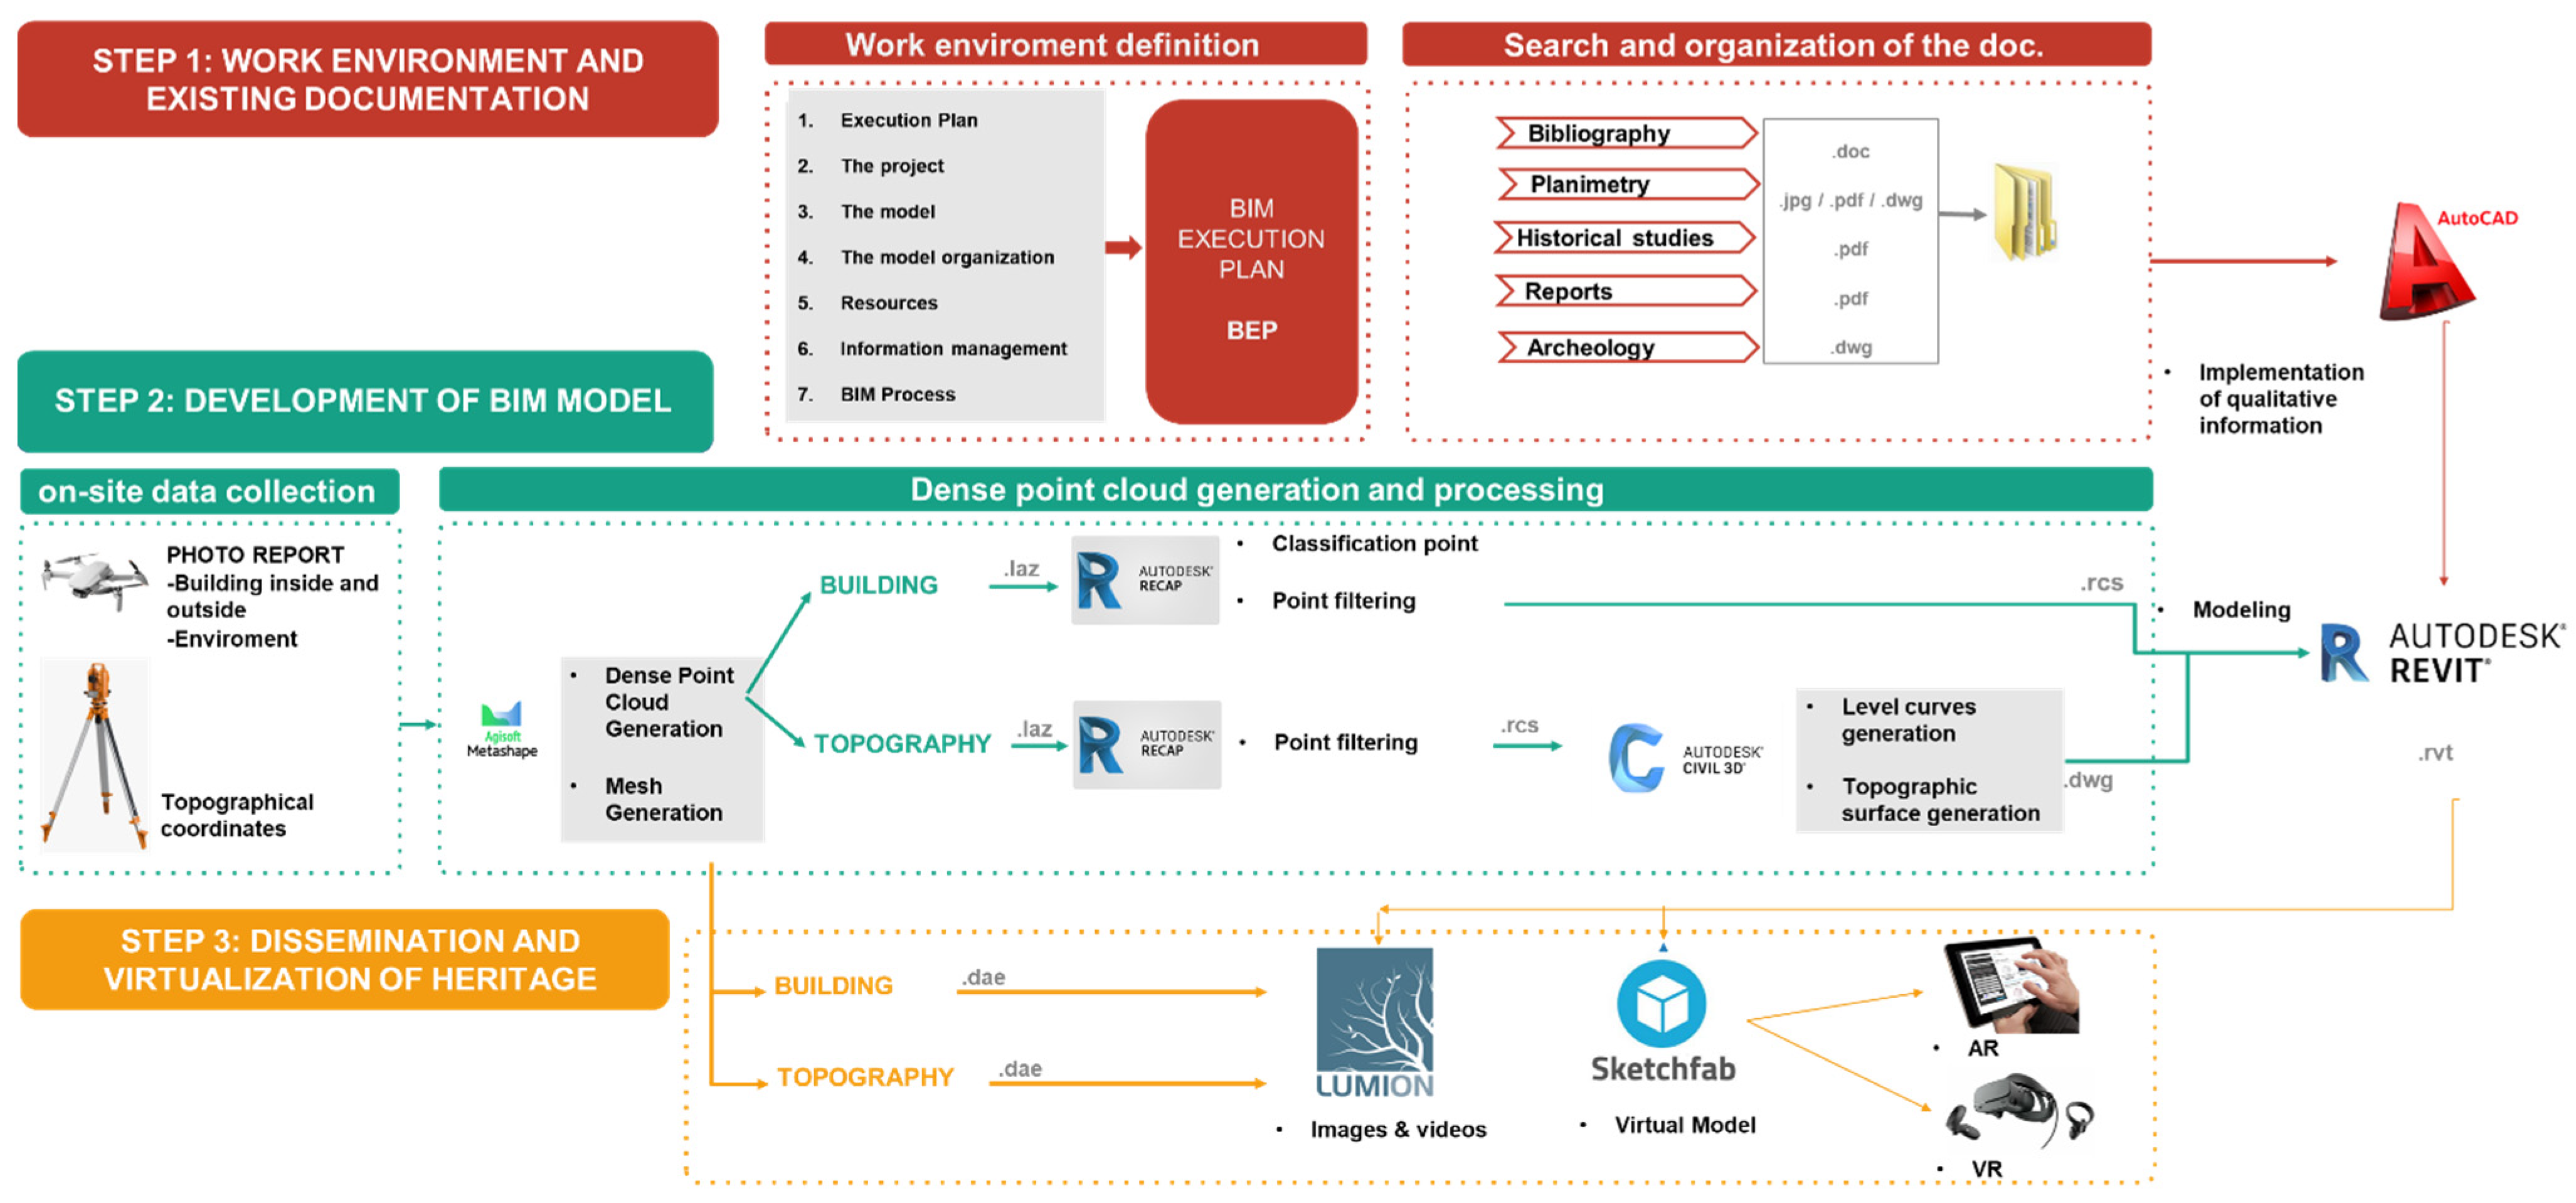
In the first phase, a work plan (BEP) was defined that serves as a basis for all the agents involved in the generation and use of BIM models and the information obtained from them in the different phases of the project. Subsequently, a recapitulation of the documented information and previous work was carried out through publications and the archive of the Consorcio Ciudad Monumental de Mérida, which provided graphic documents, excavation reports, and photographs (all the information provided remains clearly reflected in the work). A study and analysis of the different documents provided for the work, cleaning of vector files, and classification of information was carried out. After obtaining the necessary information and files, the second phase was developed, which consists of the elaboration of the model through a photogrammetric survey, generating a point cloud that serves as support for the following phases of the work.
These steps include generation and processing of the point cloud, topography generation, modelling of the heritage element using the software Revit (for Microsoft Windows, currently developed by Autodesk), and implementation of all the information in the model. For the treatment of the archaeological information, the possible capture methods will be established and taken into account in future excavation campaigns, and a protocol for the implementation of the existing vectorial information to our model will be established.
With this data, a BIM model was generated that gathers all the information in real time.
3.2. PHASE 2: Survey and Elaboration of BIM Model
3.2.1. Capture of Geometric Data of the Current State of the Property
Traditionally, plans were made by measuring with traditional tools. In heritage, carrying out a survey with these methods is costly and inaccurate, since it is difficult to accurately capture the irregularities and singularities of all the heritage elements, which results in errors.
Today, to undertake any type of intervention in a heritage asset, it is essential to make reliable, three-dimensional digital models to be able to understand, plan, and carry out projects [
36,
37].
For this project, for the generation of the point cloud, we used photogrammetry, which is a precise and noncontact 3D measurement technique based on various high-quality images, which allows for accelerating the collection of geometric data from a building or object [
38]. This point cloud provides us with geometric information with almost millimetre precision; however, it does not provide any additional information, which is why it is necessary to make a BIM model from the generated point cloud.
3.2.2. Materials and Resources
For the capture of geometric data of the heritage asset under study, a DJI Mavic Mini drone was used, which is an ultralight and portable drone with a transmission distance of 2 km, 3-Axis Gimbal, and 12 MP for HD 2.7 K videos [
39].
The use of this drone is allowed, due to its weight, without the need for a pilot’s license.
In addition, with the total station Geomax model Sipp 20 R 5” 250, points were obtained that allowed us to geolocate the archaeological remains.
It should be noted that this method is very effective, and optimal results are obtained at low cost, meaning that it may be within the reach of most professionals.
3.2.3. Capture Photos by Drone
Data capture was carried out in three stages: The first stage covered the environment where the buildings are located, which allowed us to obtain an exhaustive topography, determining the exact slopes and regularities. In the second stage, the exteriors of the structures was assessed independently and in the third stage the interiors, so as to allow us to obtain point clouds with different parameters depending on the level of detail, according to the importance of the each of the elements of the heritage asset and the limitations of computer resources [
40,
41] (
Table 1).
3.2.4. Point Cloud Generation
For the generation of the point cloud, Agisoft Metashape (for Microsoft Windows, currently developed by Agisoft) software was used.
Two files were worked on in parallel, one for the archaeological structures (
Table 2), and the other for the topography (
Table 3). Both used the same reference system; however, they had a different definition of detail [
42].
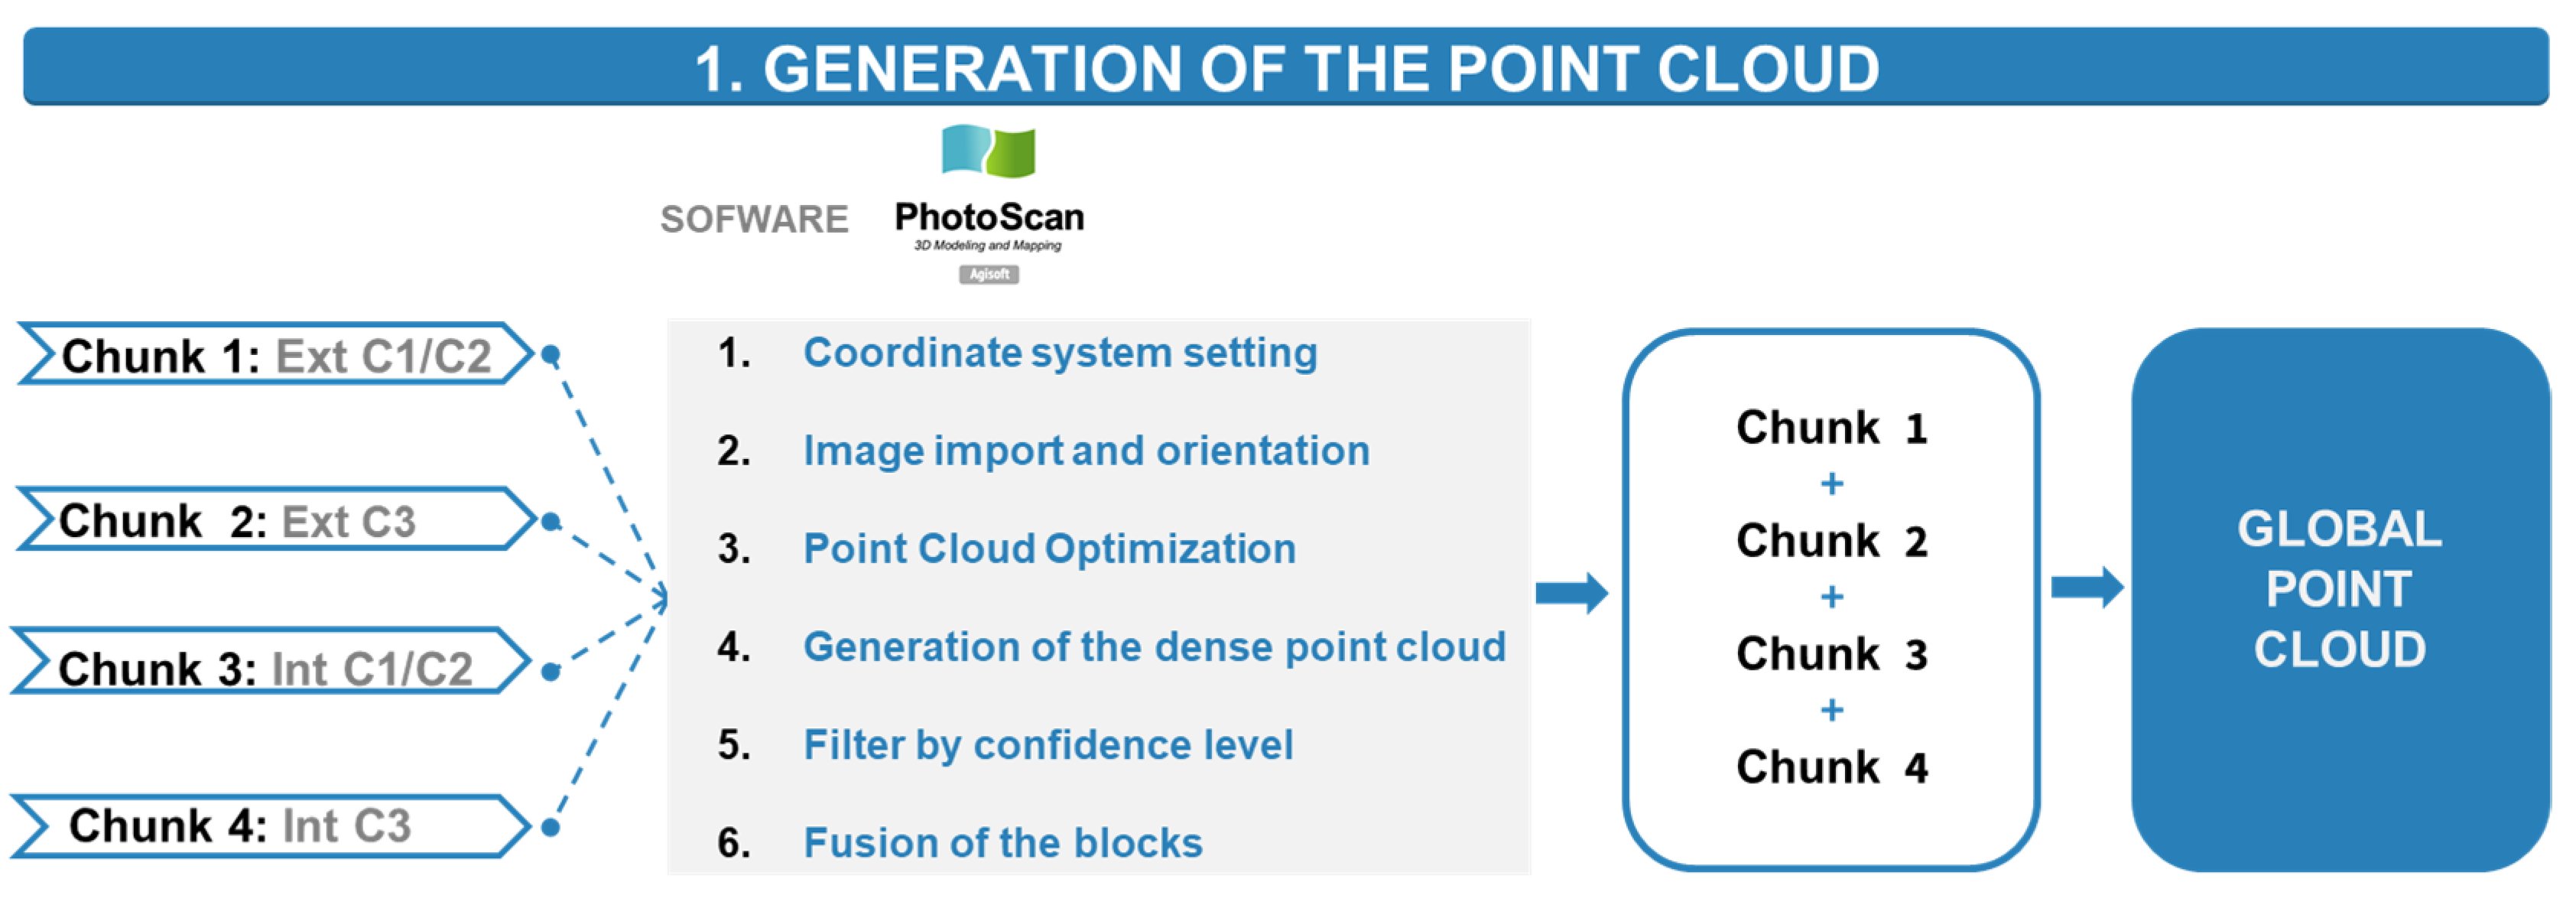
The steps to follow to generate the point cloud are as follows (
Figure 5):
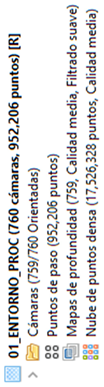
We structured the workspace into several “chunks”, which corresponded to each phase of data collection. In this way we made partial point clouds, which later were merged to give rise to the global point cloud.
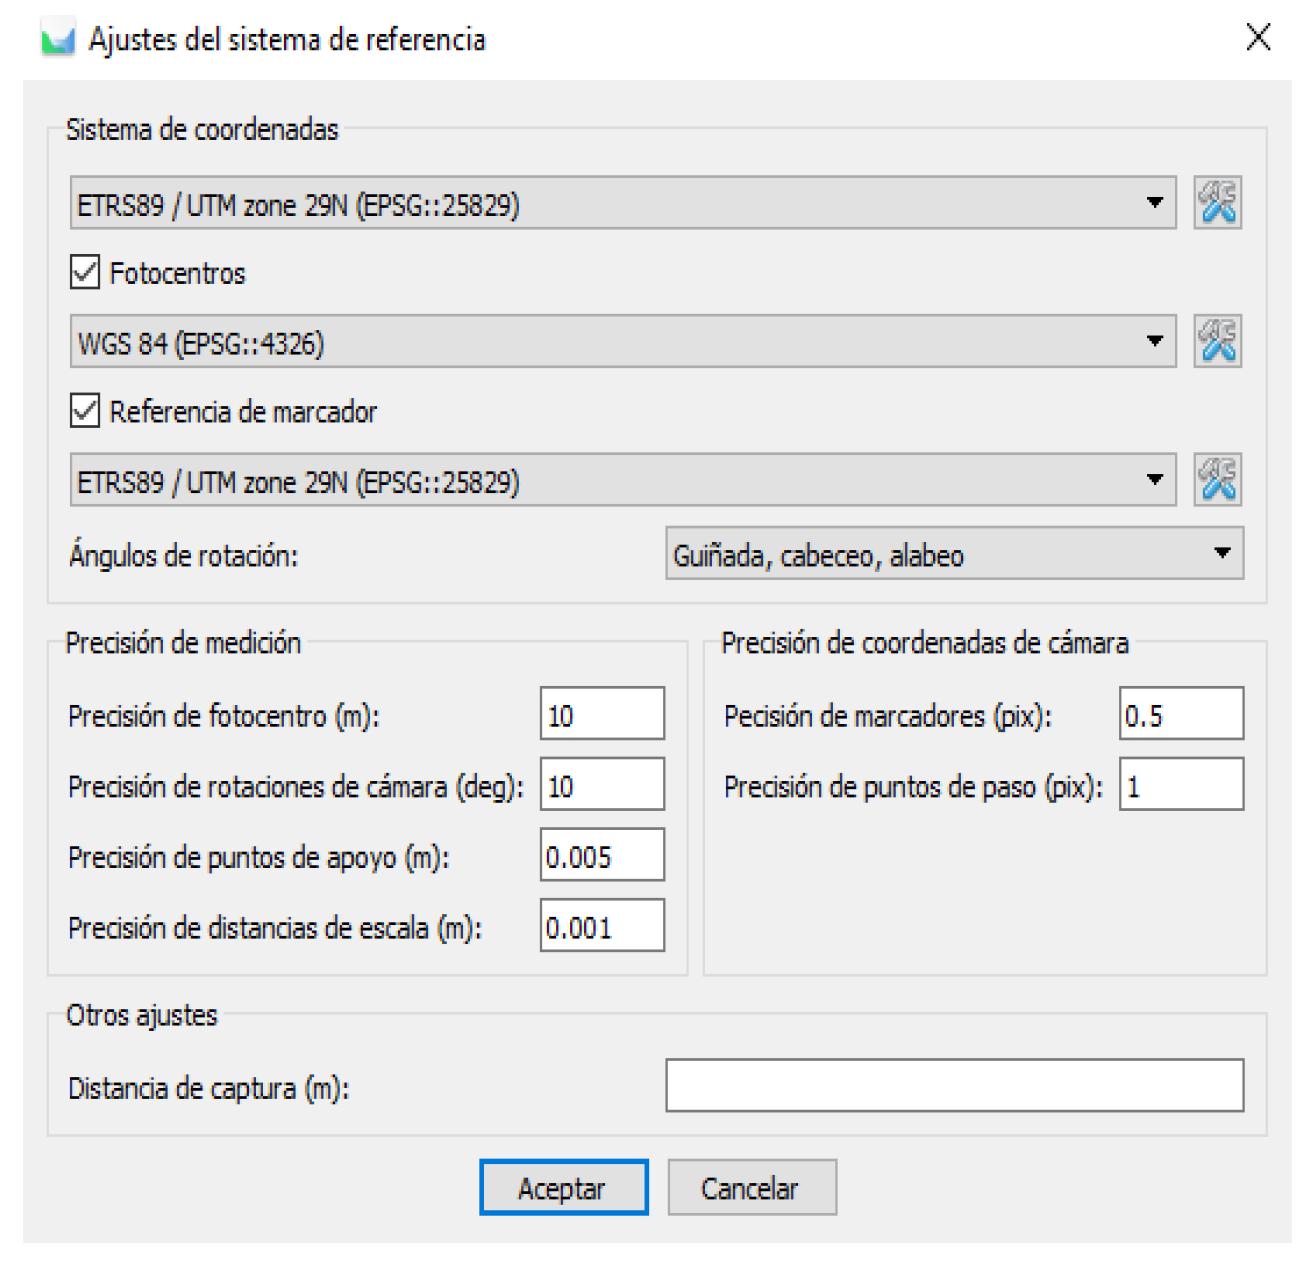
Adjust the coordinate system: for capturing data, several types of coordinate systems were used (
Figure 6):
- -
The photos obtained with the drone were georeferenced with the WGS 84 system (EPSG:4326). WGS84, World Geodetic System 84 (World Geodetic System 1984).
- -
The points were obtained for the station with the ETRS89/UTM system.
ETRS89 is a three-dimensional geodetic reference system used as a standard for high-precision GPS georeferencing in Europe.
For this model, we used this reference system, as it is the one used by the Consorcio de Mérida to georeference the findings of archaeological excavations.
Import and orient images: The images were imported in different chunks, making them coincide with the different data collection campaigns.
In this way, we worked with low-tech resources and controlled the adjustments and links of the different point clouds in a more optimized way.
To perform the alignment, an overlap in the order of 20% or 30% between sets of adjacent points is generally required; furthermore, in said overlap, there must be at least one special objective (corner, sphere, plane) identified that allows common points to be found between the point clouds.
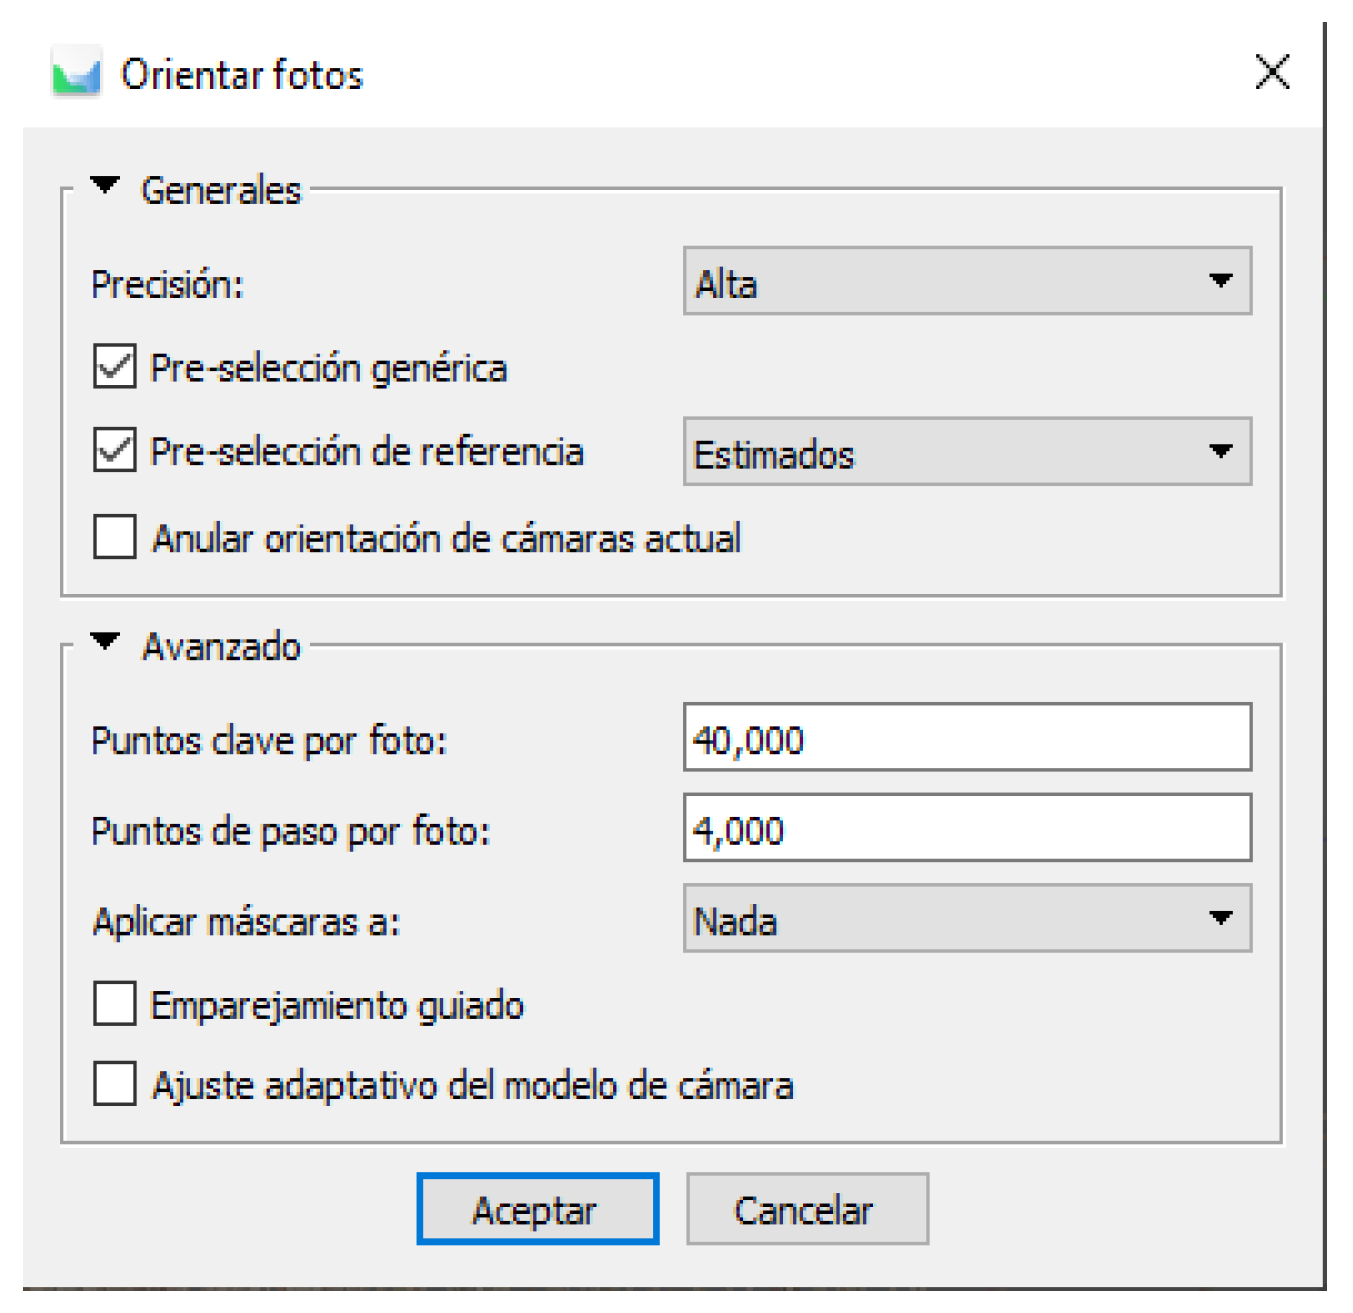
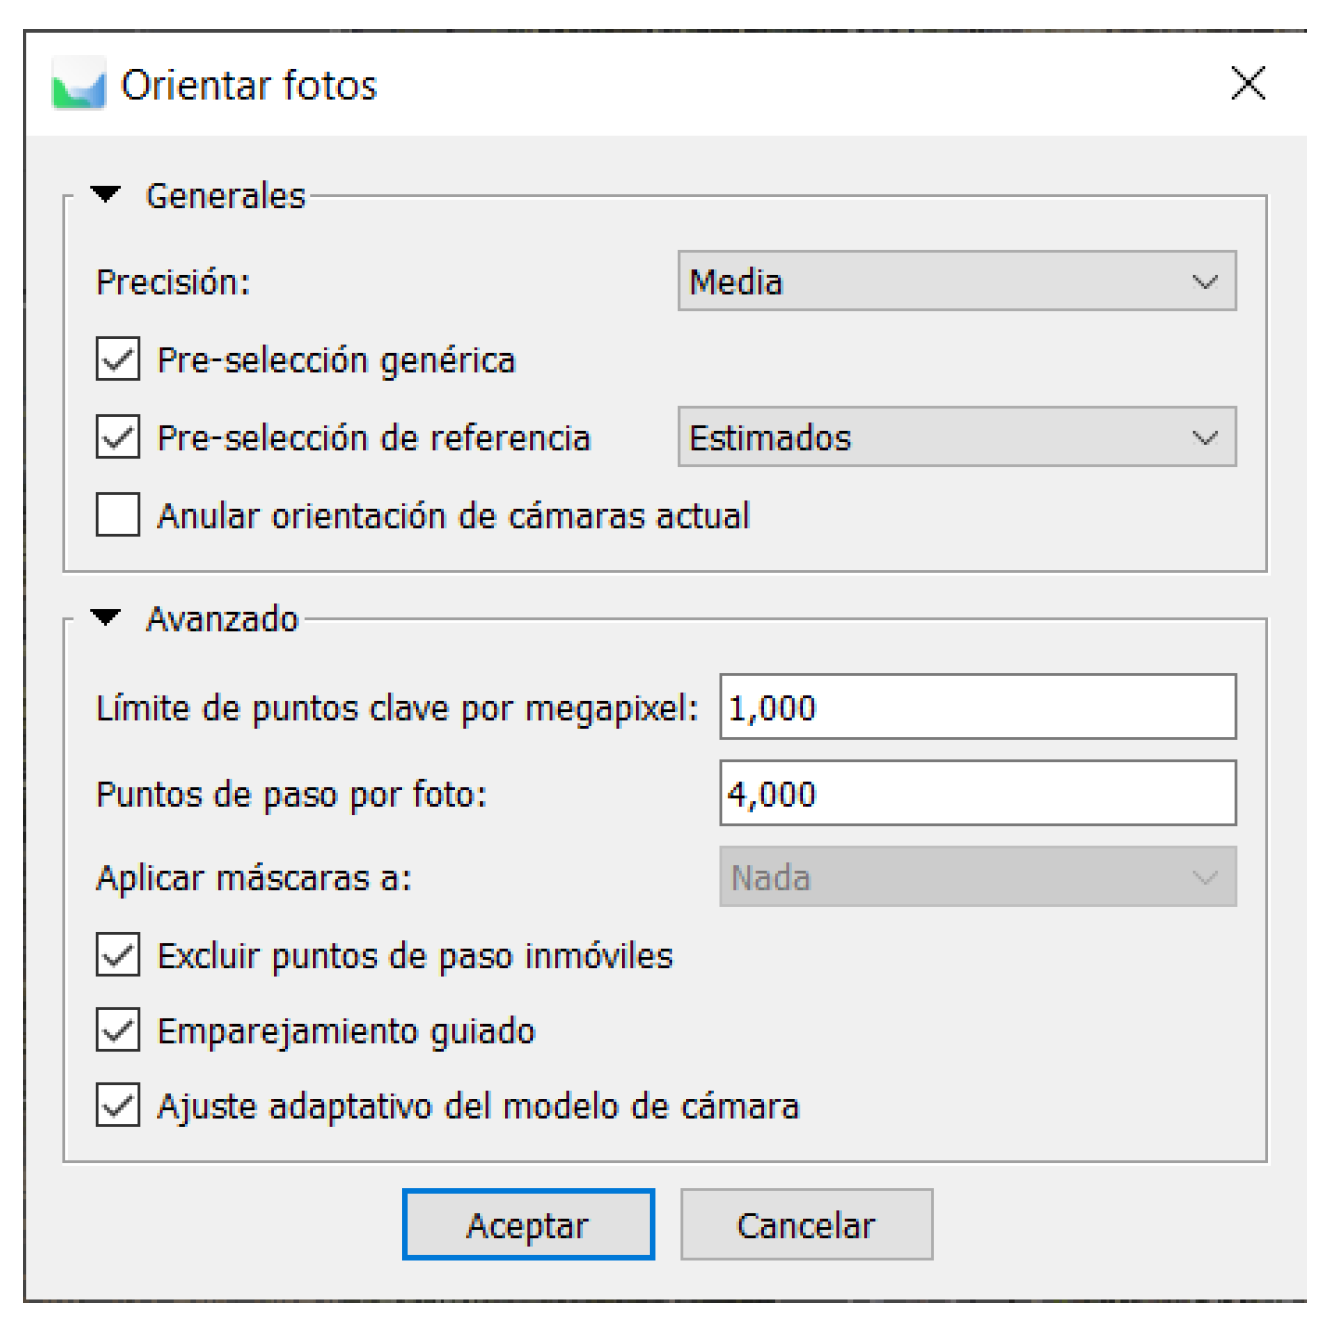
We oriented the images using the following settings for the buildings (
Figure 7) and for the topography (
Figure 8):
- -
Precision: we wanted it to be high to obtain great detail of the buildings, since there are paintings and decorative details that we want to see in the model.
- -
Mask: we did not apply the selection of masks in the photographs, since for this we would have had to select in each photograph which elements we wanted to be processed. In our case, the cleaning and filtering process was carried out posteriori once the dense point cloud was generated. In this way, we optimized time.
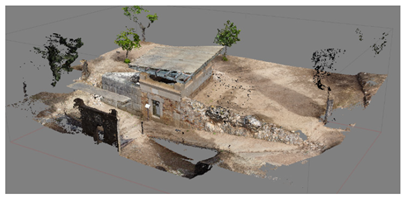
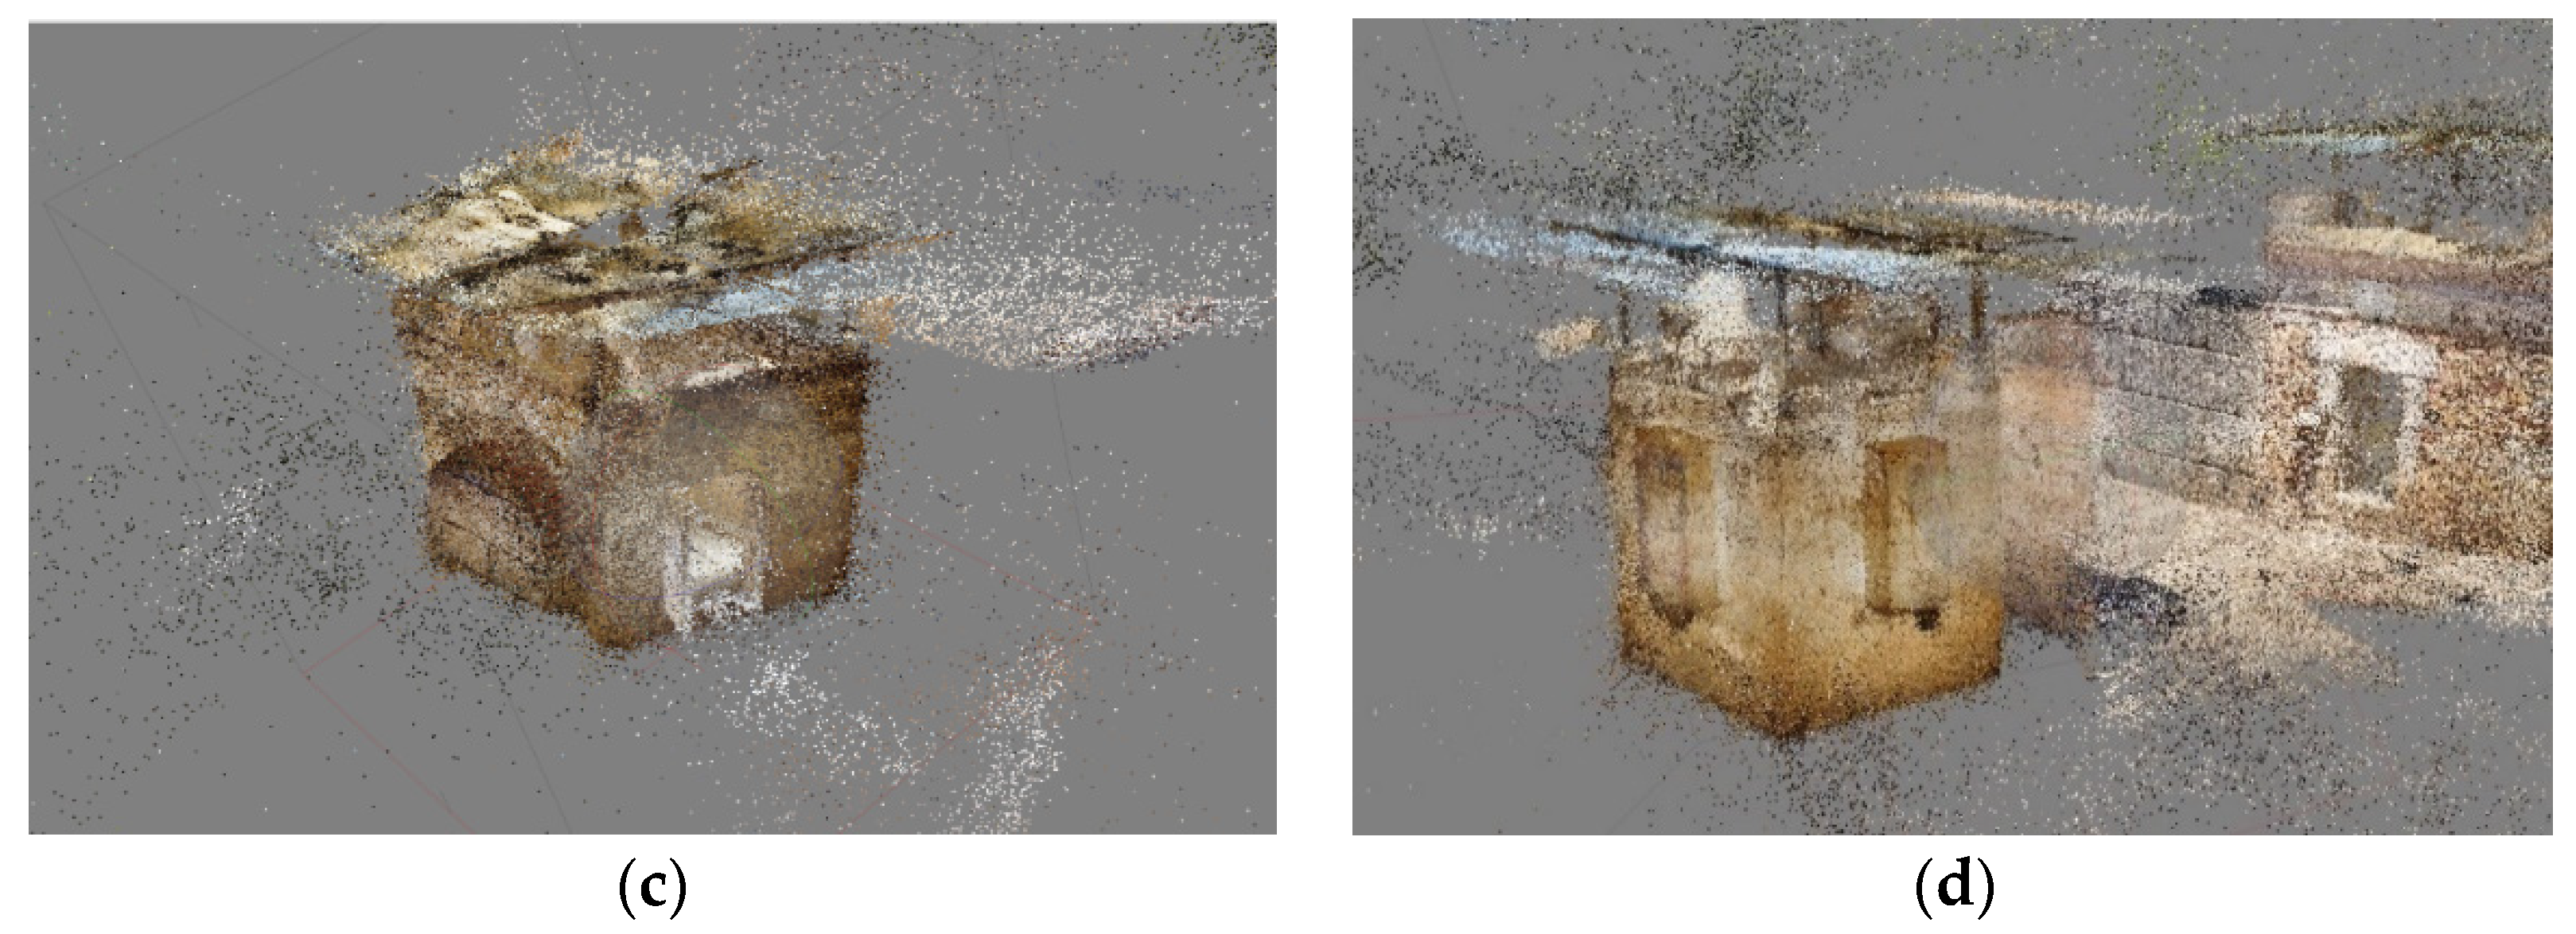
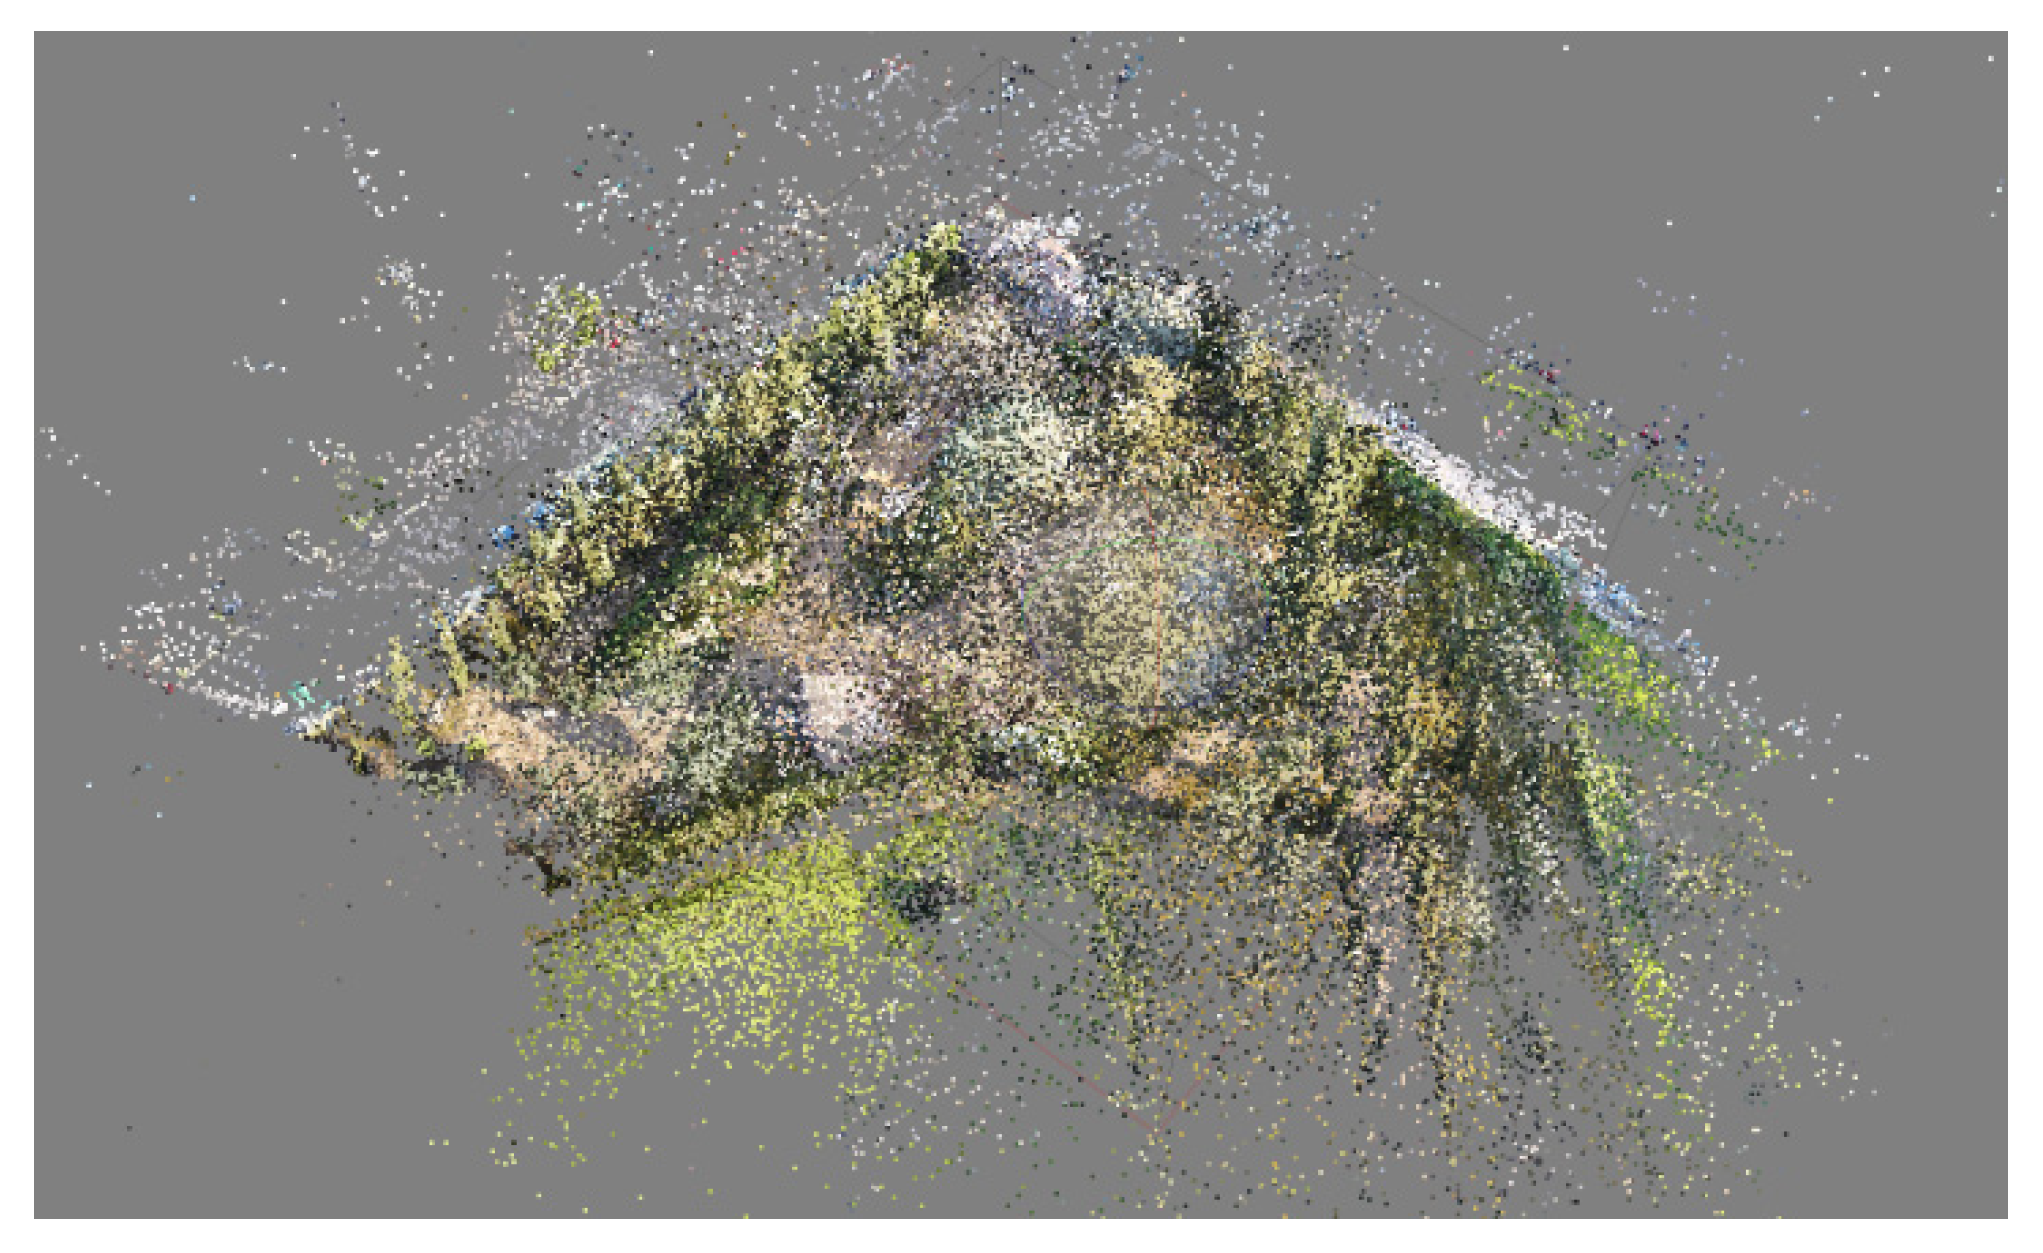
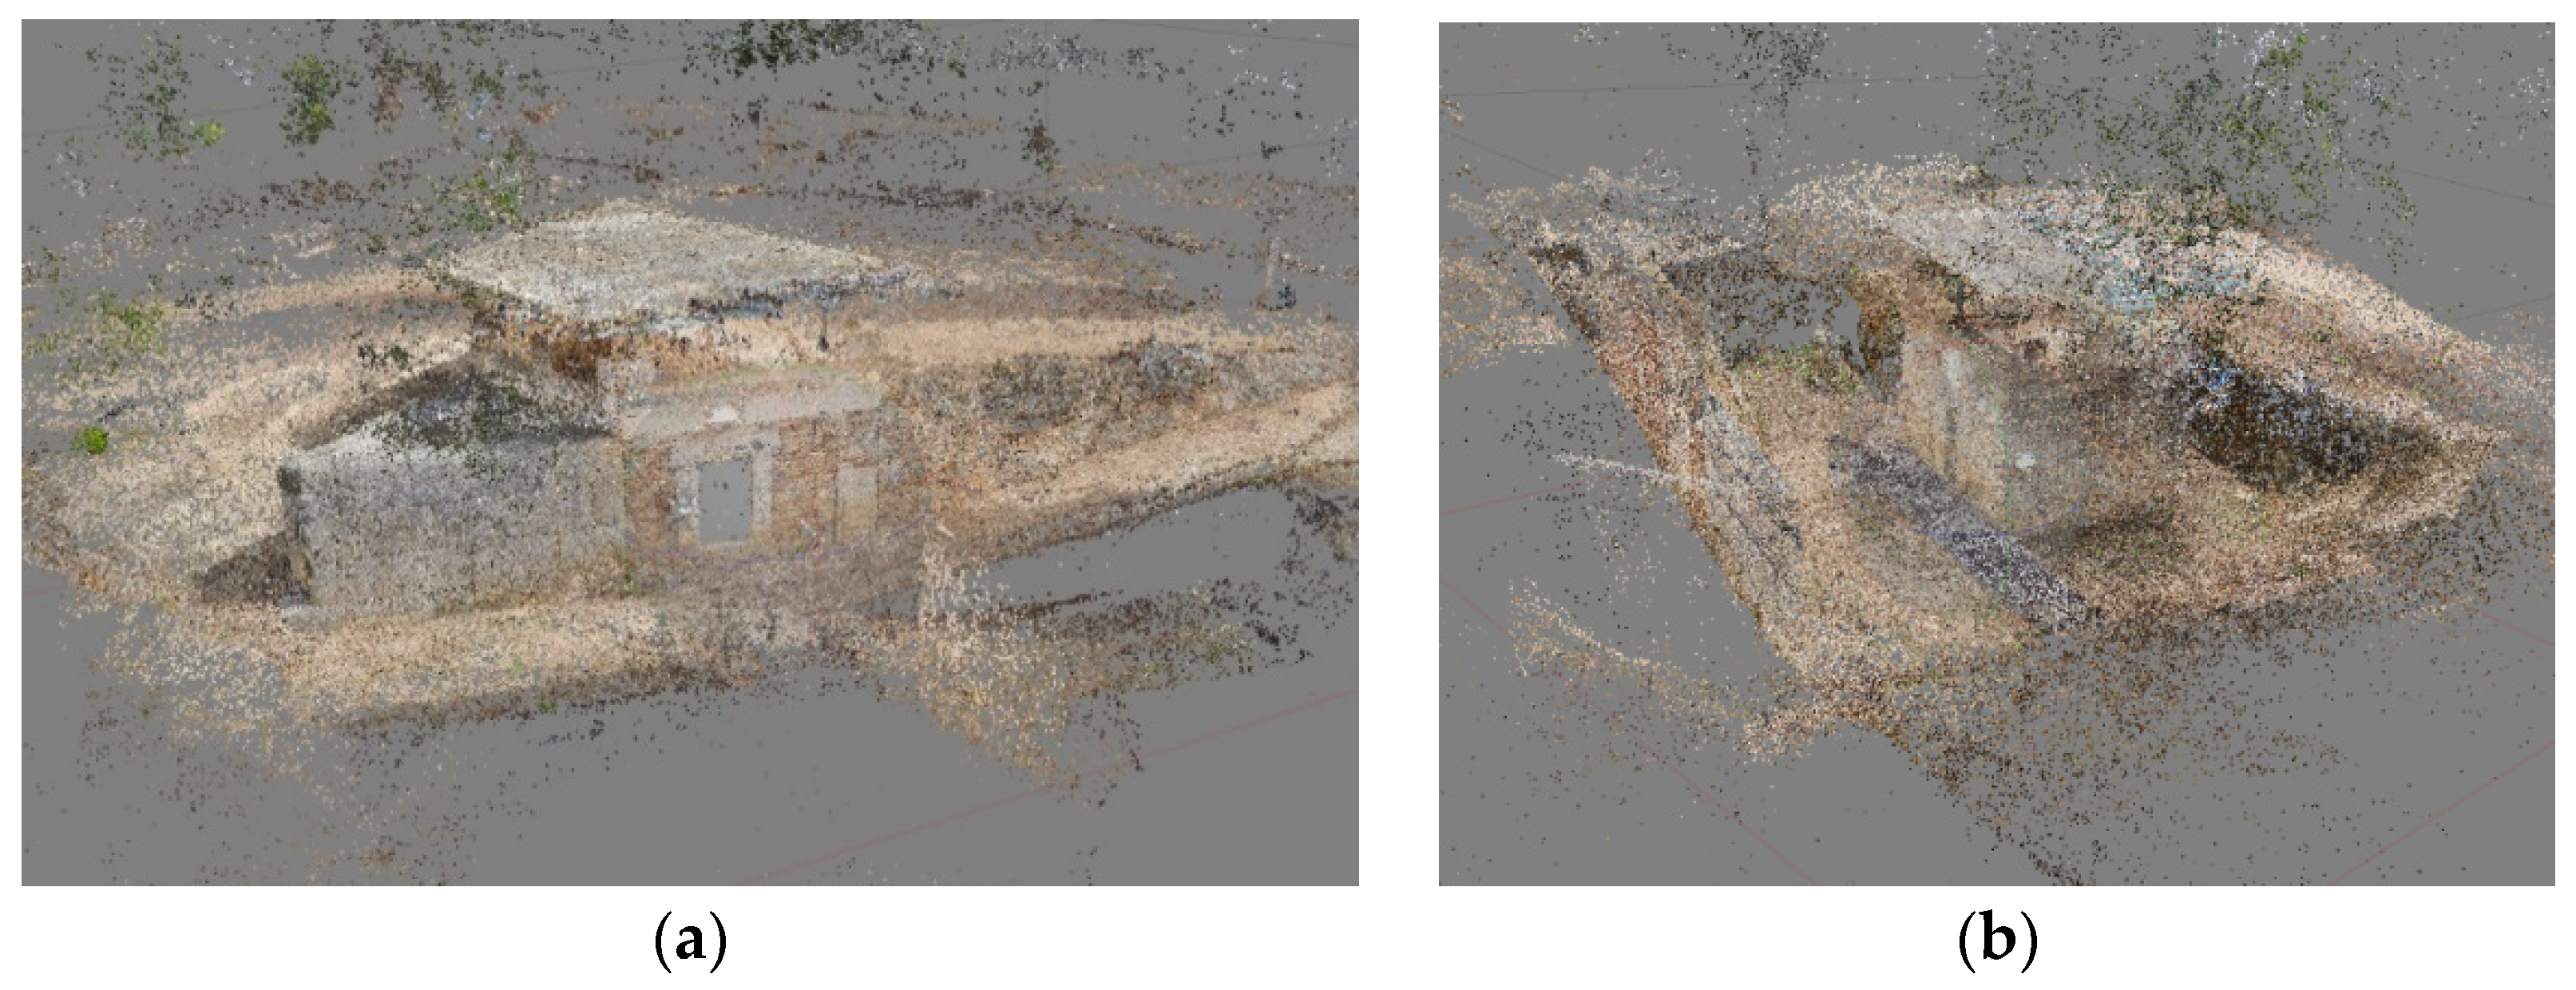
The scattered point clouds of each block were obtained independently of the buildings (
Figure 9).
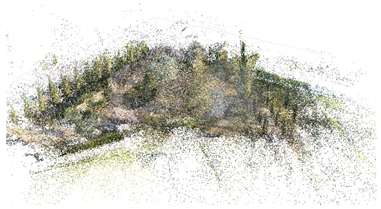
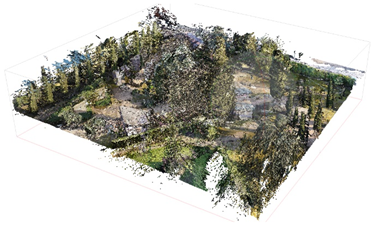
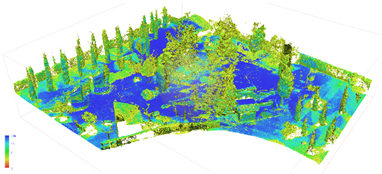
In a parallel way, in a different file, the scattered point cloud of the environment was obtained, which was subsequently used for modelling the topography (
Figure 10).
Point cloud optimisation
Seeking greater precision, we selected only the images with a margin of error less than 0.5 m within the sparse point cloud. The rest of the images outside that margin of error were eliminated from the frame.
In addition, we included the images that generated waypoints or anchor points with the same precision as before, seeking total coherence of the model.
This error range of 0.5 m translated into a maximum error of 2 cm in the final dense cloud if we took into account that the points generated first were anchor points of the final cloud.
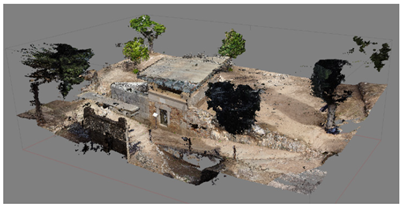
Dense point cloud generation
Point clouds capture accurate and detailed geometry of an environment, thus facilitating the process of extracting information from complex and realistic geometrics of scanned elements [
43,
44].
In this research, point clouds were used as a fundamental tool to simplify the modelling phases within the BIM environment. Thanks to this combination, it was possible to obtain reliable results for the overall construction of the building.
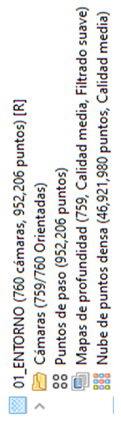
When generating the point cloud, we could define the quality depending on the work to be carried out later, as it is not always convenient to generate point clouds with high quality for a greater optimisation of resources, as this requires very powerful computer equipment.
Once the dense point cloud is generated, each block contains a large number of points that define the model; however, many points appear that impair the definition of the model.
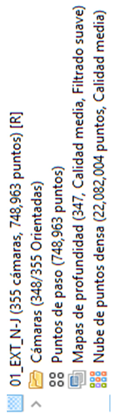
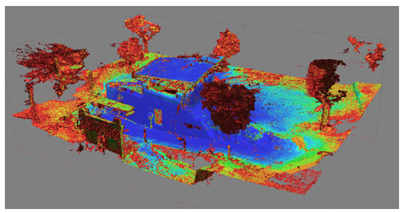
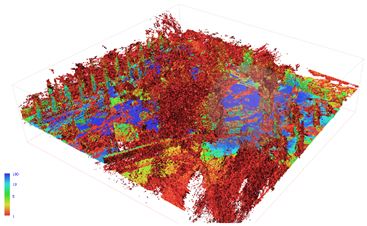
Filtering by confidence level
Subsequently, in order to use the raw point cloud, a series of steps such as cleaning and filtering of the measurement noise is performed. Generally, cleaning and filtering are user-guided because a certain level of interpretation of the scene is needed (e.g., identification of clean points of trees, people, or outliers).
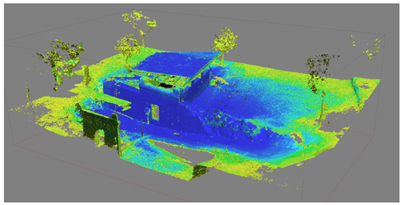
After filtering each dense point cloud, the number of points is reduced considerably. This ranks the points with the highest accuracy, eliminating all points that could generate large errors and deviations from the model (
Table 4,
Table 5 and
Table 6).
Partial point cloud merging
Once the whole process was carried out with each of the partial point clouds (blocks), the point clouds were aligned with each other. The alignment of the point clouds was performed using an algorithm based on Iterative Closest Point (ICP) [
45].
ICP is a method of optimising point clouds, in which one point cloud is kept fixed while the other is transformed to better match the reference. This algorithm revises the transformation in which translation and rotation are combined as necessary to minimise an error metric, usually a distance from the source to the reference point cloud, as the sum of the differences between the coordinates of the matched pairs.
The fusion of the different point clouds can be performed in two different ways:
One-step merging: with this method, all partial point clouds are merged at once. However, it is not advisable to merge in this way because it requires a lot of computer resources, and we cannot control whether any of the partial point clouds are aligned incorrectly.
Merging in several steps: this is done using a summation criterion, in which two point clouds are merged beforehand, to which the others are added one by one. This method is slower, but errors can be controlled better, and each merging process does not require so many computer resources, allowing us to continue working with other software at the same time.
In order to merge the models, it is important that the point cloud overlaps, so that the merging is done immediately and automatically.
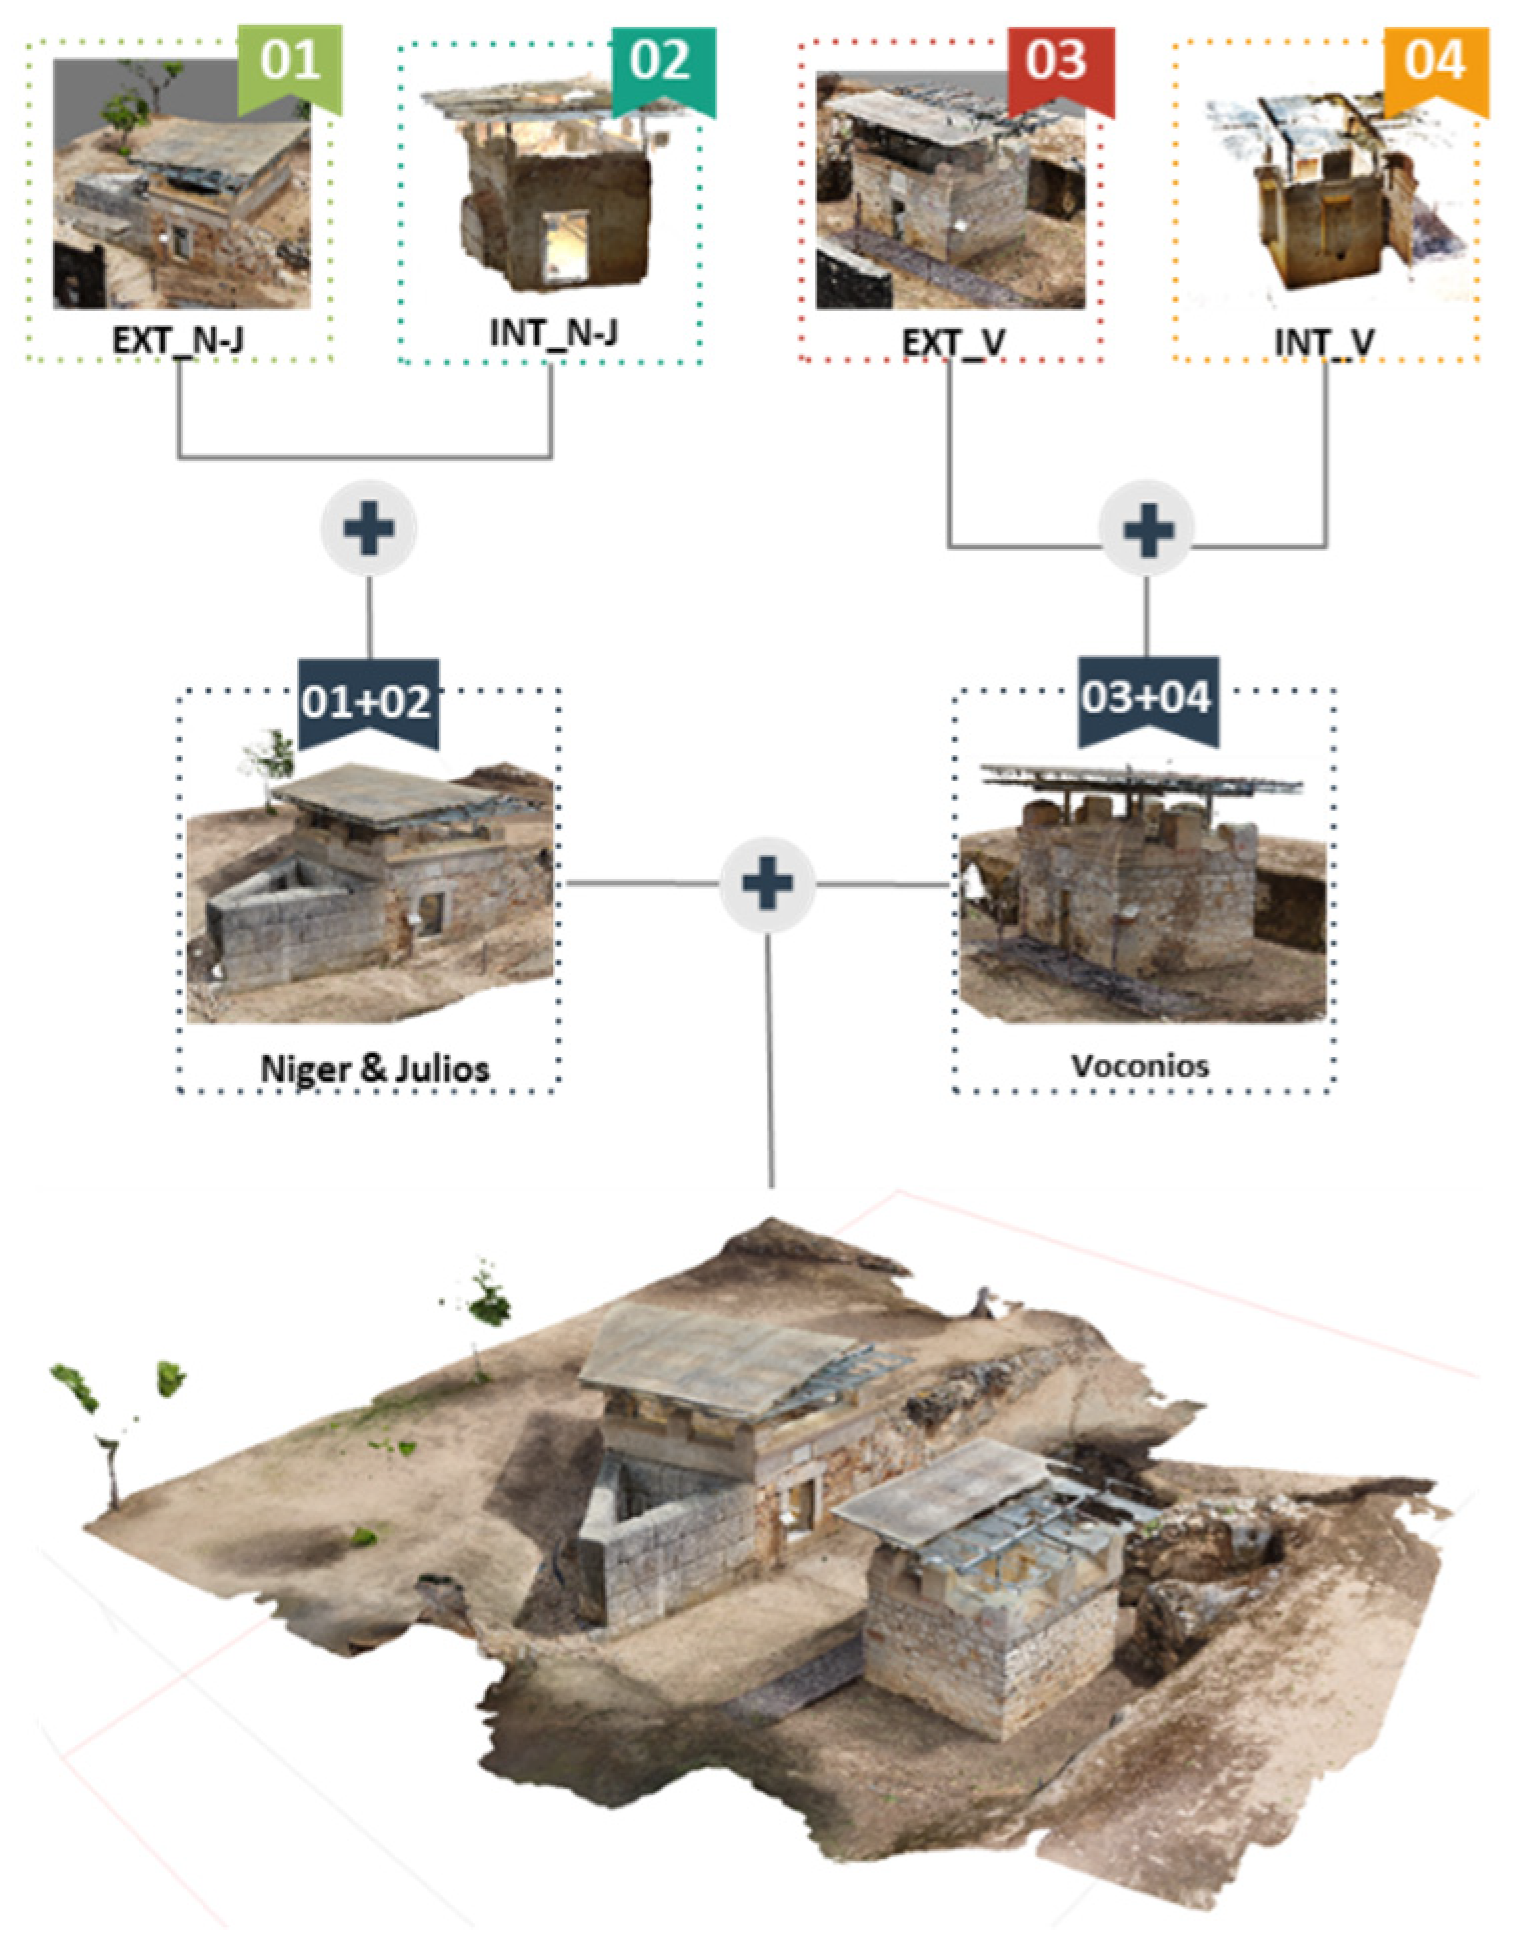
In our case, the merging of the different point clouds was carried out in several steps, following a summation criterion (
Figure 11), in which blocks 01 and 03, which correspond to the point cloud of the exterior and interior of the Niger and Julios buildings, were merged beforehand.
Subsequently, blocks 02 and 04, which corresponded to the point clouds of the exterior and interior of the Voconios building, were merged.
Finally, the point clouds of the buildings were merged. A complete model of the three buildings (Niger, Julios, and Voconios) was created.
In order to merge the models, it is important that the point clouds overlap, so that the merging can be carried out immediately and automatically. If this is not possible, the merging should be forced by using markers.
The markers were used to merge the point clouds of the interiors with the exteriors, as in the interior the georeference of the images captured by the drone was requested, as being an interior and having a metal cover, it generated interference and was not as precise as in the exterior.
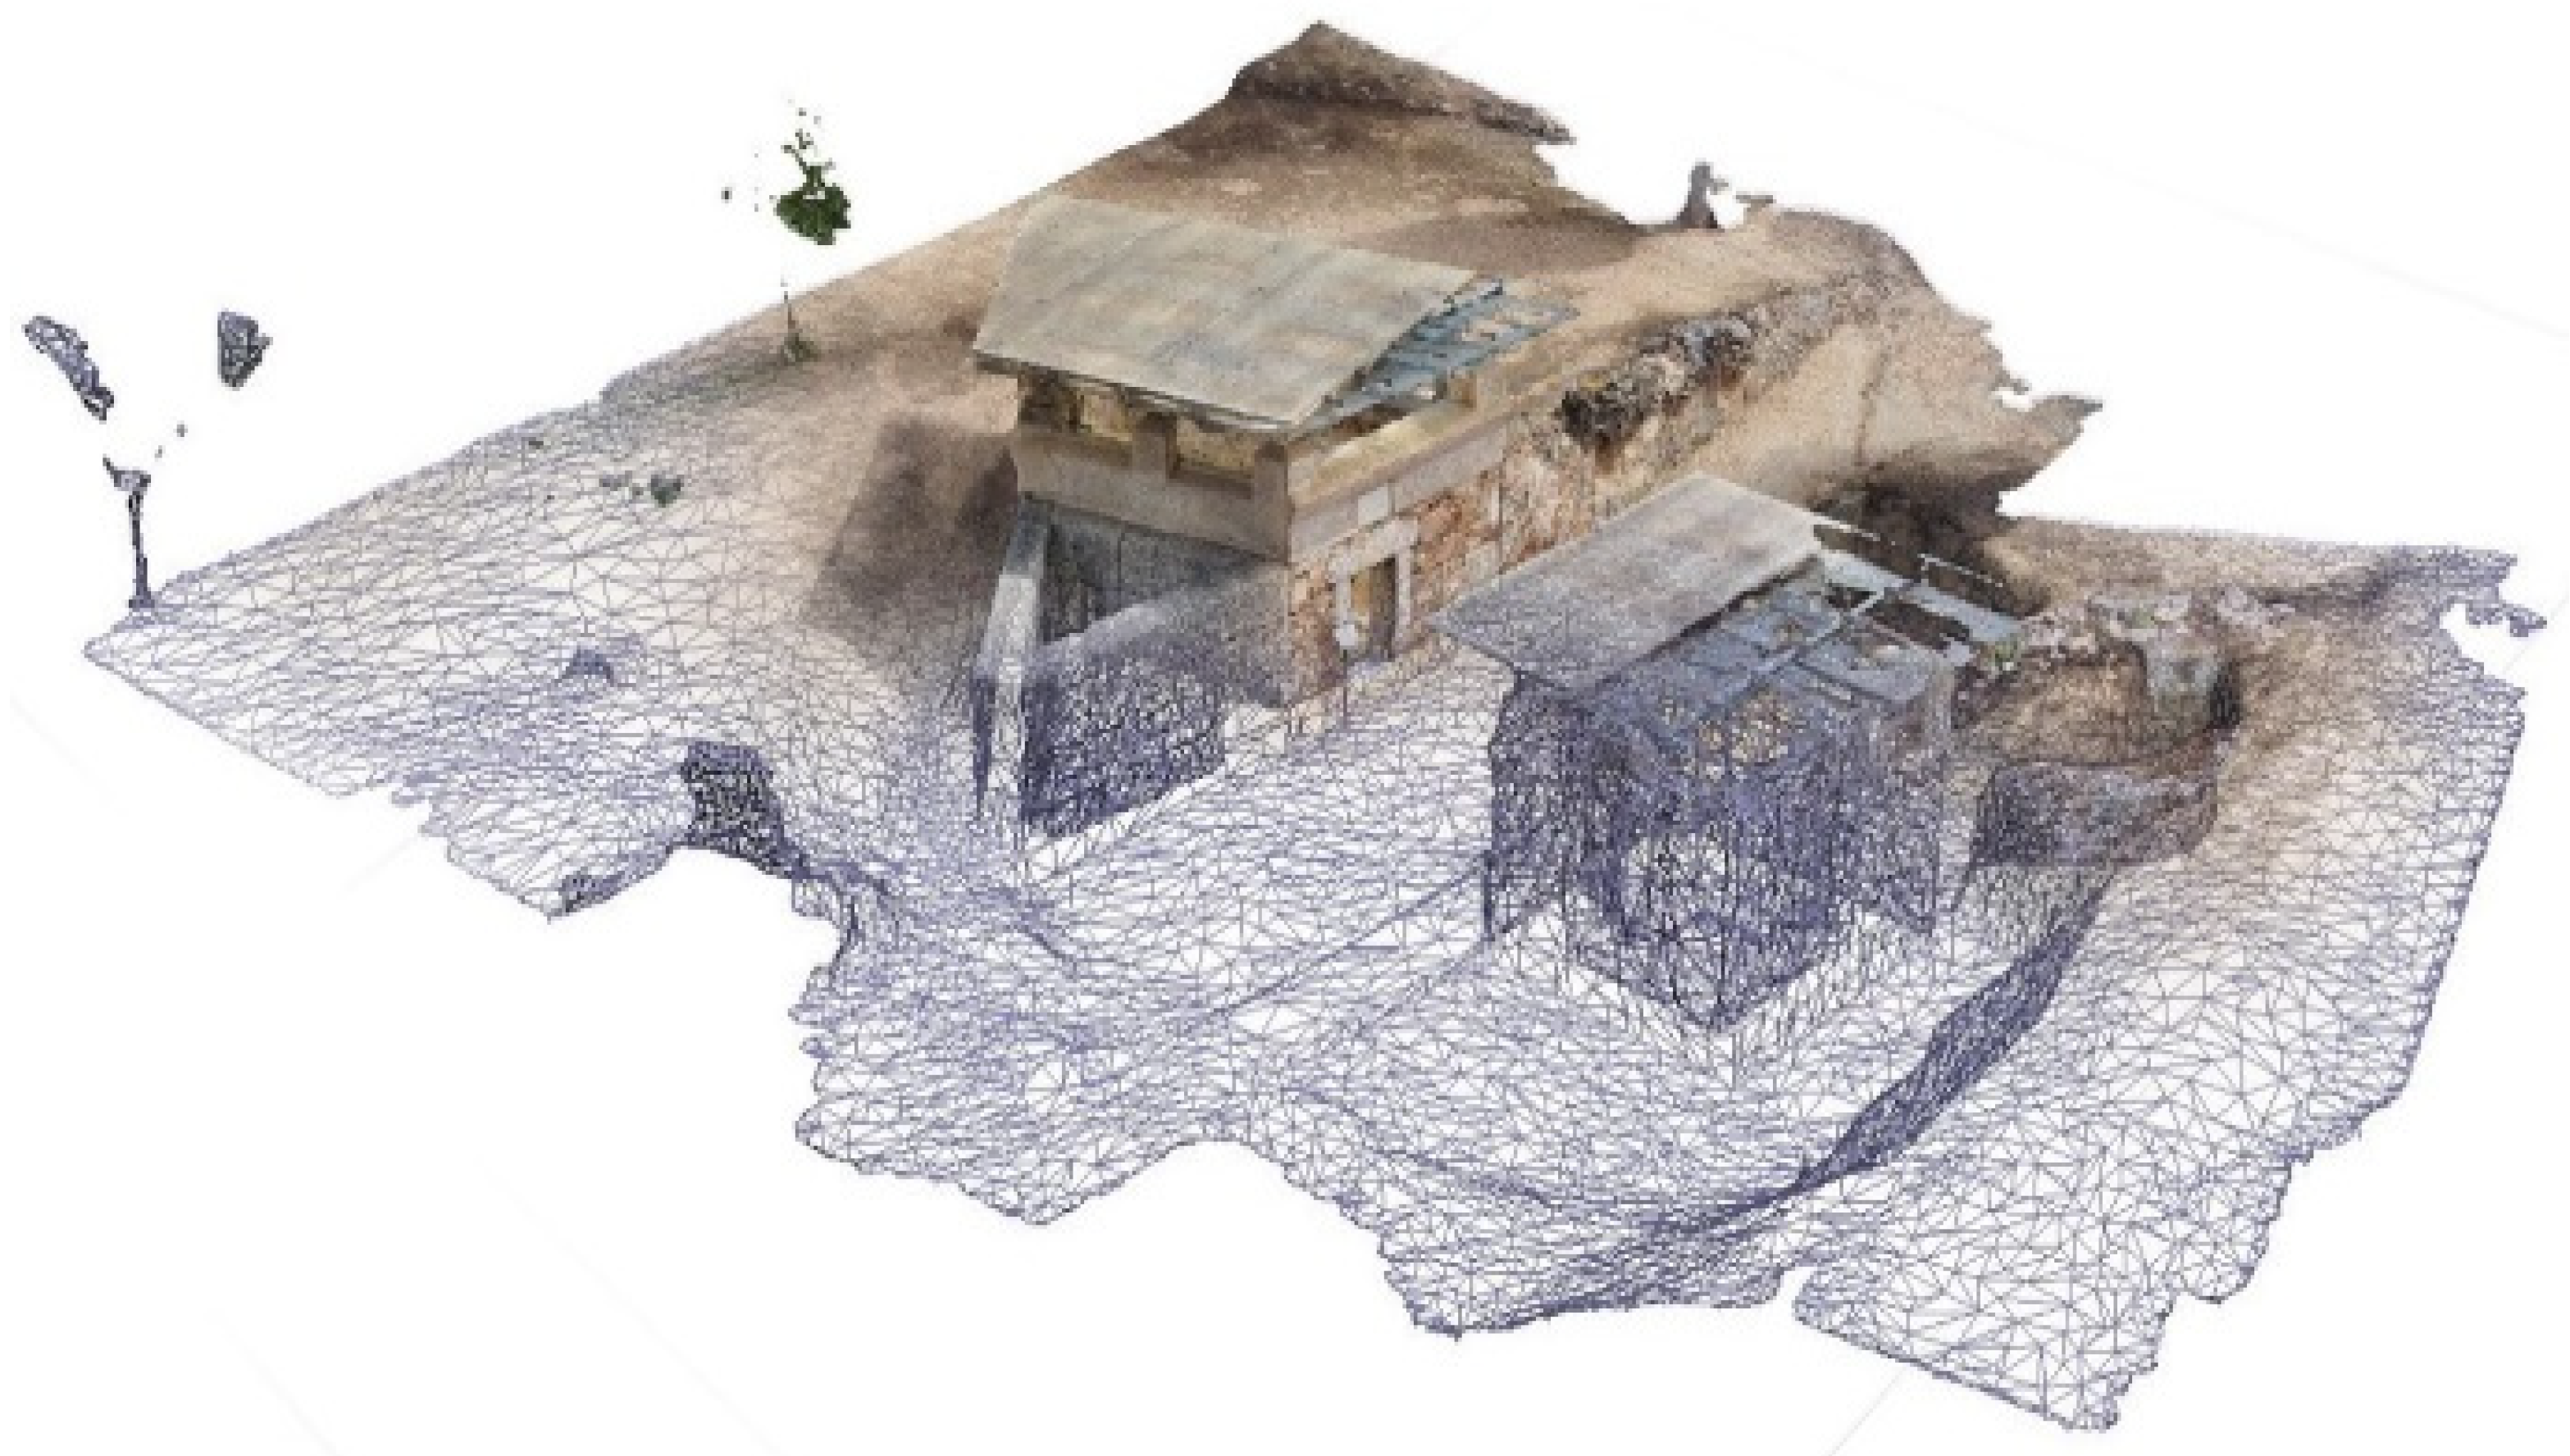
Mesh and texture generation
In addition to generating the dense point cloud, we can generate a 3D mesh of its polygonal surface as a data preprocessing method. The generated mesh is composed of triangles on top of the point cloud itself. This mesh is also edited to fill holes in the cloud, as well as to refine and reduce the points of the model through smoothing operations, as we have seen in work by Remondino and El-Hakim [
46] and Rodriguez-Moreno et al. [
47].
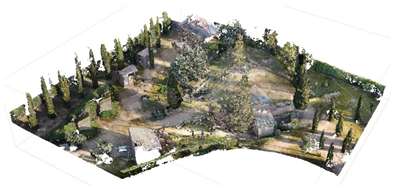
This mesh can be given a texture, generating an optimal model to be read and processed by different software that will allow the property to be visualised in great detail (
Figure 12). However, it is not useful for working with modelling software such as Revit, as it cannot be sectioned or worked with directly (we used the dense point cloud directly for this purpose).
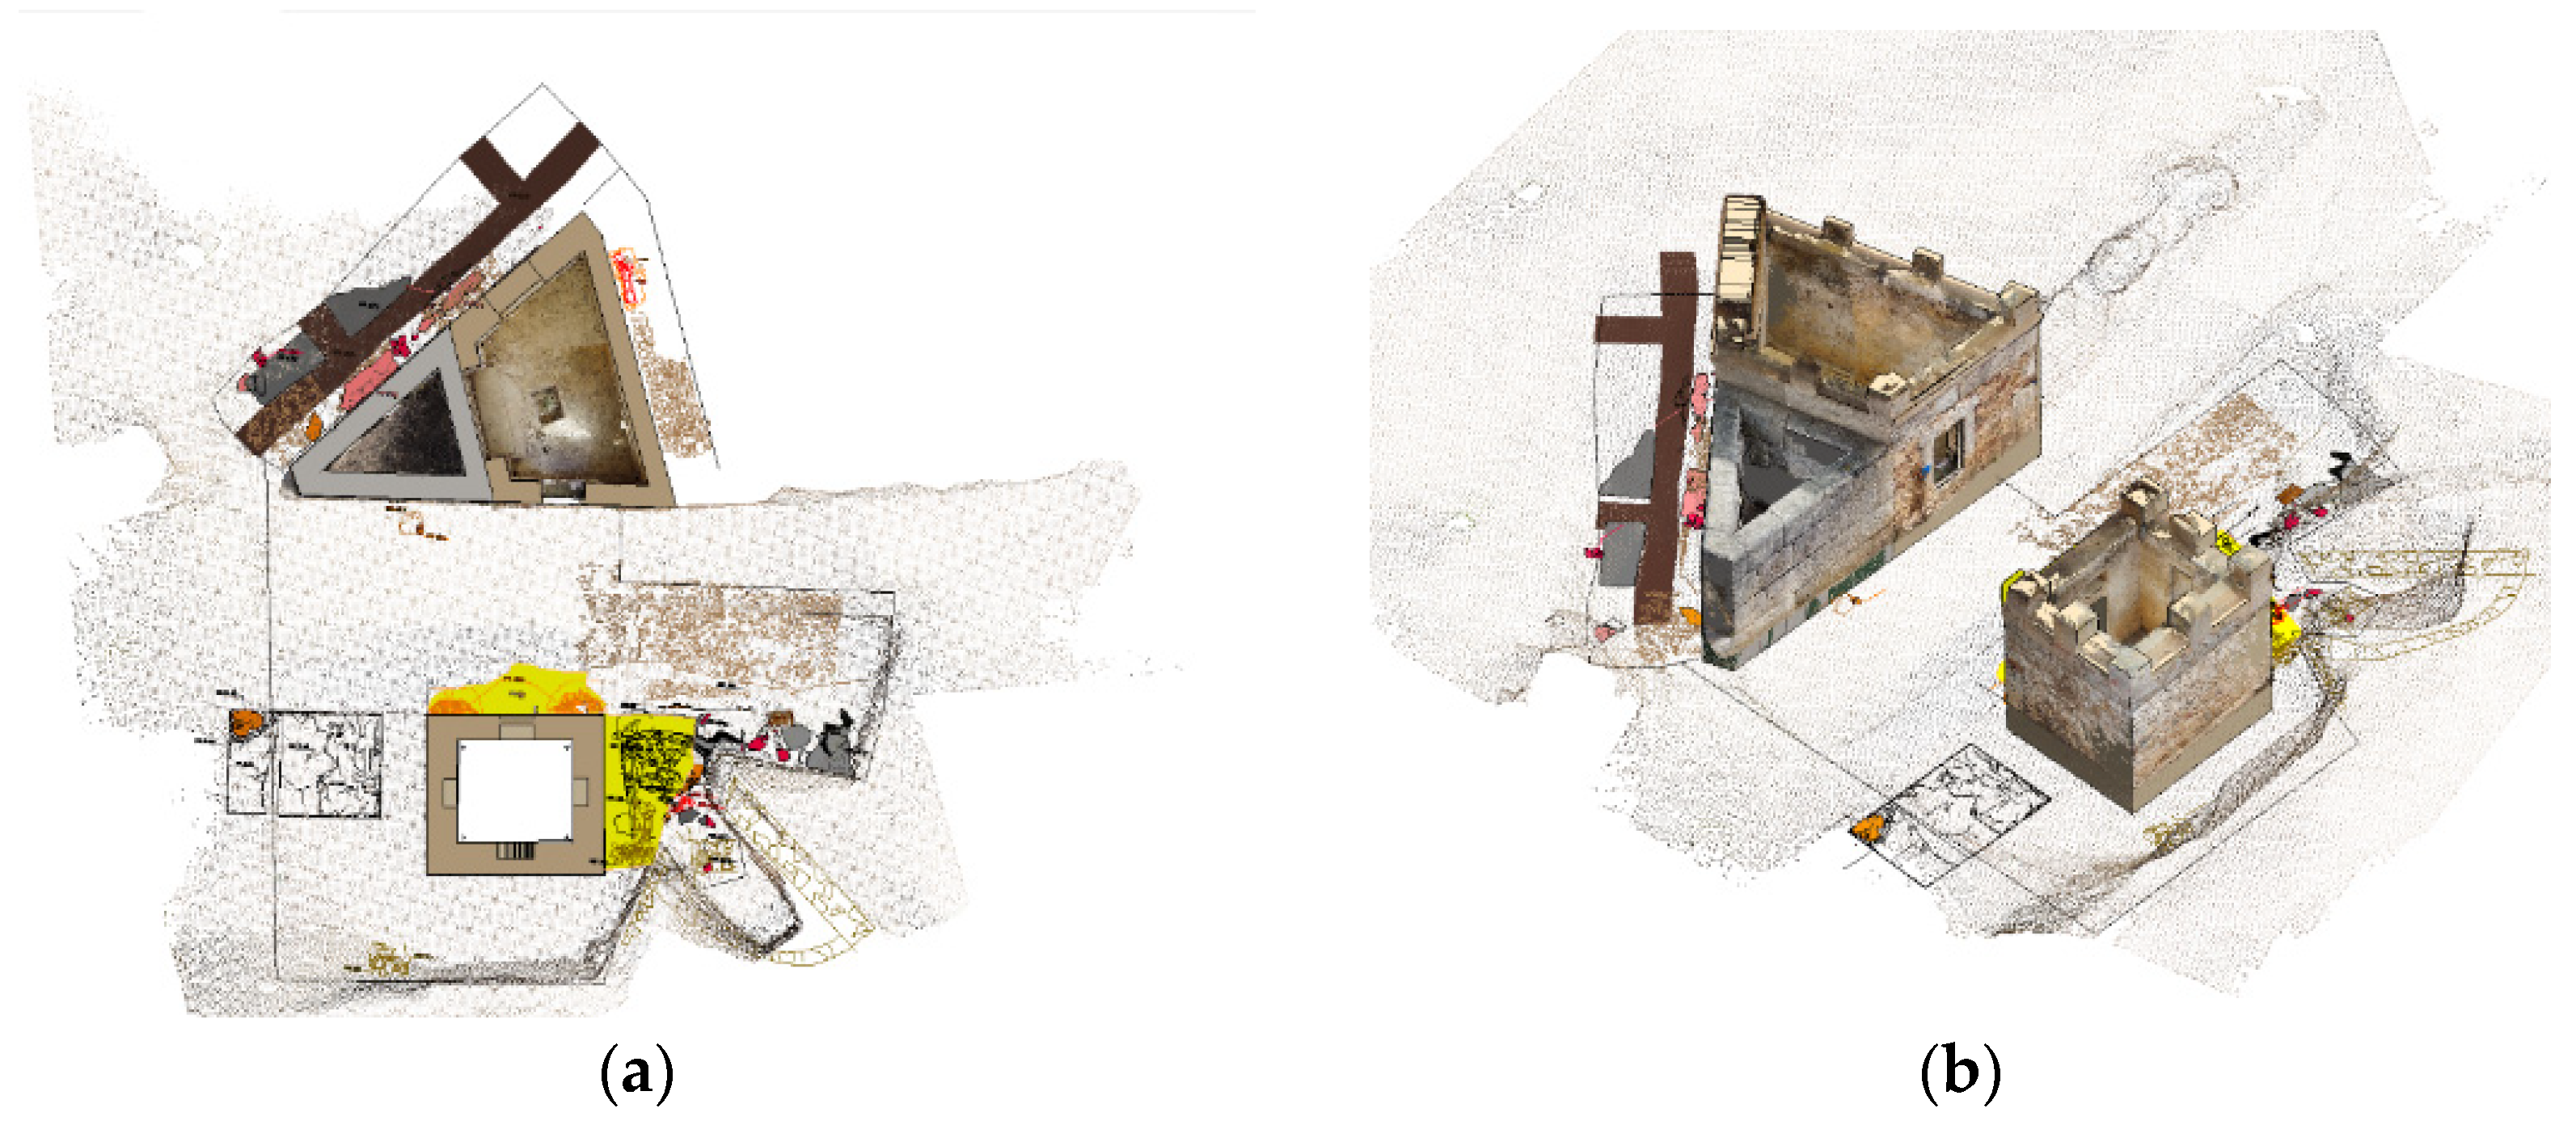
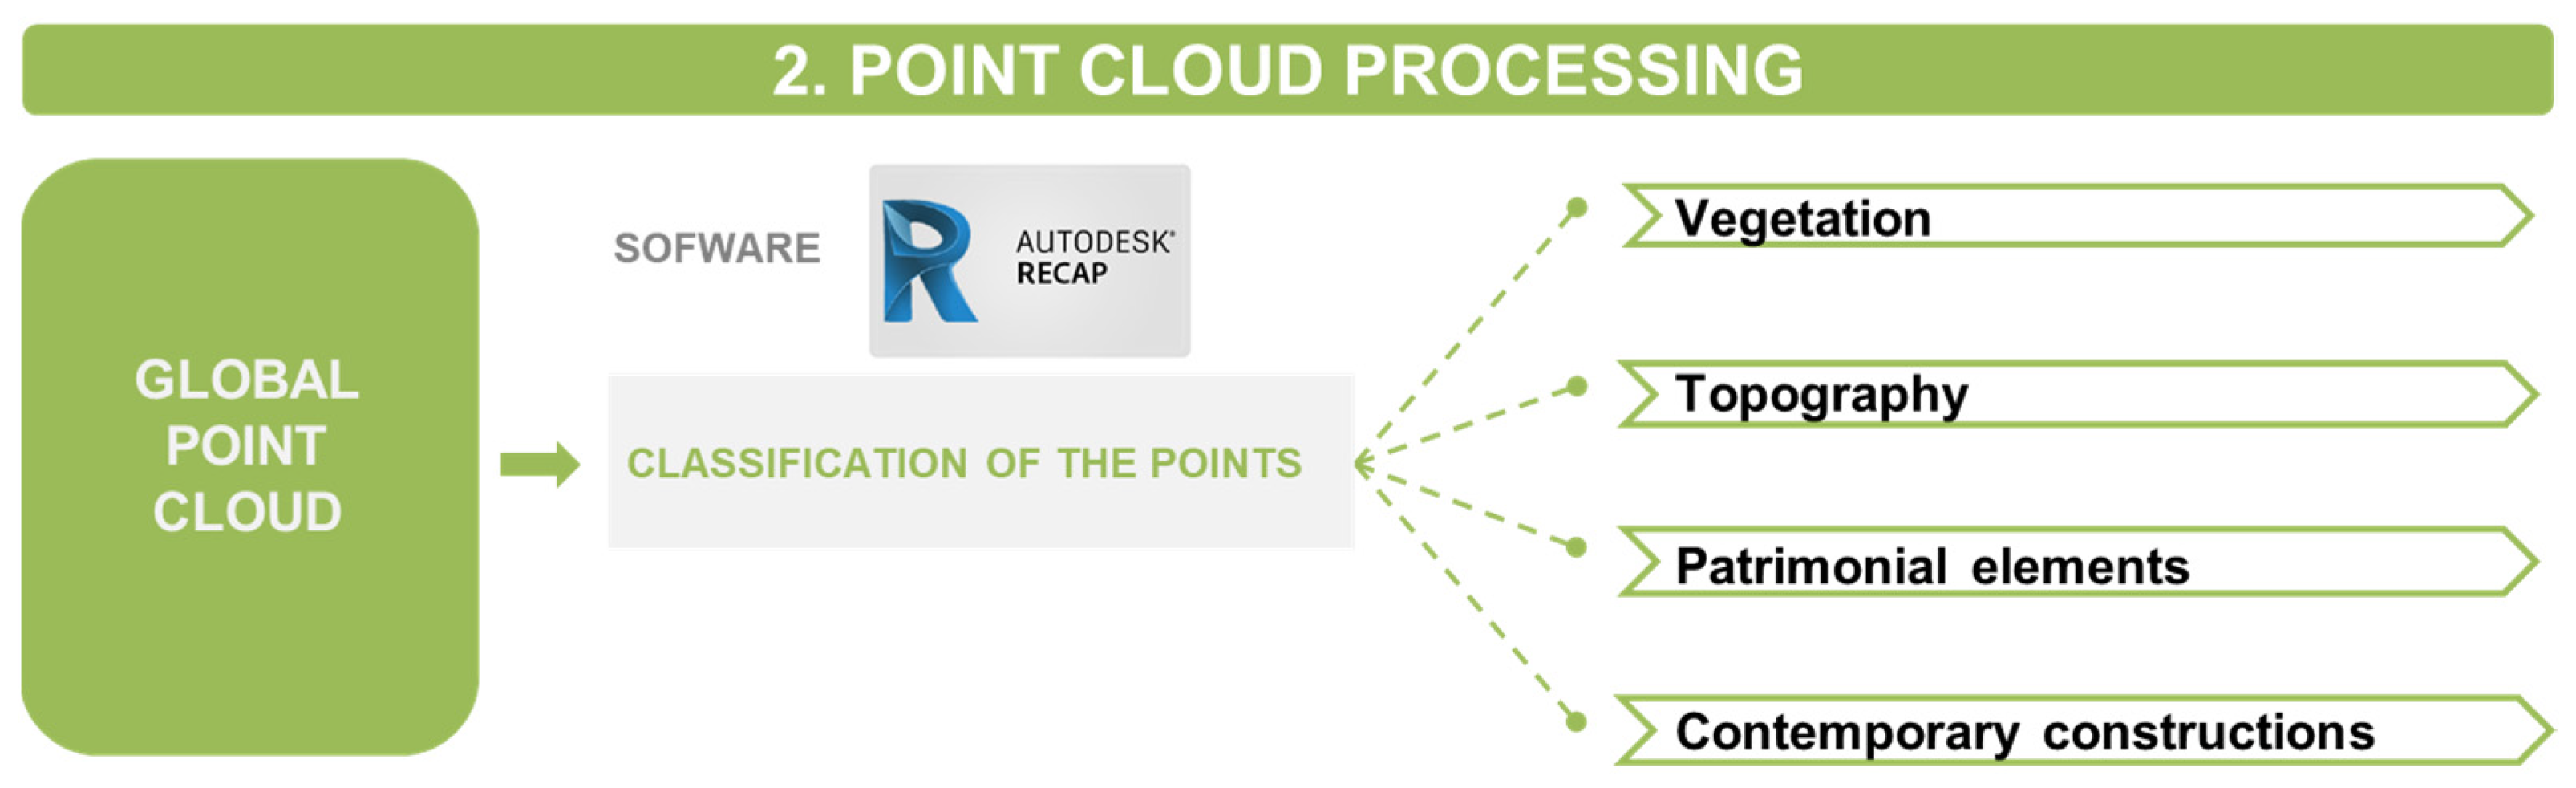
3.2.5. Point Cloud Processing
After generating the complete point cloud, we processed the cloud before importing it into Revit for modelling (
Figure 13).
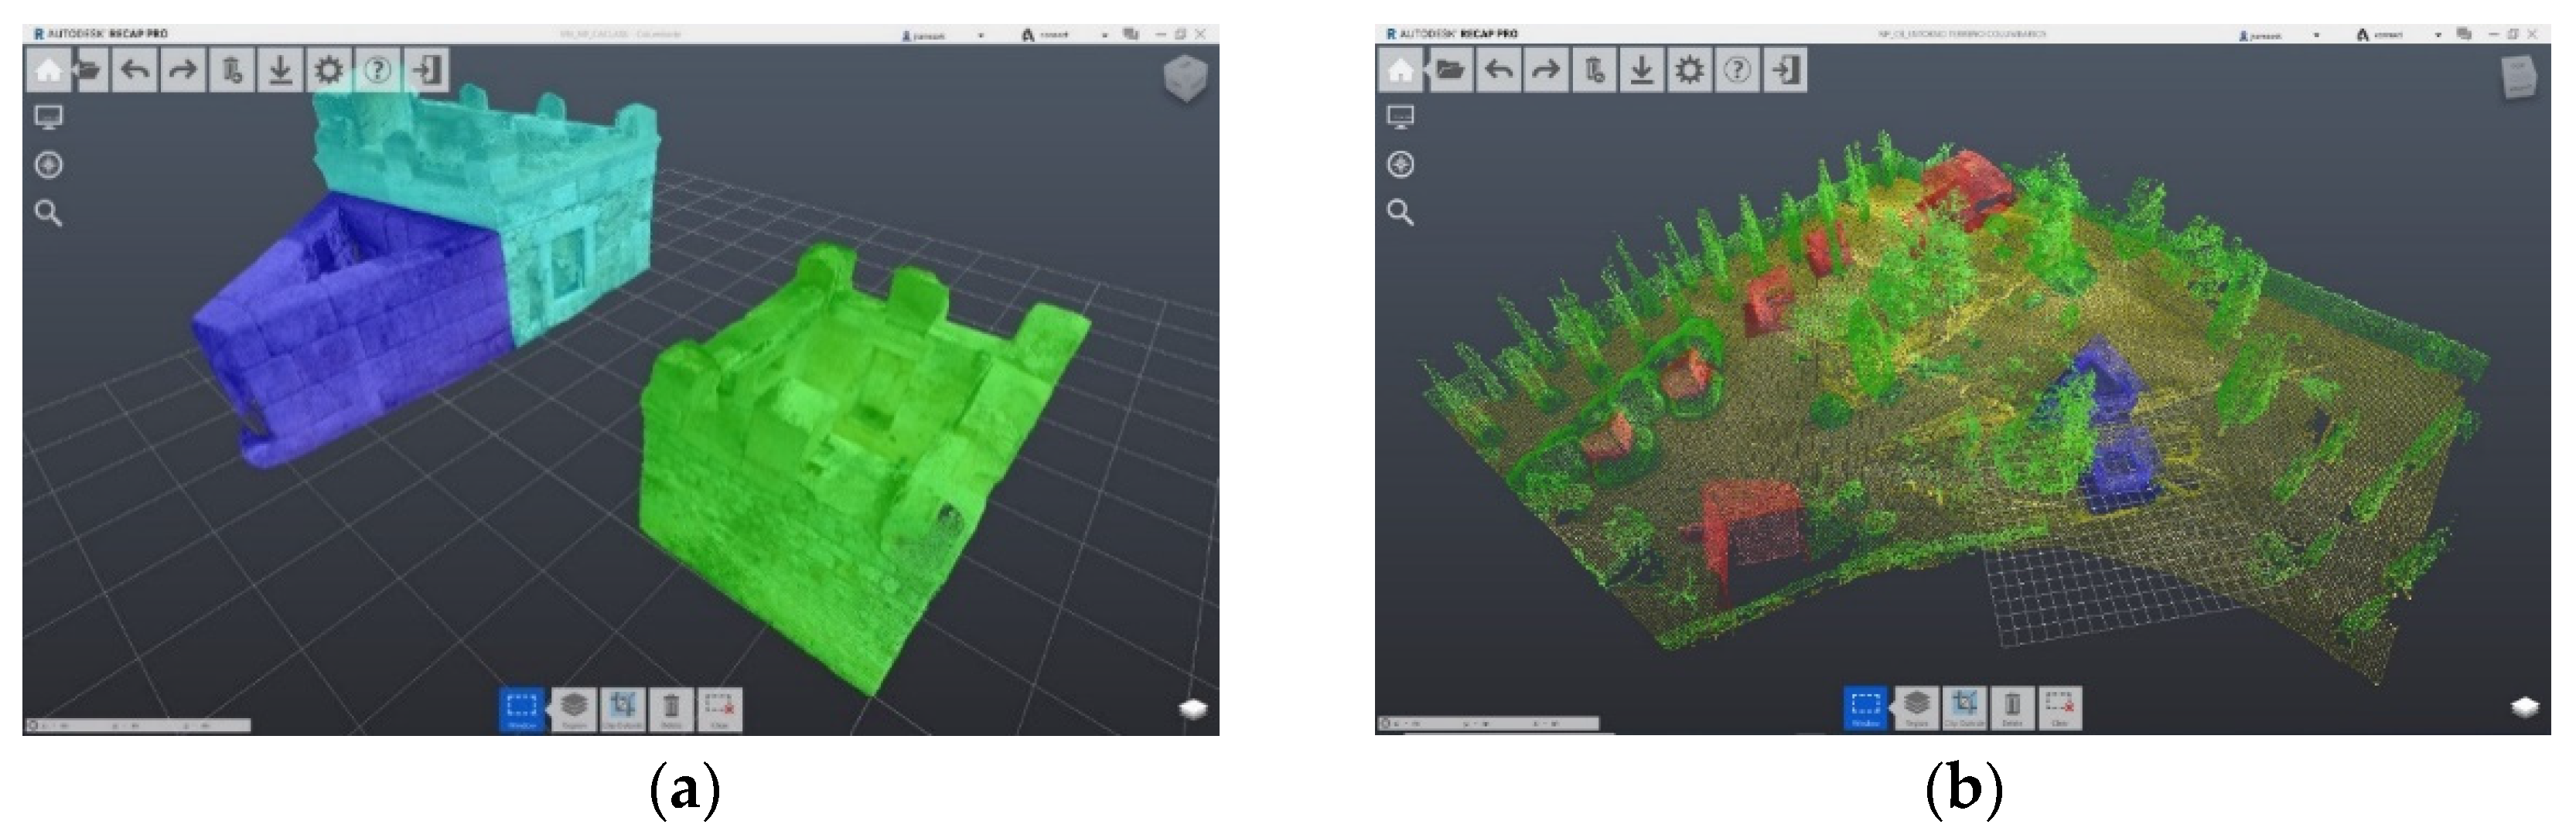
We used Autodesk ReCap Pro software, with which we were able to classify the point cloud; later, in Revit, we were able to control the visibility of each of the generated layers (
Figure 14).
A useful classification for heritage projects is as follows:
- -
Vegetation: In this layer, we introduce all points that belong to trees and shrubs to be able to visualise the heritage asset without any kind of interference that may affect it
- -
Topography: In this layer, we introduce the points that belong to the terrain itself, which, in addition, allows us to export it independently and thus be able to generate the topography in the modelling phase.
- -
Heritage element: It is important to clearly define the original element from the rest, thus allowing us to visualise it in greater detail.
- -
Contemporary constructions: With this classification, we manage to separate the original elements of the building from those that are not. In a case where a survey is made of a building that has undergone transformations throughout history, a classification of all the elements by construction stage could be made, and in this way, a key to the facades, for example, could be made.
This classification allows us to visualise in Revit only the elements we are interested in and separate the point cloud in different Recap files in case we are interested in having the point cloud of a specific element.
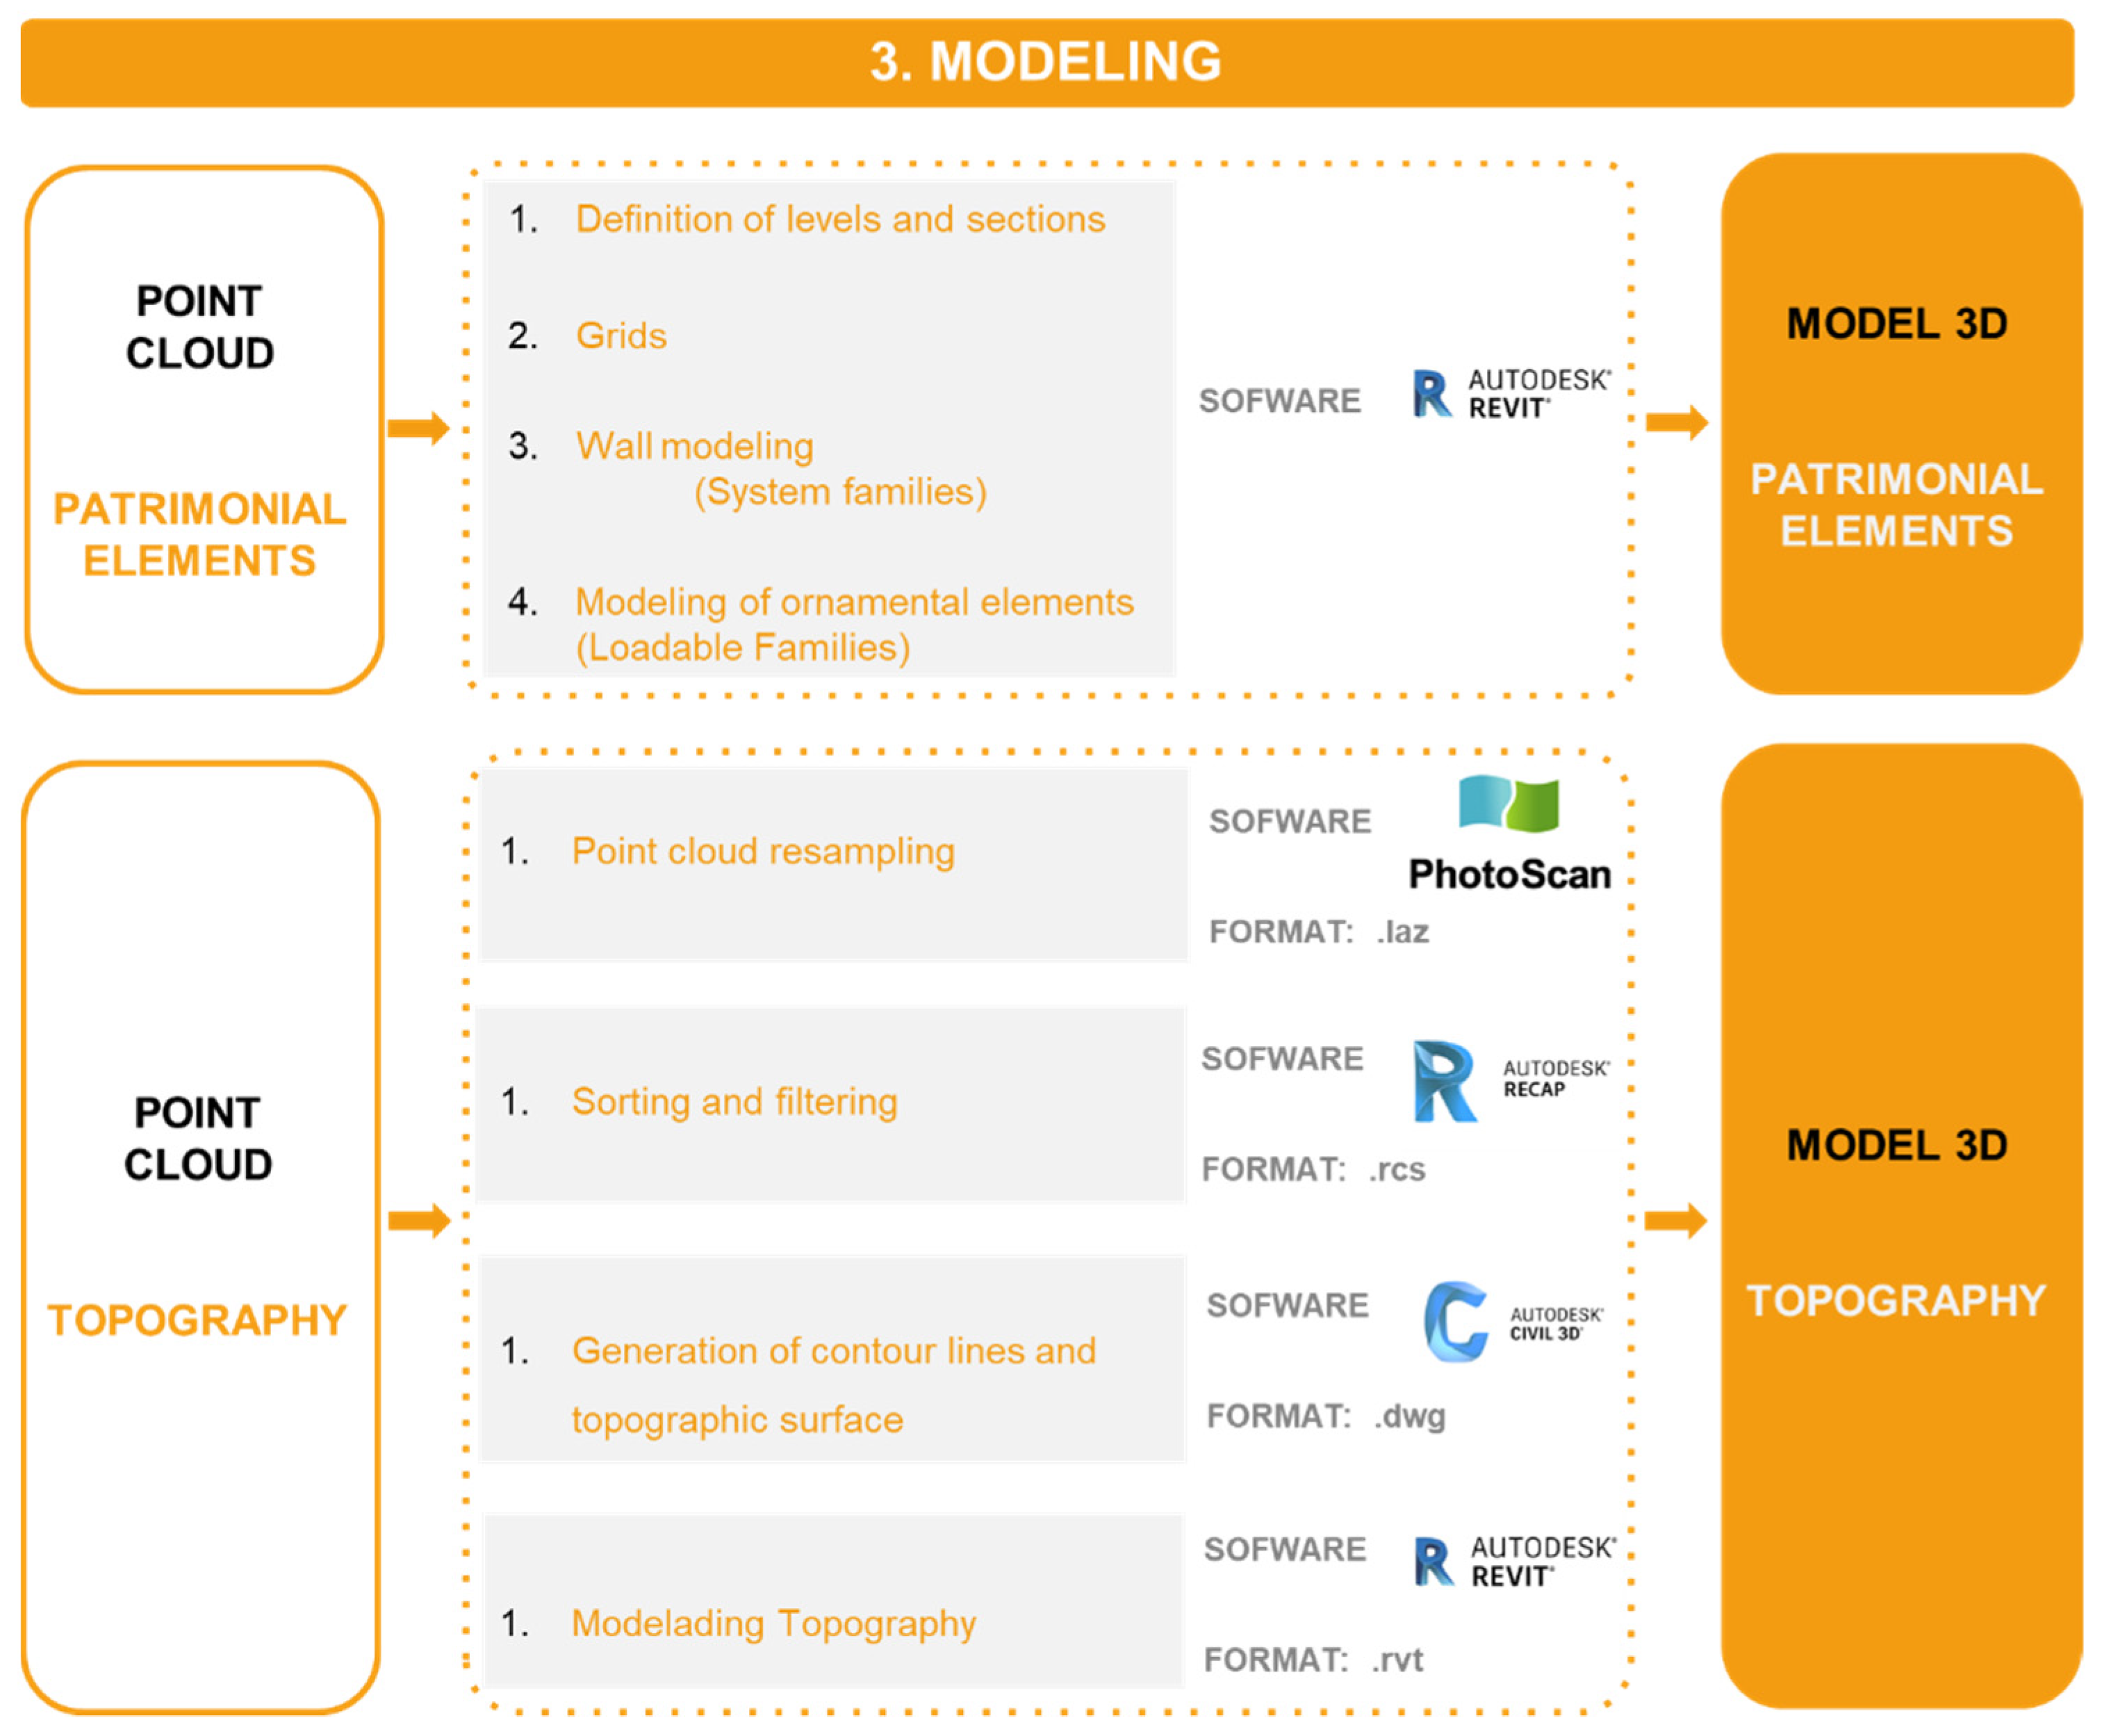
3.2.6. Modelling
Today, technological breakthroughs in photogrammetry and laser scanning have accelerated geometric data collection methods [
48,
49]. In addition, technological developments have also been described as influencing the processing tools for scanned data [
50], as this step is becoming increasingly automated. However, although many 3D modelling technologies have been developed recently, the process of 3D modelling using photogrammetry data is still a manual and time-consuming process. Therefore, a change in workflows and procedures is required to speed up 3D geometric modelling [
51,
52].
It is true that despite the great efficiency of the BIM method, as well as the modelling of newly constructed buildings, in the field of heritage this process is not optimised, having certain limitations when modelling the irregular and heterogeneous surfaces that are generally present in heritage buildings and that give them a unique character. Therefore, due to the lack of automatization to generate the surfaces generated by a point cloud in parametric objects, the process can be considered slow and complex.
In this work, we surveyed the model with REVIT software and generated a model that integrates the design, documentation, and digital management of the building. This generated model is a dynamic one into which all the information that is generated in the future could be implemented over time.
It must be taken into account that this modelling is an approximation of the real element, as the irregularities of the wall are not reflected, so we will keep the point cloud associated with the model.
In the following, we describe the methodology followed for the generation of the model, making this process as operative and efficient as possible, so as to serve as an example for future work (
Figure 15).
Heritage building modelling
Once the definitive point cloud was obtained after the generation and processing described above, in this phase of the work we used it as a guide for the parametric modelling of the heritage buildings.
For modelling in Revit, we used two types of families: systems and loadable. The system families are used for the modelling of simple geometries, and the loadable families for the modelling of exclusive and specific elements, such as the ornamental elements in this case.
Once the point cloud was loaded in high quality with the Recap points classification, we started with the modelling of these elements, following the next steps:
Definition of levels and sections on the point cloud: We made cuts in both the plan and the section to show precisely the geometric profile of the elements.
Grids: A system of grids was placed on the ground plan to help us model.
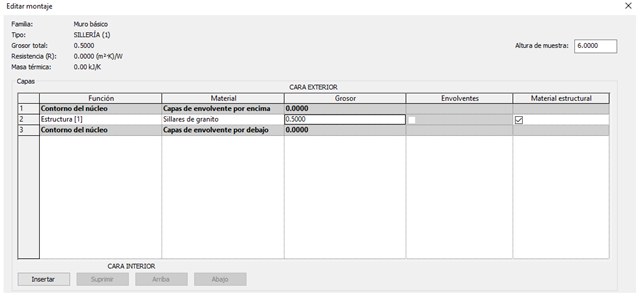
Modelling walls with Revit using the As-Built add-on: In heritage, it is common to have very different construction elements in the same building; therefore, we used a complementary Revit application called As-Built, which allowed us to automatically choose the type of wall within the Basic Wall family.
With As-Built, we can create walls quickly and accurately directly in the point cloud. The software automatically selects the most appropriate wall type according to the given wall thickness. If an appropriate wall type cannot be found, As-Built automatically creates a new, adapted wall type. It also allows us to automatically align walls to create rectangular planes (orthogonality) and continuous axial alignments, even over several floors. Tolerances to be observed must be defined and can be reviewed in detail later for each wall component (
Figure 16).
Modelling of ornamental elements
In this type of construction, it is very common to find cornices and mouldings as singular ornamental elements.
These elements must be modelled externally by creating loadable families.
The resulting elements are placed within an HBIM library that could be reused (after editing their default parameters) in future projects with a similar architecture or element.
We identify the types of cornices we have in our buildings, and with each of them we create a family that we will later load into our 3D model (
Table 7).
We create a specific folder with all the family files generated.
When modelling the cornices in 3D, we must first edit the wall. To do this, in the section called “modify wall attributes”, we load the cornice profiles that correspond to this type of wall.
Subsequently, using the sweep wall tool, we place it on the wall we have.
With the point cloud included in the 3D model, we can obtain details of the decorative elements with great precision. Unlike traditional systems in which a calliper is used for contours, we can obtain data without having to move to the site and can even obtain details of elements placed at great heights, whereas with a traditional system it would be necessary to use auxiliary means to be able to reach them.
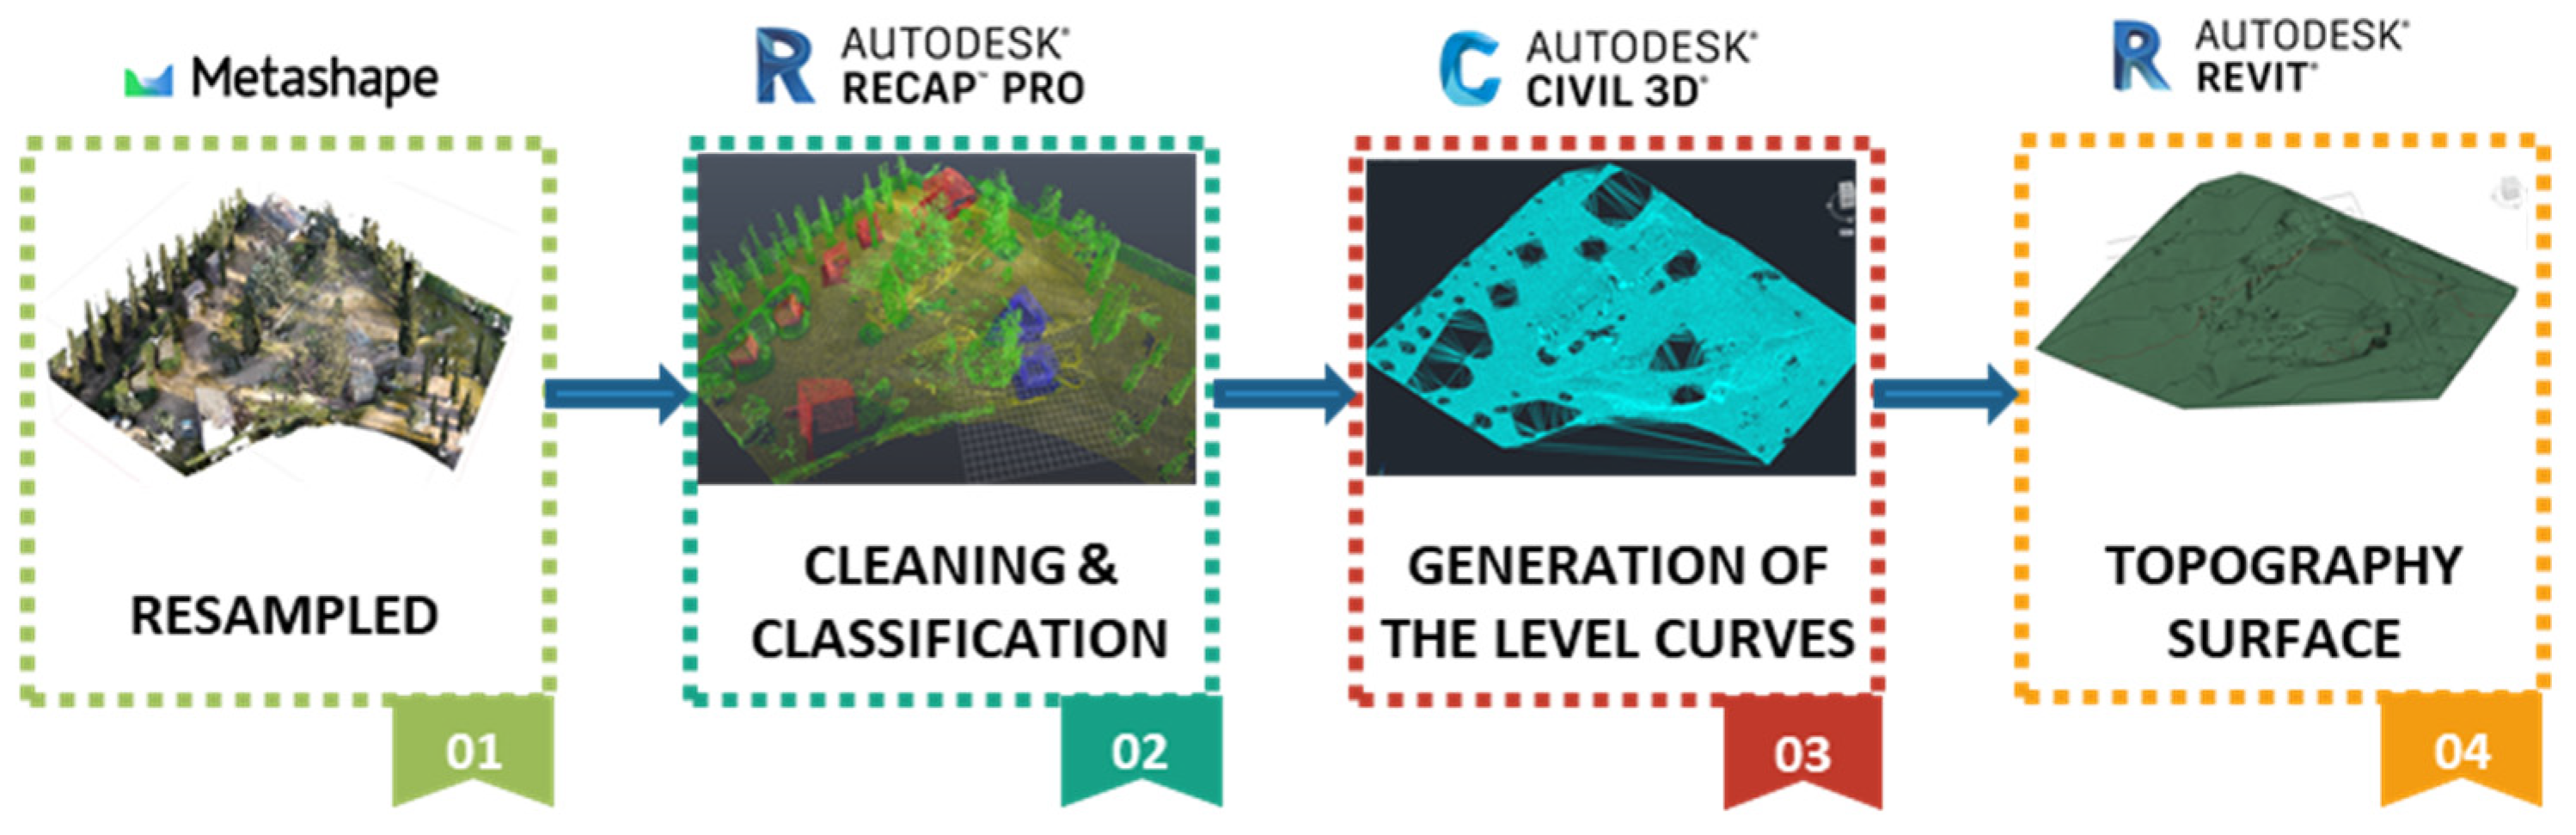
Topography modelling
For the modelling of the topography, the workflow shown in
Figure 17 was generated.
This was done automatically by importing the .dwg file generated from Civil 3D. In the tab Mass and Location, we used the command Topographical surface and selected the option create from import/select import copy. We selected the .dwg file that we prepared with Civil 3D.
In Revit we combined both the generated topography and the point cloud, in high quality, and made adjustments to the points where we wanted to increase the definition.
This process is the result of multiple tests with different detail parameters.
It is a fast and simple workflow. The most tedious part is the cleaning of the point cloud data (which varies greatly depending on the quality and nature of the site). However, the results are more than acceptable [
53].
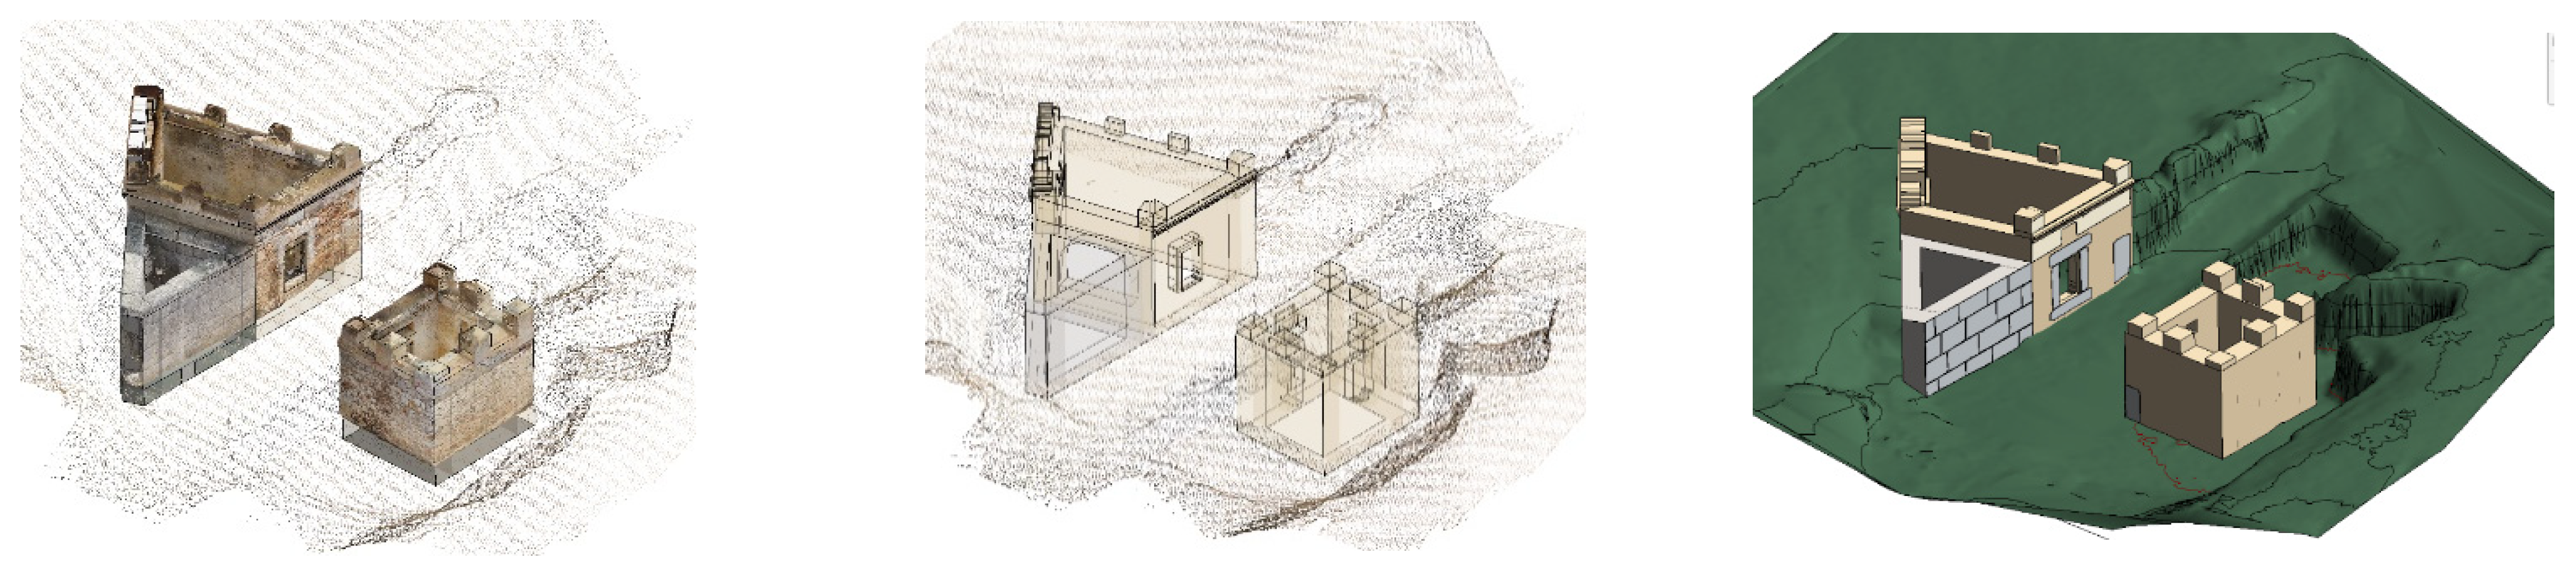
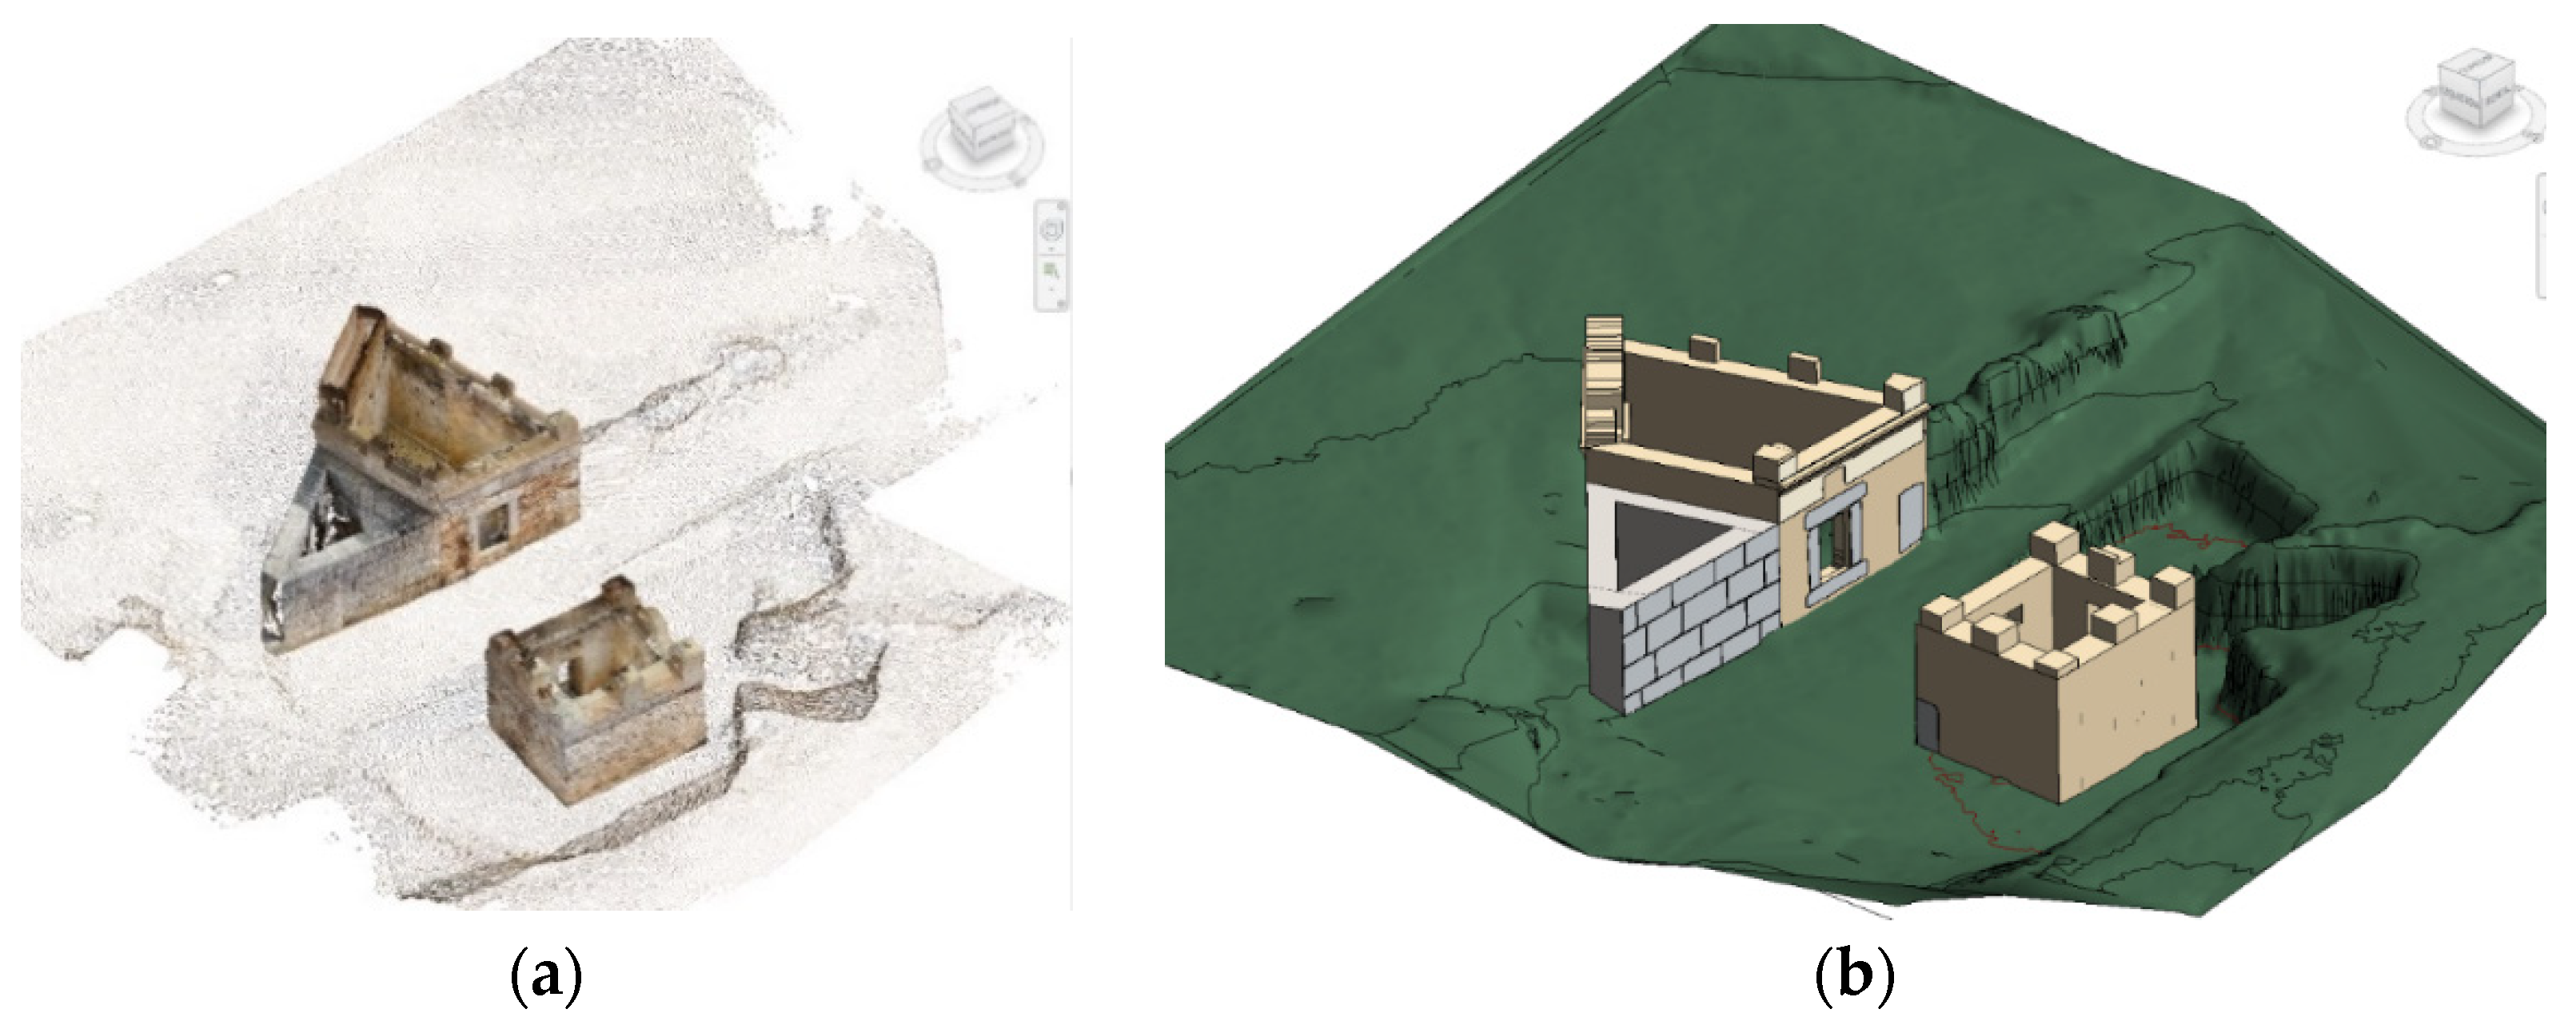
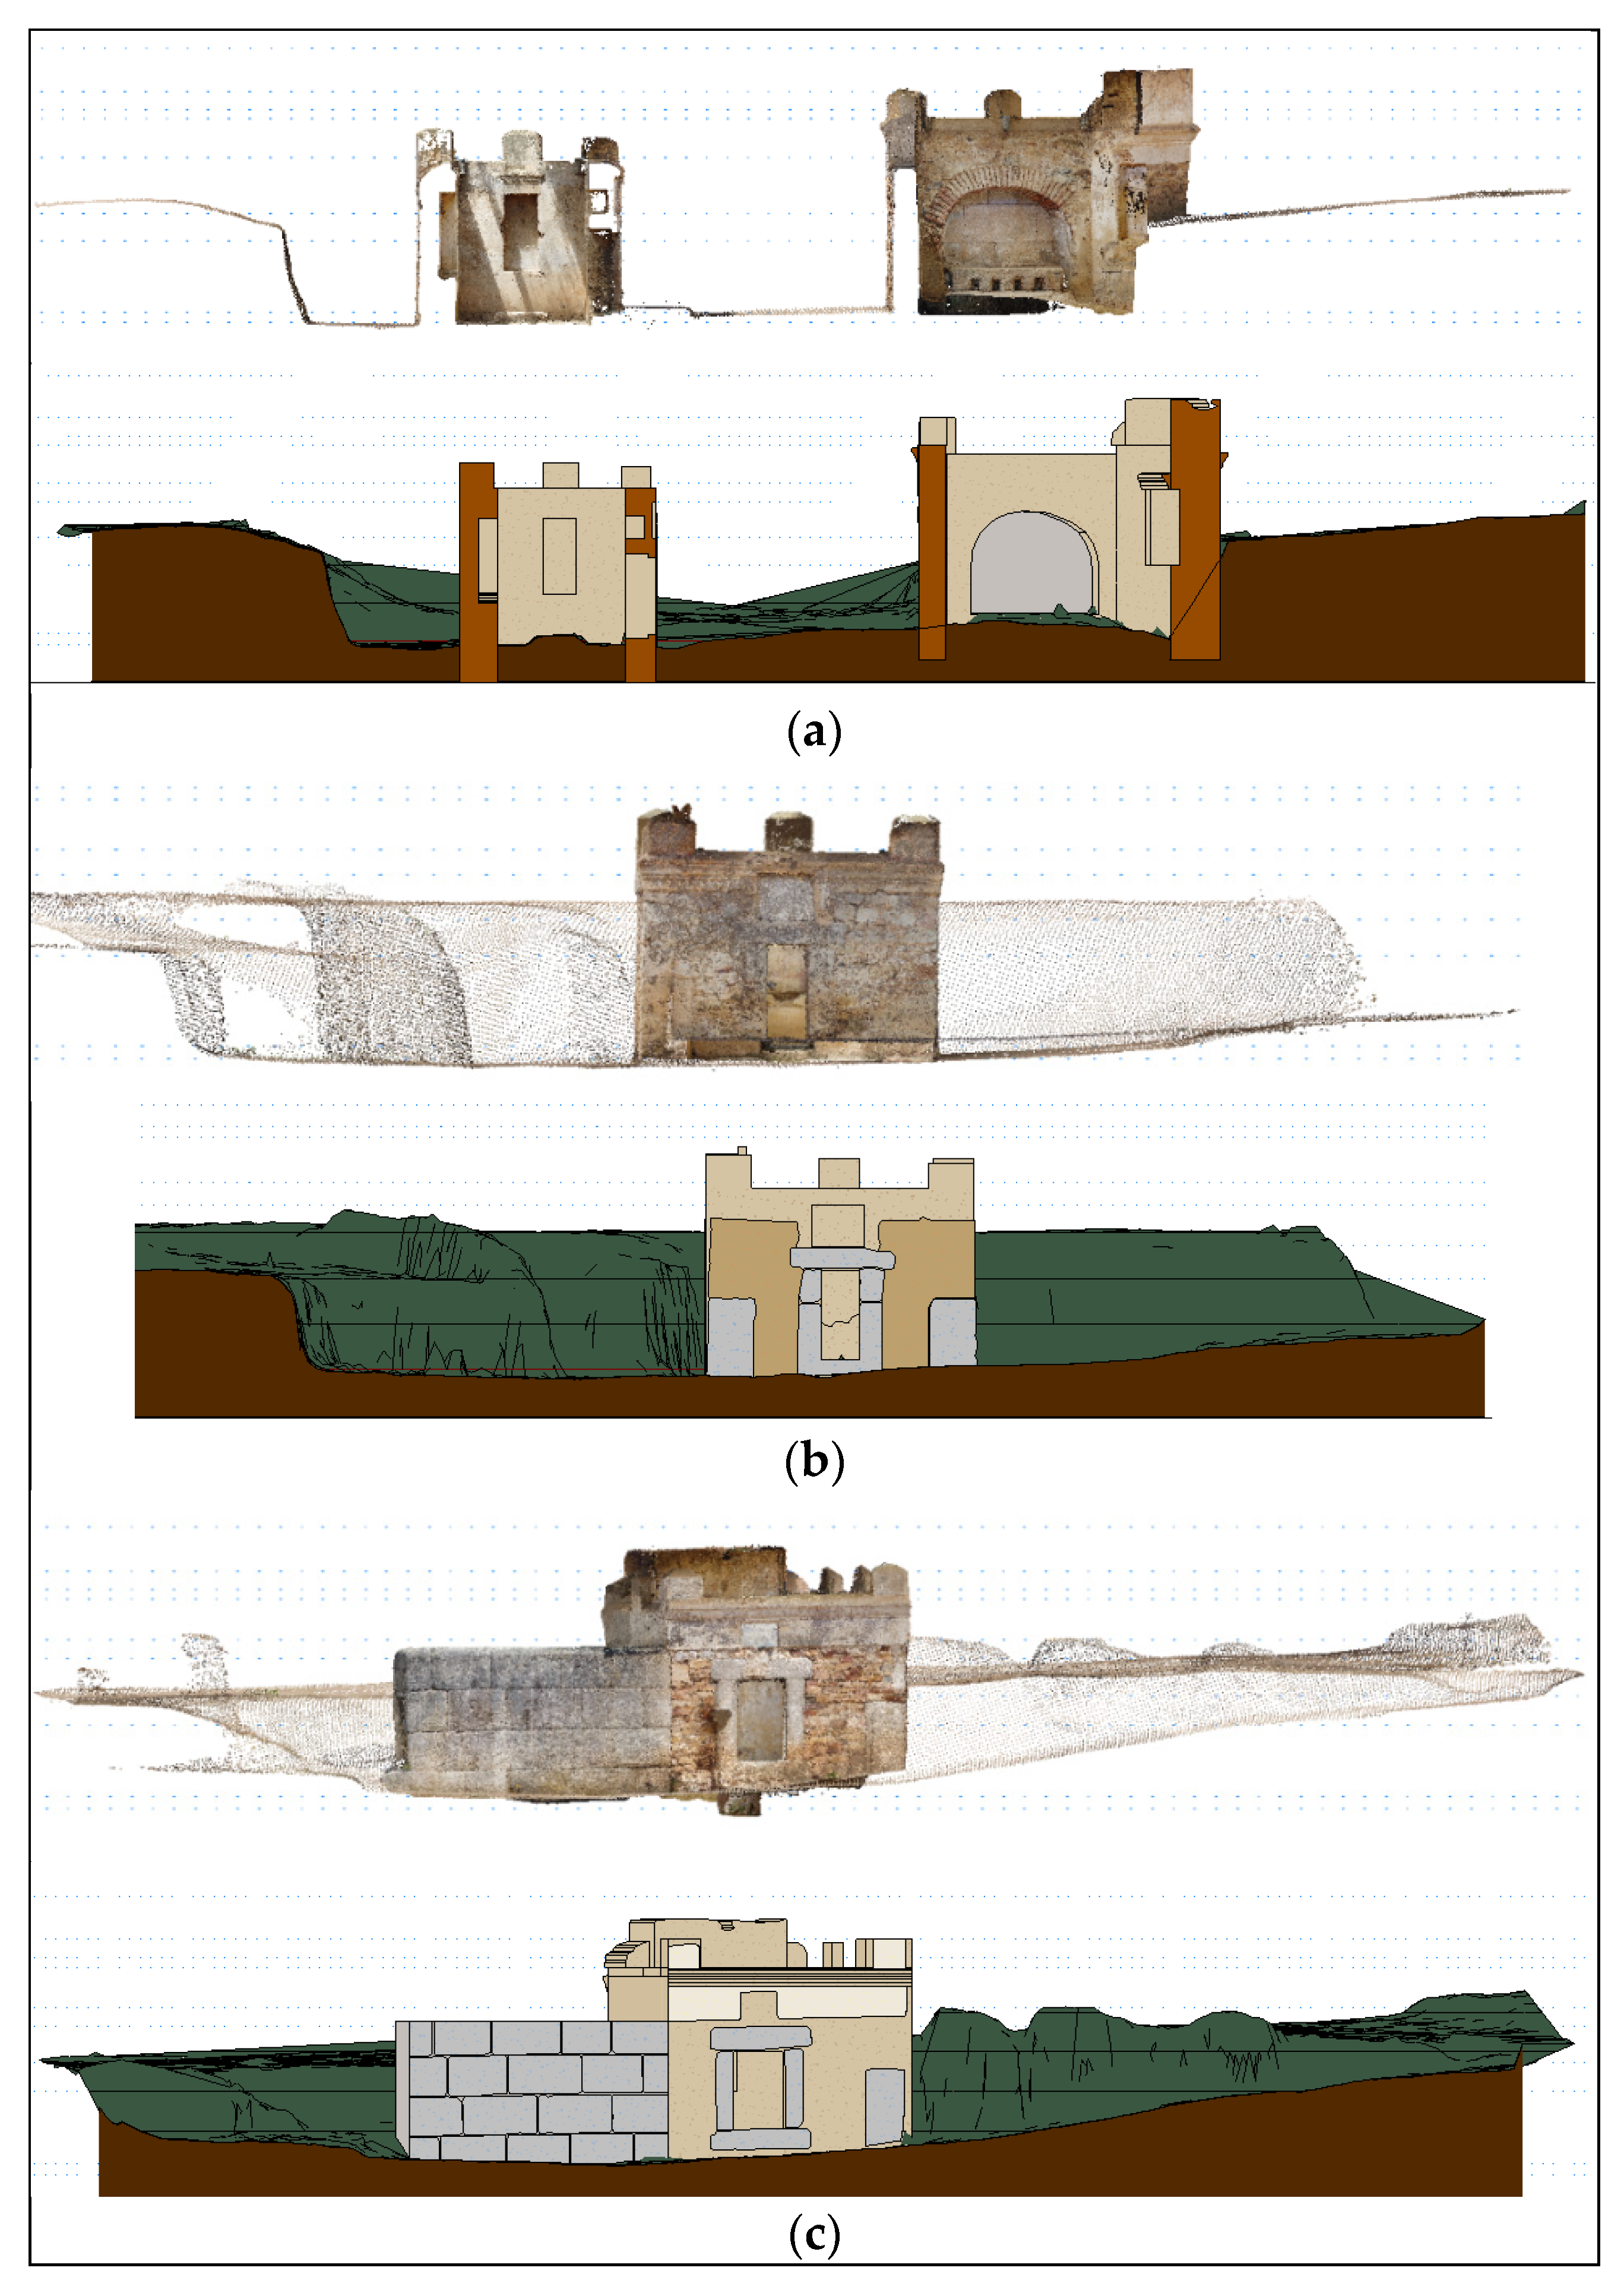
So far, we have made the parametric model, which contains all the geometrical information we obtained from the point cloud (
Figure 18). However, we have to bear in mind that this model is an approximation of the real element, since many of the imperfections or deviations are not fully defined in the model. We could consider the model as an ideal reconstruction of the property element. That is why we kept the point cloud superimposed on this model, so that we could have the most accurate information according to the type of work we need to carry out.
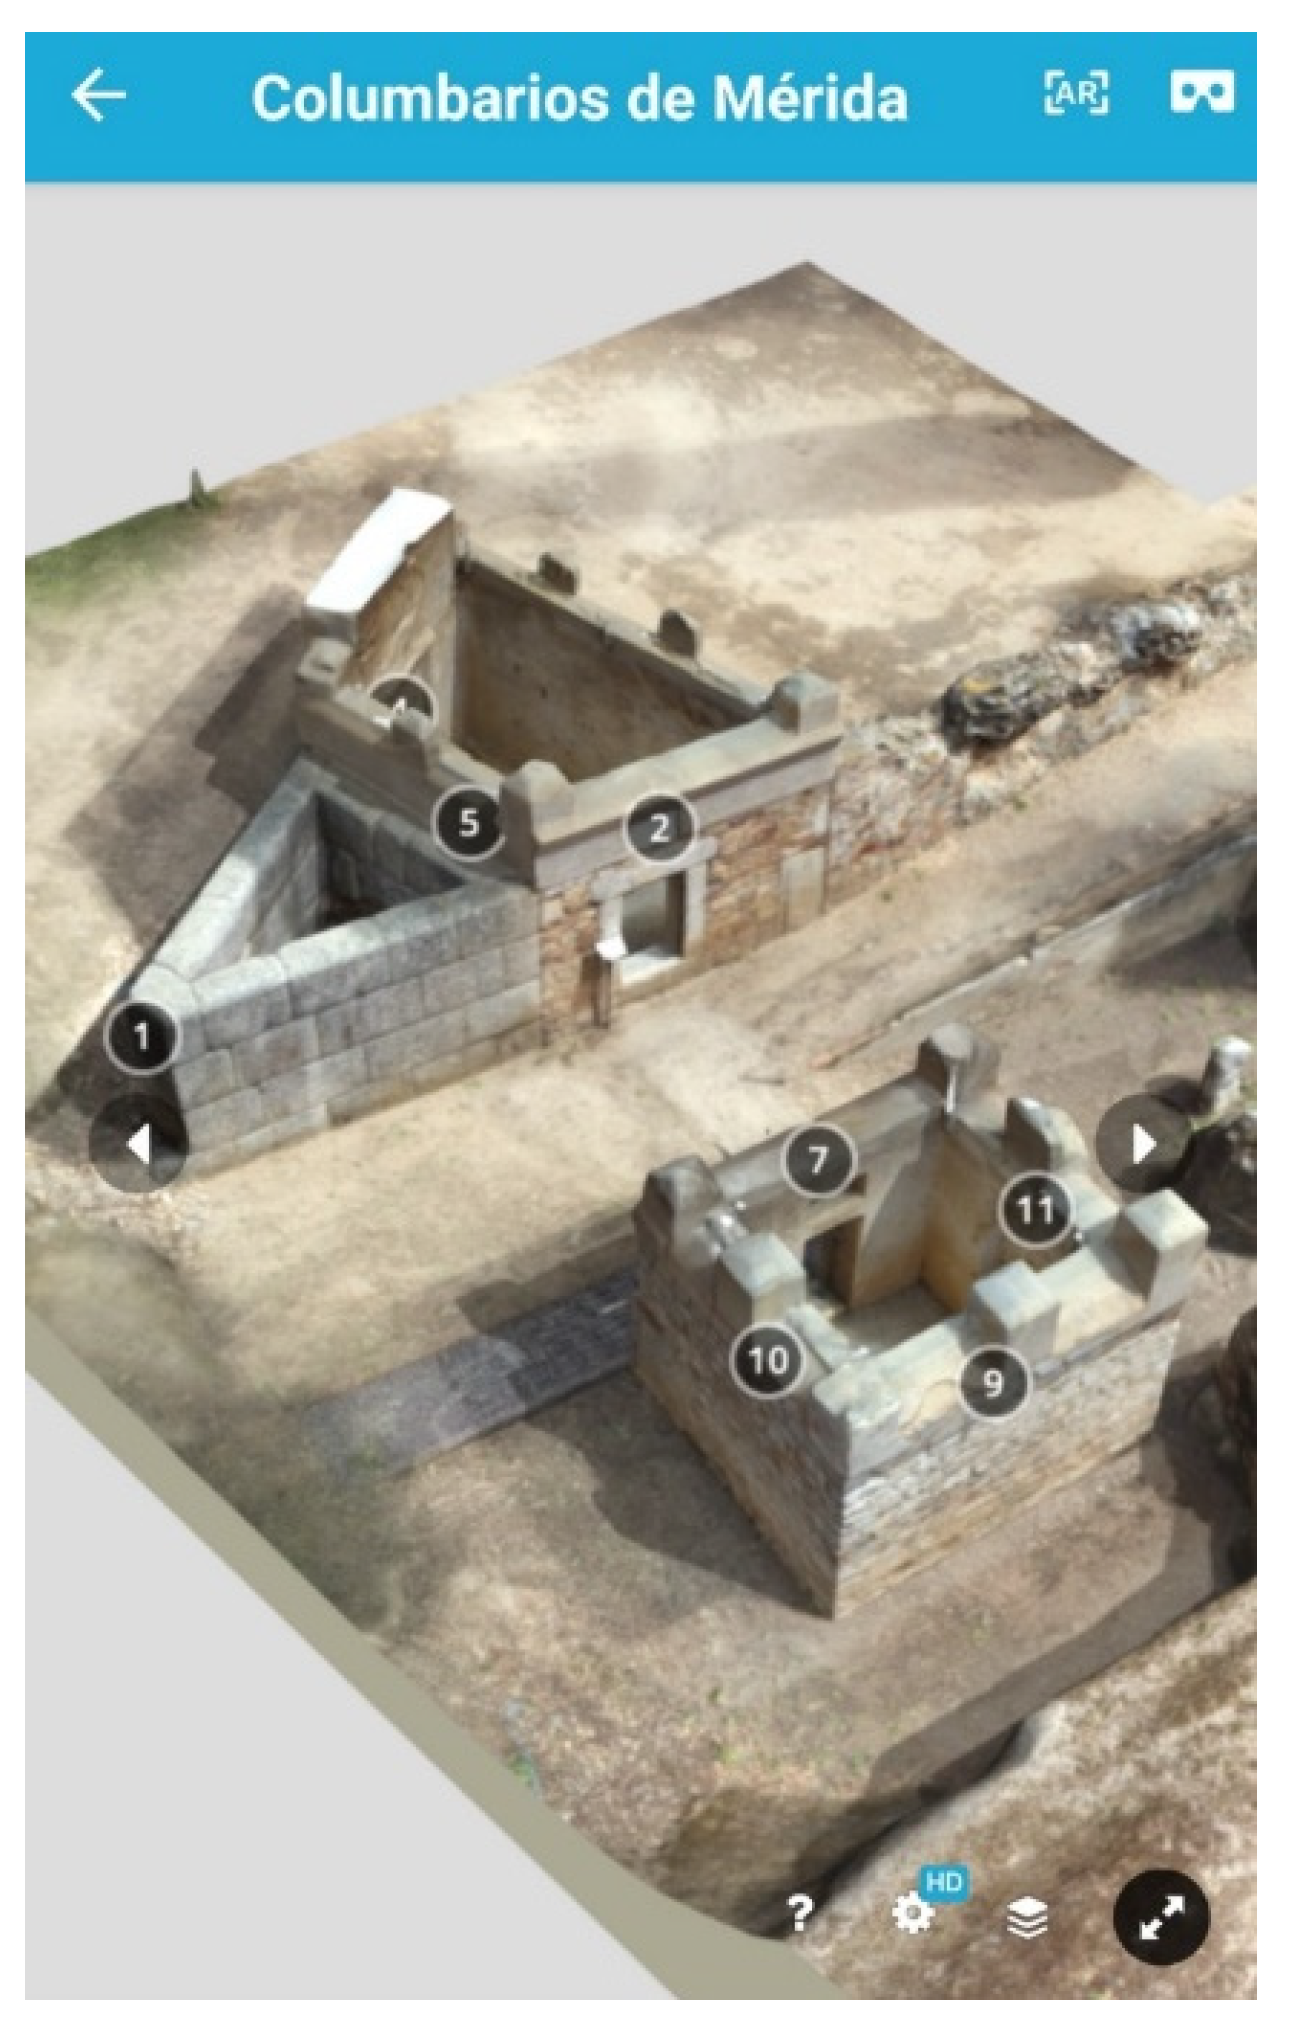
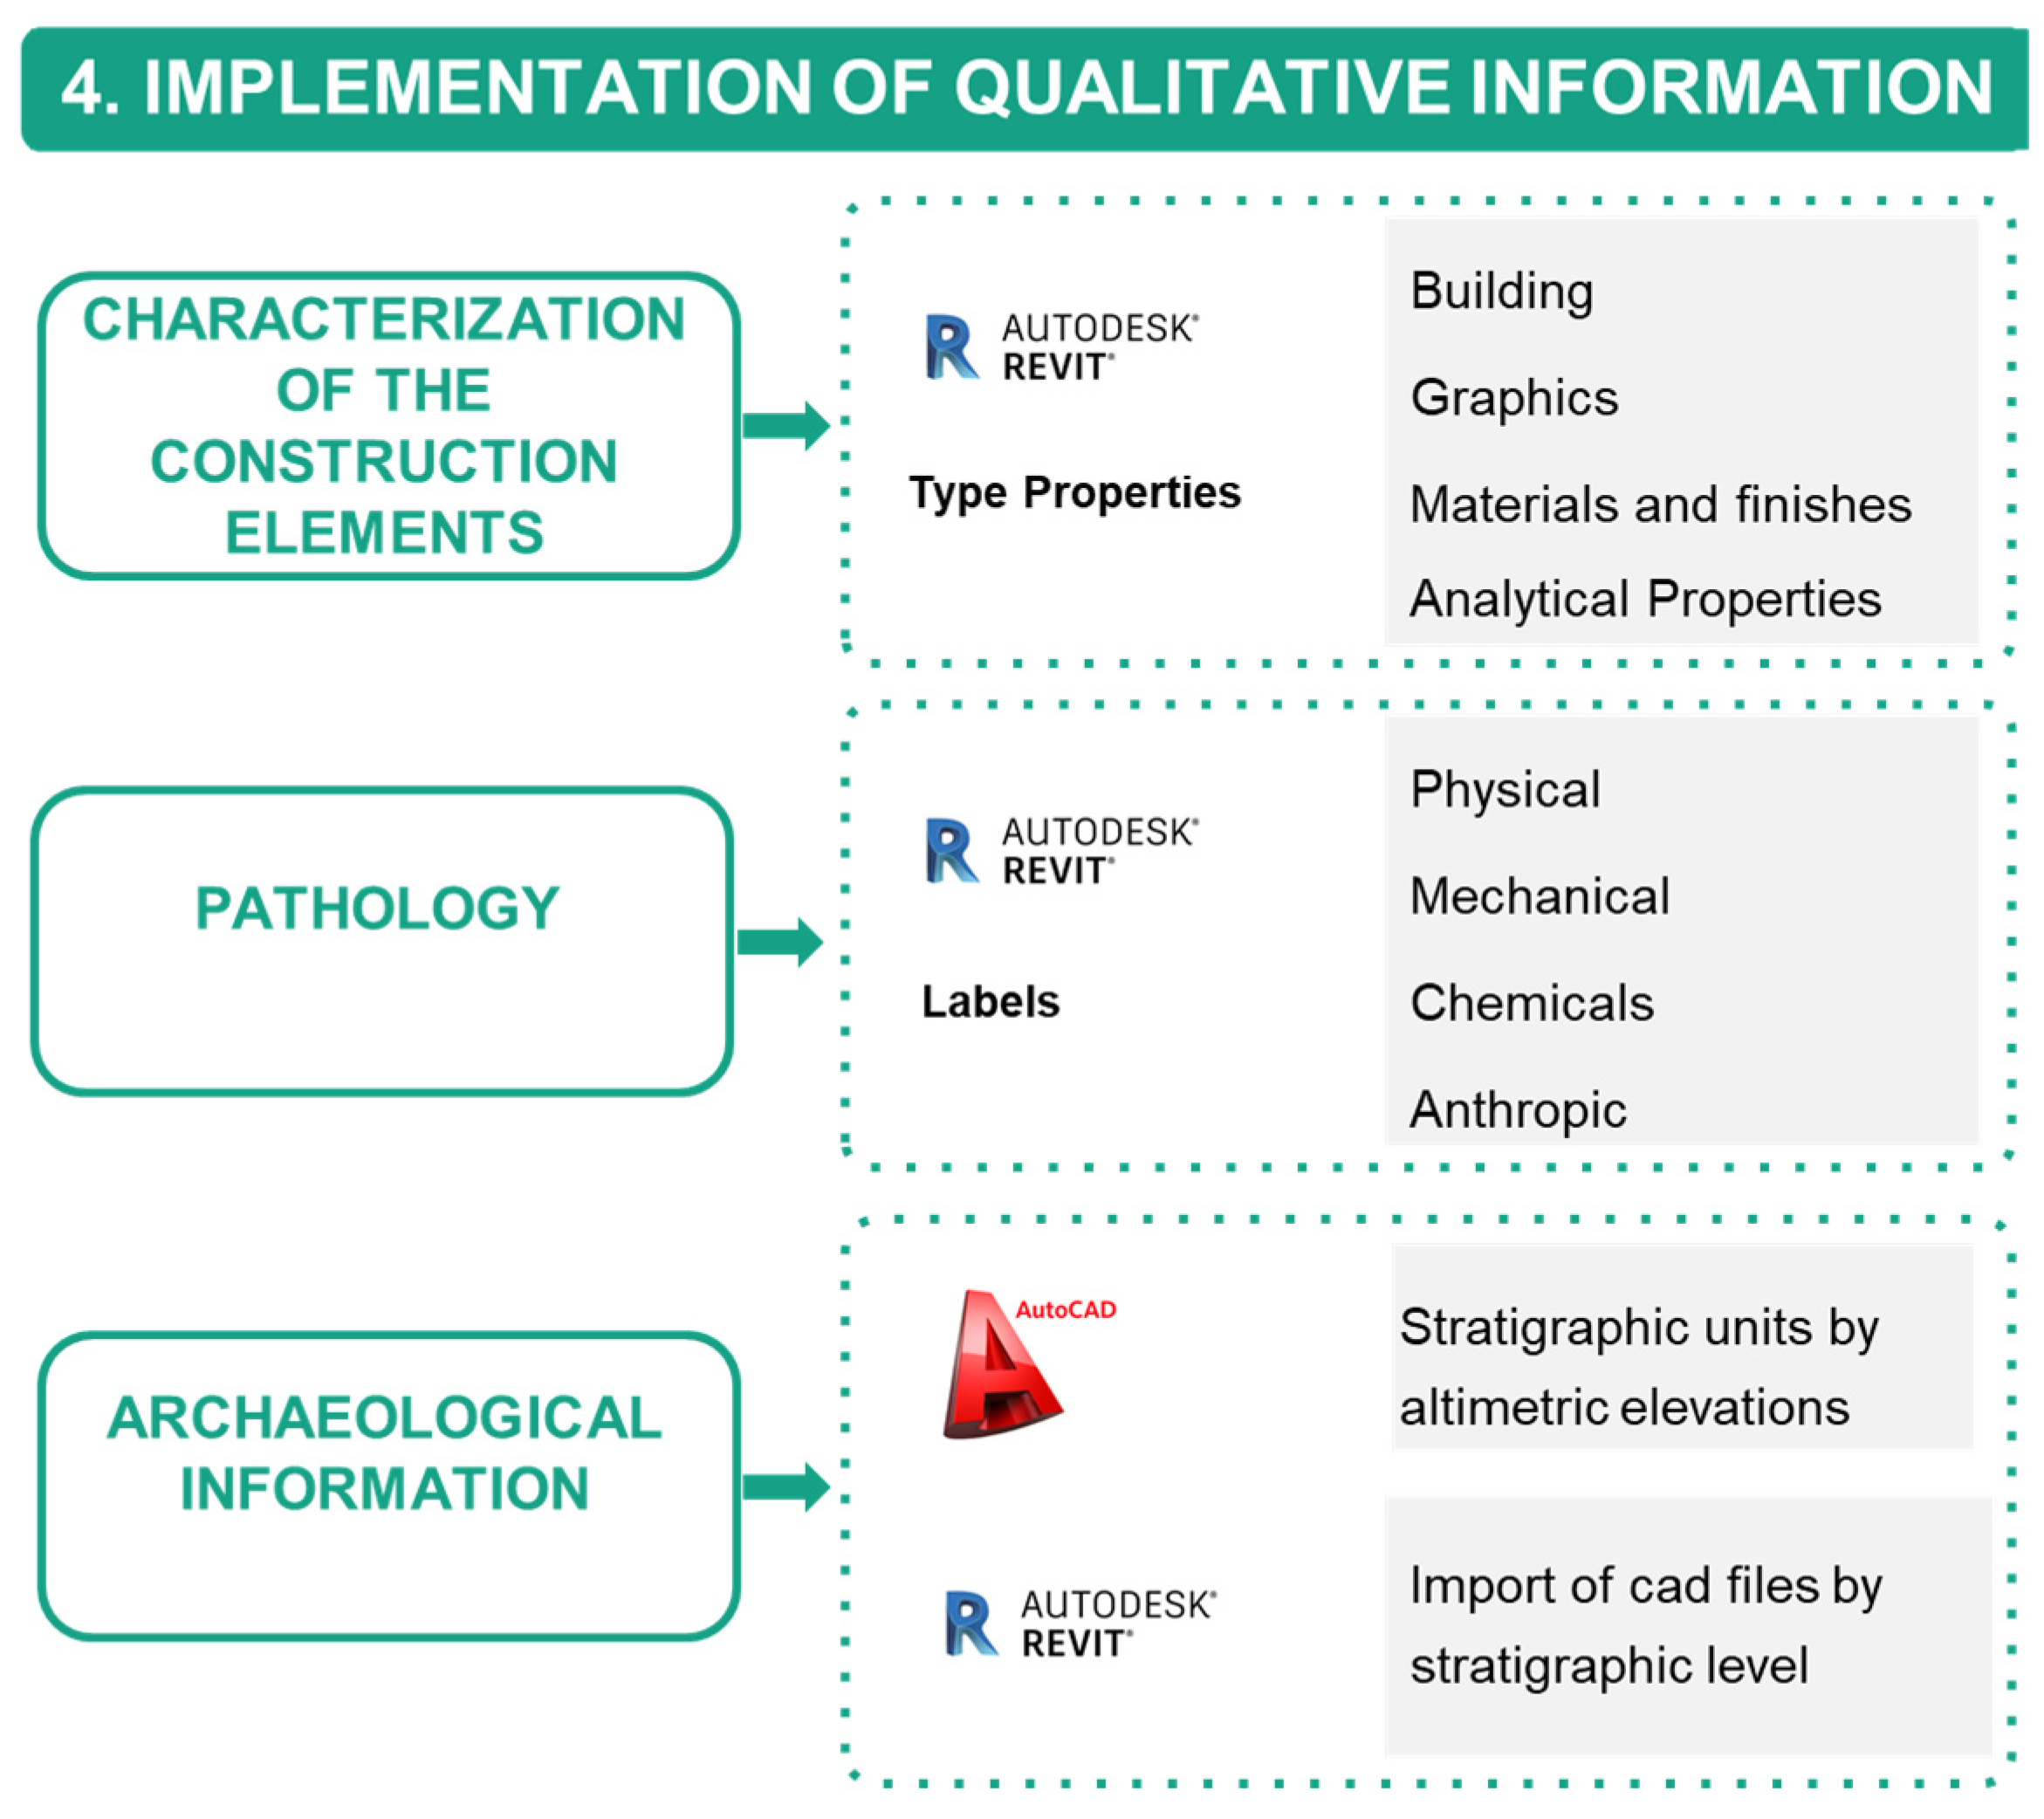
3.2.7. Inputting Qualitative Information into the Model
The 3D model contained all the geometric information with great precision that we obtained from the point cloud [
54]; however, the importance of the heritage elements lies above all in the large amount of intrinsic information that they possess; they can be considered a document in itself. This is why it is essential to implement this semantic information in the model (
Figure 19).
In this phase of generating the BIM model, it is necessary to have a multidisciplinary team of architects, archaeologists, historians, and restorers, among others, in which each one brings to the model the knowledge of his or her field.
Characterisation of modelled building elements
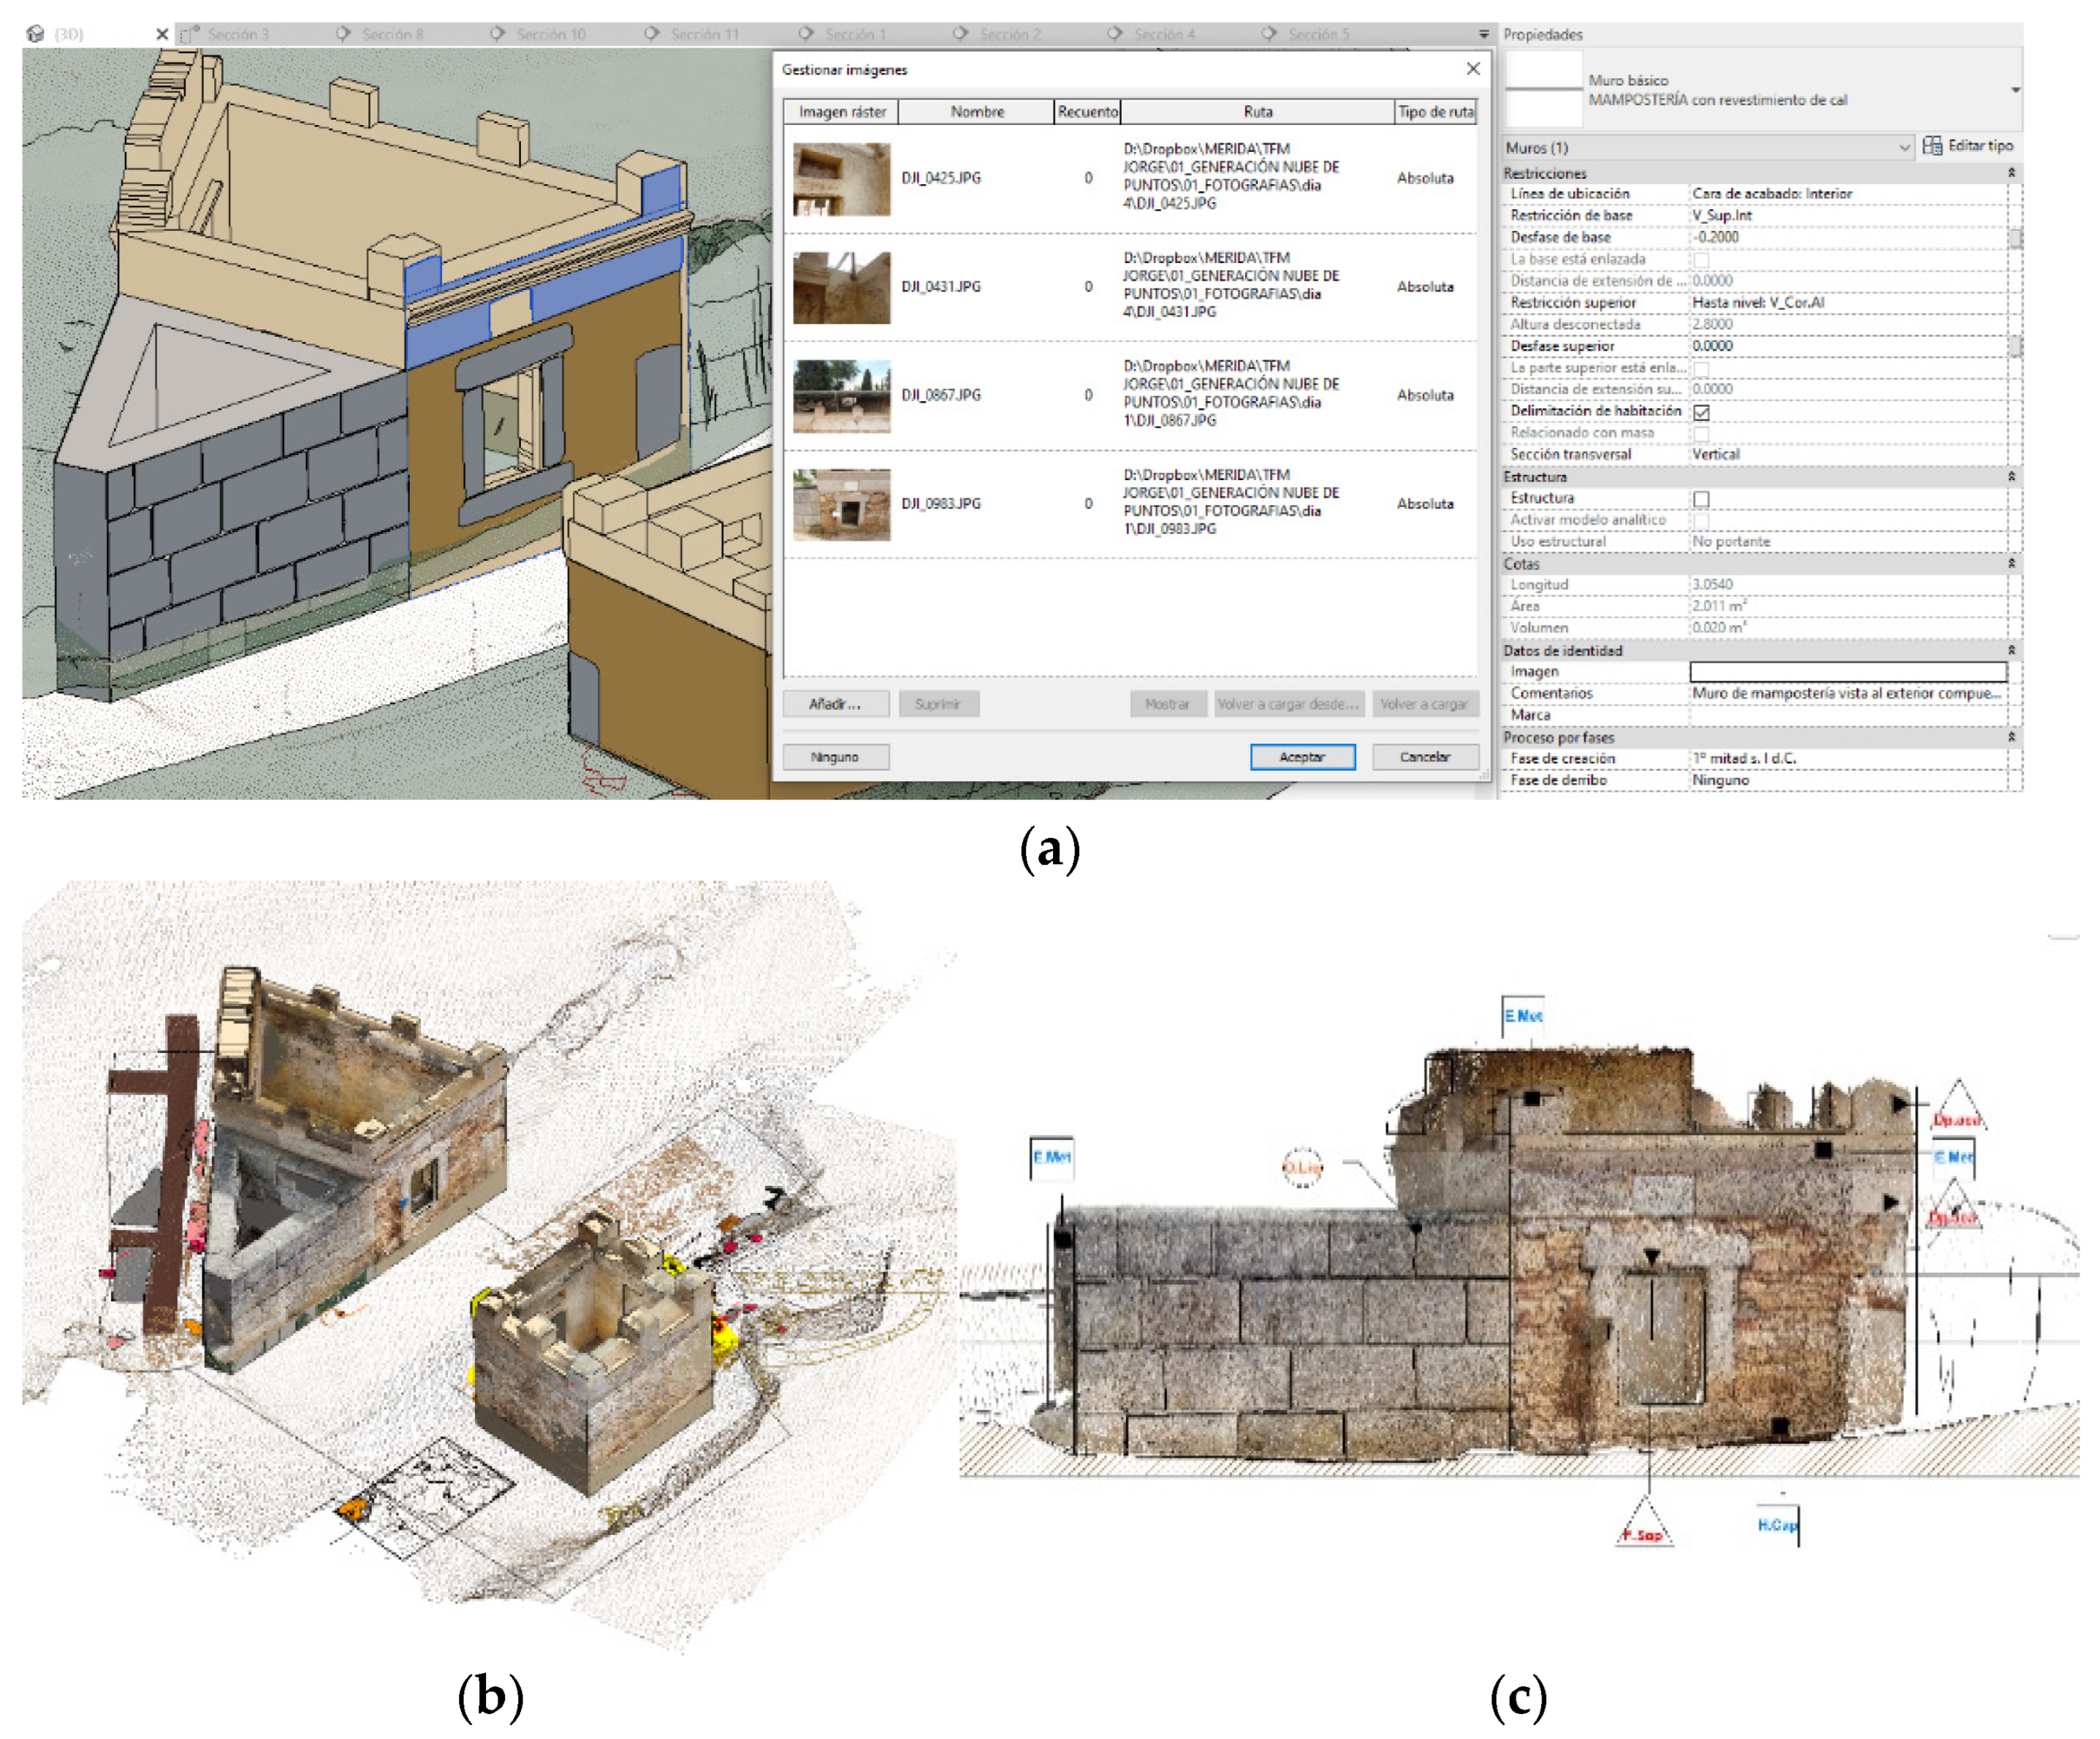
Once the main structural elements were modelled, which in this case study were the walls, we introduced as much information as possible.
The walls of any heritage building contain a large amount of information—for example, different construction phases, pieces reused from other structures, overlapping of elements, different materials, etc. (
Table 8).
Dating: Using the phases tool, the different structures and elements can be grouped by period.
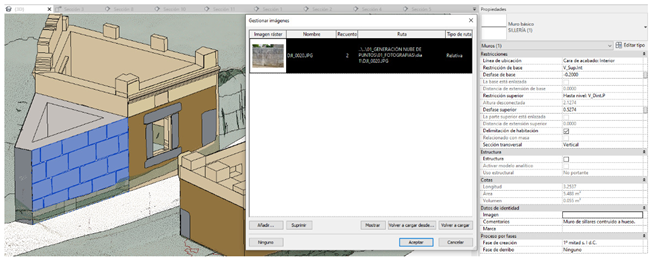
Identifying the wall: In the property bar, the elements can be described, and photos can be attached.
Definition of the composition: This can be carried out by editing the type properties.
Definition of the material properties: One can detail the characteristics of the materials. In this process, it is advisable to carry out laboratory tests on the materials and add the data obtained to the model.
Pathology
In this section, we set up a system to implement the pathological information in the 3D model. To do this, we used existing conservation reports of the Columbarios carried out by the technicians of the Consorcio de Mérida.
First, we established a criterion for classifying and identifying the types of lesions according to their origin or cause. With this classification, we can define with scientific and technical rigour each of the pathological processes that affect the heritage property.
According to the studies published by architect Juan Monjo, a professor at the Polytechnic School of Madrid, lesions can be classified according to their origin: physical, mechanical, chemical, or anthropic.
For each of these groups of injuries, categories and subcategories are established according to the causes that generate them. This system for defining injury processes was obtained from rehabilitation treatises [
55,
56].
In
Table 9 we see the classification of the lesions that cause pathological processes in the properties.
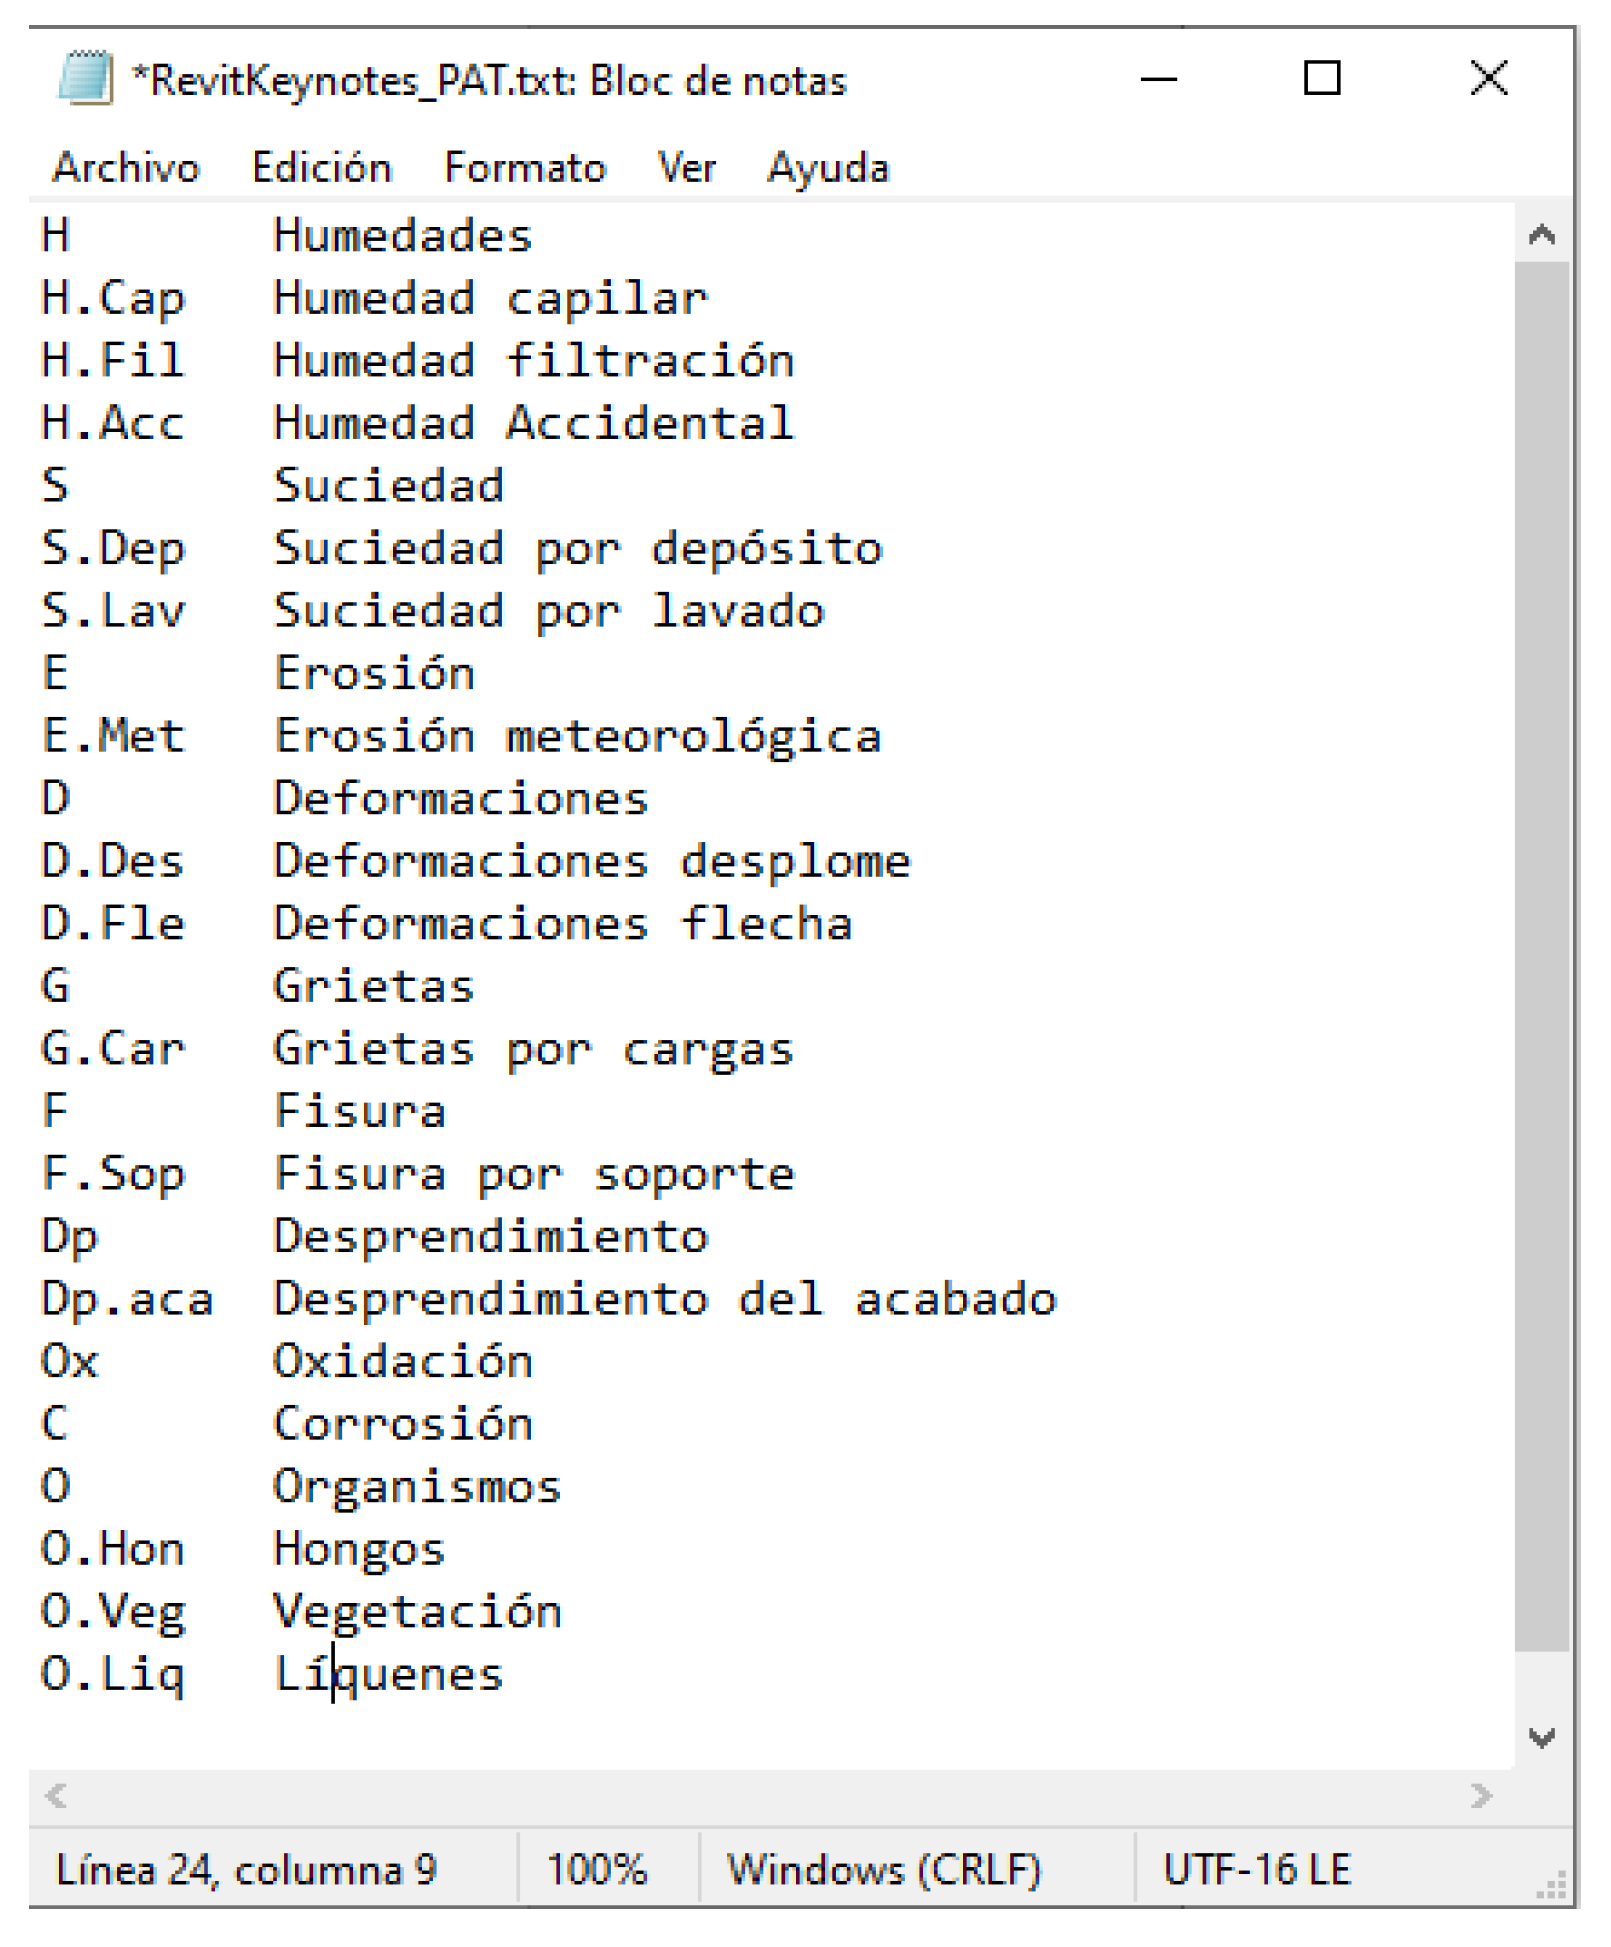
This can be done by entering keynotes in the model (
Figure 20).
To differentiate each family of lesions, we created a label family with the different symbols (as shown in the table above), which is stored in the HBIM Library.
We created a legend with each type and subtype of lesion, elaborating a .txt file, which was saved in the library and subsequently loaded in the configuration of the keynote creation.
When a new lesion type is diagnosed, we can add the legend to the .txt file saved in the library.
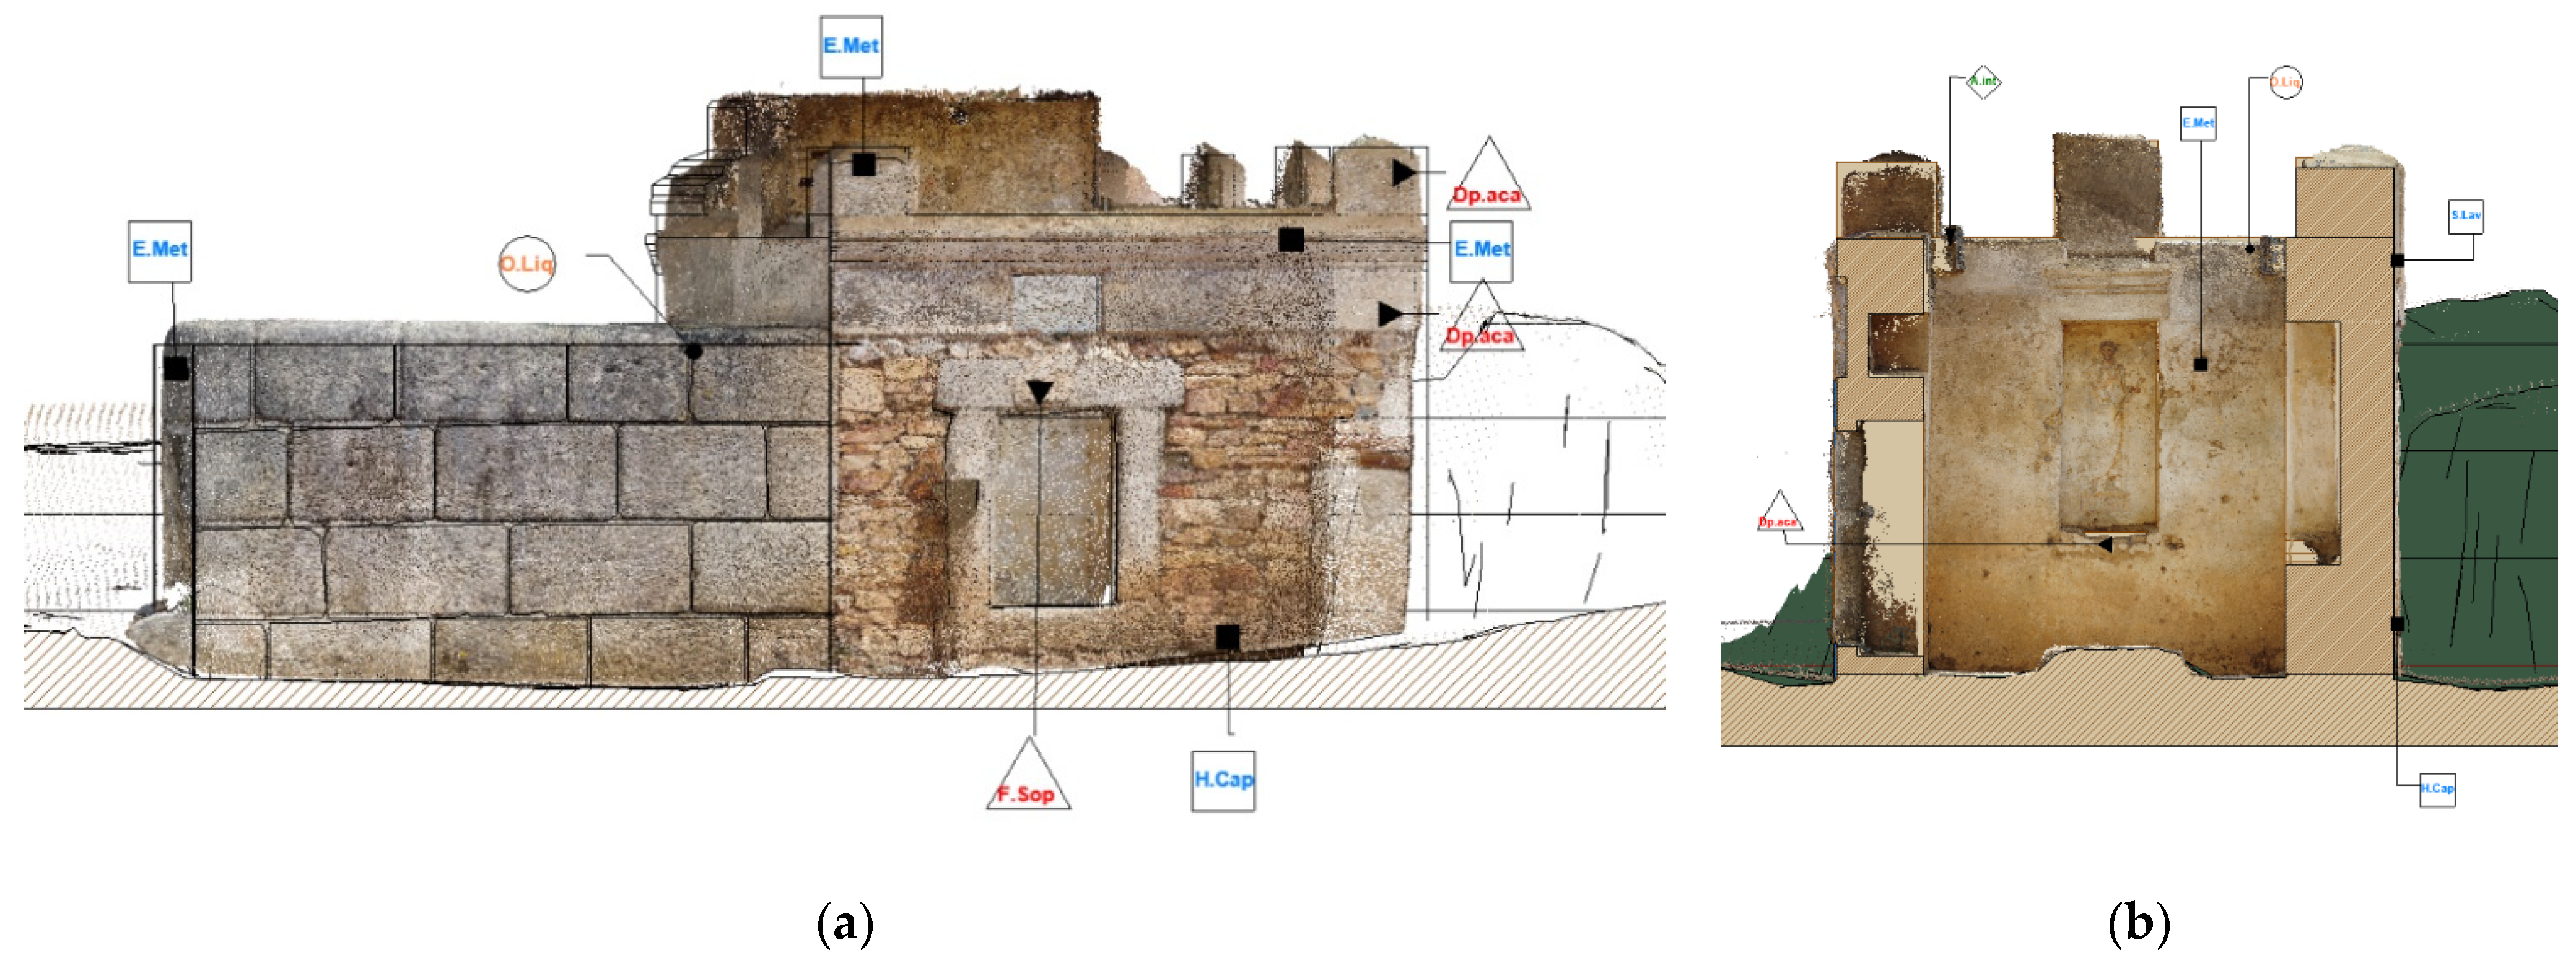
Figure 21 shows two views of what the injury map of the columbaria would look like according to the data provided by the
Consorcio de Mérida.
Archaeological information
Due to the nature of the heritage property we are working on, it is important to define how to incorporate the information obtained from the excavation campaigns into our project.
We detail two work systems, one incorporating the information that is already documented, and the other proposing a future work system to document the information and implement it in the models.
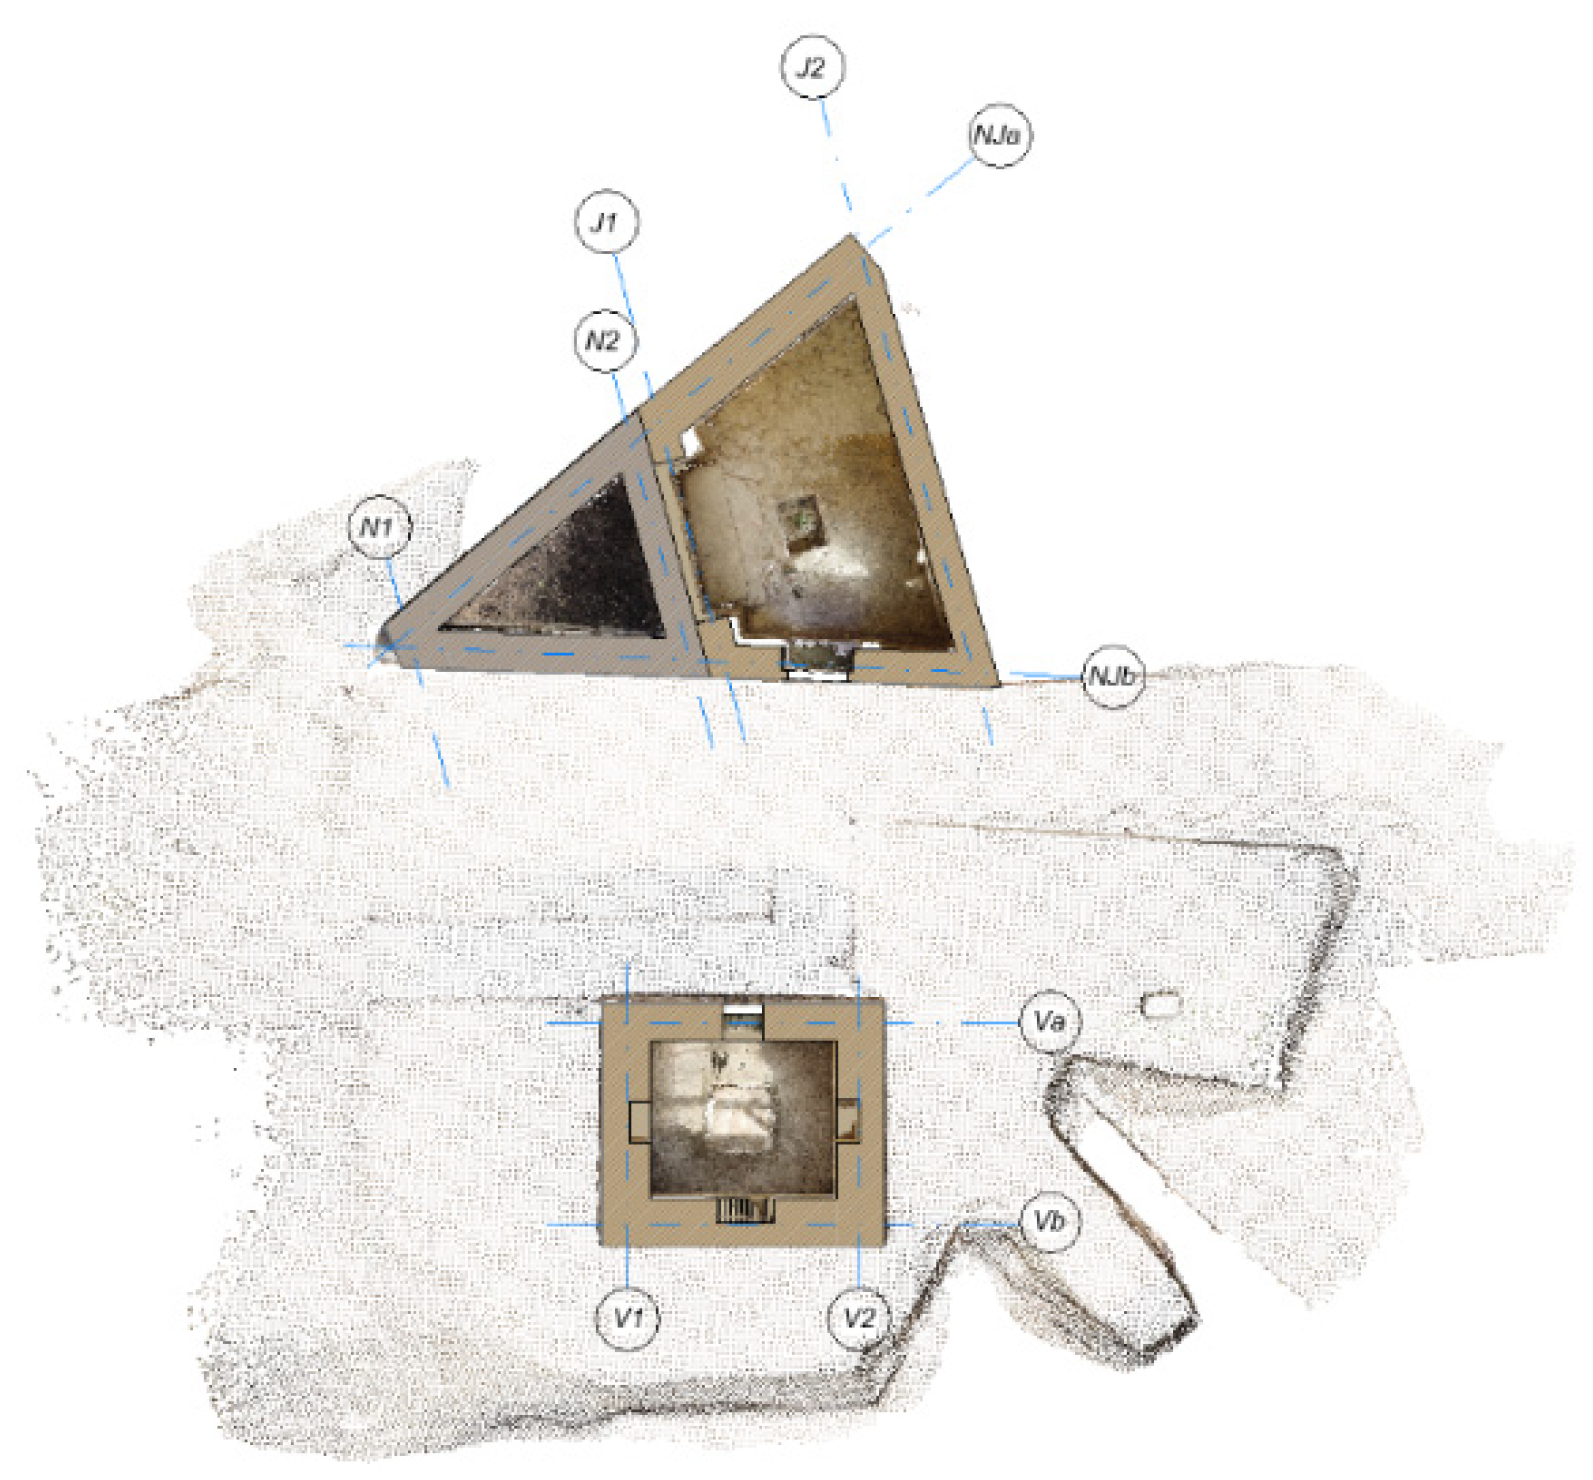
Currently, in an archaeological excavation, all the remains found in the different excavation campaigns are documented and drawn in 2D in AutoCAD, assigning each stratigraphic unit to a layer. In addition, each stratigraphic unit is labelled with a code and the elevation at which it is located. For this purpose, orthophotos extracted from photogrammetry are used as a support to draw the archaeological remains in more detail. However, there is no photogrammetry of this enclosure, since in the year in which the different excavation campaigns were carried out around these structures, this technique was not well-developed.
In this paper, we introduced the data obtained from the excavation via the following steps:
The documentation of the different excavation campaigns can be found in AutoCAD.
In the AutoCAD file, each stratigraphic unit is selected and moved to the indicated elevation, thus converting the 2D AutoCAD file into a 3D file with the different strata; in this case, we separated the different strata by historical periods into different AutoCAD files.
In this way, we insert the AutoCAD files into the Revit model, depending on each stratum, and we are also able to observe the exact height of the different stratigraphic units, which make it easier when carrying out any adaptation project on the site, as we would have all the information to date and would avoid unforeseen events when carrying out excavations for trenches or foundations (
Figure 22).
For the future, we propose using the same system of work described above to document archaeological remains.
Photographic reporting of the remains by stratum.
Generation of a point cloud for each stratum using Agisoft Photoscan.
Classification of the points by stratigraphic units using Recap software.
Importing the Recap file with the different layers into Revit.
In Revit, different phases can be created in which filters can be applied depending on the archaeological remains that are extracted, those that are left visible, and those that are left covered, so that all the documentation remains in a 3D model.


 ,
, 


