Communication

Meta-Analysis and Visualization of the Literature on Early Identification of Flash Floods

1
State Key Laboratory of Hydraulics and Mountain River Engineering, Sichuan University, Chengdu 610065, China
2
College of Hydraulic and Hydroelectric Engineering, Sichuan University, Chengdu 610065, China
3
College of Earth Science, Chengdu University of Technology, Chengdu 610059, China
4
School of Geography and Ocean Science, Nanjing University, Nanjing 210093, China
5
China Railway Eryuan Engineering Group Co., Ltd., Chengdu 610031, China
*
Author to whom correspondence should be addressed.
Remote Sens. 2022, 14(14), 3313; https://doi.org/10.3390/rs14143313
Submission received: 4 June 2022 / Revised: 2 July 2022 / Accepted: 7 July 2022 / Published: 9 July 2022

Abstract

:
Flash flood is one of the extremely destructive natural disasters in the world. In recent years, extreme rainfall events caused by global climate change have increased, and flash flood disasters are becoming the main types of natural disasters in the world. Due to the characteristics of strong suddenness, complex disaster-causing factors, great difficulty in prediction and forecast, and the lack of historical data, it is difficult to effectively prevent and control flash flood disaster. The early identification technology of flash floods is not only the basis of flash flood disaster prediction and early warning, but also an effective means of flash flood prevention and control. The paper makes a meta-analysis and visual analysis of 475 documents collected by the Web of Science Document Platform in the past 31 years by comprehensively using Citespace, Vosviewer, Origin, etc. We systematically summarize the research progress and development trend of early identification technology of flash flood disasters from five key research subfields: (1) precipitation, (2) sediment, (3) sensitivity analysis, (4) risk assessment, (5) uncertainty analysis. In addition, we analyze and discuss the main problems encountered in the current research of several subfields and put forward some suggestions to provide references for the prevention and control of flash flood disasters.

1. Introduction

The term “flash flood” is widely used to refer to floods caused by natural or human-induced events, such as rainstorm [1,2], snowmelt [3,4], glaciers [5,6], volcanoes [7,8], and dam break [9], but is not uniformly and clearly defined in many documents. French et al. [10] believed that a flash flood is a kind of surface runoff formed by short-duration rainstorms in mountainous and canyon areas. Flash floods are also understood as a high-peak surface runoff event caused by high-intensity rainfall [11]. Borga et al. [12] defined flash floods as the result of extreme rainstorms in small source basins, which depend on the correlation among rainfall distribution, landform, and hydrological factors, and may lead to geological disasters such as debris flow and landslide. Some scholars believe [13] that flash floods are short-duration and high-intensity precipitation, usually occurring in small basins, characterized by time concentration and poor water storage capacity. Due to the influence of topographic and climatic characteristics, some areas are particularly prone to flash floods and environmental risks. Dejen et al. [14] consider flash floods to be an extreme flood event that is also a rapid, short-lived, dangerous phenomenon with negative environmental and socio-economic impacts. According to the definition given by the National Weather Service (NWS) [15], flash floods are those caused by the rapid and extreme influx of high water levels into normally dry areas, or the rapid rise of water levels in small basins due to heavy rainfall, dam collapse, or ice jam within 6 h. As rainstorms and flash floods are the most widely distributed with highest frequency of outbreak and most serious hazard, flash floods mentioned in this paper refer to the flash floods that occur in hilly areas and urban areas. Flash floods often wreak havoc in these areas and can sometimes be accompanied by mudslides and landslides.
The hazards of flash floods are very prominent all over the world [16,17,18,19,20,21,22], causing quite painful life and economic losses [23]. For example, a case study of the Erbil-Kurdistan region of Iraq shows that compared with developed countries, flash floods are more destructive in less developed areas [24]. The Lubi flash flood in 1962 was the most serious flash flood in Spanish history [25]. In October 1999, a torrential rain event occurred on the eastern slopes of the Sierra Madre Mountains in eastern Mexico [26]. Flash floods triggered by the torrential rain damaged three of the four states, killed 384 people, damaged 212 cities, and affected about 198,000 people. After two hours of rainfall at a speed of 200 mm/h, the flash flood transported a large number of fine and coarse sediment particles, resulting in the rise of the flash flood water level and killing more than 800 people. A deadly flash flood in Algeria [27] on 9–10 November 2001 killed more than 760 people. On 7 February 2021, flash floods caused severe damage to two hydropower projects, Rishiganga and Tapovan Vishnugad, in the Chamoli district, eventually killing more than 200 people [28]. Flash floods in Uttarakhand in June 2013 killed nearly 5700 people, left 110,000 trapped, and caused power outages in the region, delaying rescue efforts in remote areas [29]. In recent years, with the development of social economy [30], the pressure of human activities on land resources has been increasing, and global warming has also intensified the hydrological cycle and the occurrence of short-duration heavy rainfall events in some areas and, in particular, the frequency and disaster-affected extent of flash floods in mountainous areas have increased significantly. For example, after the Wenchuan [31] earthquake in Aba Prefecture, Sichuan, due to climate reasons, flash floods occurred from July to September, which was consistent with the rainfall in the region. As shown in Figure 1, a scene photo was taken after the flash flood caused by heavy rainfall in the area on 20 August 2019, in which the bridges were broken, the houses were destroyed, the river banks were washed out, and a large amount of solid sediments was released, which greatly reduced the flood discharge capacity of the river.
The distribution of flash flood disasters in time and space is uneven [32], which is mainly manifested as different group occurrences of flash flood disasters and different combinations of flash flood disaster types in different regions, which shows the characteristics of regional differentiation; the uneven distribution of the flash flood disasters in time is mainly manifested as the sudden occurrence of disasters. In addition, as flash flood disasters have problems of fast occurrence [33], great difficulty in monitoring [34], and lack of data [35], it is very difficult to accurately identify the location and time of flash floods [36]. With the continuous development of monitoring sensors [37,38,39] and computer technology [40,41], various early identification technologies [42] are more and more widely applied to the research of flash flood disasters. Flash floods are caused by a number of factors, including climate change, population growth, and urban development. These factors all contribute to a reduction in the amount of land that is impervious to water, which in turn leads to an increase in the volume of runoff. In light of this, a large number of researchers looked into how changes in land use and land cover (LULC) may be contributing to an increase in the number of instances of flash flooding. Of course, they used remote sensing technology to identify prone areas (The Impact of Spatiotemporal Changes in Land Development (1984–2019) on the Increase in the Runoff Coefficient in Erbil, Kurdistan Region of Iraq) [43]. As an important part of early warning systems (EWSs) [44], early identification technology has gradually developed into a favorable tool to identify high-risk areas and predict hydrological conditions, so as to minimize the loss caused by flash flood disasters. Therefore, many countries and regions threatened by flash flood disasters pay more and more attention to the research on the early identification technology of flash flood disasters.
In recent years, scholars have carried out a lot of research on the early identification [45] of flash flood disasters and accumulated a lot of research results, but few of them have conducted meta-analysis and visualization research by using document metrology tools, and there is no comprehensive review of documents on specific analyses of subfields according to the results of cluster analysis and research trends. Compared with our previous study [46], this study adopts more common bibliometric analysis methods and knowledge graph technology, and focuses on a comprehensive review of the main results of applying various technologies to the early identification of flash flood disasters, not limited to remote sensing and geographic information system technologies. First, we make a meta-analysis and visual analysis of the documents retrieved from the Web of Science through document analysis and data mining tools such as Citespace, Vosviewer, and Origin. Second, we summarize and analyze the research process and hot topics in the past 31 years by integrating the methods of document metrology, data mining, and knowledge mapping, and summarize the development trend and research direction of early identification technology of flash flood disasters from five key research subfields: (1) precipitation, (2) sediment, (3) sensitivity analysis, (4) risk assessment, (5) uncertainty analysis. Finally, we analyze and discuss the main problems encountered in the current research of several subfields, and put forward some relevant suggestions.

2. Data and Methods

2.1. Data Source

Papers were retrieved on 2 May 2022. The time span was set from “unlimited” to 2022, and a total of 31 years (from 1991 to 2022) of documents published were retrieved. The retrieval strategy is shown in Figure 2. The core search terms were “flash flood*” and “identify”. The term “flash flood*” means similar terms such as “flash flood”, “flash floods”, “flash flooding”, etc. The term used in the search here is ”identify”. These articles were mainly included in the core collection of the science network Web of Science. A total of 789 documents were retrieved, and the retrieval was carried out in one day to avoid changes caused by daily database update. According to the uniqueness of document DOI and title, 700 documents were saved in the Web of Science by using the duplicate checking function of Office software Excel to delete duplicated data and extended duplicated items of DOI and title. The search results are rich, and there are inevitably some weakly related content that needs to be further screened in the future. In order to ensure the representativeness of literature data and the reliability of meta-analysis and visual analysis, we first defined the research field as “early identification of flash floods”, and established specific inclusion and exclusion criteria for the selection of papers through repeated discussions in four meetings, as shown in Table 1. Then, the Excel table of the literature record information downloaded from the WOS database was used to identify each item, and the screening range included the title, abstract, and keywords of the paper. Recognizing that flash floods mainly occur in mountains and cities, the study area of this paper excludes glaciers, deserts, and coastal areas. Papers on flash floods caused by rainfall were kept, but papers on flash floods caused by glacier lake dam break, glacier melt, dam break flood, and tsunami were excluded. We chose to focus only on the five subfields of early identification of precipitation, sediment, sensitivity analysis, risk assessment, and uncertainty analysis in flash floods, and excluded papers on trace elements, child feeding, isotopes, crop growth, molecular genetics, and computer servers. Proceedings papers, early access, editorial materials, and meeting abstracts were excluded. Articles, review articles, and letters were retained so that our research efforts could focus on papers published in peer-reviewed or editorially supervised publications.
Finally, we applied the inclusion and exclusion criteria to the deduplicated 700 papers, screened them independently by 3 authors, and then held a meeting to decide whether or not to include each paper. Papers unanimously approved by 3 authors were retained, and 475 papers were finally determined to be included in the paper sample library of this study. As shown in Table 2, using the Excel software, key information such as document year, author, title, document source, citation number, and keywords were extracted to form a document analysis feature table.

2.2. Meta-Analysis

Meta-analysis is to collect, sort out, and analyze the previous empirical research carried out by researchers on a research topic by virtue of statistical concepts and methods, so as to find out the clear relationship mode between the problem and the variables concerned [50,51,52]. The idea of meta-analysis can be traced back to the 1930s. The scholar Gene Glass [53] first used the meta-analysis to represent the process and method of integrating and analyzing numerous empirical studies with the same topic through statistical analysis so as to obtain the most representative conclusions. By referring to the relevant documents published by the Web of Science document database, this paper makes a quantitative analysis and qualitative comprehensive evaluation with document metrology tools, provides data mining and comprehensive comparison for the total number of documents, discipline categories, high-productivity institutions, high-productivity publishers, high-productivity authors, and citation of documents, and then draws it with Origin software.

2.3. Visual Analysis

At present, there are many kinds of software tools for visual analysis of documents. VOSviewer has the advantages of non-overlapping nodes and labels, and high degree of relationship display. It can display results from multiple views, build multiple matrices, and support text mining. The disadvantage is that the function is simple, the modification map cannot be adjusted at will, and the evolution path of a field cannot be displayed through time evolution [54]. The advantages of CiteSpace are that it has diverse functions, beautiful maps, and rich connotations. It can build common relationship networks, quantitatively analyze visualization results using a variety of bibliometric analysis methods, and show the evolution of a field from multiple perspectives. The disadvantage is that the amount of data and the format requirements are high, the software is complex, and the nodes and labels overlap [55,56,57,58]. In this paper, VOSviewer (version 1.6.7) is mainly used for word cloud analysis, collinear analysis, and thermodynamic diagram analysis of keywords, while CiteSpace (version 5.8.R3) is mainly used for mutation analysis, cluster analysis of research hotspots, analysis of time zone charts of research development trends, and analysis of the outbreak of published time sequences of keywords.

3. Results

The change in the total number of documents, research direction, influence, number of citations, keywords, and other elements can directly reflect the changing process of the research enthusiasm of early identification technology of flash flood disasters in the past 30 years, and it is also an important index to measure the development trend of early identification technology of flash flood disasters in this period of time.

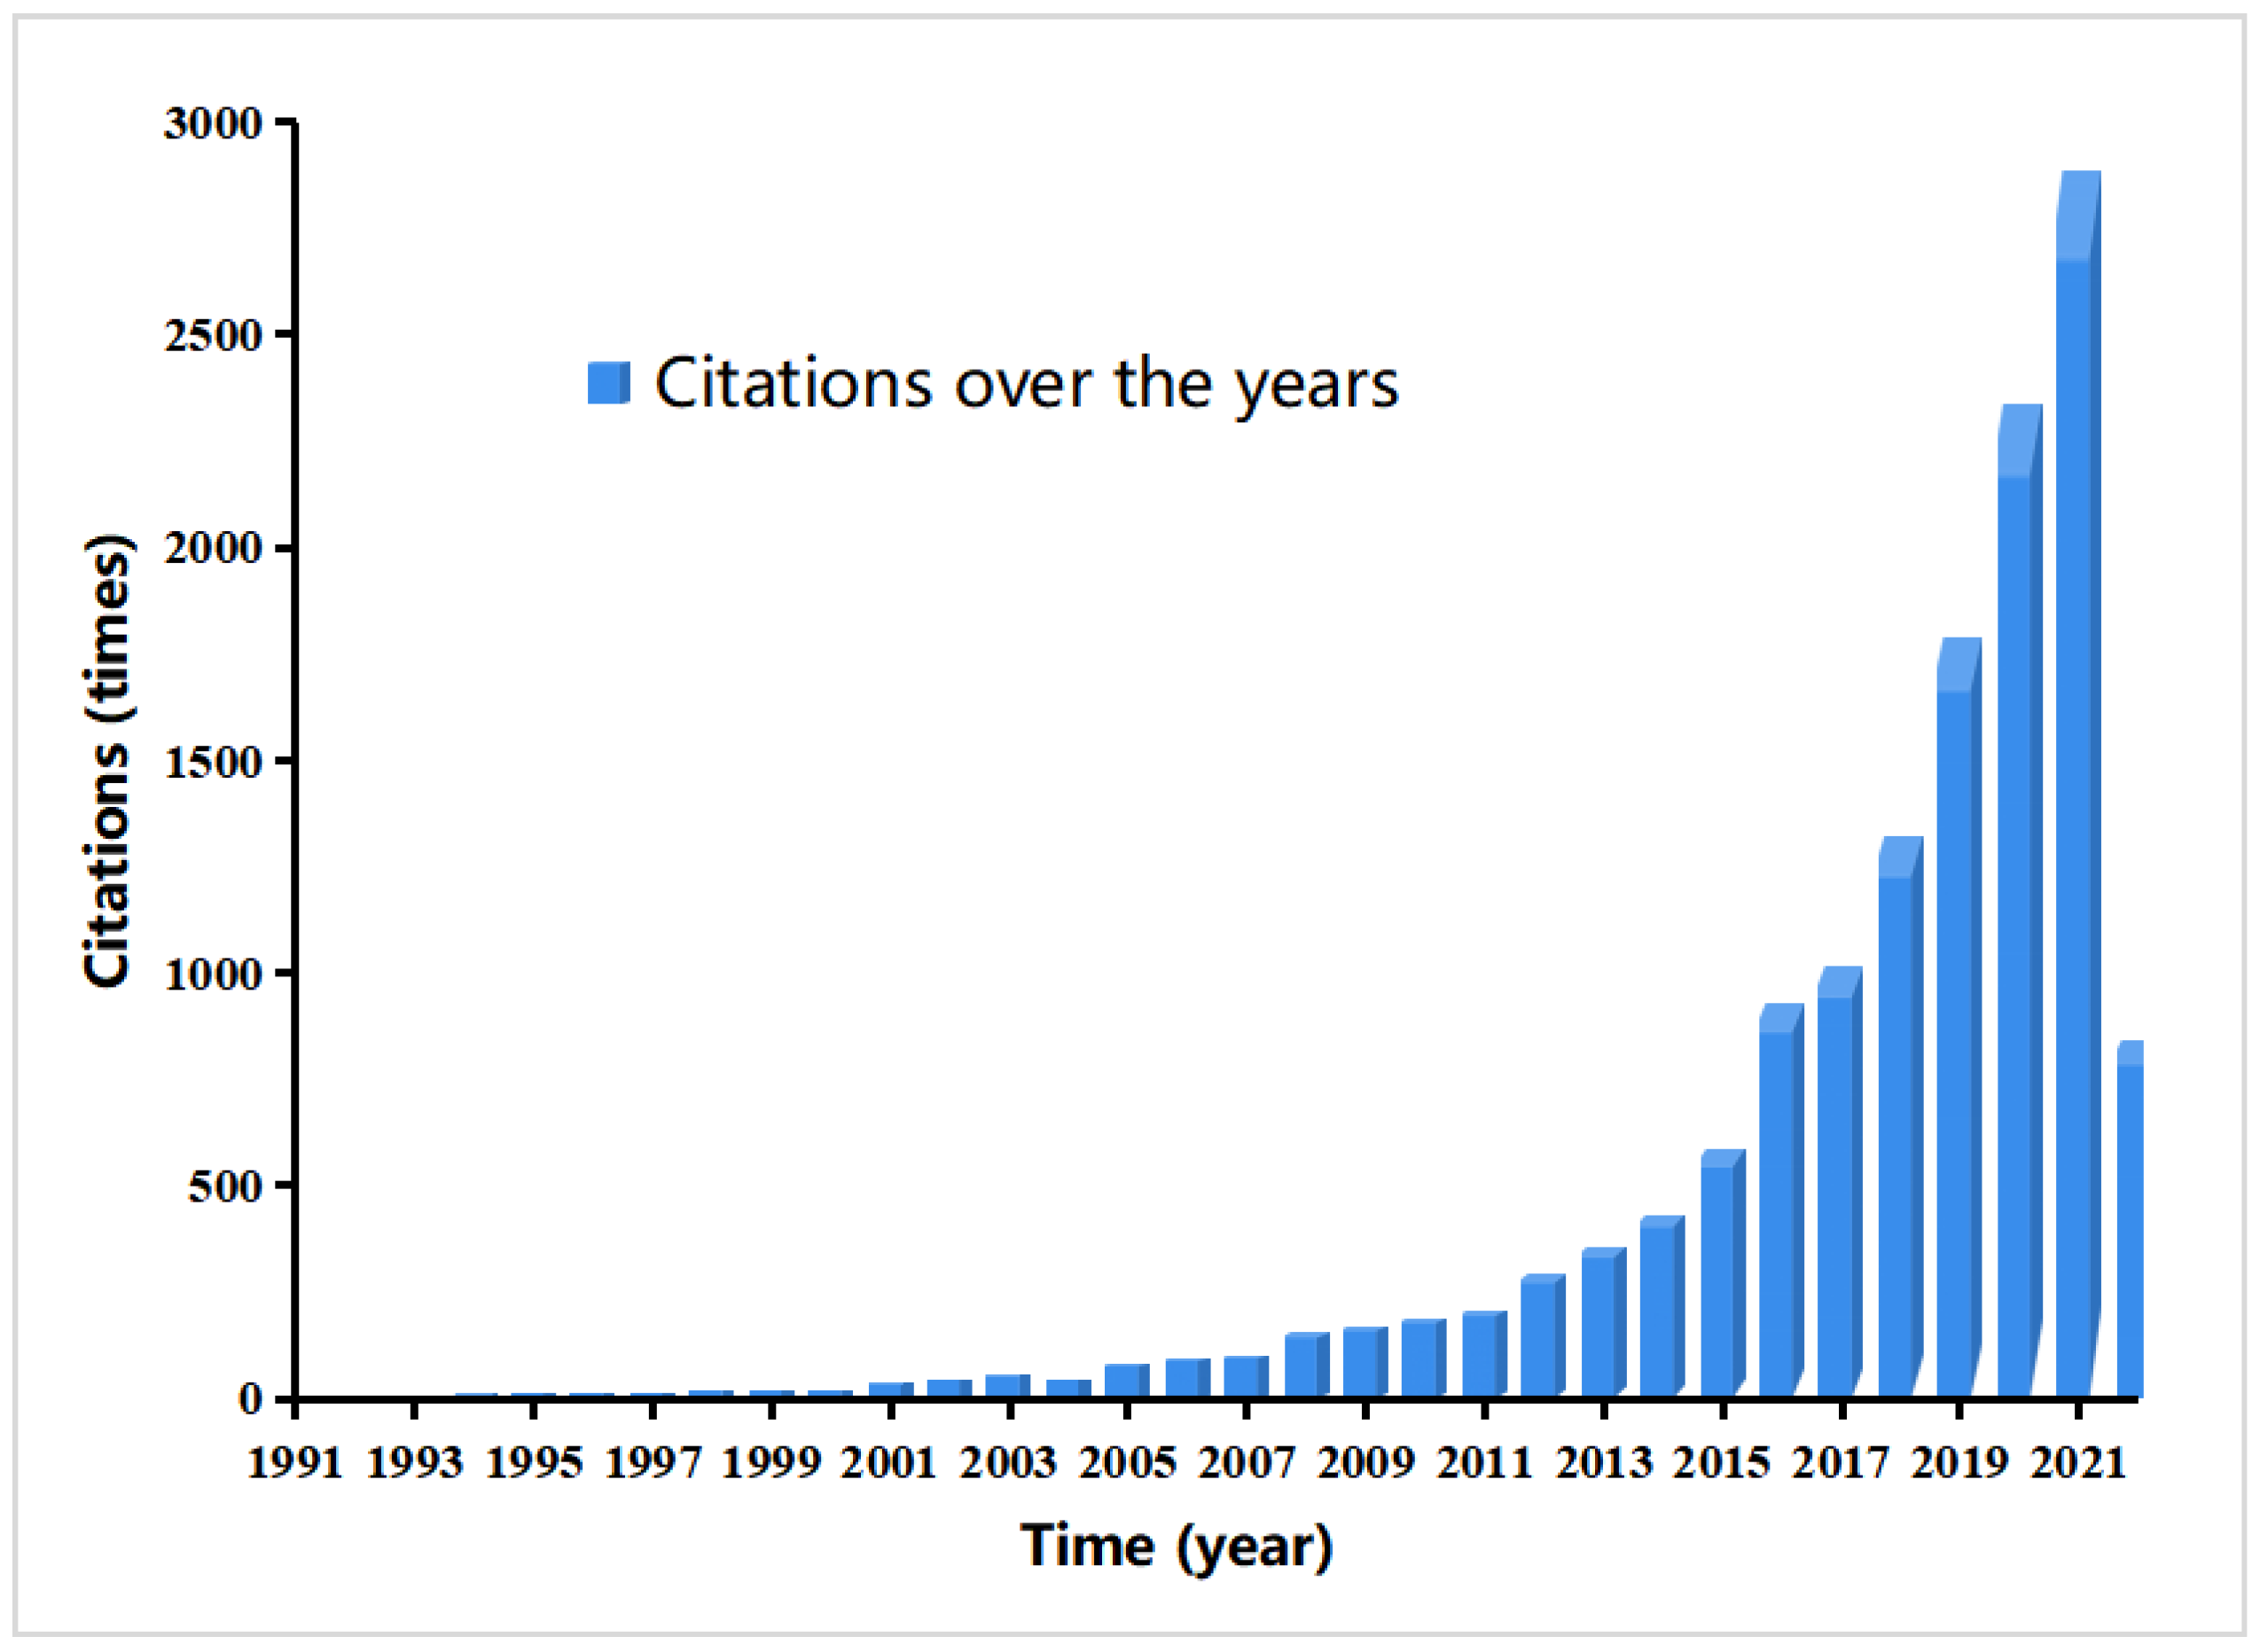
3.1. Analysis of the Total Number of Documents

This paper analyzes and explains the number of articles published over the years using document management software Endnote X9, statistical software Excel, and mapping software Origin 2018. As shown in Figure 3, in terms of the overall time trend of publishing documents (1991–2022), the number of documents published shows an exponential growth trend, indicating that the research in the field of early identification of flash flood disasters has attracted more and more attention from international scholars. It can be seen from the number of documents published in each year that the research in this field has mainly experienced three stages.
(1)
1991–2006 is the beginning stage: Although the number of documents published in this stage was small (less than 5 in each year), documents were published every year, indicating that the research in the past 11 years had the characteristics of continuity. Through further analysis, it was found that although the research on identification technology of flash flood disasters in this stage had just started, there were still some pioneering documents that inspired the later research in this field. For example, the document on identifying surface features published in 1995 [59] was not only one of the important components of weather forecasting, and but also helped to explain the flash floods caused by concentrated heavy rainfall, which meant it was cited in as many as 53 documents in subsequent research.
(2)
2007–2013 was a period of slow development: There has been continuous research in this field since 1994. As can be seen from Figure 3, the number of documents remained at or below 20 until 2013, showing a relatively slow growth rate. At this stage, with the exploration of flash flood disasters and the development of science and technology, compared with the first stage, the number of documents published had increased, and some documents with great referential significance had appeared one after another. A representative document was about identifying and analyzing the hydrological and meteorological causes of flash floods by analyzing the high-resolution data of 25 extreme flash floods in Europe [60], which not only emphasized the importance of establishing and expanding flash flood databases, but also highlighted the necessity of developing new methods for flash flood disaster assessment.
(3)
2014–2021 is a stage of rapid development: With the rapid progress of information technology, network technology, and computer hardware, the early identification technology of flash flood disasters had developed rapidly, showing a vigorous development trend, and the number of documents published was increasing. The number of documents published in 2021 was 74, reaching a phased peak. It was expected that the trend of a high number of documents published would continue in 2022.
In terms of the number of documents published by countries (regions), scholars from 100 countries (regions) have published papers related to the early identification technology of flash flood disasters. The spatial distribution of the number of documents published is the macroscopic expression of national or regional research forces, which can reflect the regional differences in a certain field and the situation of academic exchanges and cooperation. Figure 4 shows that scholars are distributed in different countries (continents). Although the number of studies varies greatly, it can reflect that the field of flash floods has been widely studied by researchers in different countries (continents) to a certain extent. The United States had carried out the most research in this field (175 documents), followed by India (77 documents), and then Italy [61,62,63,64,65,66,67] (71 documents). China ranked fourth (70 documents), and France ranked fifth, with 64 published documents. The top five countries accounted for 56.70% of the total number of documents published, indicating that the research pattern of early identification of flash flood disasters takes the United States, India, Italy, China and France as the core, other developed countries (continents) as the priority, and developing countries as the supplement. Three of these countries are considered developed countries (the United States, Italy, and France), which means that the advantages of these countries in terms of science and technology, infrastructure, and economic development levels have provided important contributions to the development of this field.

3.2. Discipline Category

According to the analysis of the document library on the early identification of flash flood disasters, it was found that 63 discipline categories (analysis of labeling results by WOS) were involved in this field, which indicated that the research on the early identification of flash flood disasters involves a wide range of disciplines. The top five discipline categories were water resources [68], geosciences multidisciplinary [69], meteorology atmospheric sciences [70], environmental sciences, and civil engineering [71], and there were 281, 244, 193, 192, and 72 documents representing these five discipline categories, respectively.
(1)
Representative results in water resources: Gaume et al. [68] guided hydrological analysis with simple hydrological models based on the SCS method and motion and wave equation, which revealed some laws of the hydrological rainfall runoff relationship during flash floods, playing an important role in enlightening other scholars to estimate the frequency and forecast of flash floods. The number of documents cited was 170, which had a strong influence in this field.
(2)
In terms of geosciences multidisciplinary, due to different terrain, landform, and hydrometeorological conditions of the basin, there were significant differences in accurately identifying and simulating typical types of flash flood to make flash floods adapt to the space and time, which exerted great significance for reduction in the degree of hazard of flash flood disasters. Zhai et al. [69] selected 177 cases with different climatic and geographical characteristics, and identified and simulated typical types of flash flood and corresponding indicators of flash floods through statistical analysis and hydrological modeling, providing new insights for the simulation of flash flood behavior processes in medium and small basins.
(3)
Recent research of meteorology atmospheric sciences was to explore the correlation among peak flow, rainfall change, and basin landform through machine learning [70], clarifying the relationship among them by the method of multidimensional statistical modeling as well as creating a simple model with low deviation and variance for flash flood disaster prediction.
(4)
A study on environmental sciences was to draw the past and present land utilization/land cover (LULC) [71] categories based on historical maps and remote sensing data, and then estimate the surface runoff depth of specially designed rainstorms in two periods by executing the soil conservation service curve number (SCS-CN) methodology in the ArcGIS environment, filling the gap in the research on the impact of increased surface runoff caused by human factors on flash floods in the basin.
(5)
A study related to civil engineering [72] was to identify the sections most vulnerable to flash flood disasters by innovatively combining a flash flood disaster map with a road chain plan. The results obtained by this method could be used to help government departments formulate protection strategies of infrastructures.

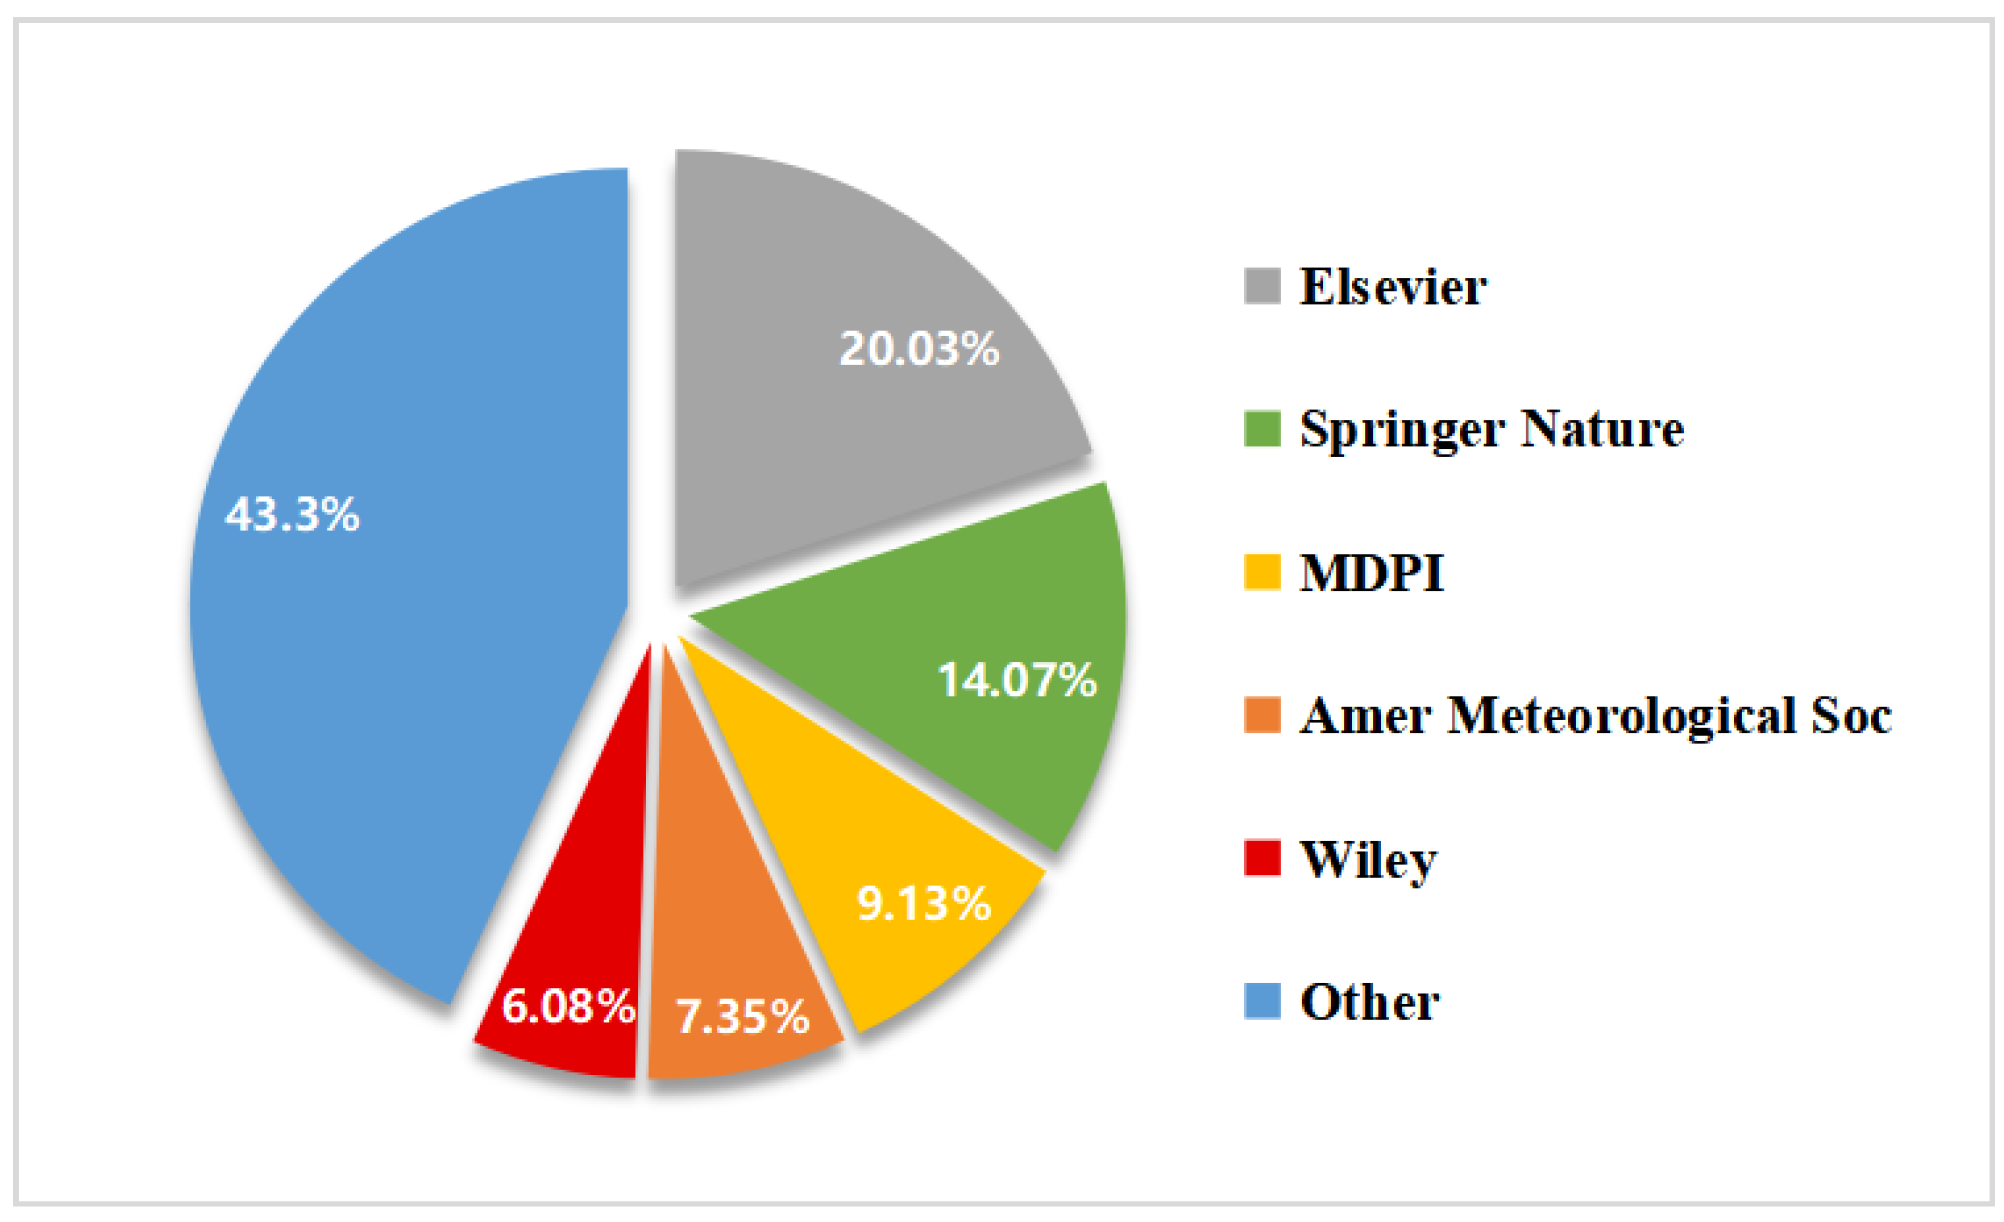
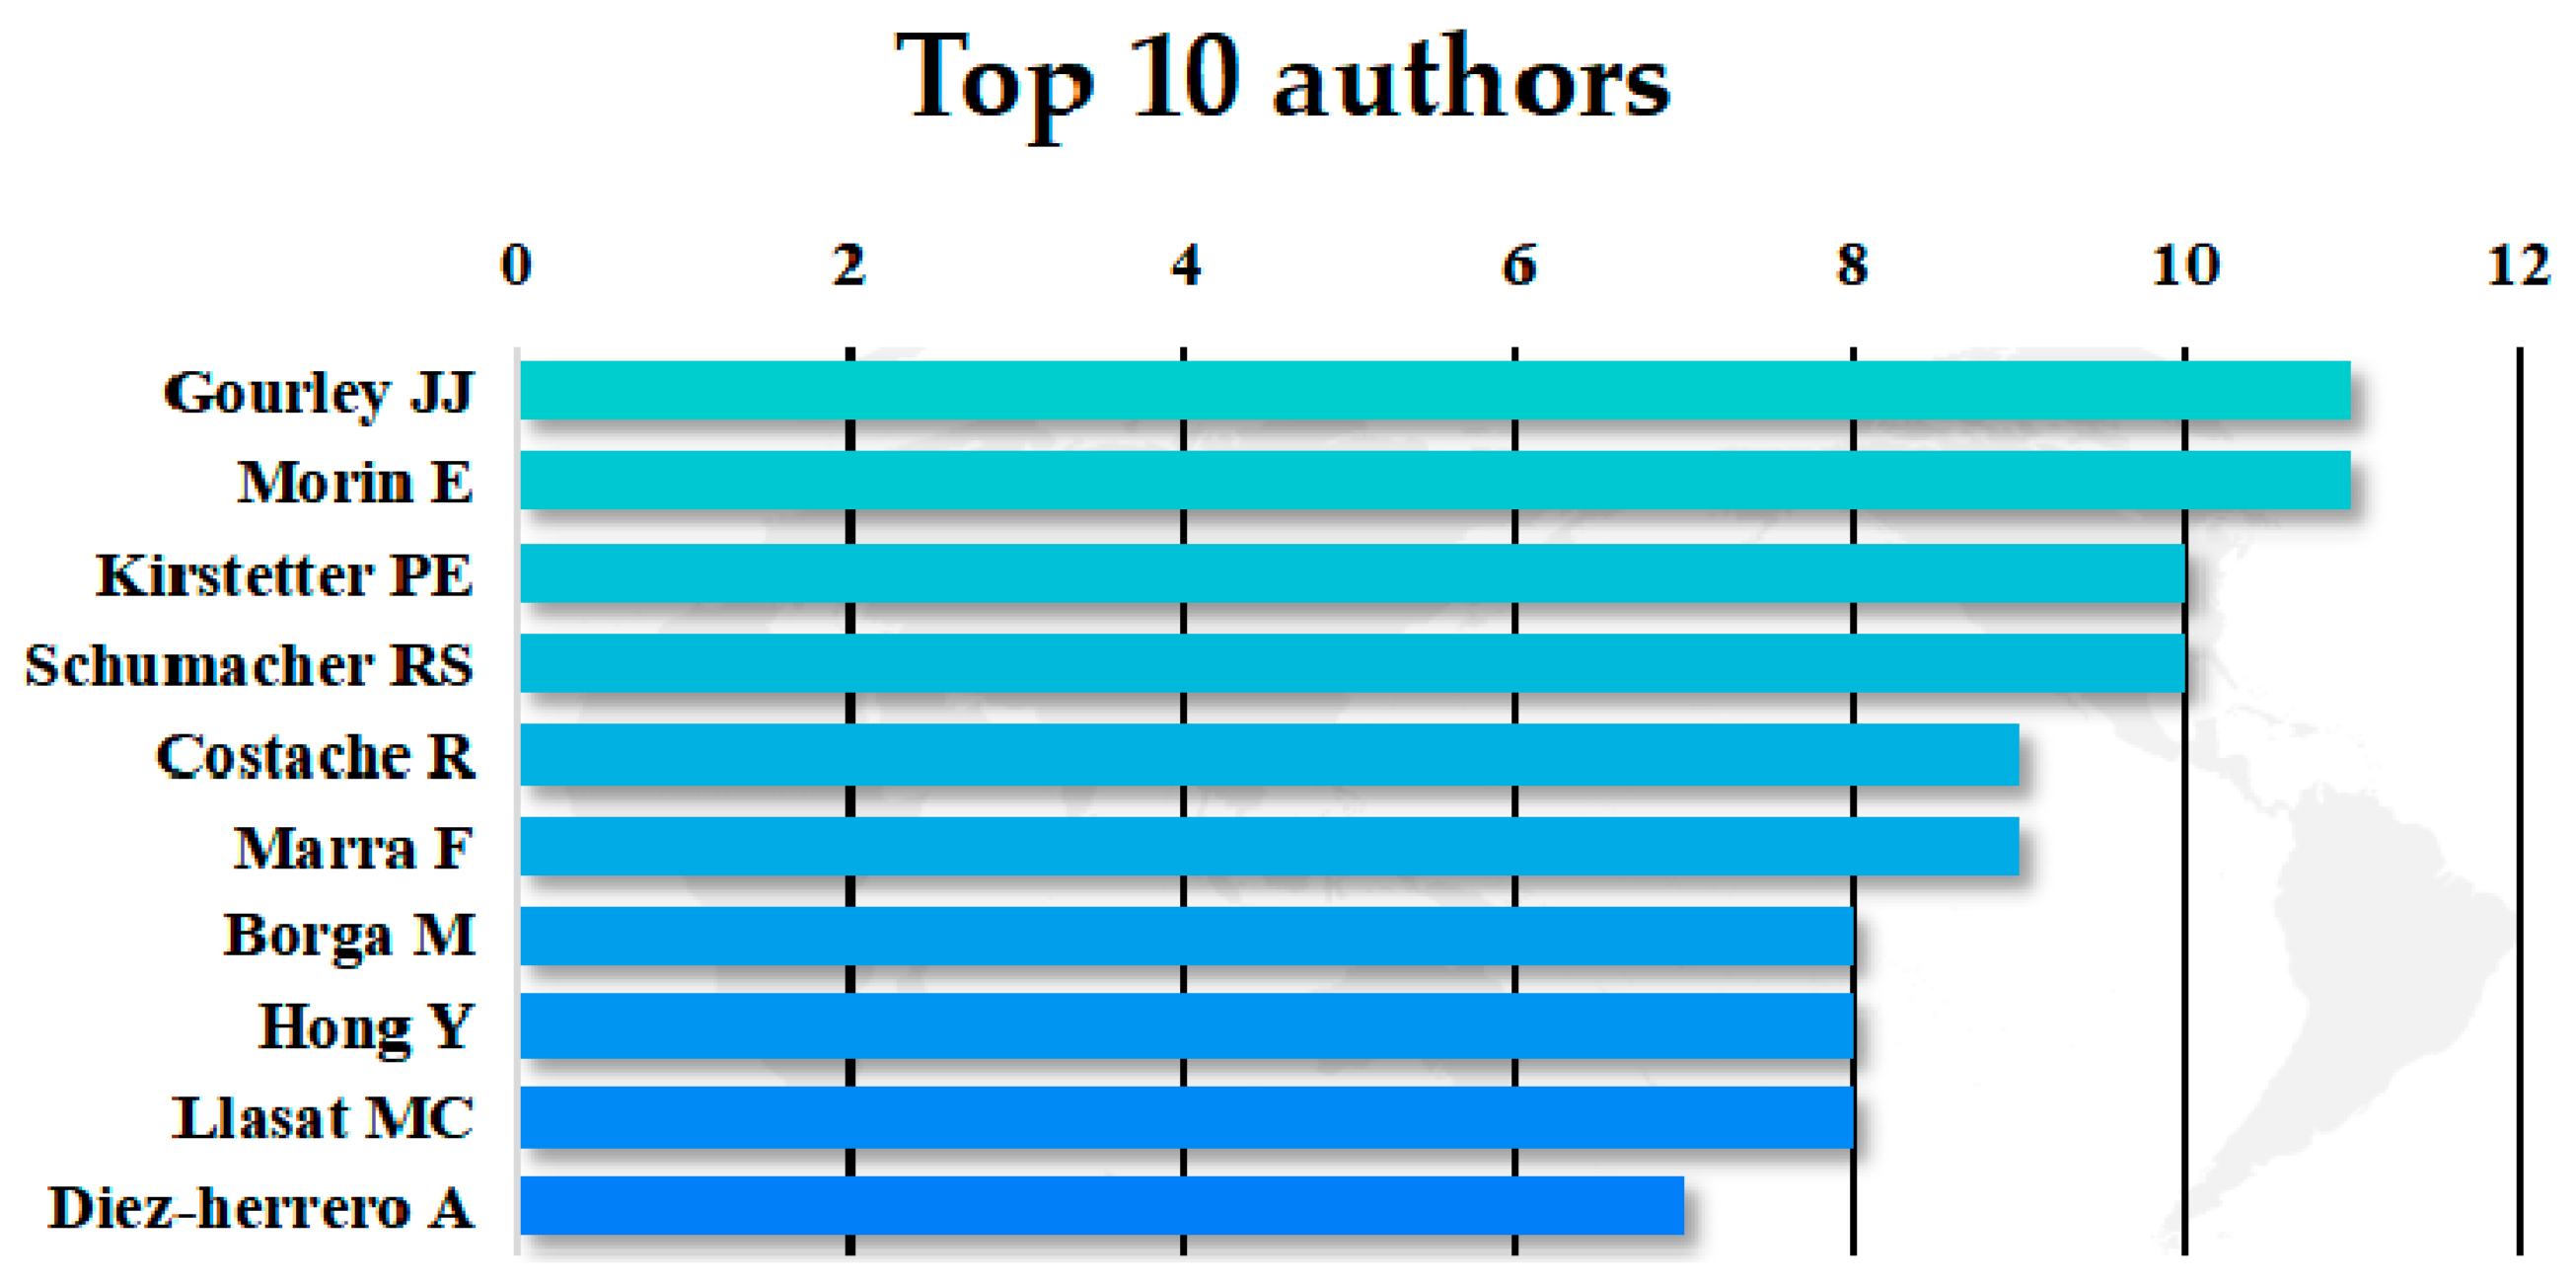
3.3. Influence Analysis

Influence of the institutions: As the institution with the largest number of documents published, the National Oceanic and Atmospheric Administration [73,74,75] published a total of 35 documents (as shown in Figure 5), mainly focusing on atmospheric and oceanic changes, providing early warning of disastrous weather, managing the utilization and protection of marine and coastal resources, and studying how to improve the understanding and protection of the environment. The National Research Council and the League of European Research Universities tied for second place [74,75,76,77,78,79,80,81]. The former is the largest public research institution in Italy and also the only institution affiliated with the Research Department to carry out multidisciplinary activities. The latter, as an alliance of Europe’s leading research universities, was initially established by 12 top European research universities in 2002. Egypt’s Knowledge Base ranked fourth [82,83,84]. The fifth ranked institution was the National Center for Scientific Research in France [48,85,86,87,88]. It is the largest government research institution in France, the largest basic scientific research institution in Europe, and one of the world’s top scientific research institutions. Due to its international reputation for its outstanding contributions in the field of science, it is also regarded as the “wind vane” of the development of science and technology in the world. It can be seen here that in the field of early identification of flash flood disasters, the number of documents published by each of the top 5 institutions is almost the same, showing that this field has been widely studied by mainstream research institutions and will have considerable research prospects in the future.
Influence of the publishers: The papers retrieved in this study have been published by as many as 131 publishers, of which 49 publishers have published two or more papers on the identification of flash flood disasters. Elsevier published the largest number of papers (totaling 158), and became the most influential publisher in this field; Springer Nature ranked second due to 111 published papers in total; MDPI ranked third and published a total of 72 papers. Figure 6 shows that the number of papers published by the top three publishers accounted for 56.66%, indicating that the papers on the early identification technology of flash flood disasters were relatively concentrated, and mainly published by the three most influential publishers in this field.
Influence of the authors: A total of 2830 authors have published papers in this field. As shown in Figure 7, the authors publishing the largest number of papers are Gourley and Morin, who tied for first place with 11 papers. Gourley et al. were committed to the research of hydrology and meteorology, and their five documents were published in the Journal of Hydrology. Their contributions in this field were mainly reflected in: (1) carrying out statistics and analysis of human impact by using a flash flood event database and introducing physical parameters [89]; (2) measuring the severity of flash floods by introducing a new variable called “flashiness“ [90]; (3) proposing a new method [91] to collect near real-time high-resolution observation data on environmental conditions and disastrous consequences, and improving the accuracy of predicting the temporal and spatial changes in flash flood disasters by evaluating the radar-based prediction tools. Morin et al. focused on the research of hydrology and geosciences, aiming to determine the significant differences of three weather systems (namely, Mediterranean cyclone (MC), active red sea trough (ARST), and subtropical jet stream (STJ)) that can trigger flash floods in hydrometeorology [92]. They also proposed to replace the lower threshold of secondary flow in transient alluvial rivers in arid environments with an initial geomorphic index of flash floods in an alluvial river (AFIG) [93], so as to reliably estimate flash floods and establish a flash flood early warning system. The authors with the second largest number of published papers are Kirstetter and Schumacher [89], who had extensive cooperation and also carried out research in hydrology and meteorology. Schumacher et al. mainly researched atmospheric science and hydrometeorology, and he proposed a conceptual model of extreme rainfall processes near the middle atmospheric circulation [94].

3.4. Citation Analysis of Documents

From the perspective of analyzing the number of documents cited, this paper describes and analyzes the distribution structure of documents cited in early identification of flash flood disasters, and carried out statistics on the number of documents cited in this field from 1991 to 2022, as shown in Figure 8. It can be seen from the time of document citations that the number of documents cited from 1991 to 2007 increased steadily but was relatively small as a whole, which is consistent with the trend of documents published in Figure 2, showing that although early scholars began to pay attention to this field, there were fewer research results in this period of time and the number of documents cited was relatively low due to the backwardness of monitoring and calculation at that time. Thanks to the development of sensor and computer technology, the number of documents cited has shown a rapid growth trend since 2008. More advanced early identification technology of flash flood disaster has been gradually mastered by people, and scholars have carried out further research this field.
The highly cited documents are an important knowledge base in a research field, reflecting the research hotspots in this field, and are an important basis for exploring the research context and development direction. If a document is highly cited in a period of time, it means that this document has higher quality and greater influence, and can be used as a key reference for learning and research. Table 3 lists the top 5 highly cited documents in early identification of flash flood disasters. The document ranked first has been cited 581 times, and it is a comprehensive document describing the use of convection permissive models (CPMs) for regional climate modeling in order to provide more reliable regional-to-local climate information. The second-ranked document is also representative of the slow-moving phase of the field. As this document has played an important role in solving the problem of lack of data in this field with its rich flash flood disaster database, it has been cited many times. Although covering many aspects, this document was published in 2010, and the extreme flash flood events in this document occurred early, which not only made it difficult to meet the needs of early warning of flash flood disasters that continue to occur every year, but also made it difficult to adapt to the urgent needs of constantly developing early identification technology for updating the flash flood database. Therefore, this document put forward the necessity of updating the flash flood data sample database.

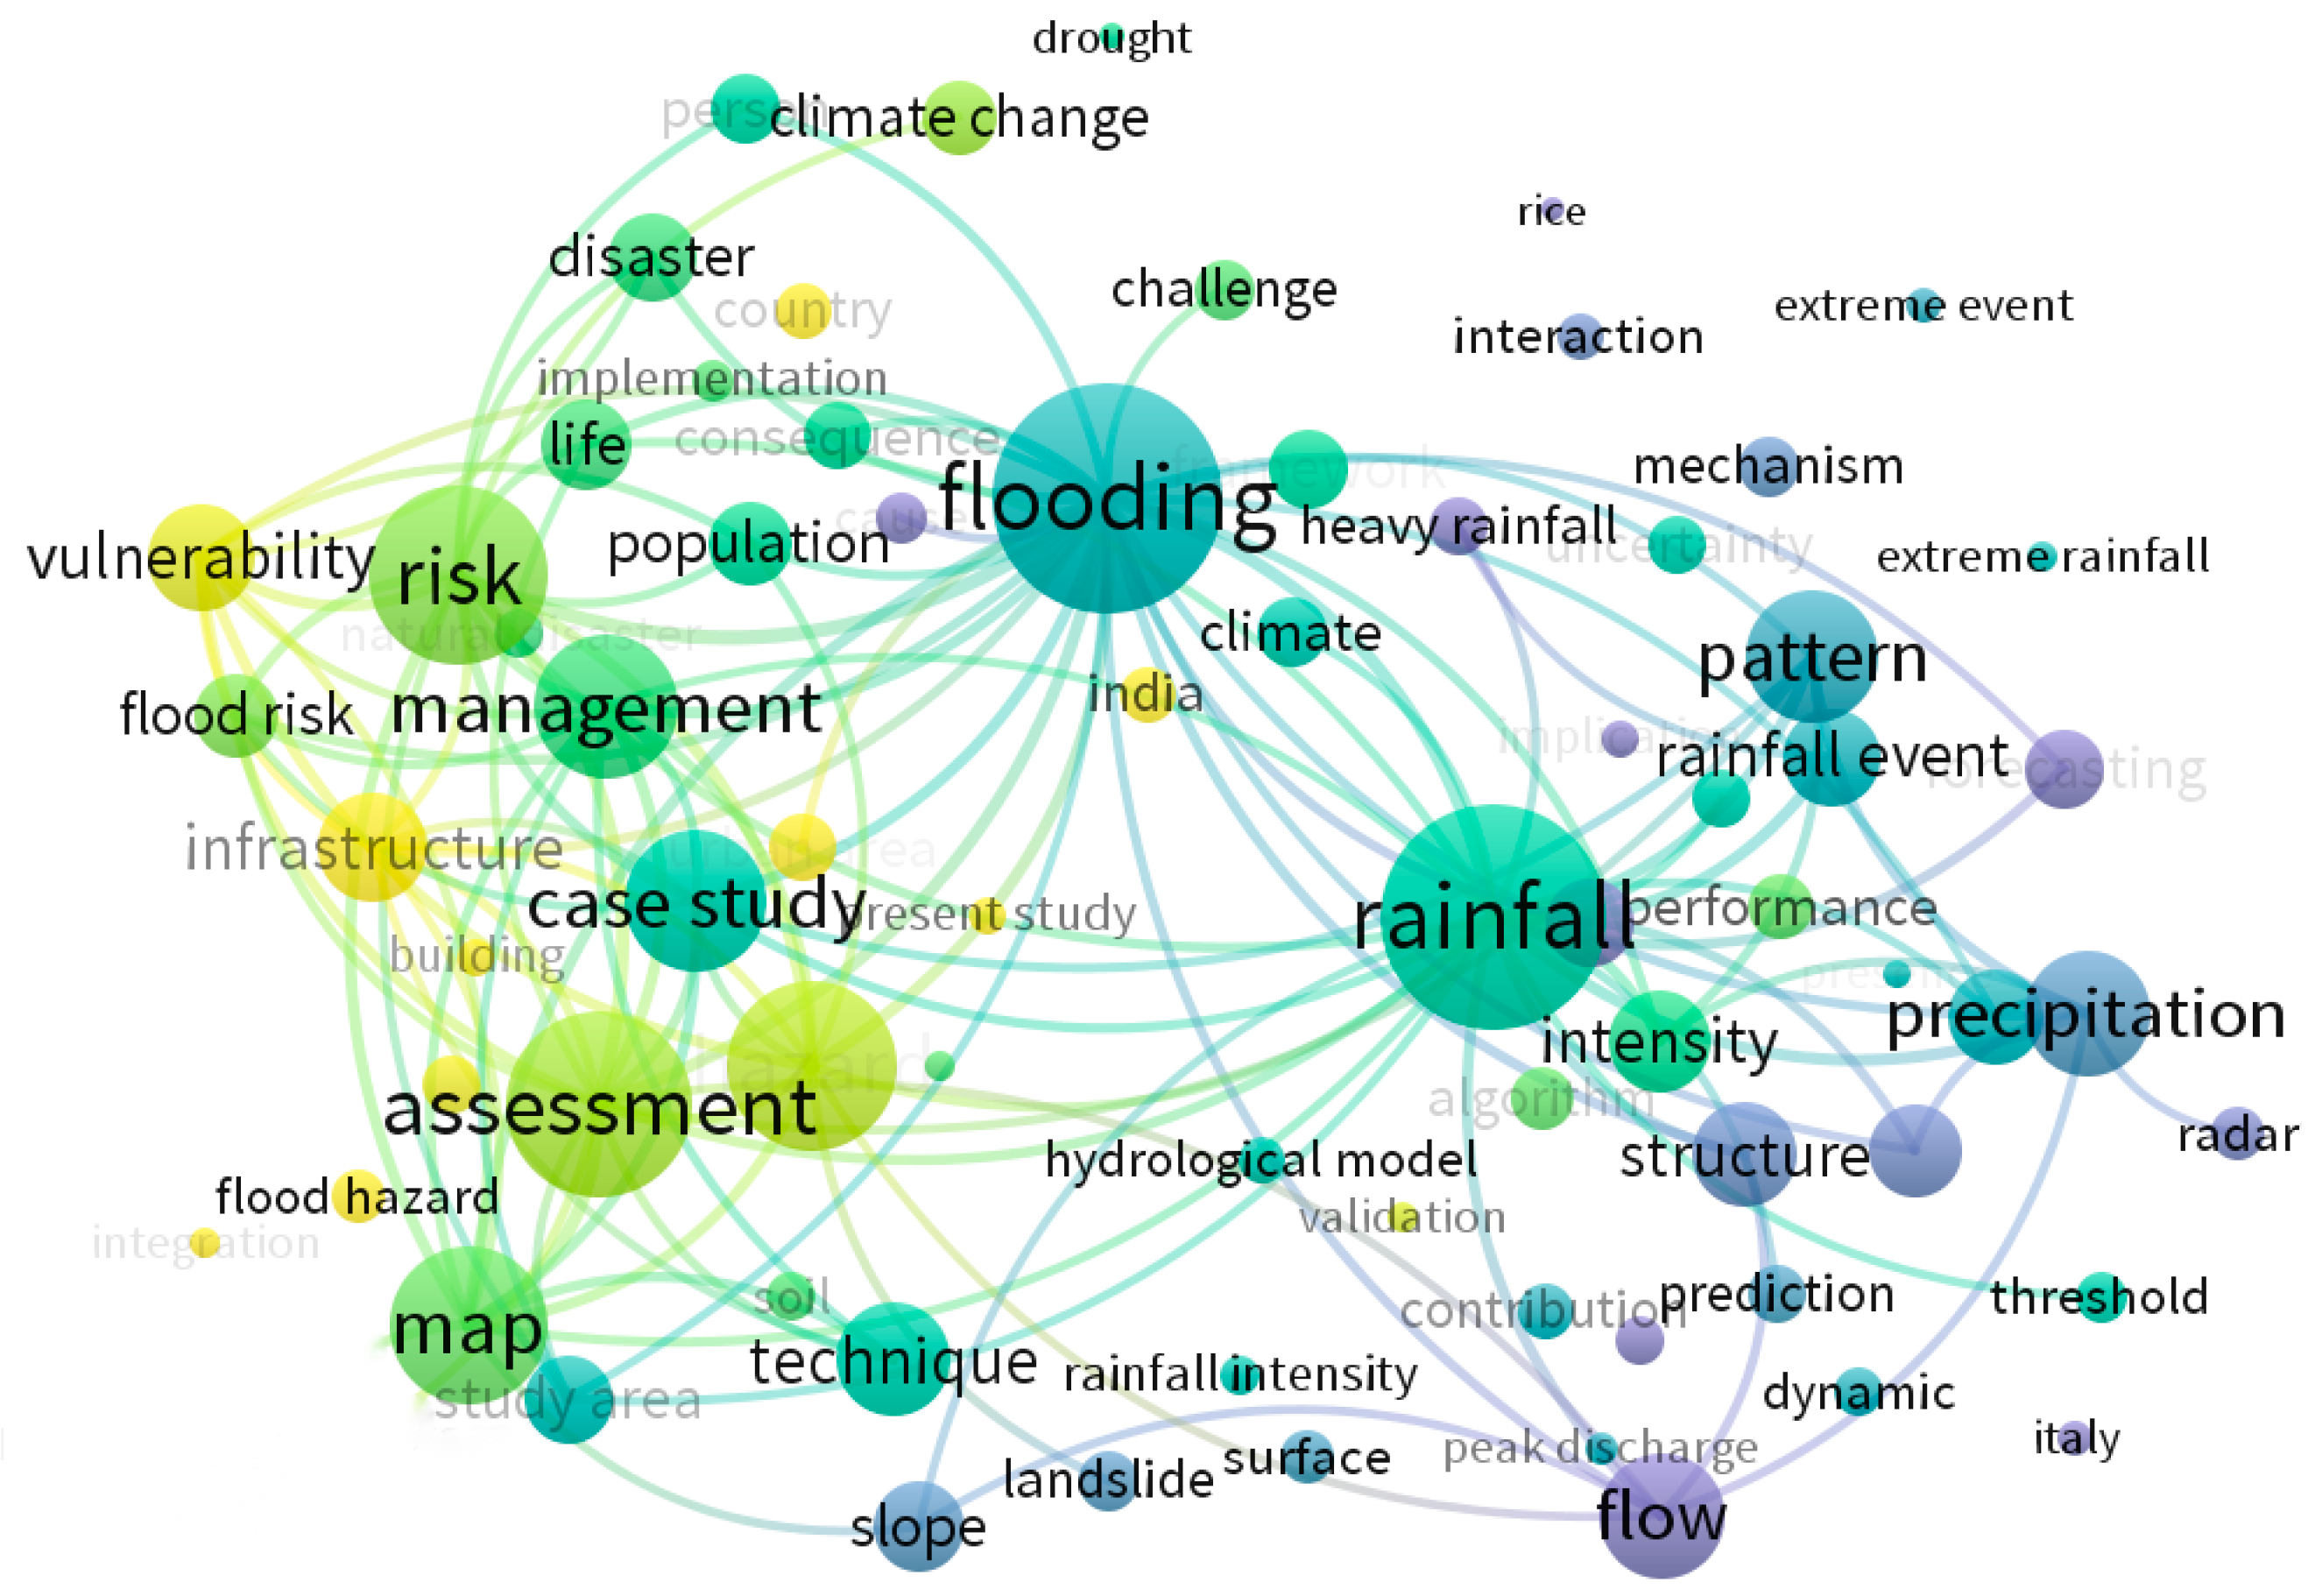
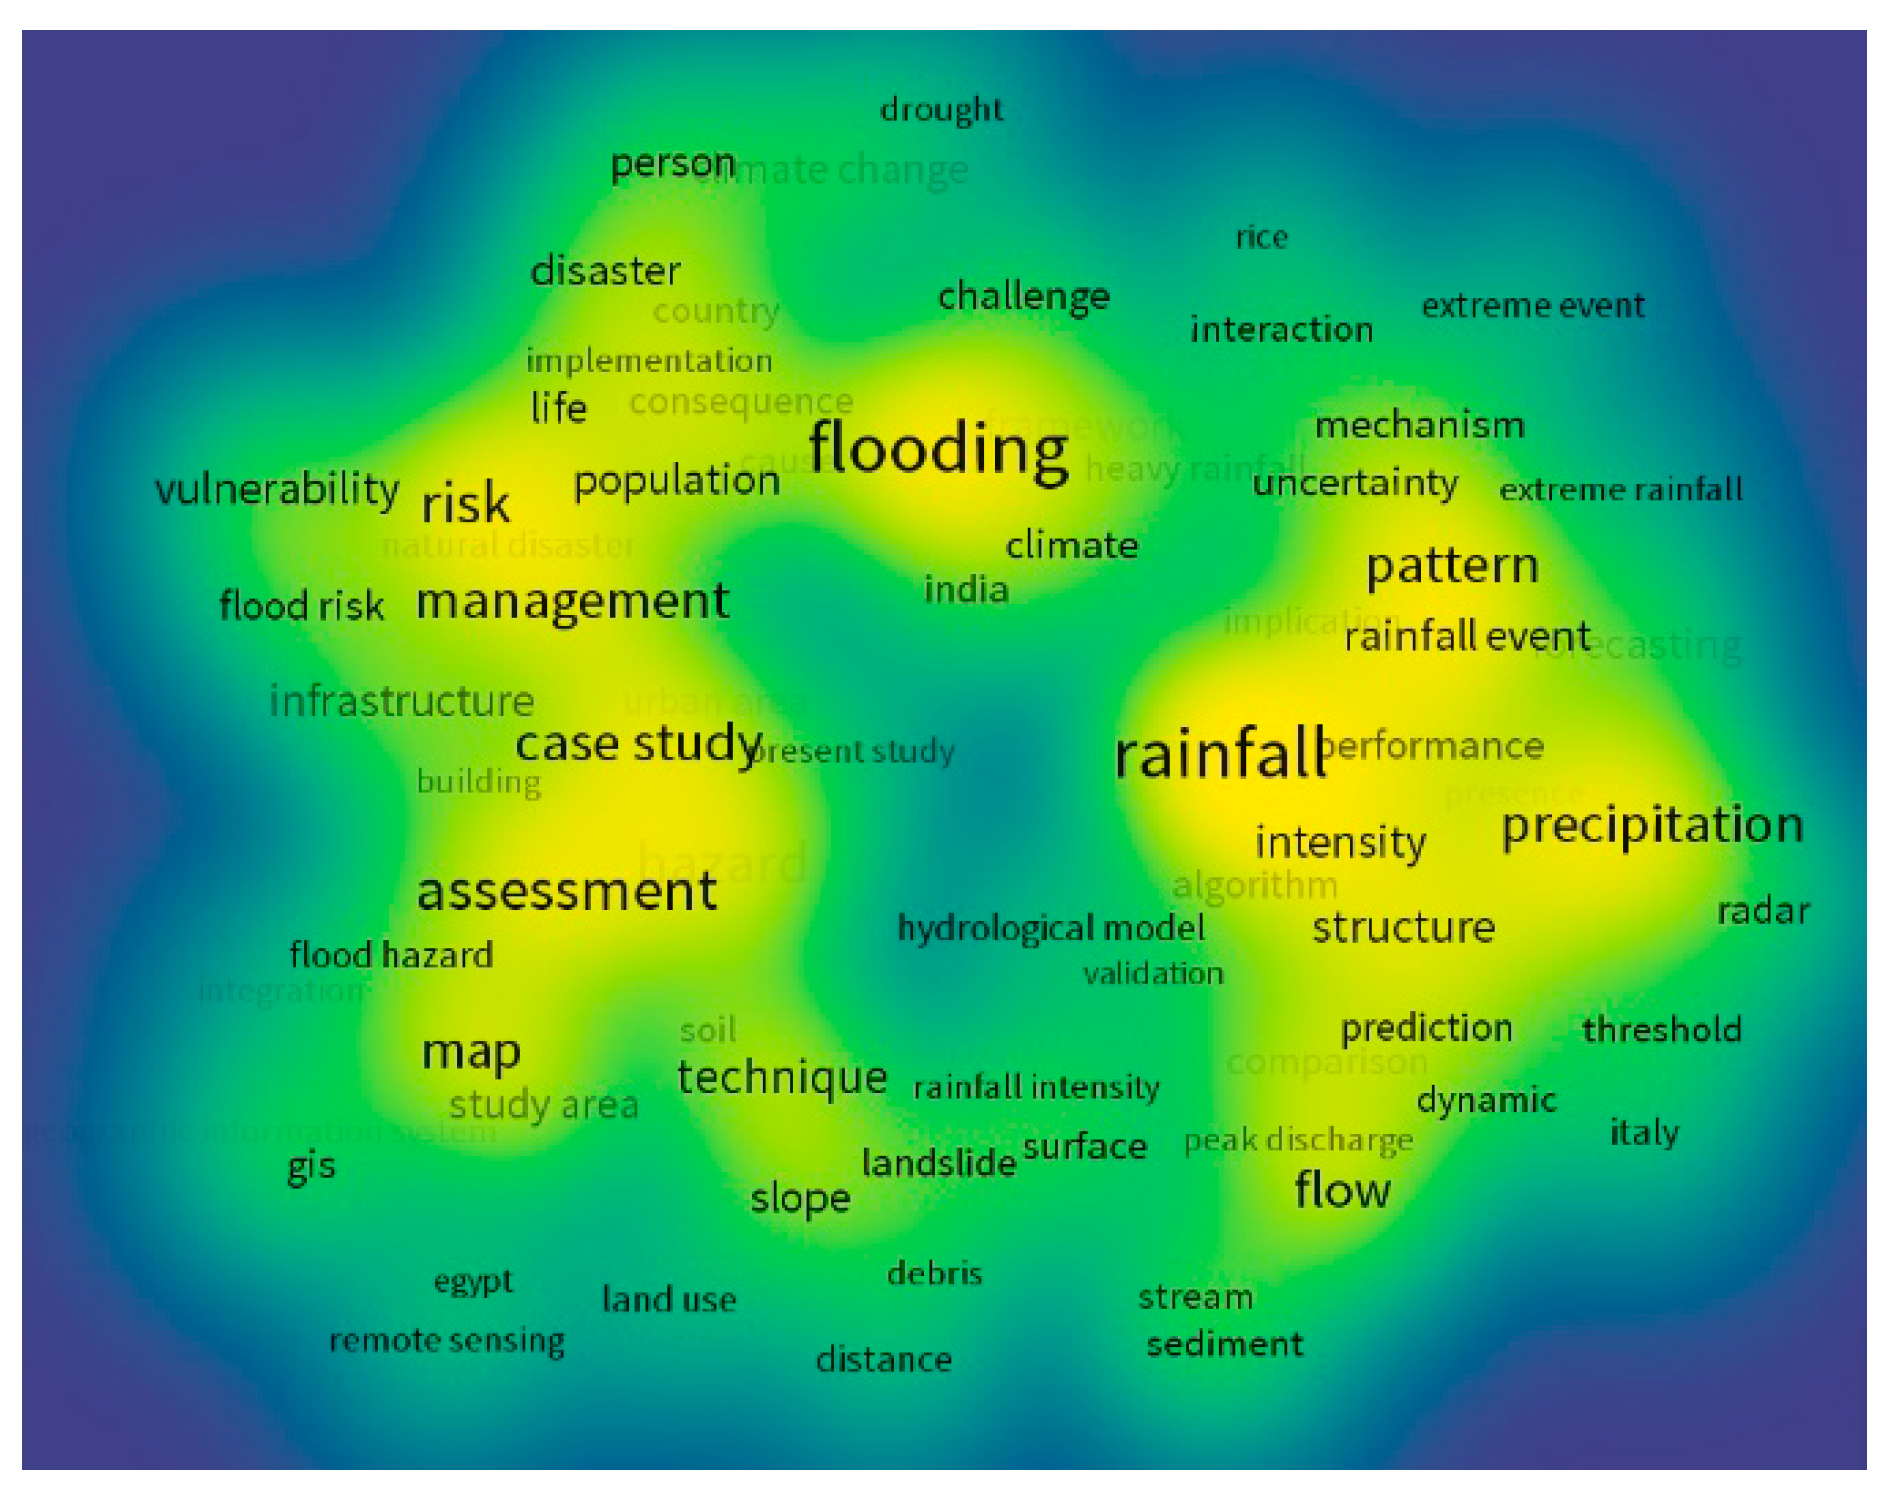
3.5. Keywords Analysis

This paper makes a visual analysis of the keywords in documents related to flash flood disasters from 1991 to 2022 through the comprehensive use of VOSviewer (version 1.6.7) to obtain the research progress, hotspots, and cutting-edge trends in this field. As shown in Figure 9 using “overlay visualization”, the text box and the label form an element, and the element color represents the cluster to which it belongs. Different clusters are represented by different colors, and the same color represents a cluster. The shorter the distance between two adjacent nodes is, the closer the relationship between two adjacent nodes will be. The view also has a timeline view function. As can be seen from the legend in the lower right corner, the colored band from blue to yellow represents the time sequence of keywords. Surface runoff, machine, and GIS technique are the keywords that appear at the end, showing the development trend of this field.
The mutation keywords refer to the keywords whose frequency changes sharply in a certain period of time [55,56,57,58]. The detection of mutation words is used to detect words with a sudden increase in frequency in some years. Keywords with a sudden increase in frequency growth rate in some years (whether high-frequency words or low-frequency words) are more likely to reflect local hotspot changes in a certain field and represent the research frontier in this field. This study carries out the burst test of the keywords in early identification of flash flood disasters from 1995 to 2022 by using CiteSpace (version 5.8.R3) burst detection technology. The specific parameter configuration is as follows: set the time division to 1 year, select the source of subject headings as “Title”, select the co-word analysis type as “Non Phrases”, select the network type as “Term, Keyword and Reference”, set the threshold value as the default value, prune the time zone segmented network with “Minimum Spanning Tree” in the pruning scheme, and draw the visual chart of mutation analysis after extracting the research frontier terms by running the option of burst detection (Burstness) in the control panel, as shown in Figure 10. The label line consists of six parts, in which the strength line represents the mutation intensity of the keyword. The greater the intensity is, the higher the frequency of occurrence of the keyword in the mutation time period is; begin and end lines, respectively, represent the start and end time of the keyword mutation. The formed time period is the time when the keyword becomes the hotspot frontier. The thick red line below the time period refers to the heat, that is, the time that the word became a hotspot.
Figure 10 shows the start and end years and the emergence intensity of keywords in the field of early identification of 25 flash flood disasters. From 1995 to 2001, no new words appeared except for the mutation keyword of “storm”, which is consistent with the small number of documents published in this period, shown in Figure 3. After the research on the early identification technology of flash flood disaster entered the development stage, the mutation word “heavy precipitation” began to appear in 2002, which was also an earlier research content, with a longest duration of 7 years and a larger intensity of 2.91; “resolution” appeared in the same period and lasted longer (13 years), but its mutation intensity was weaker than that of “heavy precipitation” (2.38 < 2.91); in less than eight years from 2014 to 2022, a total of 22 mutation keywords appeared successively, which also proved that the division method of judging whether the research in this field has entered the stage of rapid development through the number of documents published is appropriate. The new mutation words such as “dynamic”, “debris flow”, and “rainfall” appearing successively in this stage indicated that the new research content in the field of early identification of flash flood disaster was developing in a diversified direction. In particular, the contents that were still continuously researched as of May 2022, such as “risk assessment”, “morphometric analysis”, and “machine learning”, were also the research focus at present and in the future, and would be undoubtedly hotspot issues worthy of attention and in-depth research in the field of early identification of flash flood disasters.

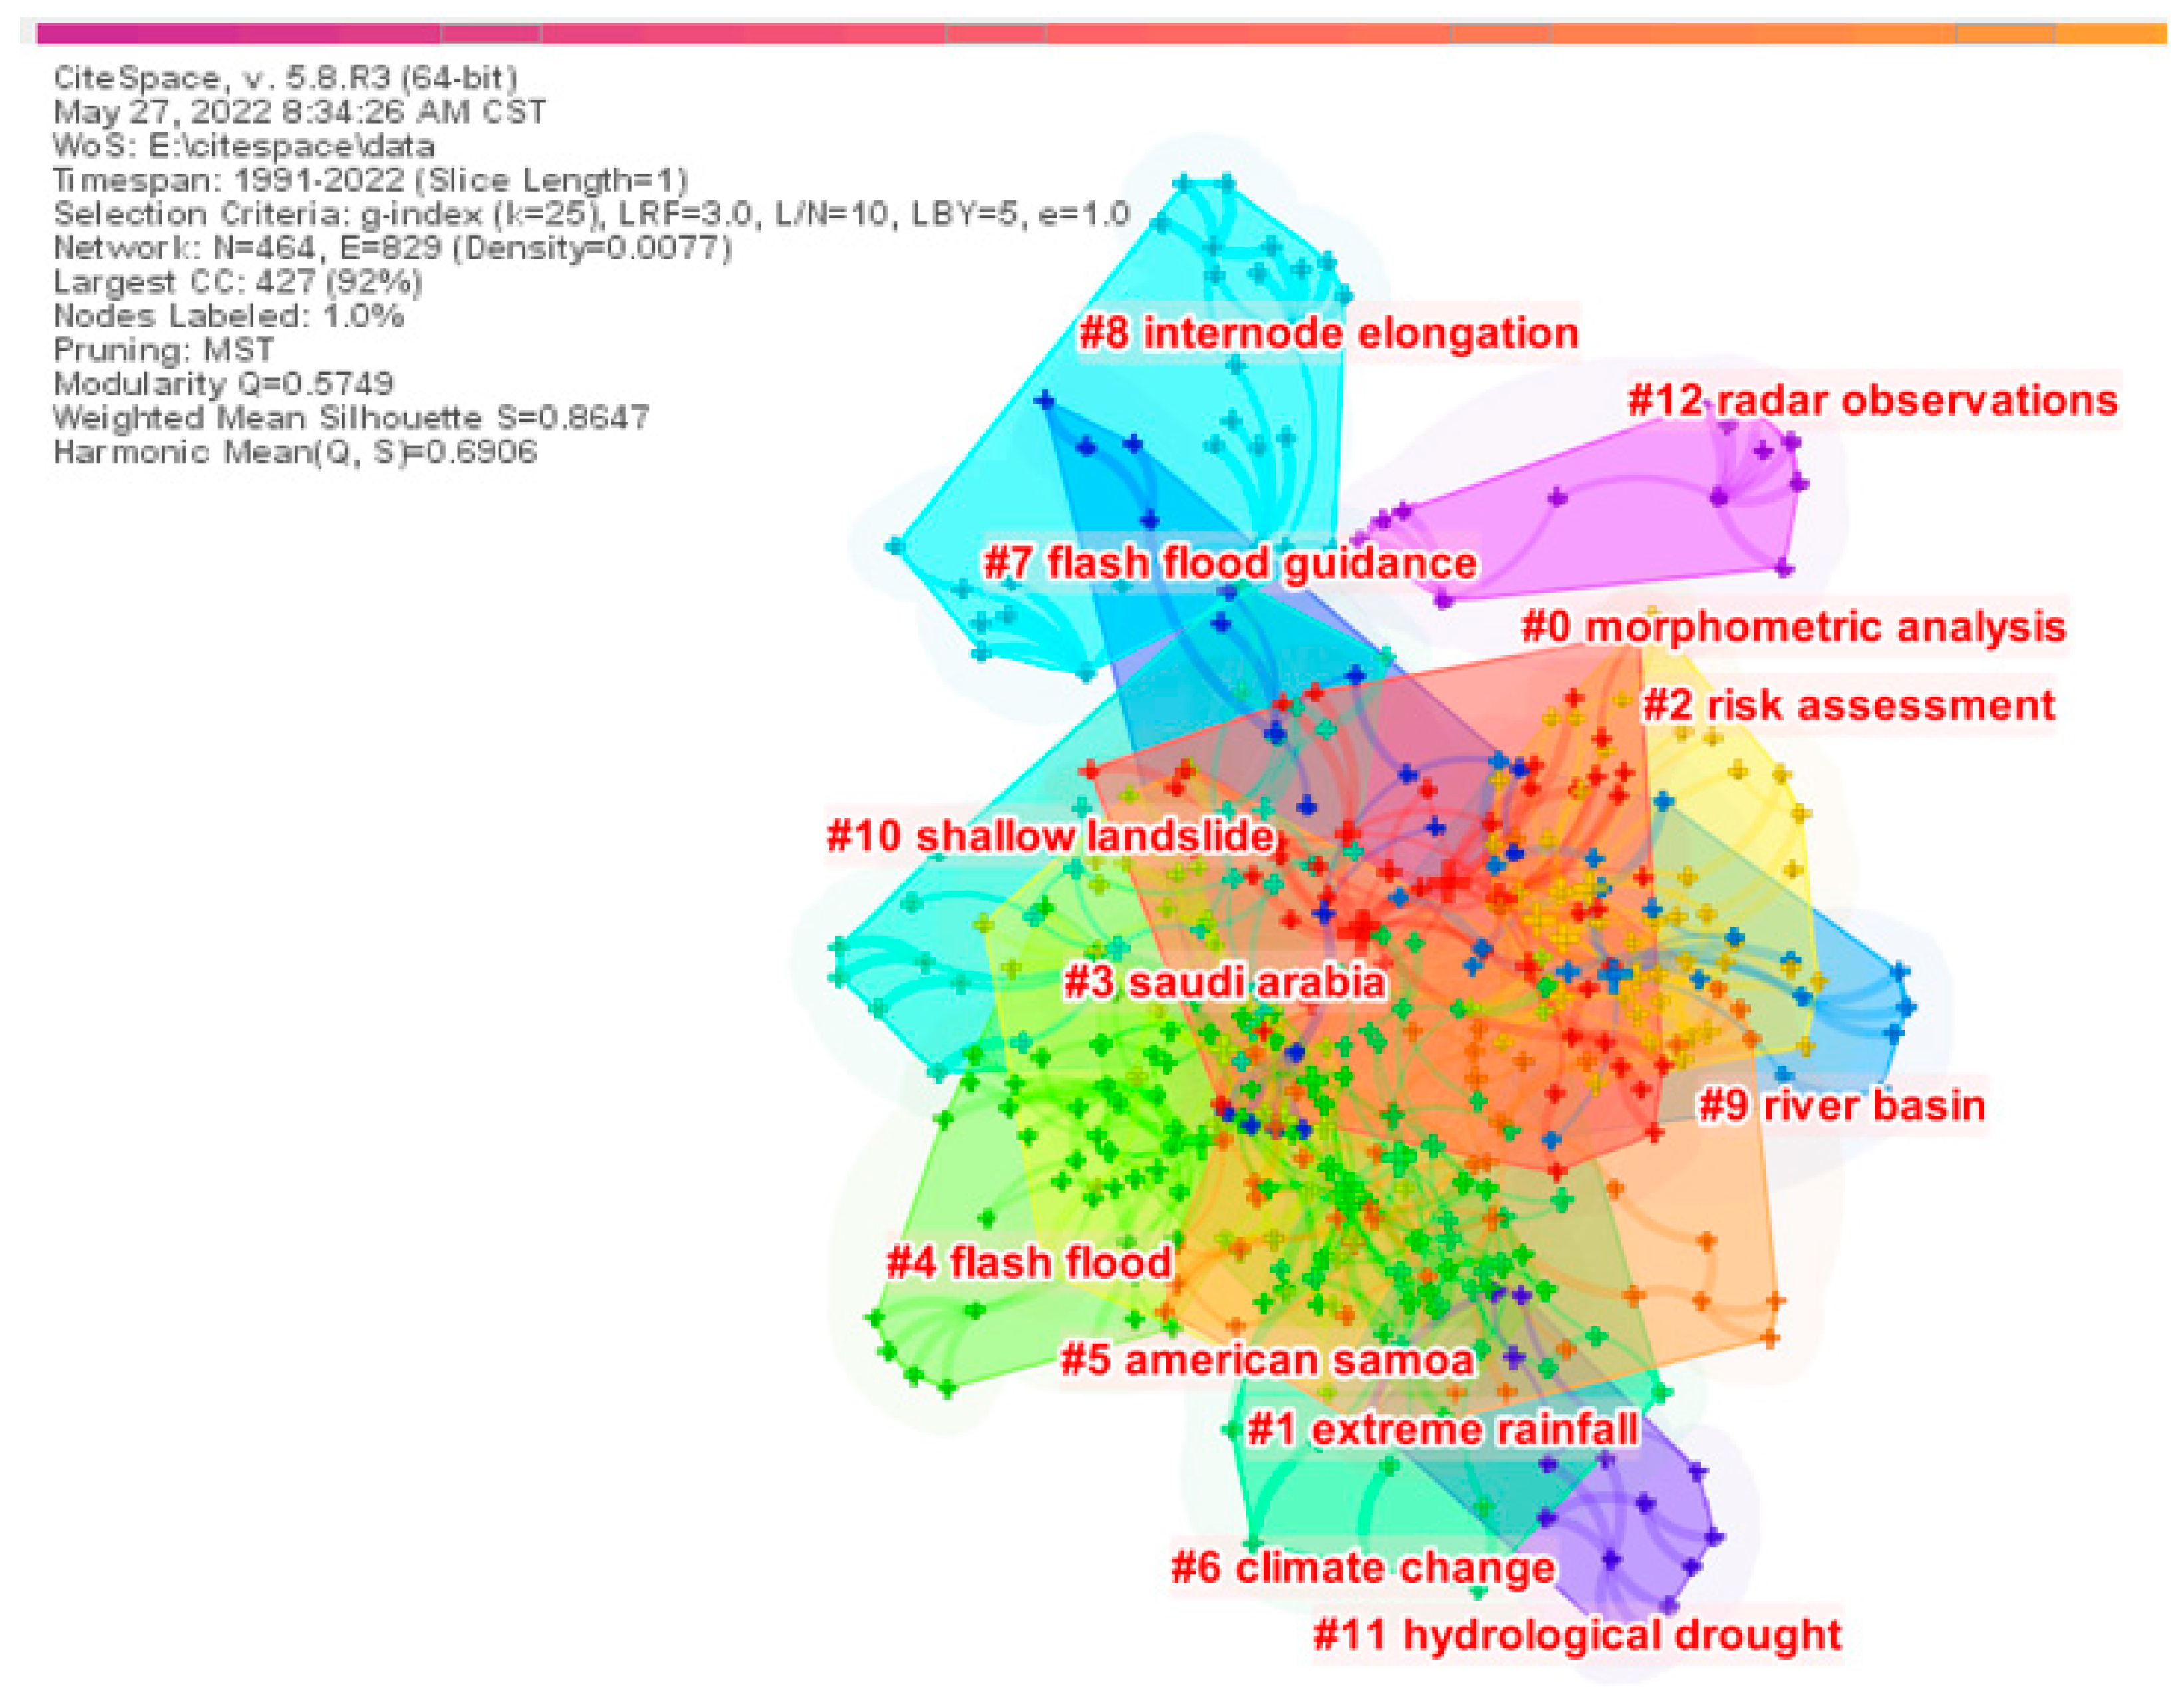
3.6. Cluster Analysis of Research Hotspots

As a characteristic function of VOSviewer, the visualization method of a density map uses the total frequency or total co-occurrence frequency of nodes to measure the weight of nodes, so as to intuitively reflect the frequency density of co-occurrence between high-frequency words [54]. The basic principle is that the keyword density mainly depends on the number of knowledge units around a knowledge unit and the weight of these knowledge units. The more surrounding nodes there are, the shorter the distance between these nodes is, and the higher the density will be. The greater the weight of the node is, the higher the density is. In order to find the research focus and hotspots in the field of early identification of flash flood disaster more intuitively, we further draw the keyword co-occurrence density view, as shown in Figure 11. Blue and yellow in the figure are used to represent the density near a subject, and each node displays different colors according to its density. The more concentrated the nodes near another node are, the greater its weight is, and the closer its color to yellow will be; otherwise, its color will be closer to blue. Taking “map” as the center, three important research areas have been formed, and other research areas such as “warning” have also received high attention. These main keywords have been taken as the center to form some related research hotspots, which has constituted the basic research pattern in the field of early identification of flash flood disasters.
In addition, the cluster analysis of research hotspots is a multiclass analysis process that integrates keywords into keywords with similar meanings [55,56,57,58], and is based on analyzing the similarity of keywords. We cluster the co-occurrence analysis map of keywords in periodical documents and mark the formed clusters. There are three clustering marking algorithms in Citespace: latent semantic label (LSI), log-likelihood ratio (LLR), and mutual information (MI). According to the content and characteristics of this study, the LLR log maximum likelihood algorithm is selected for keyword cluster analysis to filter smaller clusters and retain only larger clusters, forming a total of 18 larger clusters. According to the criteria for cluster determination, the greater the value Q of the map information module is, the better the clustering results. When Q > 0.3, the cluster community structure is significant; when the map contour coefficient S > 0.5, the clustering result is reasonable; when the map contour coefficient S > 0.7, it means the clustering is convincing. As shown in the upper left corner of Figure 12, when Q = 0.5749 > 0.3 and S = 0.8647 > 0.7, the clustering structure is significantly efficient and convincing. As shown in Figure 12, some clusters are hidden because they have low correlation with the research content of this paper. Each node represents a keyword, and the connecting line represents the common line of keywords. Different colored blocks represent different clusters, and the cluster size is inversely proportional to the cluster number. Cluster names are the keywords that appear most frequently in each cluster. These clusters reflect the research hotspots in the field of early identification of flash flood disasters, and are closely overlapped and coincide with each other in practical research.

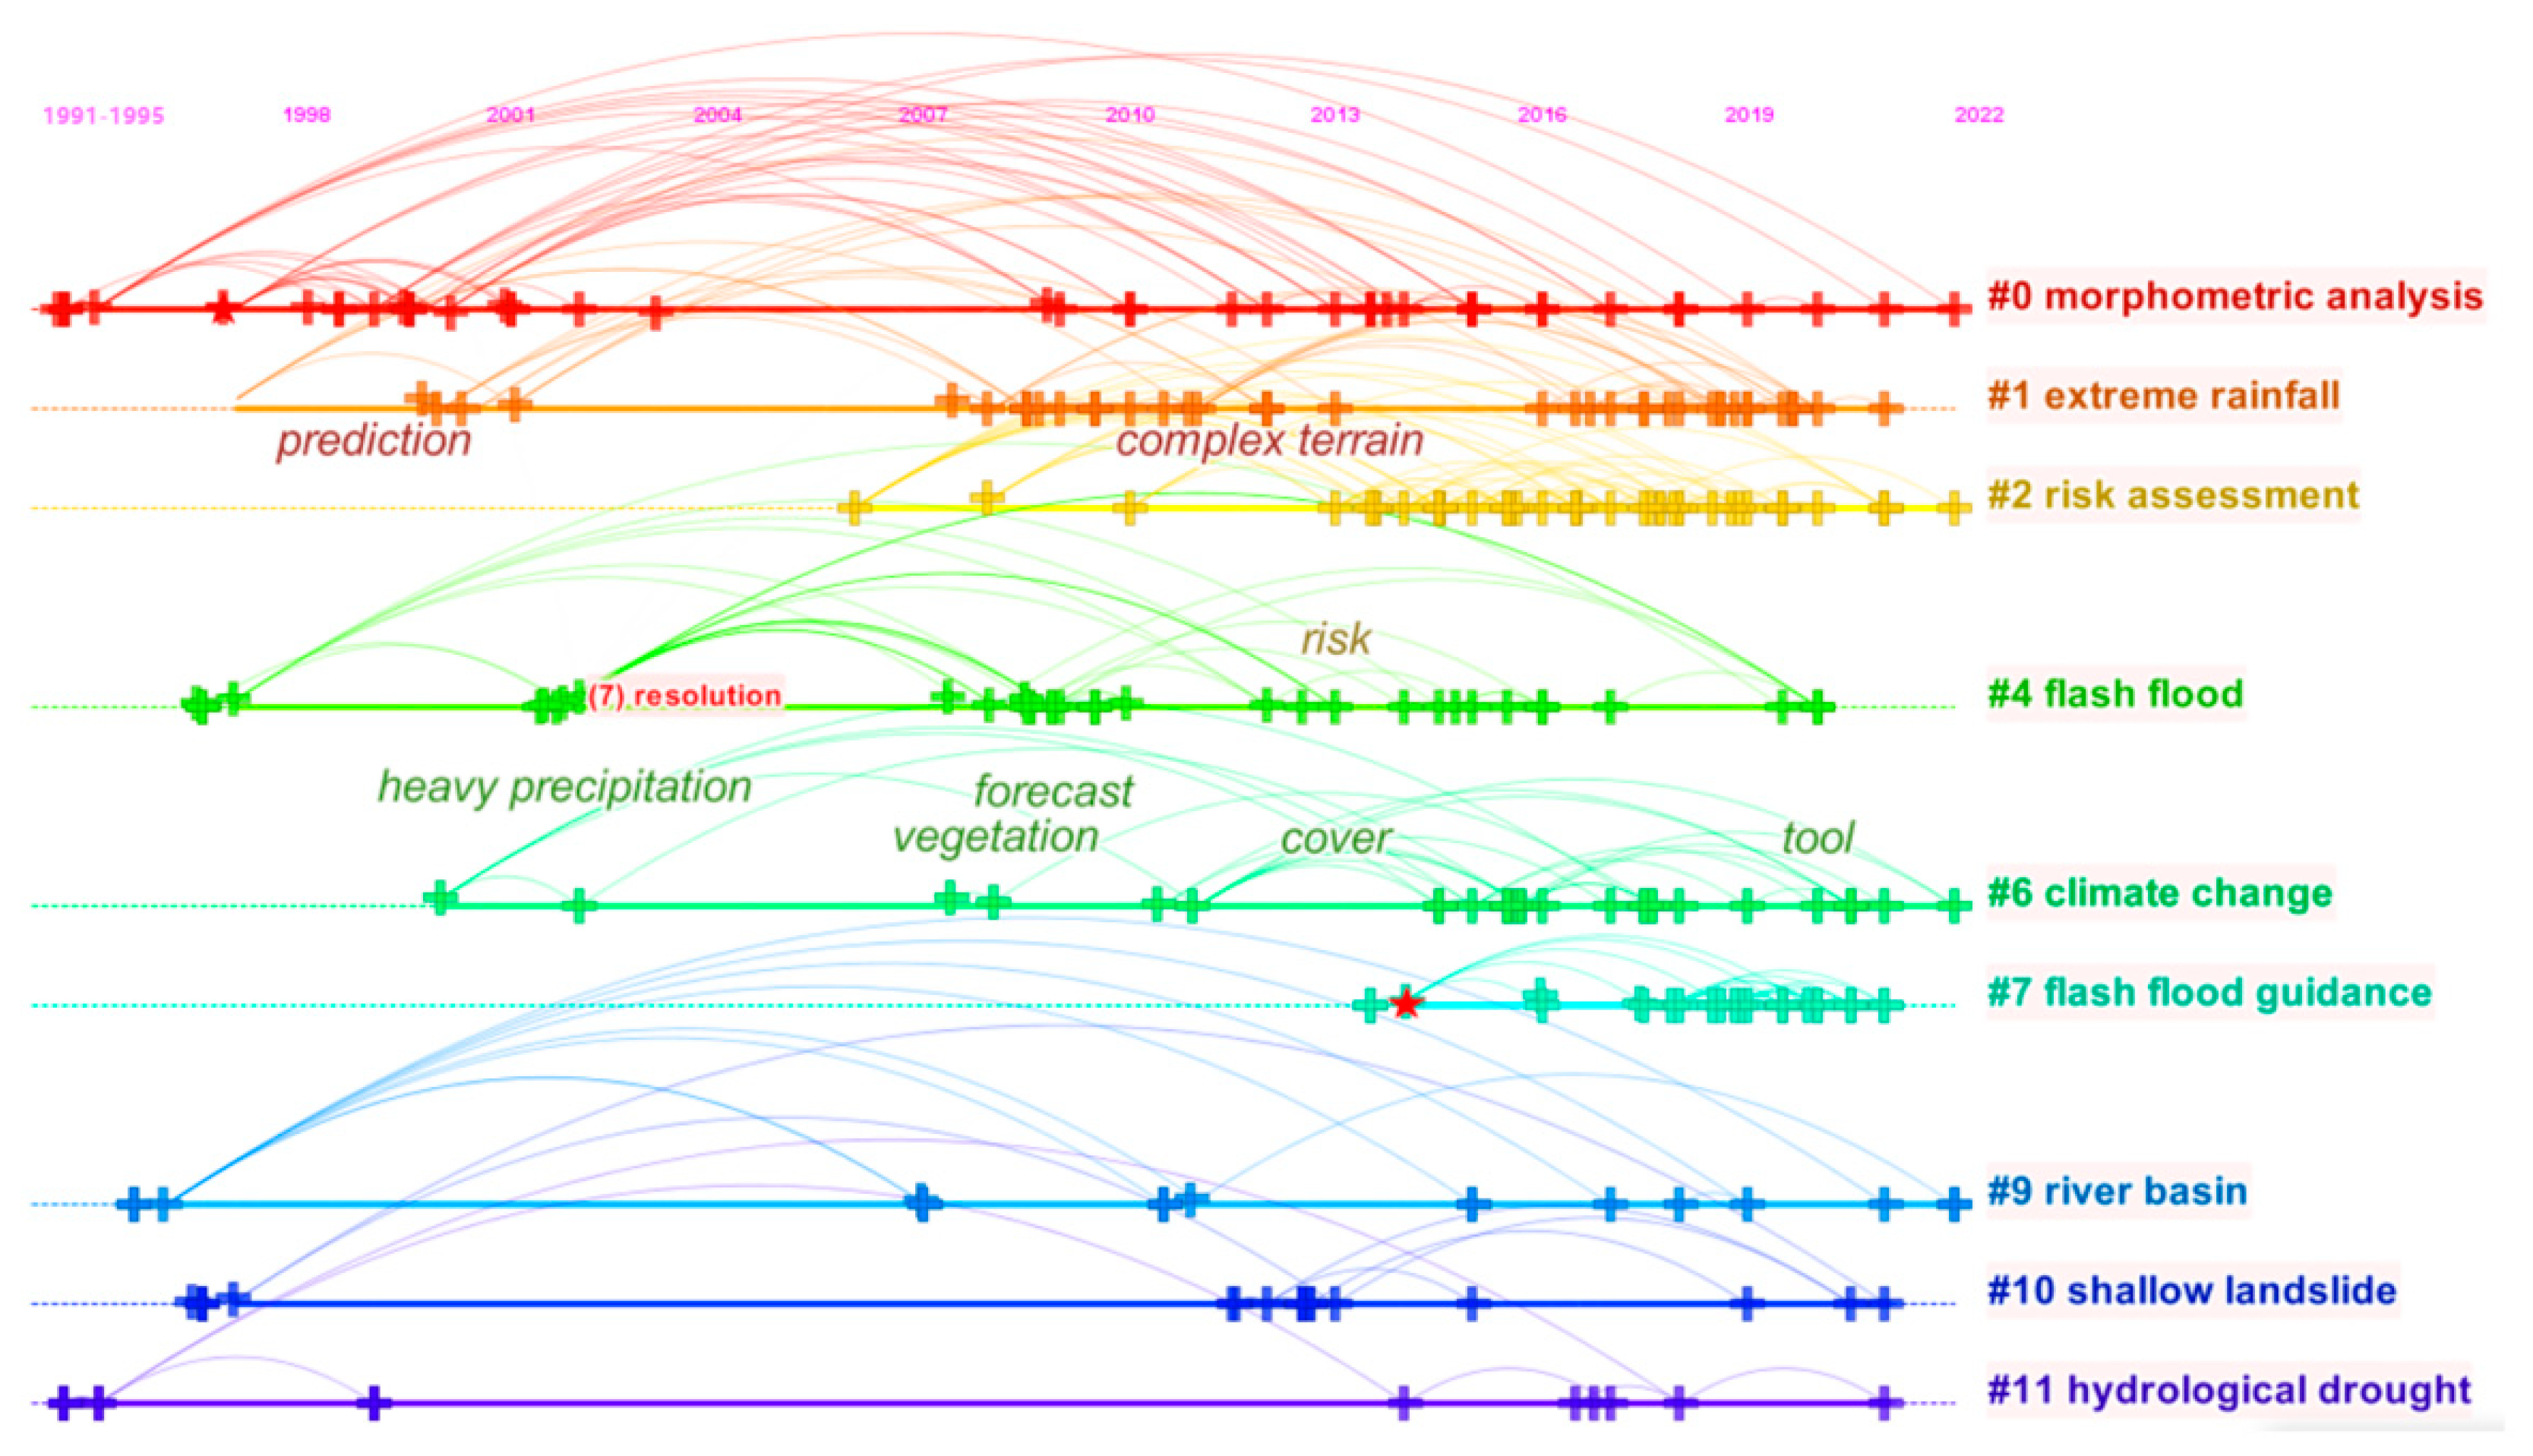
3.7. Analysis of Development Trend

To further analyze the future research trend in the field of early identification of flash flood disasters, another function of CiteSpace software called “TimeLine” mode [55,56,57,58] can be used to run the documents from 1994–2022. The analysis of the core words co-citation timeline is shown in Figure 13. The clusters unrelated to this research are hidden, but only seven clusters with strong correlation are retained. The horizontal axis is the time span, while the vertical axis is the cluster partition. Each node represents different keywords. This figure can explain the evolution law of keywords on the timeline well. The size of the arc span in the figure represents the span time of its keywords.
The timeline view in Figure 13 of research development trends displays the evolution of research contents in the field of early identification of flash flood disasters in the time dimension, and divides all keyword clusters into multiple categories, which clearly shows the development process of each research direction. As continuous research from 1991 to 2022, #0 morphometric analysis had a large number of nodes and most abundant research content; the research on #10 shallow landslide and #11 hydrological drought had significantly reduced numbers of nodes in the past two years, and showed a shrinking trend. However, although the research in the several directions of #6 climate change started later, the research contents were quite rich and have continued until now, which would also be a hot research direction in the future.

4. Research of the Subfields

By combining meta-analysis, keyword mutation analysis, research hotspot analysis, and other methods, this paper describes a comprehensive analysis and finds that the primary problem of early identification of flash flood disaster is to accurately identify the precipitation. As precipitation and sediment movement interact with each other, another important problem of early identification of flash flood disaster is to consider the impact of water level rise due to sediment deposition. In addition, sensitivity analysis and mapping of disaster-causing factors are the basis of disaster risk assessment and uncertainty analysis. Therefore, through comprehensive consideration, this paper divides the research in the field of early identification of flash flood and sediment disasters into the following five subfields: precipitation impact, sediment impact, sensitivity analysis and mapping, risk assessment, and uncertainty analysis.

4.1. Precipitation

Precipitation is a phenomenon in which the water vapor in the atmosphere falls to the ground in the form of liquid and solid water after condensation [98]. Its uneven spatial distribution and instability over time are the direct causes of flash floods. It is also the source of surface runoff [99] and may lead to a surge in the runoff, causing catastrophic damage to protected objects and significant changes in landform. It is very important to deeply understand the meaning of rainstorms with complex and nonlinear behavior, identify and control the development of the threshold based on hydrological theory [100], and accurately evaluate and predict flash flood risk. Therefore, in the early identification of flash flood disaster, it is necessary to fully consider the impact of precipitation, and focus on how the spatial variability of rainfall affects the severity of flash floods. A better understanding of the spatial variability of rainfall will help to describe and identify the characteristics of flash floods and identify the driving factors and interactions of major disasters in the research area. Meanwhile, it is also necessary to focus on the rainfall intensity. The basin landform inhibits the impact of lower rainfall intensity, while higher rainfall intensity overwhelms other factors as a key factor, resulting in flash floods.
Based on Figure 14, this paper uses a pennant diagram of precipitation keywords for key node Precipitation, as shown in Figure 14a. The “Precipitation” node involves many research contents. The closer the keyword is to “precipitation”, the stronger the correlation between the research content and “precipitation” will be. Therefore, it can be found that “event”, “climate change”, and “flash flood” are most relevant research contents, because flash floods are caused by rainfall, and precipitation is the direct and key factor of flash flood disaster. The function of Node Details can also be used to make conclusions about the outbreak of the published time sequence of the keyword “precipitation” according to occurrence times of the keyword. As shown in Figure 14b, the number of documents published shows an upward trend on the whole. The keyword “precipitation” was interrupted for many years in the early stage, but it began to continuously appear in a large number of documents after 2019, indicating that the research in this direction has begun to regain vitality, and “precipitation” will still be a hot research direction in the future.
Precipitation remote sensing and numerical weather prediction are the basis of the forecasting system for flash flood disasters [101]. The early identification of flash flood disasters requires not only precipitation prediction in a very short time, but also precipitation data with high spatial and time resolution [102]. Due to the high spatial discontinuity [103] of rainfall events in depth and intensity, and the lack of long-term high-resolution rainfall observation, it is challenging to accurately estimate rainfall values. Due to its limitations, the traditional manual identification method needs a lot of time to obtain a large amount of data, which greatly limits the amount of data used for feasibility analysis in the research. In recent years, geospatial data represented by remote sensing images and other relevant data sets were used to generate various thematic data sets through complex algorithms, and the more representative methods are shown in Table 4.

4.2. Sediment

A large number of flash flood disaster events showed that large flash floods would cause major disasters, and small flash floods would also cause major disasters under the influence of sediment [47]. After experiencing many flash flood disaster events, people found that due to the rapid changes in flash floods, the coupling of flash flood and sediment movement in mountainous areas would lead to severe disasters. The coupling effect of sediment and flash flood was often the key factor that led to major flash flood disasters, which often led to disastrous consequences of “small flash flood and large disaster”. Heavy rainfall triggered many collapses and landslides, and a large number of low-viscosity loose clastic sediments were suspended in steep bank slopes and ditches, providing sufficient material sources for flash flood disasters. The flood and sediment disaster was mostly manifested as a complete chained disaster process of “rainstorm–flash flood–surge in sediment supply–gully bed response–water level rise–disaster”. The flood disaster and sediment disaster were often interwoven to form flash flood and sediment disaster, which was mainly manifested in the cumulative erosion and deposition at inappropriate locations caused by the change in sediment transport law. The easily silted river reach is shown in Figure 15.

4.3. Sensitivity Analysis

Sensitivity analysis is an important means of risk identification and management for flash flood disasters [107]. Flash flood sensitivity mapping has been regarded as the basic stage of flash flood early identification and risk reduction. As many influencing factors are involved, it is easy to misjudge the flash flood disaster by using a single sensitivity analysis method. To date, there has been no method that can be applied to the flash flood sensitivity analysis and mapping in all regions, and the specific selection of analysis methods is often determined by many factors, such as the data type, research object, and research area. At present, there are various sensitivity analysis methods (as shown in Figure 16), which can be generally divided into four categories: experience driven, data driven, mechanism driven, and intelligence driven.
(1)
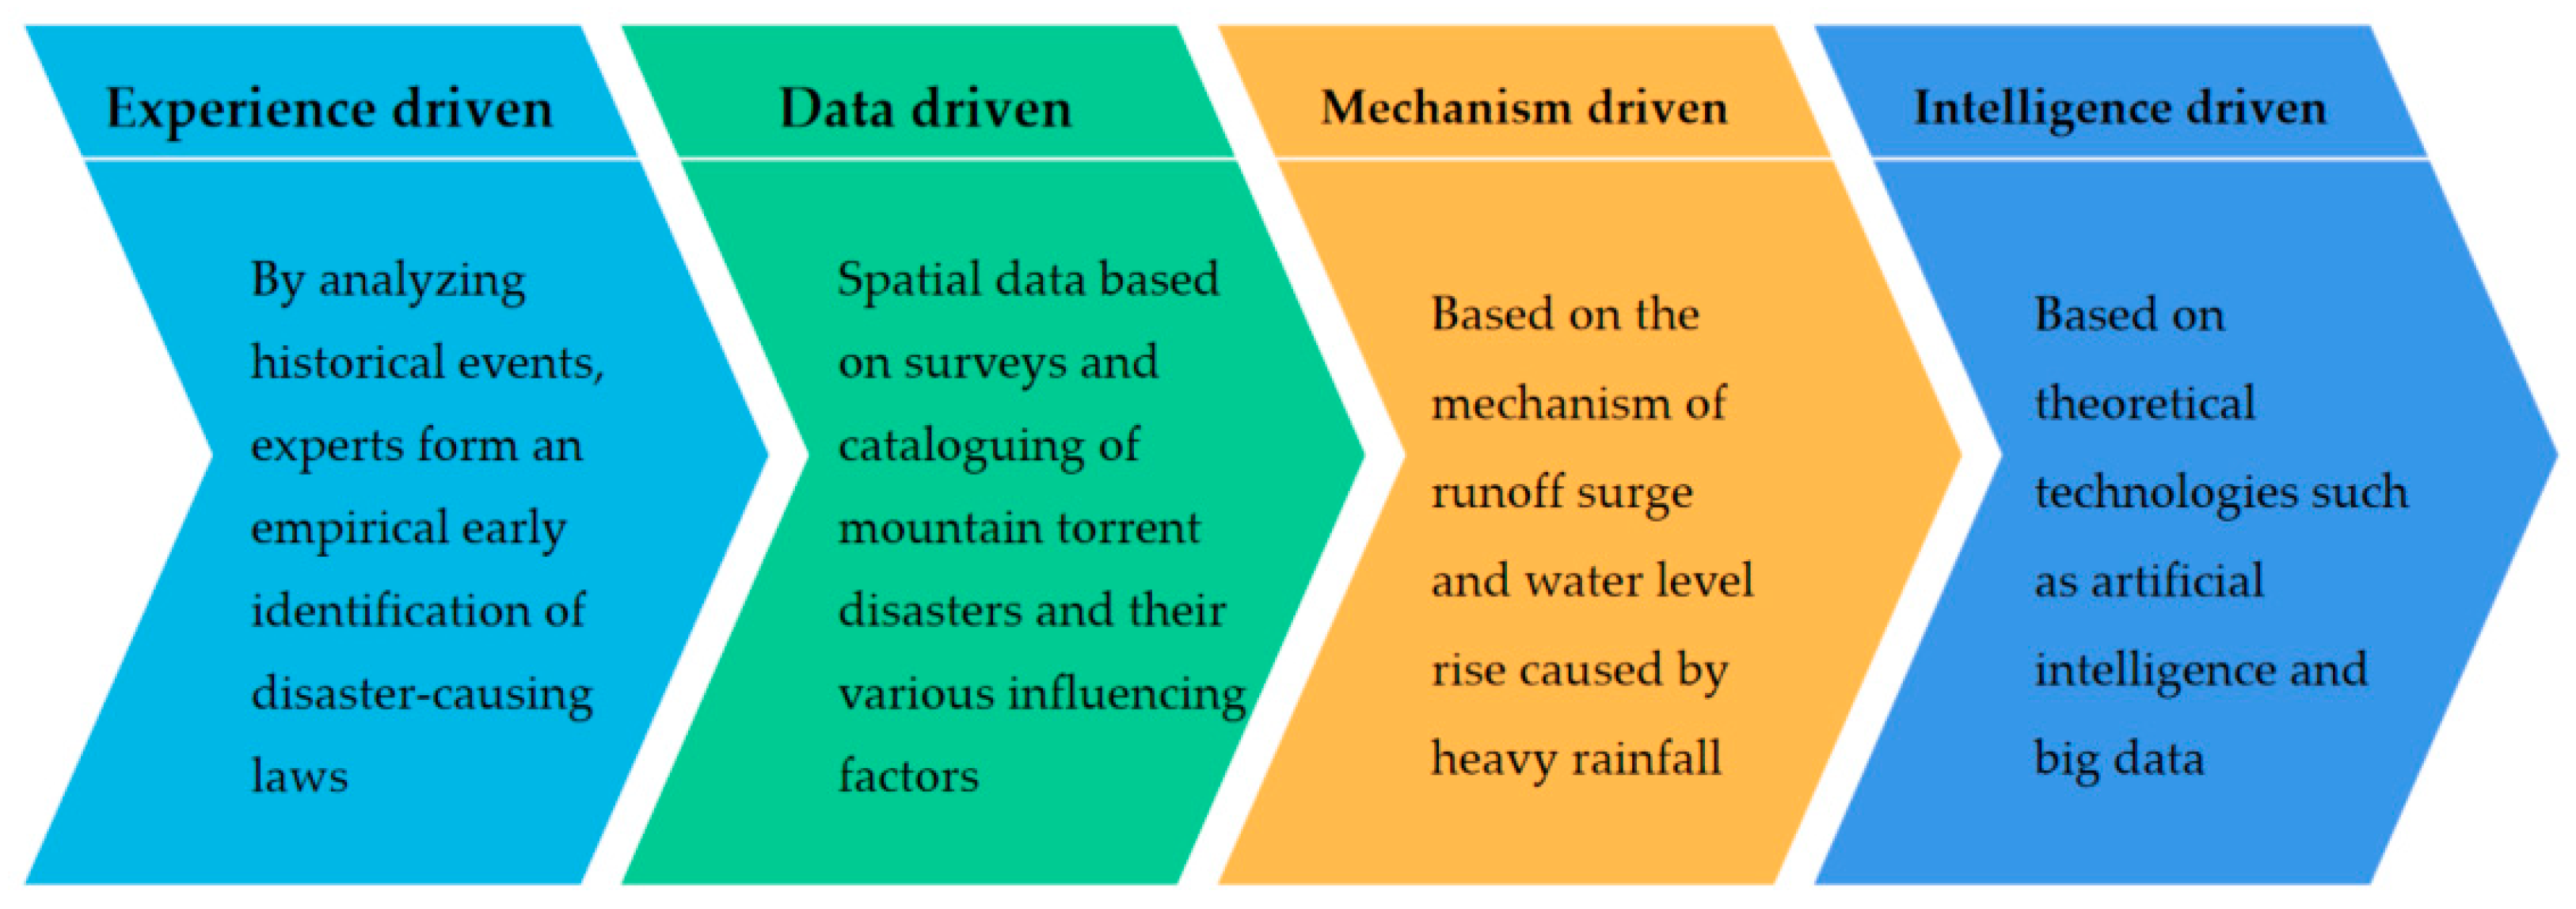
Experience-driven model: It forms its own experience and understanding of the early identification of flash flood disasters based on the qualitative technology and expert knowledge, and puts forward the weight of the contribution of various factors to the occurrence of flash flood disaster, but it is limited in its range of application and low in accuracy due to its inherent subjectivity [108].
(2)
Data-based flash flood object-oriented model: It relies on the analysis data to identify the relationship between independent flash flood-related variables and flash floods, mines and quantifies the correlation between flash floods and various single factors by statistical analysis methods related to spatial analysis or mathematical regression, such as information quantity, evidence weight, cluster analysis, etc., and predicts the risk of flash flood disaster through the comprehensive analysis of multiple factors. The data used in the data-driven model include not only maps, remote sensing images, digital databases, and other data, but also hydrological statistical data obtained or derived, as well as spatial data of basin geographical features such as geology, soil, and land utilization, all of which can be integrated into a GIS environment for sensitivity analysis and mapping [109].
(3)
Mechanism-driven model: It obtains rainfall conditions, terrain and landform conditions, solid material source conditions, and other series of quantitative parameters formed by flash flood disasters by means of investigation, mapping, and geophysical exploration, and quantitatively calculates the characteristic parameters of flash flood disaster sensitivity mapping through theoretical analysis, physical modeling, numerical simulation, and other technical methods according to the relevant theories of hydrometeorology, river dynamics, and sediment dynamics to realize sensitivity analysis and mapping of early identification for flash flood disasters [110].
(4)
Intelligent-driven model: It makes a sensitivity analysis and mapping according to the development law of flash flood disaster, selects reasonable evaluation indexes and quantifies them, and then performs data cleaning and sample set construction and finally establishes a flash flood disaster sensitivity evaluation model based on artificial intelligence algorithms such as artificial neural networks, deep learning method, decision tree, and support vector machine through sample training, so as to identify and predict potential flash flood disaster units [111].
The above four analysis methods have their own advantages and disadvantages, and they often need to be used comprehensively and complement each other. The typical cases of these four analysis methods in sensitivity analysis and mapping of early identification of flash flood disasters are shown in Table 5.

4.4. Risk Assessment

Risk assessment refers to the probability or possibility of flash flood disasters occurring in a certain area and time period through the comprehensive action of dynamic inducing factors such as rainfall, earthquake, and engineering activities on the basis of sensitivity analysis [14]. Comprehensive risk assessment is very important for comprehensive and efficient flash flood management [116]. Risk assessment reflects the severity of local flash floods and can identify areas vulnerable to flash floods; it has been proved to be an effective tool for managing [117] and mitigating flash flood disasters and can help to improve the flexibility of disaster reduction plans. For example, one of the multicriteria decision-making methods is used to assess the risk of flash floods, identify small river basins with high flash flood risk, and prioritize the risk of flash floods, so as to decide how to allocate resources and select the best recovery plan in the research area. There are many influencing factors that can cause flash floods, and the risk assessment of flash flood disasters involves all aspects of the research area, so many factors such as rainfall, terrain, and population shall be considered. In addition, flash floods generally occur in unmeasured catchment areas. Due to the lack of spatially well-distributed rainfall or flow data and the incompleteness of many important information data, it is often difficult to correctly assess the risk of flash floods. Therefore, in order to reduce the dependence on data, a new conceptual framework has been proposed to expand the application of the vulnerability index in damage level prediction by using a comprehensive multiparameter method, which is the first step [118] in strengthening flash flood disaster prediction to support risk reduction in areas with scarce data. For the research on the risk assessment of flash flood disasters, the document statistical results have shown that the research on risk assessment methods of flash flood disasters has made great progress. Scholars have researched flash flood disaster assessment from different perspectives, and achieved some useful results. Table 6 shows several representative models of risk assessment of flash flood disasters.

4.5. Uncertainty Analysis

For the early identification of flash flood disaster, focus is needed on different spatial ranges (basins, administrative regions, and monitoring points) and different research objects (rainfall estimation, flash flood process, time response), and an early identification system of flash floods by using historical flash flood disaster location, weather radar data, DEM, land utilization, and other data according to different impact factor combinations (rainfall, underlying surface, social economy, current situation of flood control capacity, etc.) and different model (hydrological model, weather forecast model, intelligent learning model, etc.) tests [122]. The system is essentially a highly complex nonlinear system [123] with uncertainty, as shown in Figure 17. For example, the traditional observation systems of rainfall, water flow, and sediment discharge cannot monitor the development of flash flood disasters on the time and space scales. Therefore, a lack of knowledge on the atmospheric, hydrological, and geomorphic control of these hydrological and geomorphic processes will result in highly uncertain early warning and risk management. Indirect peak discharge estimation after flash floods provides key information for promoting the understanding of hydrometeorological process of flash floods, especially when the peak observation is combined with flash flood simulation in hydrological models. However, the estimation of indirect peak flow is affected by significant uncertainty, which will be amplified when flash floods are related to important geomorphic processes [124].
From the aspect of document statistics, the research on the uncertainty analysis of flash flood early identification mainly focuses on three terrain areas (namely, basin, mountain, and hill) [125], but less on the flat and plateau terrain; in terms of rainfall in the research area, arid and semi-arid areas are the key research areas. Due to the unique landform conditions and the influence of the high rolling of surrounding ridges, mountainous areas are more likely to experience flash flood disasters than cities. When the airflow on the windward slope of the mountain is forced to rise, it will cause the atmosphere to rise. If the slope of the hillside is very steep and the wind speed orthogonal to the mountains is strongly separated, the effect of terrain can cause heavy precipitation. The rising movement of the atmosphere after precipitation caused by steep terrain is the direct cause of rainstorms. Therefore, mountainous areas are the key areas for uncertainty analysis and research. As the research has rarely involved cities, it was not until 2020 that some scholars built an integrated socio-economic vulnerability index (ISEVI) [126] for urban areas and verified it with the uncertainty of the Monte Carlo method. As there were many influencing factors of uncertainty and the research objects were very rich, such as rainfall estimation, flash flood process, and space–time response, Wang et al. [127] analyzed the sensitive factors such as mean slope of basin, soil moisture, average width of main stream, and basin shape, and the result showed that VFM and cross entropy can be jointly used to identify the sensitive factors related to flash flood disaster in unmeasured basins of small hills. Due to the lack of hydrological, meteorological, and geospatial information and other data, especially in areas where the data are scarce and the measurement of the catchment areas is poor, the existing monitoring network cannot record highly dynamic and small-scale rainstorms well, so the uncertainty analysis is hindered. For example, if spatial and temporal rainfall patterns with insufficient identification [128] are used, there will be uncertainty in distributed rainfall runoff modeling, which will underestimate the amount of rainfall and runoff received in the catchment area. In order to solve this problem, some scholars have proposed a reverse hydrological modeling method for randomly reconstructing the spatial and temporal rainfall model, and found that this spatial and temporal rainfall mode is reasonable after the real-world research of flash flood events in arid mountainous areas.

5. Conclusions

This study adopts a variety of bibliometric methods and knowledge graph technologies, conducts a meta-analysis and visual analysis of the literature in the past 31 years, and systematically summarizes the progress and trends of early identification technology of flash flood disasters. Our outcomes are presented as follows:
(1)
The numbers of papers published on early identification of flash floods, and their citation, have increased dramatically in the last 10 years (Figure 3 and Figure 8). Those papers come from numerous research centers (Figure 5) and are distributed across a wide array of publication outlines (Figure 6). Node and keyword analysis indicates that primary research areas include precipitation/rainfall and risk management/assessment (Figure 9 and Figure 11).
(2)
It is necessary to establish the conditions for the occurrence of different types of disasters by investigating rainfall information of typical flash floods that have occurred, and combine them with physical rainfall experiments so as to establish the discrimination conditions for early identification of rainfall impact in areas prone to flash flood and sand disasters.
(3)
When research on the early identification of flash flood disasters is performed, it is necessary to fully consider the role of sediment, focus on the role of mutual feedback of water and sediment, and study the flash flood movement and sediment movement as a disaster system.
(4)
As the multisource data are obtained by different measurement methods and means, there are considerable differences in data format, spatial resolution, and coordinate system. Therefore, a unified standard should be established before the basic data are used for flash flood disaster identification sensitivity analysis and mapping.
(5)
Comprehensive consideration should be given to the inclusion of multiple factors in the scope of risk assessment when the risk assessment is made. Since different early identification methods have their own advantages and disadvantages, they need to complement each other and be used in combination. Considering the different characteristics of disaster sites and disaster areas, corresponding research methods should be adopted according to different research objects.
The results of this study show that, in the past 31 years, although people have made great progress in the field of early identification of flash floods, flash flood disasters have the characteristics of burstiness and uncertainty. Therefore, there are still many problems to be solved, such as unclear formation mechanism of flash flood disasters, immature early identification theory, and imperfect early identification technology. Relying on a single discipline to solve these complex problems is challenging. In the future, early identification technology in hydrology, geology, remote sensing, artificial intelligence, and other disciplines will have broad application prospects. In particular, the application of artificial intelligence in this field will help improve the level of forecasting and early warning, and it is also a research area for our further investigation.

Author Contributions

Z.Y. and H.L. drafted the manuscript and were responsible for the research design, experiment, and analysis. C.L. and L.M. reviewed and edited the manuscript. X.Y., R.N., T.L., X.D., M.T. and Y.X. supported the data preparation and the interpretation of the results. All of the authors contributed to editing and reviewing the manuscript. All authors have read and agreed to the published version of the manuscript.

Funding

This research was supported by the National Key R&D Program of China (2019YFC1510700), the National Natural Science Foundation of China (41701499), the funding provided by the Alexander von Humboldt-Stiftung, the Sichuan Science and Technology Program (2018GZ0265), the Geomatics Technology and Application Key Laboratory of Qinghai Province, China (QHDX-2018-07), the Major Scientific and Technological Special Program of Sichuan Province, China (2018SZDZX0027), and the Key Research and Development Program of Sichuan Province, China (2018SZ027, 2019-YF09-00081-SN).

Institutional Review Board Statement

Not applicable for studies not involving humans or animals.

Informed Consent Statement

Not applicable for studies not involving humans.

Data Availability Statement

The data that support the findings of this study are available from the corresponding author upon reasonable request.

Conflicts of Interest

The authors declare no conflict of interest.

References

  1. Das, M.K.; Islam, A.; Karmakar, S.; Khan, M.J.U.; Mohammed, K.; Islam, G.M.T.; Bala, S.K.; Hopson, T.M. Synoptic flow patterns and large-scale characteristics of flash flood-producing rainstorms over northeast Bangladesh. Meteorol. Atmos. Phys. 2020, 132, 613–629. [Google Scholar] [CrossRef]
  2. Youssef, A.M.; Abu-Abdullah, M.M.; Abu AlFadail, E.; Skilodimou, H.D.; Bathrellos, G.D. The devastating flood in the arid region a consequence of rainfall and dam failure: Case study, Al-Lith flood on 23rd November 2018, Kingdom of Saudi Arabia. Z. Fur Geomorphol. 2021, 63, 115–136. [Google Scholar] [CrossRef]
  3. Johnson, J.P.L.; Whipple, K.X.; Sklar, L.S. Contrasting bedrock incision rates from snowmelt and flash floods in the Henry Mountains, Utah. Geol. Soc. Am. Bull. 2010, 122, 1600–1615. [Google Scholar] [CrossRef]
  4. Dwivedi, S.K.; Chandra, N.; Bahuguna, S.; Pandey, A.; Khanduri, S.; Lingwal, S.; Sharma, N.; Singh, G. Hydrometeorological disaster risk assessment in upper Gori–Ramganga catchment, Uttarakhand, India. Geocarto Int. 2022, 1–16. [Google Scholar] [CrossRef]
  5. Singh, D.S. Surface processes during flash floods in the glaciated terrain of Kedarnath, Garhwal Himalaya and their role in the modification of landforms. Curr. Sci. 2014, 106, 594–597. [Google Scholar]
  6. Joshi, D.D. Geoenvironmental problems of the glacial belt of Bhutan Higher Himalaya and remedial measures: A case study of Raphstreng lake in Lunana area. J. Geol. Soc. India 2001, 57, 65–76. [Google Scholar]
  7. Vieira, I.; Barreto, V.; Figueira, C.; Lousada, S.A.N.; Prada, S. The use of detention basins to reduce flash flood hazard in small and steep volcanic watersheds–a simulation from madeira island. J. Flood Risk Manag. 2018, 11, S930–S942. [Google Scholar] [CrossRef]
  8. Genova, M.; Mayer, P.; Ballesteros-Canovas, J.; Rubiales, J.M.; Saz, M.A.; Diez-Herrero, A. Multidisciplinary study of flash floods in the Caldera de Taburiente National Park (Canary Islands, Spain). Catena 2015, 131, 22–34. [Google Scholar] [CrossRef]
  9. Psomiadis, E.; Tomanis, L.; Kavvadias, A.; Soulis, K.X.; Charizopoulos, N.; Michas, S. Potential dam breach analysis and flood wave risk assessment using hec-ras and remote sensing data: A multicriteria approach. Water 2021, 13, 364. [Google Scholar] [CrossRef]
  10. French, J.; Ing, R.; Vonallmen, S.; Wood, R. Mortality from Flash Floods—A Review of National Weather Service Reports, 1969–1981. Public Health Rep. 1983, 98, 584–588. [Google Scholar] [PubMed]
  11. Braud, I.; Borga, M.; Gourley, J.; Hurlimann, M.; Zappa, M.; Gallart, F. Flash floods, hydro-geomorphic response and risk management. J. Hydrol. 2016, 541, 1–5. [Google Scholar] [CrossRef] [Green Version]
  12. Borga, M.; Stoffel, M.; Marchi, L.; Marra, F.; Jakob, M. Hydrogeomorphic response to extreme rainfall in headwater systems: Flash floods and debris flows. J. Hydrol. 2014, 518, 194–205. [Google Scholar] [CrossRef]
  13. De Franco, M.; Minniti, M.; Versaci, R.; Foti, G.; Canale, C.; Puntorieri, P. Flash Floods in Urban Areas: Case Studies in Reggio Calabria (Italy). In Proceedings of the International Conference on Urban Drainage Modelling, Palermo, Italy, 23–26 September 2018; pp. 441–446. [Google Scholar]
  14. Dejen, A.; Soni, S. Flash flood risk assessment using geospatial technology in Shewa Robit town, Ethiopia. Modeling Earth Syst. Environ. 2021, 7, 2599–2617. [Google Scholar] [CrossRef]
  15. Lincoln, W.S.; Thomason, R.F.L. A preliminary look at using rainfall average recurrence interval to characterize flash flood events for real-time warning forecasting. J. Oper. Meteorol. 2018, 6, 13–22. [Google Scholar] [CrossRef]
  16. Zhou, Q.Q.; Su, J.H.; Leng, G.Y.; Peng, J. The role of hazard and vulnerability in modulating economic damages of inland floods in the united states using a survey-based dataset. Sustainability 2019, 11, 3754. [Google Scholar] [CrossRef] [Green Version]
  17. Amengual, A. Hydrometeorological analysis of the 12 and 13 September 2019 widespread flash flooding in eastern Spain. Nat. Hazards Earth Syst. Sci. 2022, 22, 1159–1179. [Google Scholar] [CrossRef]
  18. Rao, K.; Shravya, A.; Rao, V.V.; Dadhwal, V.K.; Diwakar, P.G. Flash flood disaster threat to Indian rail bridges: A spatial simulation study of Machak River flood, Madhya Pradesh. Curr. Sci. 2017, 112, 1028–1033. [Google Scholar]
  19. He, Y.; Ma, D.; Xiong, J.; Cheng, W.; Jia, H.; Wang, N.; Guo, L.; Duan, Y.; Liu, J.; Yang, G. Flash flood vulnerability assessment of roads in China based on support vector machine. Geocarto Int. 2021, 1–24. [Google Scholar] [CrossRef]
  20. Wang, L.; Guan, Z.; Shi, C.; Tao, J.; Jin, L. Features of the large-scale circulation of the extremely heavy rain with severe floods over south China in June 2005 and its possible cause//Remote Sensing and Modeling of Ecosystems for Sustainability V. Int. Soc. Opt. Photonics 2008, 7083, 70830S. [Google Scholar]
  21. Douvinet, J.; Van De Wiel, M.J.; Delahaye, D.; Cossart, E. A flash flood hazard assessment in dry valleys (northern France) by cellular automata modelling. Nat. Hazards 2015, 75, 2905–2929. [Google Scholar] [CrossRef] [Green Version]
  22. Lin, S.S.; Zhang, N.; Xu, Y.S.; Hino, T. Lesson learned from catastrophic floods in western japan in 2018: Sustainable perspective analysis. Water 2020, 12, 2489. [Google Scholar] [CrossRef]
  23. Wang, H.F.; Yun, R.; Zhao, R.H.; Qi, Z. Flash flood risk evaluation based on variable fuzzy method and fuzzy clustering analysis. J. Intell. Fuzzy Syst. 2019, 37, 4861–4872. [Google Scholar] [CrossRef]
  24. Mustafa, A.M.; Muhammed, H.; Szydłowski, M. Extreme rainfalls as a cause of urban flash floods; a case study of the Erbil-Kurdistan region of Iraq. Acta Sci. Pol. Form. Circumiectus 2019, 18, 113–132. [Google Scholar] [CrossRef]
  25. Martin-Vide, J.P.; Llasat, M.C. The 1962 flash flood in the Rubi stream (Barcelona, Spain). J. Hydrol. 2018, 566, 441–454. [Google Scholar] [CrossRef]
  26. Vázquez Conde, M.T.; Lugo, J.; Guadalupe Matías, L. Heavy Rainfall Effects in Mexico during Early October 1999//Coping with Flash Floods; Springer: Berlin/Heidelberg, Germany, 2001; pp. 289–299. [Google Scholar]
  27. Korichi, K.; Hazzab, A.; Atallah, M. Flash floods risk analysis in ephemeral streams: A case study on Wadi Mekerra (northwestern Algeria). Arab. J. Geosci. 2016, 9, 1–11. [Google Scholar] [CrossRef]
  28. Singh, S.; Kansal, M.L. Chamoli flash-flood mapping and evaluation with a supervised classifier and NDWI thresholding using Sentinel-2 optical data in Google earth engine. Earth Sci. Inform. 2022, 15, 1073–1086. [Google Scholar] [CrossRef]
  29. Kishorbhai, V.Y.; Vasantbhai, N.N. AON: A survey on emergency communication systems during a catastrophic disaster. Procedia Comput. Sci. 2017, 115, 838–845. [Google Scholar] [CrossRef]
  30. Majewski, W. Measures and solutions for flood management. A local case: Flash flood 2001 in Gdansk, Poland. Irrig. Drain. 2006, 55, S101–S111. [Google Scholar] [CrossRef]
  31. Ding, H.R.; Li, Y.; Ni, S.J.; Shao, C.J.; Shi, Z.M.; Yan, L.; Lv, L.Q.; Ni, T.; Gong, R.H.; Shi, L.; et al. The mountain torrent disasters and its effect on sediment transport after the Wenchuan earthquake. In IOP Conference Series: Earth and Environmental Science; IOP Publishing: Bristol, UK, 2019; Volume 344, p. 012159. [Google Scholar]
  32. Douinot, A.; Roux, H.; Garambois, P.A.; Larnier, K.; Labat, D.; Dartus, D. Accounting for rainfall systematic spatial variability in flash flood forecasting. J. Hydrol. 2016, 541, 359–370. [Google Scholar] [CrossRef] [Green Version]
  33. Younis, J.; Anquetin, S.; Thielen, J. The benefit of high-resolution operational weather forecasts for flash flood warning. Hydrol. Earth Syst. Sci. 2008, 12, 1039–1051. [Google Scholar] [CrossRef] [Green Version]
  34. AL-Areeq, A.; Al-Zahrani, M.; Chowdhury, S. Rainfall intensity–duration–frequency (idf) curves: Effects of uncertainty on flood protection and runoff quantification in southwestern Saudi Arabia. Arab. J. Sci. Eng. 2021, 46, 10993–11007. [Google Scholar] [CrossRef]
  35. Iqbal, U.; Barthelemy, J.; Perez, P.; Cooper, J.; Li, W. A scaled physical model study of culvert blockage exploring complex relationships between influential factors. Australas. J. Water Resour. 2021, 1–14. [Google Scholar] [CrossRef]
  36. Porcacchia, L.; Kirstetter, P.E.; Gourley, J.J.; Maggioni, V.; Cheong, B.L.; Anagnostou, M.N. Toward a polarimetric radar classification scheme for coalescence-dominant precipitation: Application to complex terrain. J. Hydrometeorol. 2017, 18, 3199–3215. [Google Scholar] [CrossRef]
  37. Cozzi, L.; Galelli, S.; Castelletti, A.F.; Jolivet, S. Numerical weather models as virtual sensors to data-driven rainfall predictions in urban catchments. In Proceedings of the 20th International Congress on Modelling and Simulation, Adelaide, Australia, 1–6 December 2013; pp. 2451–2456. [Google Scholar]
  38. Mousa, M.; Oudat, E.; Claudel, C. A novel dual traffic/flash flood monitoring system using passive infrared/ultrasonic sensors. In Proceedings of the 2015 IEEE 12th International Conference on Mobile Ad Hoc and Sensor Systems, Dallas, TX, USA, 19–22 October 2015; IEEE: Piscataway, NJ, USA, 2015; pp. 388–397. [Google Scholar]
  39. Hakdaoui, S.; Emran, A.; Pradhan, B.; Lee, C.W.; Fils, S.C.N. A collaborative change detection approach on multi-sensor spatial imagery for desert wetland monitoring after a flash flood in southern morocco. Remote Sens. 2019, 11, 1042. [Google Scholar] [CrossRef] [Green Version]
  40. Bedrina, T.; Parodi, A.; Quarati, A.; Clematis, A. ICT approaches to integrating institutional and non-institutional data services for better understanding of hydro-meteorological phenomena. Nat. Hazards Earth Syst. Sci. 2012, 12, 1961–1968. [Google Scholar] [CrossRef] [Green Version]
  41. Rajendran, L.; Shankaran, S. ICT enabled early warning dissemination system for disaster management. In Proceedings of the 2021 6th International Conference on Inventive Computation Technologies (ICICT), Coimbatore, India, 20–22 January 2021; IEEE: Piscataway, NJ, USA, 2021; pp. 443–448. [Google Scholar]
  42. Rogelis, M.C.; Werner, M. Streamflow forecasts from WRF precipitation for flood early warning in mountain tropical areas. Hydrol. Earth Syst. Sci. 2018, 22, 853–870. [Google Scholar] [CrossRef] [Green Version]
  43. Mustafa, A.; Szydłowski, M. The impact of spatiotemporal changes in land development (1984–2019) on the increase in the runoff coefficient in Erbil, Kurdistan Region of Iraq. Remote Sens. 2020, 12, 1302. [Google Scholar] [CrossRef] [Green Version]
  44. Villani, G.; Nanni, S.; Tomei, F.; Pasetti, S.; Mangiaracina, R.; Agnetti, A.; Leoni, P.; Folegani, M.; Mazzini, G.; Botarelli, L.; et al. The rainbo platform for enhancing urban resilience to floods: An efficient tool for planning and emergency phases. Climate 2019, 7, 145. [Google Scholar] [CrossRef] [Green Version]
  45. FitzGerald, G.; Toloo, G.; Baniahmadi, S.; Crompton, D.; Tong, S. Long-term consequences of flooding: A case study of the 2011 Queensland floods. Aust. J. Emerg. Manag. 2019, 34, 35–40. [Google Scholar]
  46. Ding, L.S.; Ma, L.; Li, L.G.; Liu, C.; Li, N.W.; Yang, Z.L.; Yao, Y.Z.; Lu, H. A Survey of Remote Sensing and Geographic Information System Applications for Flash Floods. Remote Sens. 2021, 13, 1818. [Google Scholar] [CrossRef]
  47. Cao, Z.X.; Pender, G.; Carling, P. Shallow water hydrodynamic models for hyperconcentrated sediment-laden floods over erodible bed. Adv. Water Resour. 2006, 29, 546–557. [Google Scholar] [CrossRef]
  48. Garambois, P.A.; Roux, H.; Larnier, K.; Labat, D.; Dartus, D. Characterization of catchment behaviour and rainfall selection for flash flood hydrological model calibration: Catchments of the eastern Pyrenees. Hydrol. Sci. J. 2015, 60, 424–447. [Google Scholar] [CrossRef] [Green Version]
  49. Kim, J.J.; Ryu, J.H. Decision-making of lid-bmps for adaptive water management at the boise river watershed in a changing global environment. Water 2020, 12, 2436. [Google Scholar] [CrossRef]
  50. Mujere, N.; Masocha, M.; Makurira, H.; Mazvimavi, D. Dynamics and scales of transmission losses in dryland river systems: A meta-analysis. Australas. J. Water Resour. 2021, 1–15. [Google Scholar] [CrossRef]
  51. Merheb, M.; Moussa, R.; Abdallah, C.; Colin, F.; Perrin, C.; Baghdadi, N. Hydrological response characteristics of Mediterranean catchments at different time scales: A meta-analysis. Hydrol. Sci. J.-J. Des Sci. Hydrol. 2016, 61, 2520–2539. [Google Scholar] [CrossRef] [Green Version]
  52. Ruidas, D.; Chakrabortty, R.; Islam, A.M.T.; Saha, A.; Pal, S.C. A novel hybrid of meta-optimization approach for flash flood-susceptibility assessment in a monsoon-dominated watershed, Eastern India. Environ. Earth Sci. 2022, 81, 1–22. [Google Scholar] [CrossRef]
  53. Glass, G.V. Primary, secondary, and Meta-analysis of research. Educ Res. 1976, 5, 3–8. [Google Scholar] [CrossRef]
  54. Van Eck, N.J.; Waltman, L. Software survey: VOSviewer, a computer program for bibliometric mapping. Scientometrics 2010, 84, 523–538. [Google Scholar] [CrossRef] [Green Version]
  55. Chen, C. Science mapping: A systematic review of the literature. J. Data Inf. Sci. 2017, 2, 1–40. [Google Scholar] [CrossRef] [Green Version]
  56. Chen, C.; Ibekwe-SanJuan, F.; Hou, J. The structure and dynamics of cocitation clusters: A multiple-perspective cocitation analysis. J. Am. Soc. Inf. Sci. Technol. 2010, 61, 1386–1409. [Google Scholar] [CrossRef] [Green Version]
  57. Chen, C. CiteSpace II: Detecting and visualizing emerging trends and transient patterns in scientific literature. J. Am. Soc. Inf. Sci. Technol. 2006, 57, 359–377. [Google Scholar] [CrossRef] [Green Version]
  58. Chen, C. Searching for intellectual turning points: Progressive knowledge domain visualization. Proc. Natl. Acad. Sci. USA 2004, 101, 5303–5310. [Google Scholar] [CrossRef] [PubMed] [Green Version]
  59. Sanders, F.; Doswell, C.A. A Case for Detailed Surface-Analysis. Bull. Am. Meteorol. Soc. 1995, 76, 505–521. [Google Scholar] [CrossRef] [Green Version]
  60. Marchi, L.; Borga, M.; Preciso, E.; Gaume, E. Characterisation of selected extreme flash floods in Europe and implications for flood risk management. J. Hydrol. 2010, 394, 118–133. [Google Scholar] [CrossRef]
  61. Heredia-Calderon, E.; Siccardi, F. Regional analysis of short duration precipitation annual maxima in Liguria (Italy). IAHS Publ. 1999, 254, 71–78. [Google Scholar]
  62. Forte, F.; Pennetta, L.; Strobl, R.O. Historic records and GIS applications for flood risk analysis in the Salento peninsula (southern Italy). Nat. Hazards Earth Syst. Sci. 2005, 5, 833–844. [Google Scholar] [CrossRef]
  63. Miglietta, M.M.; Regano, A. An observational and numerical study of a flash-flood event over south-eastern Italy. Nat. Hazards Earth Syst. Sci. 2008, 8, 1417–1430. [Google Scholar] [CrossRef]
  64. Aronica, G.T.; Brigandi, G.; Morey, N. Flash floods and debris flow in the city area of Messina, north-east part of Sicily, Italy in October 2009: The case of the Giampilieri catchment. Nat. Hazards Earth Syst. Sci. 2012, 12, 1295–1309. [Google Scholar] [CrossRef]
  65. De Marchi, B.; Scolobig, A. The views of experts and residents on social vulnerability to flash floods in an Alpine region of Italy. Disasters 2012, 36, 316–337. [Google Scholar] [CrossRef]
  66. Santo, A.; Di Crescenzo, G.; Del Prete, S.; Di Iorio, L. The Ischia island flash flood of November 2009 (Italy): Phenomenon analysis and flood hazard. Phys. Chem. Earth 2012, 49, 3–17. [Google Scholar] [CrossRef]
  67. Nikolopoulos, E.I.; Anagnostou, E.N.; Borga, M. Using high-resolution satellite rainfall products to simulate a major flash flood event in northern Italy. J. Hydrometeorol. 2013, 14, 171–185. [Google Scholar] [CrossRef]
  68. Gaume, E.; Livet, M.; Desbordes, M.; Villeneuve, J.P. Hydrological analysis of the river Aude, France, flash flood on 12 and 13 November 1999. J. Hydrol. 2004, 286, 135–154. [Google Scholar] [CrossRef]
  69. Zhai, X.Y.; Guo, L.; Zhang, Y.Y. Flash flood type identification and simulation based on flash flood behavior indices in China. Sci. China-Earth Sci. 2021, 64, 1140–1154. [Google Scholar] [CrossRef]
  70. Potdar, A.S.; Kirstetter, P.E.; Woods, D.; Saharia, M. Toward predicting flood event peak discharge in ungauged basins by learning universal hydrological behaviors with machine learning. J. Hydrometeorol. 2021, 22, 2971–2982. [Google Scholar]
  71. Prokesova, R.; Horackova, S.; Snopkova, Z. Surface runoff response to long-term land use changes: Spatial rearrangement of runoff-generating areas reveals a shift in flash flood drivers. Sci. Total Environ. 2022, 815, 151591. [Google Scholar] [CrossRef] [PubMed]
  72. Goumrasa, A.; Guendouz, M.; Guettouche, M.S.; Belaroui, A. Flood hazard susceptibility assessment in Chiffa wadi watershed and along the first section of Algeria North-South highway using GIS and AHP method. Appl. Geomat. 2021, 13, 565–585. [Google Scholar] [CrossRef]
  73. Nielsen, E.R.; Schumacher, R.S. Dynamical insights into extreme short-term precipitation associated with supercells and mesovortices. J. Atmos. Sci. 2018, 75, 2983–3009. [Google Scholar] [CrossRef]
  74. Curtis, M.B. A synoptic and mesoscale analysis of heavy rainfall at portland, Maine, 13-14 August 2014. J. Oper. Meteorol. 2017, 5, 78–86. [Google Scholar] [CrossRef]
  75. Nielsen, E.R.; Schumacher, R.S. Observations of extreme short-term precipitation associated with supercells and mesovortices. Mon. Weather. Rev. 2020, 148, 159–182. [Google Scholar] [CrossRef]
  76. Rigo, T.; Llasat, M.C. Flash Floods and Heavy Rain Events in Catalonia: Analysis of the 1996-2000 Period; International Association of Hydrological Sciences: Oxfordshire, UK, 2003; pp. 269–275. [Google Scholar]
  77. Mariani, S.; Casaioli, M.; Accadia, C.; Llasat, M.C.; Pasi, F.; Davolio, S.; Elementi, M.; Ficca, G.; Romero, R. A limited area model intercomparison on the “Montserrat-2000” flash-flood event using statistical and deterministic methods. Nat. Hazards Earth Syst. Sci. 2005, 5, 565–581. [Google Scholar] [CrossRef] [Green Version]
  78. Nga Thanh Thi, P.; Duy, N.; Sathyan, A.R.; Garschagen, M. Vulnerability assessment of households to flash floods and landslides in the poor upland regions of Vietnam. Clim. Risk Manag. 2020, 28, 100215. [Google Scholar] [CrossRef]
  79. Furquim, G.; Neto, F.; Pessin, G.; Ueyama, J.; Joao, P.; Clara, M.; Mendiondo, E.M.; de Souza, V.C.; de Souza, P.; Dimitrova, D.; et al. Combining Wireless Sensor Networks and Machine Learning for Flash Flood Nowcasting. In Proceedings of the 2014 28th International Conference on Advanced Information Networking and Applications Workshops, Victoria, BC, Canada, 13–16 May 2014; pp. 67–72. [Google Scholar]
  80. Javelle, P.; Demargne, J.; Defrance, D.; Pansu, J.; Arnaud, P. Evaluating flash-flood warnings at ungauged locations using post-event surveys: A case study with the AIGA warning system. Hydrol. Sci. J.-J. Des. Sci. Hydrol. 2014, 59, 1390–1402. [Google Scholar] [CrossRef] [Green Version]
  81. Carmen Llasat, M.; Marcos, R.; Llasat-Botija, M.; Gilabert, J.; Turco, M.; Quintana-Segui, P. Flash flood evolution in North-Western Mediterranean. Atmos. Res. 2014, 149, 230–243. [Google Scholar] [CrossRef] [Green Version]
  82. Baldi, M.; Amin, D.; Al Zayed, I.S.; Dalu, G. Climatology and dynamical evolution of extreme rainfall events in the sinai peninsula-Egypt. Sustainability 2020, 12, 6186. [Google Scholar] [CrossRef]
  83. Abu El-Magd, S.A.; Orabi, H.O.; Ali, S.A.; Parvin, F.; Quoc Bao, P. An integrated approach for evaluating the flash flood risk and potential erosion using the hydrologic indices and morpho-tectonic parameters. Environ. Earth Sci. 2021, 80, 1–7. [Google Scholar] [CrossRef]
  84. Wahba, M.; Mahmoud, H.; Elsadek, W.M.; Kanae, S.; Hassan, H.S. Alleviation approach for flash flood risk reduction in urban dwellings: A case study of Fifth District, Egypt. Urban Clim. 2022, 42, 101130. [Google Scholar] [CrossRef]
  85. Douvinet, J.; Martin, G.J.; Gisclard, B.; Kouadio, J.; Saint-Martin, C. A place for smartphone technologies and Digital Social Networks (DNS) in institutional flood warning systems in France? Eur. J. Geogr. 2017, 801. [Google Scholar]
  86. Bennani, O.; Druon, E.; Leone, F.; Tramblay, Y.; Saidi, M.E.M. A spatial and integrated flood risk diagnosis Relevance for disaster prevention at Ourika valley (High Atlas-Morocco). Disaster Prev. Manag. 2019, 28, 548–564. [Google Scholar] [CrossRef]
  87. Ribolzi, O.; Lacombe, G.; Pierret, A.; Robain, H.; Sounyafong, P.; de Rouw, A.; Soulileuth, P.; Mouche, E.; Huon, S.; Silvera, N.; et al. Interacting land use and soil surface dynamics control groundwater outflow in a montane catchment of the lower Mekong basin. Agric. Ecosyst. Environ. 2018, 268, 90–102. [Google Scholar] [CrossRef]
  88. Mallet, F.; Marc, V.; Douvinet, J.; Rossello, P.; Joly, D.; Ruy, S. Assessing soil water content variation in a small mountainous catchment over different time scales and land covers using geographical variables. J. Hydrol. 2020, 591, 125593. [Google Scholar] [CrossRef]
  89. Spitalar, M.; Gourley, J.J.; Lutoff, C.; Kirstetter, P.E.; Brilly, M.; Carr, N. Analysis of flash flood parameters and human impacts in the US from 2006 to 2012. J. Hydrol. 2014, 519, 863–870. [Google Scholar] [CrossRef]
  90. Saharia, M.; Kirstetter, P.E.; Vergara, H.; Gourley, J.J.; Hong, Y.; Giroud, M. Mapping flash flood severity in the United States. J. Hydrometeorol. 2017, 18, 397–411. [Google Scholar] [CrossRef]
  91. Calianno, M.; Ruin, I.; Gourley, J.J. Supplementing flash flood reports with impact classifications. J. Hydrol. 2013, 477, 1–16. [Google Scholar] [CrossRef]
  92. Armon, M.; Dente, E.; Smith, J.A.; Enzel, Y.; Morin, E. Synoptic-scale control over modern rainfall and flood patterns in the levant drylands with implications for past Climates. J. Hydrometeorol. 2018, 19, 1077–1096. [Google Scholar] [CrossRef]
  93. Shamir, E.; Ben-Moshe, L.; Ronen, A.; Grodek, T.; Enzel, Y.; Georgakakos, K.P.; Morin, E. Geomorphology-based index for detecting minimal flood stages in arid alluvial streams. Hydrol. Earth Syst. Sci. 2013, 17, 1021–1034. [Google Scholar] [CrossRef] [Green Version]
  94. Schumacher, R.S.; Johnson, R.H. Quasi-Stationary, extreme-rain-producing convective systems associated with midlevel cyclonic circulations. Weather. Forecast. 2009, 24, 555–574. [Google Scholar] [CrossRef] [Green Version]
  95. Prein, A.F.; Langhans, W.; Fosser, G.; Ferrone, A.; Ban, N.; Goergen, K.; Keller, M.; Toelle, M.; Gutjahr, O.; Feser, F.; et al. A review on regional convection-permitting climate modeling: Demonstrations, prospects, and challenges. Rev. Geophys. 2015, 53, 323–361. [Google Scholar] [CrossRef] [Green Version]
  96. Youssef, A.M.; Pradhan, B.; Hassan, A.M. Flash flood risk estimation along the St. Katherine road, southern Sinai, Egypt using GIS based morphometry and satellite imagery. Environ. Earth Sci. 2011, 62, 611–623. [Google Scholar] [CrossRef]
  97. Gochis, D.; Schumacher, R.; Friedrich, K.; Doesken, N.; Kelsch, M.; Sun, J.Z.; Ikeda, K.; Lindsey, D.; Wood, A.; Dolan, B.; et al. The great colorado flood of September 2013. Bull. Am. Meteorol. Soc. 2015, 96, 1461–1487. [Google Scholar] [CrossRef] [Green Version]
  98. Hapuarachchi, H.A.P.; Wang, Q.J.; Pagano, T.C. A review of advances in flash flood forecasting. Hydrol. Processes 2011, 25, 2771–2784. [Google Scholar] [CrossRef]
  99. Zhou, Z.Z.; Smith, J.A.; Baeck, M.L.; Wright, D.B.; Smith, B.K.; Liu, S.G. The impact of the spatiotemporal structure of rainfall on flood frequency over a small urban watershed: An approach coupling stochastic storm transposition and hydrologic modeling. Hydrol. Earth Syst. Sci. 2021, 25, 4701–4717. [Google Scholar] [CrossRef]
  100. Cevasco, A.; Diodato, N.; Revellino, P.; Fiorillo, F.; Grelle, G.; Guadagno, F.M. Storminess and geo-hydrological events affecting small coastal basins in a terraced Mediterranean environment. Sci. Total Environ. 2015, 532, 208–219. [Google Scholar] [CrossRef] [PubMed]
  101. Philips, B.; Chandrasekar, V. The dallas fort worth urban remote sensing network. In Proceedings of the 2012 IEEE International Geoscience and Remote Sensing Symposium, Munich, Germany, 22–27 July 2012; pp. 6911–6913. [Google Scholar]
  102. Ducrocq, V.; Ricard, D.; Lafore, J.P.; Orain, F. Storm-scale numerical rainfall prediction for five precipitating events over France: On the importance of the initial humidity field. Weather. Forecast. 2002, 17, 1236–1256. [Google Scholar] [CrossRef]
  103. Schepanski, K.; Wright, T.J.; Knippertz, P. Evidence for flash floods over deserts from loss of coherence in InSAR imagery. J. Geophys. Res. Atmos. 2012, 117. [Google Scholar] [CrossRef] [Green Version]
  104. Cerbelaud, A.; Breil, P.; Blanchet, G.; Roupioz, L.; Briottet, X. Proxy data of surface water floods in rural areas: Application to the evaluation of the irip intense runoff mapping method based on satellite remote sensing and rainfall radar. Water 2022, 14, 393. [Google Scholar] [CrossRef]
  105. Luong, T.T.; Poschmann, J.; Kronenberg, R.; Bernhofer, C. Rainfall threshold for flash flood warning based on model output of soil moisture: Case study wernersbach, Germany. Water 2021, 13, 1061. [Google Scholar] [CrossRef]
  106. Hitchcock, S.M.; Lane, T.P.; Warren, R.A.; Soderholm, J.S. Linear rainfall features and their association with rainfall extremes near melbourne, Australia. Mon. Weather. Rev. 2021, 149, 3401–3417. [Google Scholar] [CrossRef]
  107. Adnan, M.S.G.; Dewan, A.; Zannat, K.E.; Abdullah, A.Y.M. The use of watershed geomorphic data in flash flood susceptibility zoning: A case study of the Karnaphuli and Sangu river basins of Bangladesh. Nat. Hazards 2019, 99, 425–448. [Google Scholar] [CrossRef]
  108. Seo, J.P.; Cho, W.; Cheong, T.S. Development of priority setting process for the small stream restoration projects using multi criteria decision analysis. J. Hydroinformatics 2015, 17, 211–225. [Google Scholar] [CrossRef]
  109. Zaharia, L.; Costache, R.; Pravalie, R.; Minea, G. Assessment and mapping of flood potential in the Slanic catchment in Romania. J. Earth Syst. Sci. 2015, 124, 1311–1324. [Google Scholar] [CrossRef] [Green Version]
  110. Akkoyunlu, B.O.; Baltaci, H.; Tayanc, M. Atmospheric conditions of extreme precipitation events in western Turkey for the period 2006-2015. Nat. Hazards Earth Syst. Sci. 2019, 19, 107–119. [Google Scholar] [CrossRef] [Green Version]
  111. Pan, T.Y.; Lin, H.T.; Liao, H.Y. A data-driven probabilistic rainfall-inundation model for flash-flood warnings. Water 2019, 11, 2534. [Google Scholar] [CrossRef] [Green Version]
  112. Musolino, G.; Ahmadian, R.; Xia, J.Q.; Falconer, R.A. Mapping the danger to life in flash flood events adopting a mechanics based methodology and planning evacuation routes. J. Flood Risk Manag. 2020, 13, e12627. [Google Scholar] [CrossRef]
  113. Dominic, J.A.; Aris, A.Z.; Sulaiman, W.N.A. Factors controlling the suspended sediment yield during rainfall events of dry and wet weather conditions in a tropical urban catchment. Water Resour. Manag. 2015, 29, 4519–4538. [Google Scholar] [CrossRef]
  114. Zhang, R.J.; Chen, Y.H.; Zhang, X.X.; Ma, Q.; Ren, L.L. Mapping homogeneous regions for flash floods using machine learning: A case study in Jiangxi province, China. Int. J. Appl. Earth Obs. Geoinf. 2022, 108, 102717. [Google Scholar] [CrossRef]
  115. Costache, R.; Pham, Q.B.; Sharifi, E.; Linh, N.T.T.; Abba, S.I.; Vojtek, M.; Vojtekova, J.; Nhi, P.T.T.; Khoi, D.N. Flash-flood susceptibility assessment using multi-criteria decision making and machine learning supported by remote sensing and gis techniques. Remote Sens. 2020, 12, 106. [Google Scholar] [CrossRef] [Green Version]
  116. Kreibich, H.; Dimitrova, B. Assessment of damages caused by different flood types. WIT Trans. Ecol. Environ. 2010, 133, 3–11. [Google Scholar]
  117. Pham, B.T.; Phong, T.V.; Nguyen, H.D.; Qi, C.C.; Al-Ansari, N.; Amini, A.; Ho, L.S.; Tuyen, T.T.; Yen, H.P.H.; Ly, H.B.; et al. A comparative study of kernel logistic regression, radial basis function classifier, multinomial naive bayes, and logistic model tree for flash flood susceptibility mapping. Water 2020, 12, 239. [Google Scholar] [CrossRef] [Green Version]
  118. Malgwi, M.B.; Fuchs, S.; Keiler, M. A generic physical vulnerability model for floods: Review and concept for data-scarce regions. Nat. Hazards Earth Syst. Sci. 2020, 20, 2067–2090. [Google Scholar] [CrossRef]
  119. Lin, K.R.; Chen, H.Y.; Xu, C.Y.; Yan, P.; Lan, T.; Liu, Z.Y.; Dong, C.Y. Assessment of flash flood risk based on improved analytic hierarchy process method and integrated maximum likelihood clustering algorithm. J. Hydrol. 2020, 584, 124696. [Google Scholar] [CrossRef]
  120. Popa, M.C.; Peptenatu, D.; Draghici, C.C.; Diaconu, D.C. Flood hazard mapping using the flood and flash-flood potential index in the buzau river catchment, Romania. Water 2019, 11, 2116. [Google Scholar] [CrossRef] [Green Version]
  121. Ahmad, W.; Nasir, M.J.; Iqbal, J. Flash flood susceptibility modeling for drainage basins of Dir Lower Khyber-Pakhtunkhwa: A comparative analysis of morphometric ranking and El-Shamy’s approach. Remote Sens. Agric. Ecosyst. Hydrol. XXII. Int. Soc. Opt. Photonics 2020, 11528, 115280E. [Google Scholar]
  122. Molini, L.; Parodi, A.; Siccardi, F. Dealing with uncertainty: An analysis of the severe weather events over Italy in 2006. Nat. Hazards Earth Syst. Sci. 2009, 9, 1775–1786. [Google Scholar] [CrossRef]
  123. Rafieeinasab, A.; Norouzi, A.; Kim, S.; Habibi, H.; Nazari, B.; Seo, D.J.; Lee, H.; Cosgrove, B.; Cui, Z.T. Toward high-resolution flash flood prediction in large urban areas—Analysis of sensitivity to spatiotemporal resolution of rainfall input and hydrologic modeling. J. Hydrol. 2015, 531, 370–388. [Google Scholar] [CrossRef] [Green Version]
  124. Amponsah, W.; Marchi, L.; Zoccatelli, D.; Boni, G.; Cavalli, M.; Comiti, F.; Crema, S.; Lucia, A.; Marra, F.; Borga, M. Hydrometeorological characterization of a flash flood associated with major geomorphic effects: Assessment of peak discharge uncertainties and analysis of the runoff response. J. Hydrometeorol. 2016, 17, 3063–3077. [Google Scholar] [CrossRef]
  125. Petrucci, O.; Pasqua, A.A.; Polemio, M. Flash flood occurrences since the 17th century in steep drainage basins in southern Italy. Environ. Manag. 2012, 50, 807–818. [Google Scholar] [CrossRef] [Green Version]
  126. Aroca-Jimenez, E.; Bodoque, J.M.; Garcia, J.A. How to construct and validate an Integrated Socio-Economic Vulnerability Index: Implementation at regional scale in urban areas prone to flash flooding. Sci. Total Environ. 2020, 746, 140905. [Google Scholar] [CrossRef]
  127. Wang, H.F.; Yun, R.; Zhang, J.C.; Zhao, R.H. Sensitivity analysis of the flash flood hazard by coupling variable fuzzy method and mutual entropy. J. Flood Risk Manag. 2022, 15, 140905. [Google Scholar] [CrossRef]
  128. Grundmann, J.; Horning, S.; Bardossy, A. Stochastic reconstruction of spatio-temporal rainfall patterns by inverse hydrologic modelling. Hydrol. Earth Syst. Sci. 2019, 23, 225–237. [Google Scholar] [CrossRef] [Green Version]
Figure 1. Flash flood on 20 August 2019 in Aba Prefecture, Sichuan. (a) The bridges were broken; (b) the houses were destroyed (photo taken by author).
Remotesensing 14 03313 g001
Figure 2. Literature search strategy.
Remotesensing 14 03313 g002
Figure 3. Publication volume over time.
Remotesensing 14 03313 g003
Figure 4. Publication volume by country or region.
Remotesensing 14 03313 g004
Figure 5. Analysis of the influence of high-yield institutions.
Remotesensing 14 03313 g005
Figure 6. High-yield publisher influence analysis.
Remotesensing 14 03313 g006
Figure 7. Influence analysis of prolific authors.
Remotesensing 14 03313 g007
Figure 8. The changing trend of literature citations.
Remotesensing 14 03313 g008
Figure 9. Keyword co-occurrence analysis tab view.
Remotesensing 14 03313 g009
Figure 10. Keyword mutation analysis.
Remotesensing 14 03313 g010
Figure 11. Keyword co-occurrence density view.
Remotesensing 14 03313 g011
Figure 12. Cluster analysis of research hotspots (based on keyword analysis).
Remotesensing 14 03313 g012
Figure 13. Research trends timeline view.
Remotesensing 14 03313 g013
Figure 14. Details of the key node “precipitation”. (a) Pennant illustration; (b) publication timing outbreak.
Remotesensing 14 03313 g014
Figure 15. Typical siltation-prone river reach.
Remotesensing 14 03313 g015
Figure 16. Sensitivity analysis and mapping methods.
Remotesensing 14 03313 g016
Figure 17. Uncertainty analysis chart (drawn by Edraw MindMaster).
Remotesensing 14 03313 g017
Table 1. Inclusion–exclusion criteria.
InclusionExclusion
Flash flood areas, including: mountains and citiesGlaciers, deserts, coastal area
Flash floods caused by precipitation, extreme rainfall, rainfall, rainstormGlacier lake dam break, glacier melt, dam break flood, tsunami
Whether the title, keywords, and abstract contain the following terms: precipitation, sediment, sensitivity analysis, risk assessment, uncertainty analysisTrace elements, child feeding, isotope, crop growth, molecular genetics, computer server
Peer reviewed or has editor oversight, types of literature, including articles, letters, and review articlesProceedings papers, early access, editorial materials, meeting abstracts
Table 2. Characteristics of the included studies.
YearAuthorsTitleJournalCite FrequencyKeywords
2006Cao, Z.X. et al. [47]Shallow water hydrodynamic models for hyperconcentrated sediment-laden floods over erodible bedAdvances in Water Resources63Sediment transport; sediment-laden flow; erosion and sedimentation; floods; unsteady flow; hyperconcentrated flow; alluvial rivers; the Yellow River; fluvial morphology; shallow water hydrodynamics
2015Garambois P.A. et al. [48]Characterization of catchment behaviour and rainfall selection for flash flood hydrological model calibration: catchments of the eastern PyreneesHydrological sciences journal13Sensitivity analysis; hydrological model calibration; catchment behaviour; regionalization; global flash floods
2016Amponsah, W. et al. [49]Decision-Making of LID-BMPs for Adaptive Water Management at the Boise River Watershed in a Changing Global EnvironmentWater2Uncertainty analysis; water management; climate variability; urbanization; Best Hydrological Simulation Program Fortran (HSPF)
2016Douinot, A. et al. [32]Accounting for rainfall systematic spatial variability in flash flood forecastingJournal of Hydrology26Rainfall spatial variability; flash flood; flash flood guidance; hydrological response; physical based model
2021Dejen, A. et al. [14]Flash flood risk assessment using geospatial technology in Shewa Robit town, EthiopiaModeling Earth Systems and Environment2Risk assessment; geospatial technology; flash flood
Table 3. Analysis of highly cited papers (top 5).
AuthorCite FrequencyYearTitleResearch Contents
Prein et al. [95]5812015A review on regional convection-permitting climate modeling: Demonstrations, prospects, and challengesIt summarized the research results of the added value of convection permissive model, climate model, and large-scale model. The improvement in climate statistics data related to deep convection, mountainous areas, or extreme events was most obvious.
Marchi et al. [60]3532010Characterisation of selected extreme flash floods in Europe and implications for flood risk managementIt collected and analyzed the data of 25 extreme flash flood events, summarized the data files derived and analyzed from variables by using hydrological model, emphasized the importance of building and expanding the flash flood database after the investigation of flash flood disaster.
Borga et al. [12]2322014Hydrogeomorphic response to extreme rainfall in headwater systems: Flash floods and debris flowsIt summarized the current European and international research on early warning systems for flash flood and debris flow, expanded the research status, closed a knowledge gap, and improved the early warning ability for extreme hydrological and geomorphic processes through identification.
Youssef et al. [96]2162011Flash flood risk estimation along the St. Katherine road, southern Sinai, Egypt using GIS based morphometry and satellite imageryIt estimated the flash flood risk of Ferran-Catherine Road in southern Sinai, Egypt by the use of remote sensing data.
Gochis et al. [97]1432015The Great Colorado Flood Of September 2013It explored the meteorological and hydrological factors that cause flash flood events, and discussed the weather characteristics and mesoscale cycle characteristics of the events after providing the basic timeline.
Table 4. Research methods.
Research ObjectContentConclusion
Surface water flash floods (SWFs) [104]IRIP mapping model based on physical distributed hydrological model simulated surface runoff according to precipitation inputThe greater the susceptibility score of IRIP was, the more SWFs detected by detection algorithm based on remote sensing
Rainfall threshold, rainfall value [105]The FFG principle was applied to the Wenersbach catchment area with excellent data coverage by using BROOK90 water budget model, which runs on an hourly basis according to four precipitation types and different levels of initial soil moistureThe adjustment of the flash flood guidance (FFG) methods might provide reliable support for flash flood forecasting
Extreme rainfall and its variation [106]The recently developed Australian radar archives (AURA) were examined to identify objects that meet specific relevant standards, and identify daily heavy and extreme rainfall by multiple methodsThe number of days in the linear system accounted for more than half of the total rainfall in Melbourne and 70–85% of strong/extreme rainfall
Table 5. Typical cases of sensitivity analysis.
StudyResearch areaPurposeMethodConclusion
Experience drivenBoscastle (UK) [112]Evaluated the different criteria used to assess the hazards to personnel during flash flood eventsAssociated the flash flood risk level with the characteristics of the human body by widely used empirical method and mechanics based method when the safest route was determinedThe criterion based on mechanics was more desirable in determining the ideal escape route when the characteristics of flash floods and the corresponding response of the human body were considered
Data drivenKuala Lumpur [113]Evaluated the flash flood sensitivity, vulnerability, socio-economic impact, and comprehensive flash flood indexProvided the location where flash floods easily occur based on the disaster points at each determined location and verified the basin based on 50-ARI rainfall modelThe comprehensive interactive color flash flood sensitivity analysis map was provided
Mechanism drivenJiangxi province of China [114]Divided the geographical space into homogeneous regions with similar flash flood generation mechanisms Established a two-stage hybrid self-organizing map clustering algorithm to determine the homogeneous area of flash floodsThe zoning map divided historical flash flood events with different densities into different regions, which was conducive to disaster prevention in the future
Intelligence driventhe Prahova river basin [115]Evaluated the application effect of analytic hierarchy process (AHP), fi (kNN), and K-Star (KS) algorithmsTen pairwise comparison matrices by AHP model were built for calculating the normalized weight of each flash flood predictive factorThe kNN-AHP integrated model had the best effect
Table 6. Typical cases of risk assessment.
Research AreaMethodResult
Lin et al. [119]Through the comprehensive assessment of the flash flood risk, the improved analytic hierarchy process (IAHP) method, and the iterative self-organizing data (ISODATA) in the GIS environment, the integration of maximum likelihood (ISO-Maximum) was analyzed The method of the weight of risk index was used to identify different risk clusters
Popa et al. [120]A database containing historical flash flood locations and rainstorm areas was created for training and testing the models. The models were calculated by GIS technology so as to generate flash flood and flash flood vulnerability mapsMLP-FR hybrid model had the highest performance
Ahmad et al. [121]The two methods used to evaluate the flash flood risk of five basins in Dir Lower were morphological sorting method and El-Shamy, both of which used the morphological parameters of flash flood sensitivityThe two methods were used to determine and identify subbasins with high, medium, and low flash flood sensitivity
Publisher’s Note: MDPI stays neutral with regard to jurisdictional claims in published maps and institutional affiliations.

