Article

Double Effect of Urbanization on Vegetation Growth in China’s 35 Cities during 2000–2020

1
School of Geographical Sciences, Nanjing University of Information Science & Technology, Nanjing 210044, China
2
State Key Laboratory of Remote Sensing Science, Aerospace Information Research Institute, Chinese Academy of Sciences, Beijing 100094, China
3
Department of Infrastructure Engineering, University of Melbourne, Melbourne, VIC 3010, Australia
4
Department of Hydraulic Engineering, Tsinghua University, Beijing 100084, China
5
School of Atmospheric Physics, Nanjing University of Information Science and Technology, Nanjing 210044, China
6
College of Environment & Safety Engineering, Fuzhou University, Fuzhou 350108, China
*
Author to whom correspondence should be addressed.
Remote Sens. 2022, 14(14), 3312; https://doi.org/10.3390/rs14143312
Submission received: 28 May 2022 / Revised: 5 July 2022 / Accepted: 6 July 2022 / Published: 9 July 2022
(This article belongs to the Section Urban Remote Sensing)

Abstract

:
In recent decades, the trade-off between urbanization and vegetation dynamics has broken the balance between human activities and social-economic dimensions. Our understanding towards the complex human–nature interactions, particularly the gradient of vegetation growth pattern across different city size, is still limited. Here, we selected 35 typical cities in China and classified them into five categories according to their resident population (e.g., megacities, megapolis, big cities, medium cities, and small cities). The spatial-temporal dynamics of vegetation growth for all 35 cities were inferred from the Moderate Resolution Imaging Spectroradiometer (MODIS) normalized difference vegetation index (NDVI). We found that averaged NDVI for all cities slightly decreased during 2000 and 2020, at a rate of 1.6 × 10⁻⁴ per year. Most cities were characterized with relatively lower NDVI in urban areas than its surrounding area (determined by a series of buffer zones, i.e., 1–25 km outside of the city boundary). The percentage of greening pixels increased from urban area to the 25 km buffer zone at a rate of 4.7 × 10⁻⁴ per km. We noticed that negative impact of urbanization on vegetation growth reduced as the distance to urban area increased, with an exception for megacities (e.g., Shanghai, Beijing, and Shenzhen). In megacities and megapolis, greening pixels were more concentrated at core urban area, implying that the positive urbanization effect on vegetation growth is much more apparent. We argue that urbanization in China might facilitate vegetation growth to a certain extent, for which an appropriate urban planning such as purposeful selection of city sizes could be a scientific guidance while targeting the city’s sustainable development goals in future.

1. Introduction

Urban development is generally accompanied with the planetary transition from natural land to artificial impervious surface [1,2]. Such transition is brought upon by a rapid expansion of global urban population with 1.8 billion in 1980 to 4.4 billion in 2020. According to the world bank record, the global urban population is expected to reach 5.5 billion by the year 2030. The existing rapid urbanization has led to various urban environmental problems, including urban heat island [3], PM2.5 air pollutions [4], and vegetation degradation [5]. Recently, there is a serious concern for the protection of urban green environments through the implementation of better plans and policies worldwide [5,6].
Elements of urban and peri-urban habitats with complex greenery and vegetation cover contribute to the integrity of urban ecosystems and provide a physical basis for ecological networks [7]. There is a general consensus about the negative impact of urbanization on vegetation cover [8,9], as urbanization transforms greenery into the impervious surface exerting pressures on urban ecosystems and consequently reduces the net primary productivity of vegetation [10]. Vegetation greenness of most China’s cities decreases in the context of a more intensive urbanization [11]. However, cities with rapid decline in NDVI usually coincide with higher surface urban heat island intensity [12]. On the contrary, increased urban temperatures and CO2 concentration are beneficial to rapid vegetation growth [13]. Meantime, the peri-urban fringe shows a reverse situation, where higher rural ozone (O3) exposures restrain the plant’s growth in rural sites [14]. Components of urban green infrastructure such as natural stream channel irrigation, organic, compost fertilization, and urban green space construction including artificial ponds, and corridor for wildlife, could mitigate the negative effects of urbanization on vegetation growth as well [7,15]. Hence, “urbanization versus vegetation growth” has become highly debatable, and therefore, a comprehensive understanding of this topic is widely anticipated through research and synthesis.
China’s built-up area of newly added from 2001 to 2018 ranked first among the world [16]. Meanwhile, its built-up areas have almost tripled from 2.2 × 10⁴ km2, in 2000, to 6.0 × 10⁴ km2, in 2020. The urban population is 482.7 million in 2000 and is 901 million in 2020, and it reaches relatively high urbanization rates from 36% to 64%. There are divergent opinions on the direction of vegetation response to urbanization among the cities of North America, Africa and Asia [5,14,17,18]. Despite high urbanization rates, the net impact of urbanization on vegetation growth are diverse across different cities, the plant biomass of urban areas is as high as double of that in suburban areas in the vicinity of New York city, and the urban pollutant emissions have a greater negative impact on areas outside the urban core [14]. However, a recent study displays that urban vegetation biomass over 59 African cities is less than that in rural areas, and urbanization also posed a negative impact on urban vegetation growth [18]. Meanwhile, there is a negative correlation between the impervious surface area fraction and the vegetation biomass, inferring from a survey from Boston to Harvard Forest and Worcester, Massachusetts [19]. In addition, studies of urban greenspaces in England used Landsat-based EVI (Enhanced Vegetation Index), the results showed that greenspaces decreased in 9 out of 13 cities in England between 2000 and 2008 [8]. The MODIS satellite products were used to assess the change in EVI and LST (land surface temperature) in Bengaluru and surrounding non-urban areas from 2003 to 2018, the results showed urbanization of Bengaluru has caused a decline in vegetation greenness [20]. The difference between urban and suburban EVI is also increasing in Yangtze River Basin cities, and the annual SUHII were significantly negatively correlated with the difference between urban and suburban EVI [12]. Notably, such findings are mostly based on a single city, or on multiple cities that do not consider the impact of city size and have rarely been thoroughly tested in cities with different sizes (i.e., measured by their resident populations), and we believe that detailed information could be further discovered based on this classification.
Here, we utilized MODIS NDVI and land surface temperature products to examine the pattern of urbanization impact on vegetation growth of China’s 35 large cities, with the data available from 2000 to 2020. This is because NDVI is strongly correlated with the fraction of photosynthetically active radiation absorbed by vegetation [21,22]. It is used to surrogate vegetation growth in many previous studies [23,24,25]. We will answer three critical questions: (1) Could we reveal different patterns of vegetation growth between urban and buffer zones in China’s 35 cities? (2) Does the effect of urbanization differ in cities with different size, and are they positive or negative? (3) Is there a linkage between changes in vegetation growth and surface urban heat island intensity? We anticipate that such results could provide important references for a better understanding towards the effects of urbanization on vegetation growth in cities of China and beyond.

2. Materials and Methods
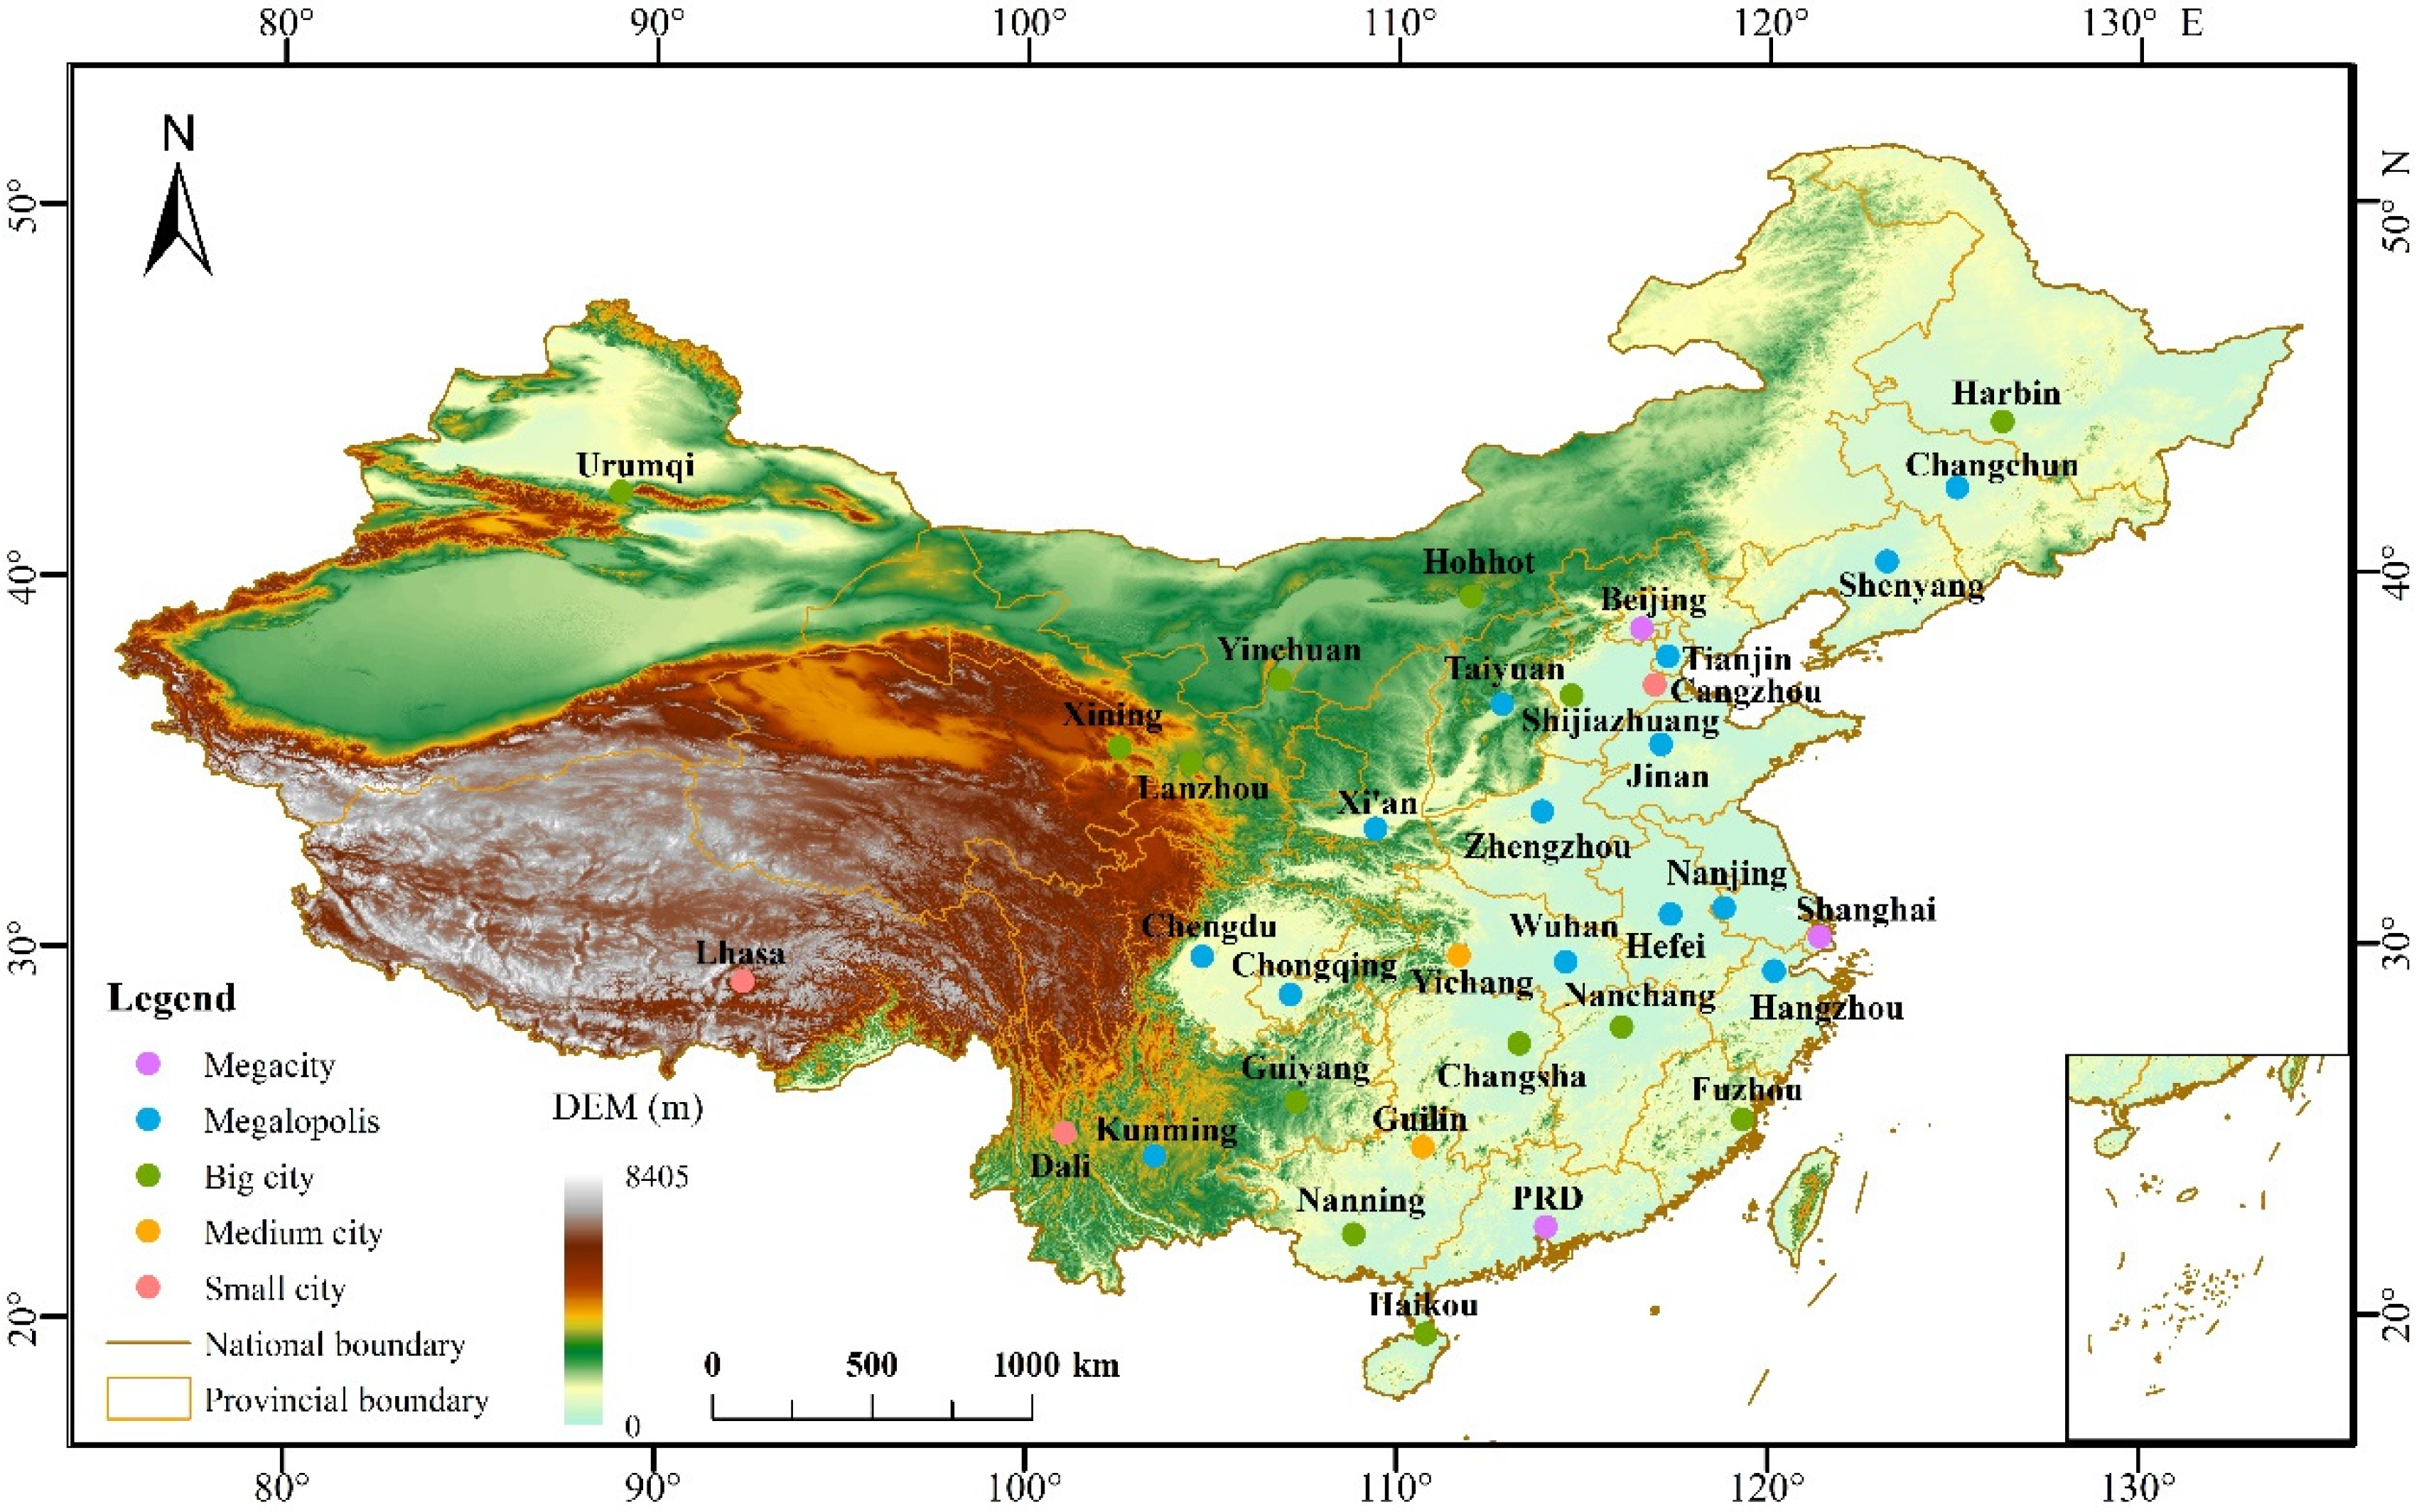
2.1. Study Area

A total of 35 cities from China (including 26 provincial capitals, 4 municipalities, 4 prefecture-level cities and 1 urban agglomeration) were analysed (Figure 1). The Pearl River Delta Urban Agglomeration (PRD) is listed as the urban agglomeration, which geographically covers the cities Guangzhou, Shenzhen, Dongguan, and Zhongshan. The selected cities, which feed 23.5% of the population and contribute 37.6% of the GDP in China, are dispersedly located in mainland China. (Chinese Statistical Yearbook, in 2010, available from: http://www.stats.gov.cn/tjsj/ndsj/2010/indexeh.htm, accessed on 22 March 2021). The selected cities are classified into five categories according to their permanent population as shown in Table 1 (available from: http://www.gov.cn/zhengce/content/2014-11/20/content_9225.htm, accessed on 4 April 2021).

2.2. Datasets

2.2.1. NDVI

We obtained Moderate Resolution Imaging Spectroradiometer (MODIS) normalized difference vegetation index (NDVI) dataset from the National Oceanic and Atmospheric Administration (NOAA) (i.e., MOD13A2, Version 6, https://lpdaac.usgs.gov/products/mod13a2v006/, accessed on 5 February 2021). It features a 16-day temporal resolution and a 1 km spatial resolution covering the period 2000–2020. This dataset has been widely applied in monitoring urban vegetation greenness [11,26], and could waive the negative effects on NDVI from atmospheric gases, thin cirrus clouds, and aerosols [27].
We aggregated the 16-day NDVI dataset into monthly scale using the maximum-value composition method, so as to eliminate the influence of unstable atmospheric conditions and other noise [28,29,30]. To prevent spurious NDVI variations brought by snow cover in winter time, growing season NDVI (from April to October) were utilized [5]. In addition, to reduce the impact of sparsely vegetated pixels on NDVI trends analysis, pixels with mean growing season NDVI lower than 0.05 were excluded from further analysis [31]. Least-squares linear regression were applied to detect NDVI trends for each pixel within the extracted urban area in 2010 during 2000–2020 for all cities and for each 35 cities.

2.2.2. Land Surface Temperature

The MODIS land surface temperature (LST) product from 2000 to 2020 were retrieved from the National Aeronautics and Space Administration (NASA)’s Terra satellite, with a temporal resolution of 8 days and a spatial resolution of 1 km (i.e., MOD11A2, Version 6, https://lpdaac.usgs.gov/products/mod11a2v006/, accessed on 26 February 2021). This product has been validated [32] and widely used to examine the urban heat island effect, due mainly to its wide spatial coverage, high accuracy and temporal resolution, nationally and regionally [33,34].

2.2.3. Urban Boundaries

Urban boundaries in 2010 form the Global Urban Boundaries (GUB) dataset is provided by the Finer Resolution Observation and Monitoring Global Land Cover website (http://data.ess.tsinghua.edu.cn/, accessed on 5 March 2021) [35]. It is derived from the Global Artificial Impervious Area (GAIA) mapping product with a high spatial resolution of 30 m [34], and is widely applied to identify urban boundaries [36,37].

2.3. Research Methods

2.3.1. Buffer Zone Analysis

To facilitate the understanding of urbanization impact, especially the NDVI dynamics between urban area and its surrounding buffer zones, we established 7 buffer zones, extending 0–1 km, 1–2 km, 2–5 km, 5–10 km, 10–15 km, 15–20 km, and 20–25 km from urban boundary for each city. Previous studies have shown that the footprint of urbanization impact on vegetation in urban areas had been estimated to be less than 20 km away from the periphery of the city around [38], then we defined the farthest buffer zone at 20–25 km (i.e., the background vegetation growth) and divided 0–25 km into seven buffer zones [39]. A 0–1 km buffer zone was assigned as the whole area from the city boundary (0 km) to 1 km outside the city, and so too with other buffer zones. To be specific, urban area is determined as the entire region within the city boundary. It is derived from urban boundaries dataset in 2010, and the suburban area is defined by the regions which are 5 km far away from urban boundaries [40].
NDVI is defined as the ratio of the difference between near-infrared reflectance and infrared visible reflectance to their sum and widely accepted as an indicator of vegetation growth [41]. Here, the proportion of greening (increase in NDVI) and degrading pixels (decrease in NDVI) was used to study the different pattern of vegetation growth between urban area and its buffer zones. Here, the size of pixel is 1 km*1 km image element with the same spatial resolution as NDVI and SUHII dataset.

2.3.2. Surface Urban Heat Island Intensity

Urbanization leads to higher temperature in urban areas than in surrounding areas, which is known as urban heat island (UHI) and brings a series of negative impacts on eco-environments [3,42]. There are two types of UHI: the atmospheric UHI calculated from the weather station network [43] and the surface UHI (SUHI) calculated by the thermal infrared remote sensing. The SUHI is widely used because the remote imageries are easily accessed and comprehensively in their coverage [44,45]. Here, we applied the surface urban heat island intensity (SUHII, a proxy of SUHI) to monitor urban heat islands. SUHII is calculated as the difference in land surface temperature between urban and suburban areas [11,46]. We performed Pearson’s correlation analysis to examine whether the NDVI was closely related to SUHII or not. Before calculation, these variables were detrended to avoid the spurious results of correlation analysis. Detrending means that the time series data were subtracted from the fitted line before calculating the correlation function, to eliminate the effect results of the original series trend [47].

3. Results

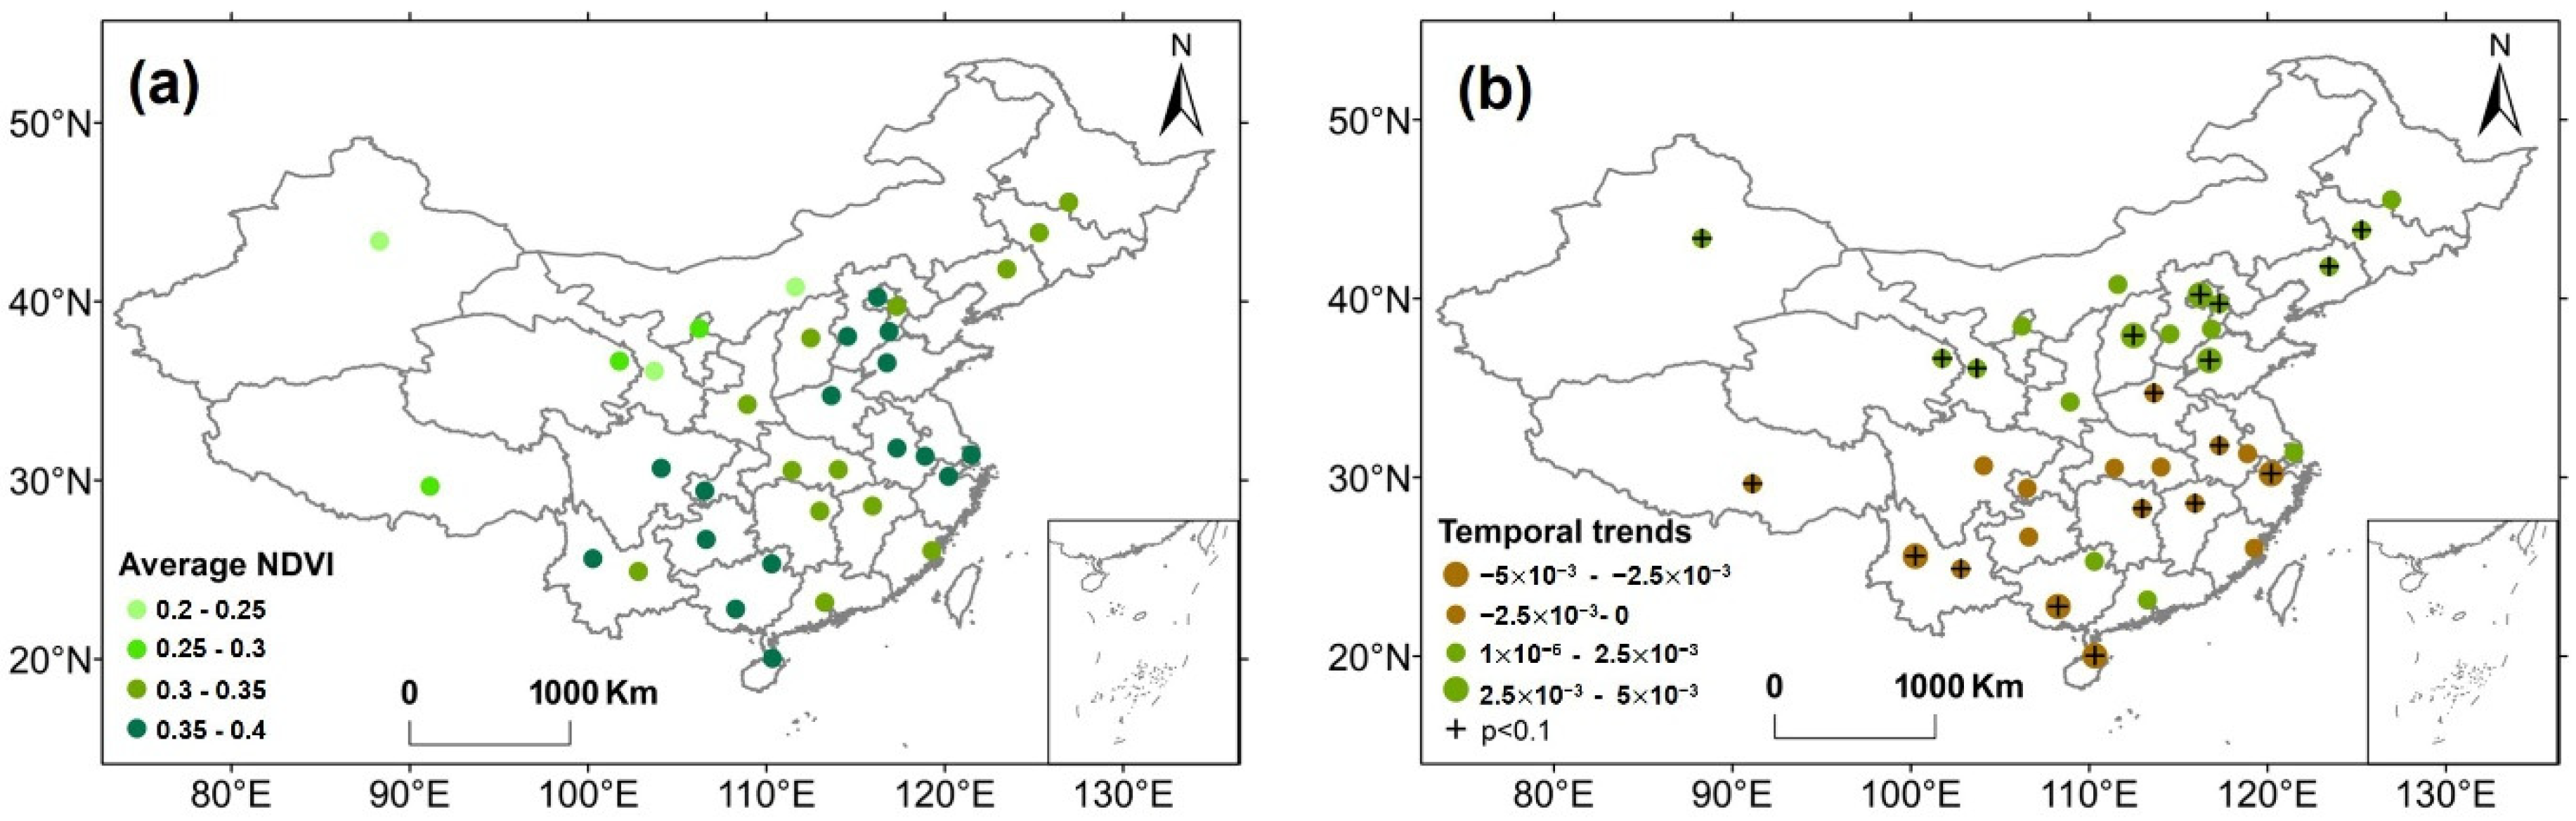
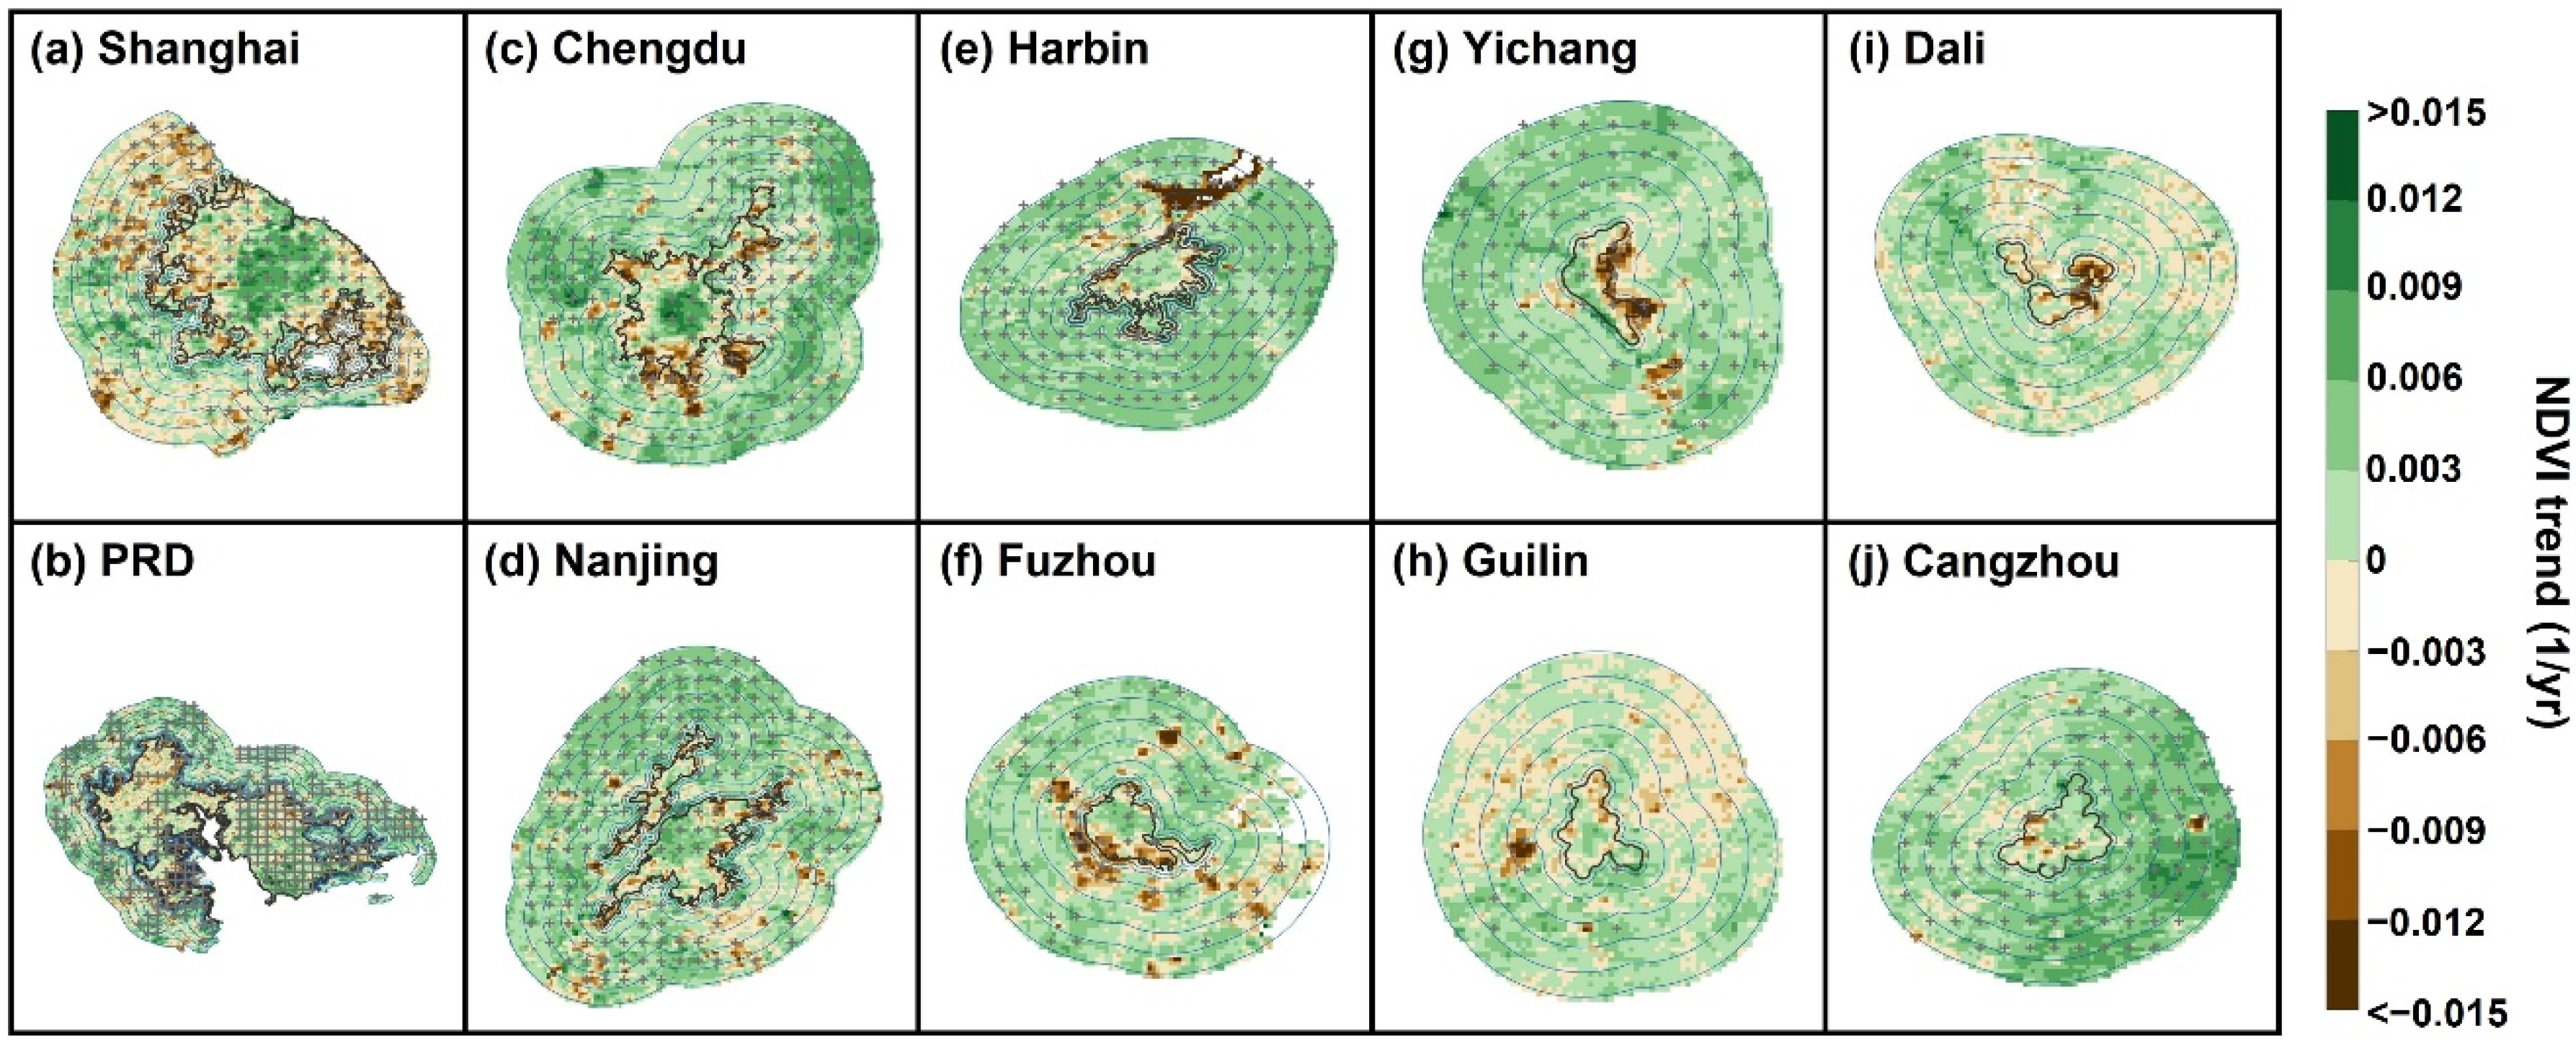
3.1. Spatiotemporal Variations of NDVI in China’s Cities

Temporal variations of NDVI in 35 typical cities have been shown in Figure 2, including megacities (Figure 2a–c), megapolis (Figure 2d–q), big cities (Figure 2r–ad), mid-sized cities (Figure 2ae–af), and small cities (Figure 2ag–ai). A slightly downward trend of the average NDVI of these cities was detected at a rate of 1.6 × 10⁻⁴ per year from 2000 to 2020 (Figure S1). The number of cities with positive NDVI trends was comparable to that with negative trends. For example, NDVI increased in 18 cities, in which 9 cities were significant (p < 0.05), while NDVI decreased in the remaining cities in which 10 cities were significant (p < 0.05). Overall, there was a decreasing NDVI trend in urban area, while increasing NDVI trends were generally monitored in their seven buffer zones. Such a trend was amplified by a spatial factor as the buffer zones was further apart from the urban boundary (Table S1).
Across the selected 35 cities, average NDVI of southern China’s cities was measured higher than that NDVI in northern cities (Figure 3a). However, the temporal trends of NDVI were decreasing in most southern cities (brown dots), while the reverse changes (green dots) were observed in majority of China’s northern cities (Figure 3b). Cities with higher NDVI (southern China cities) experienced increased vegetation degradation, while greening trends were apparent in cities with low NDVI (northern China cities).

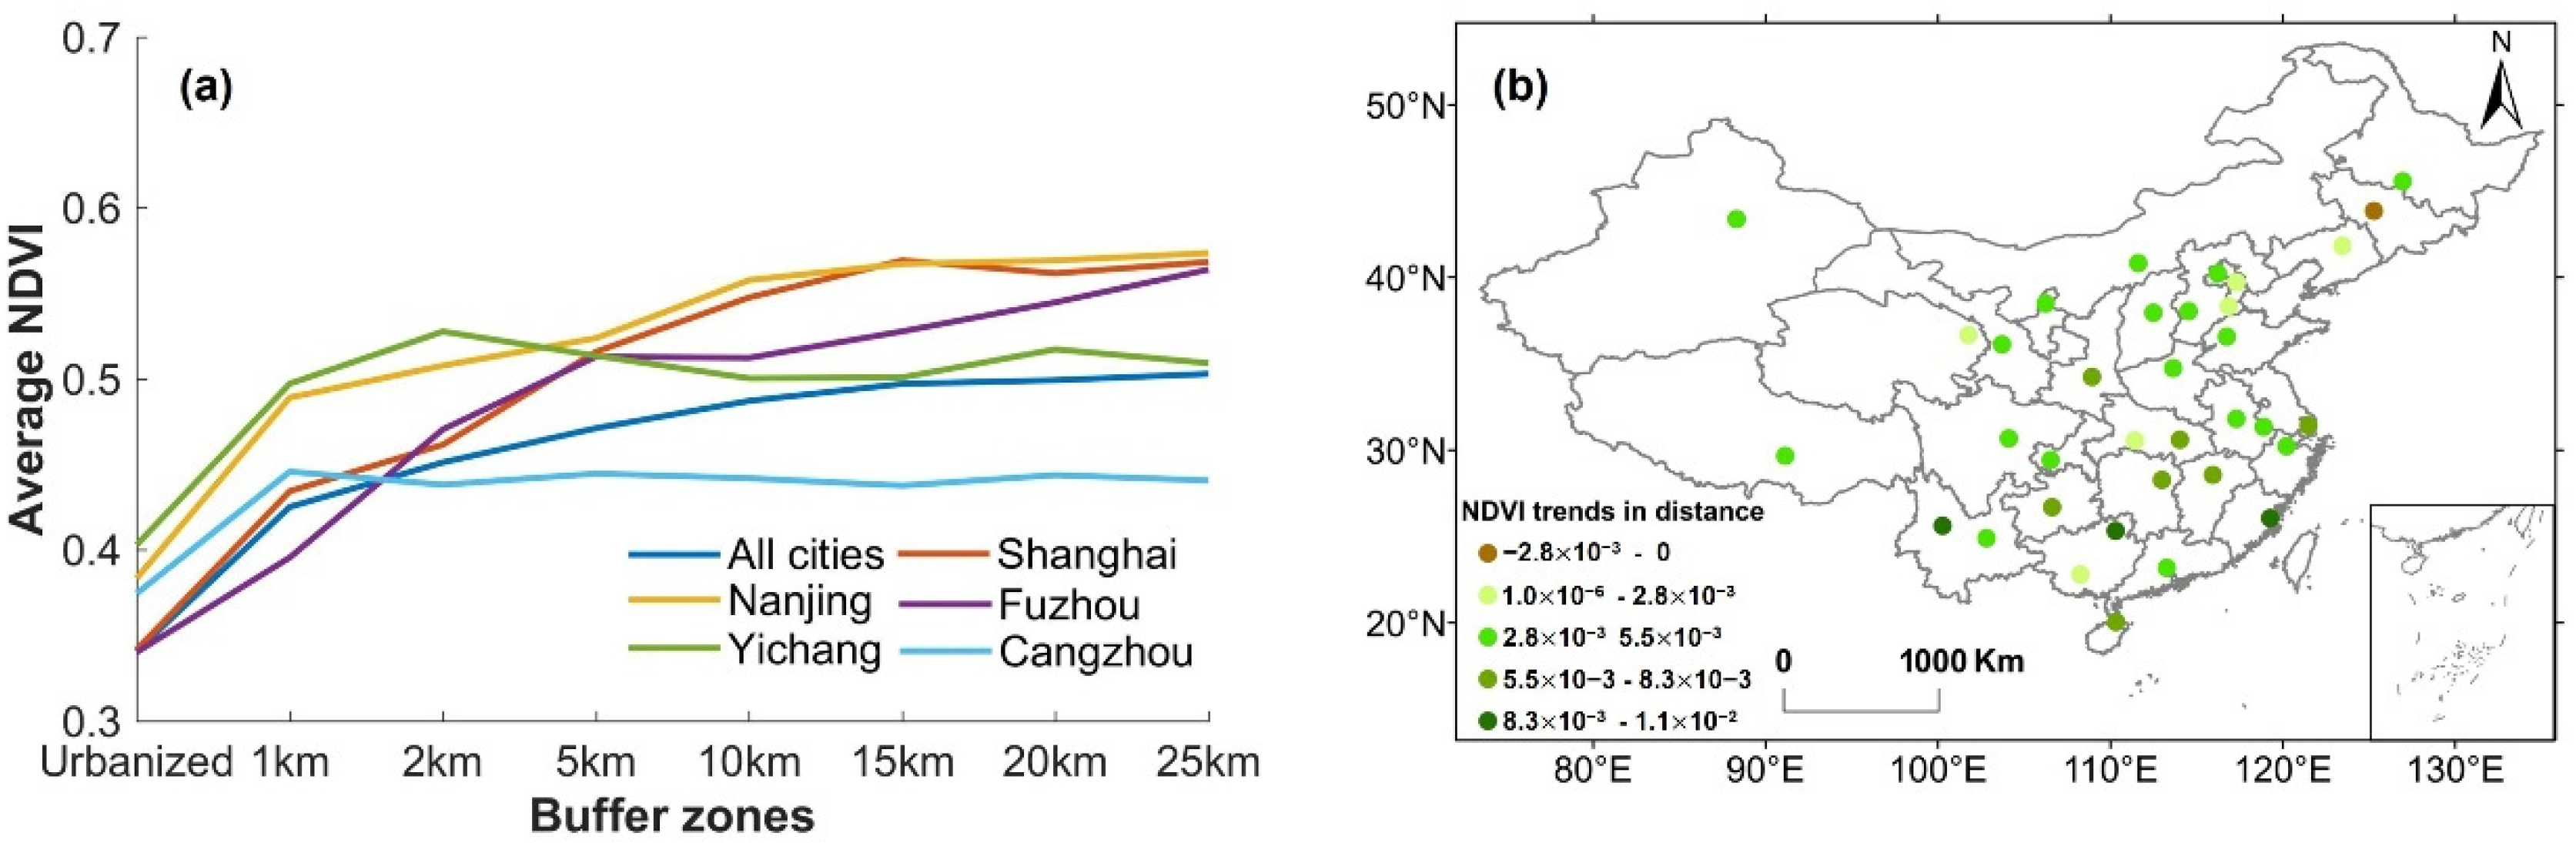
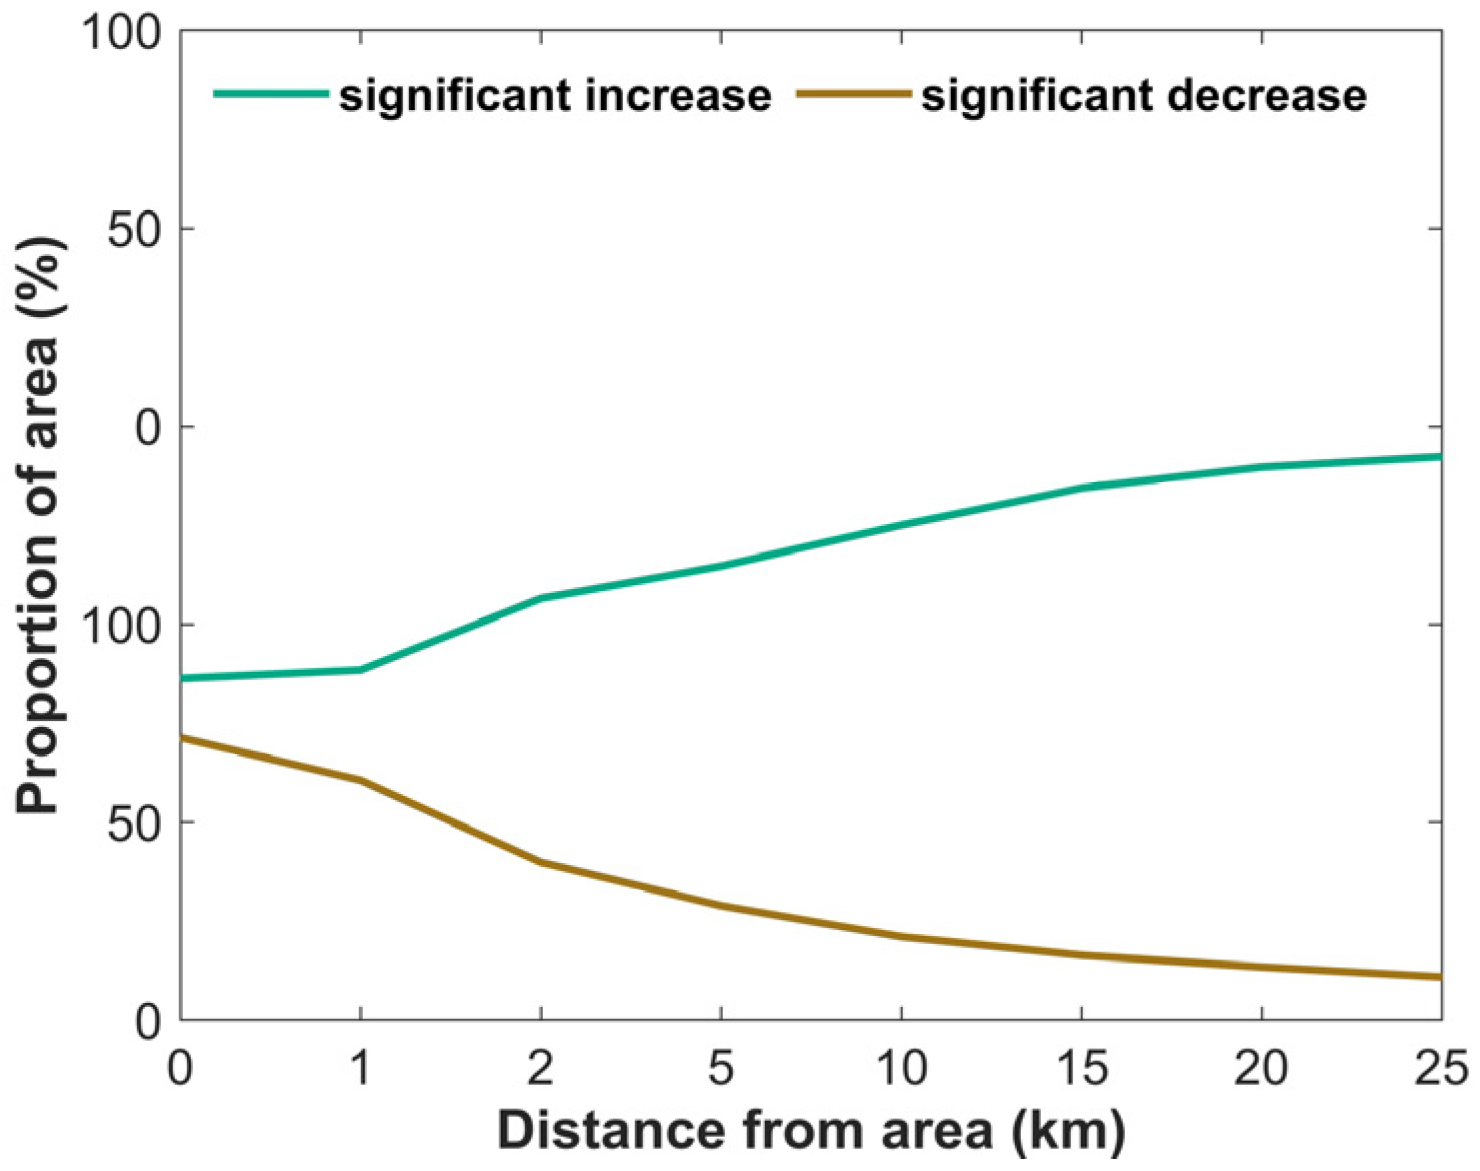
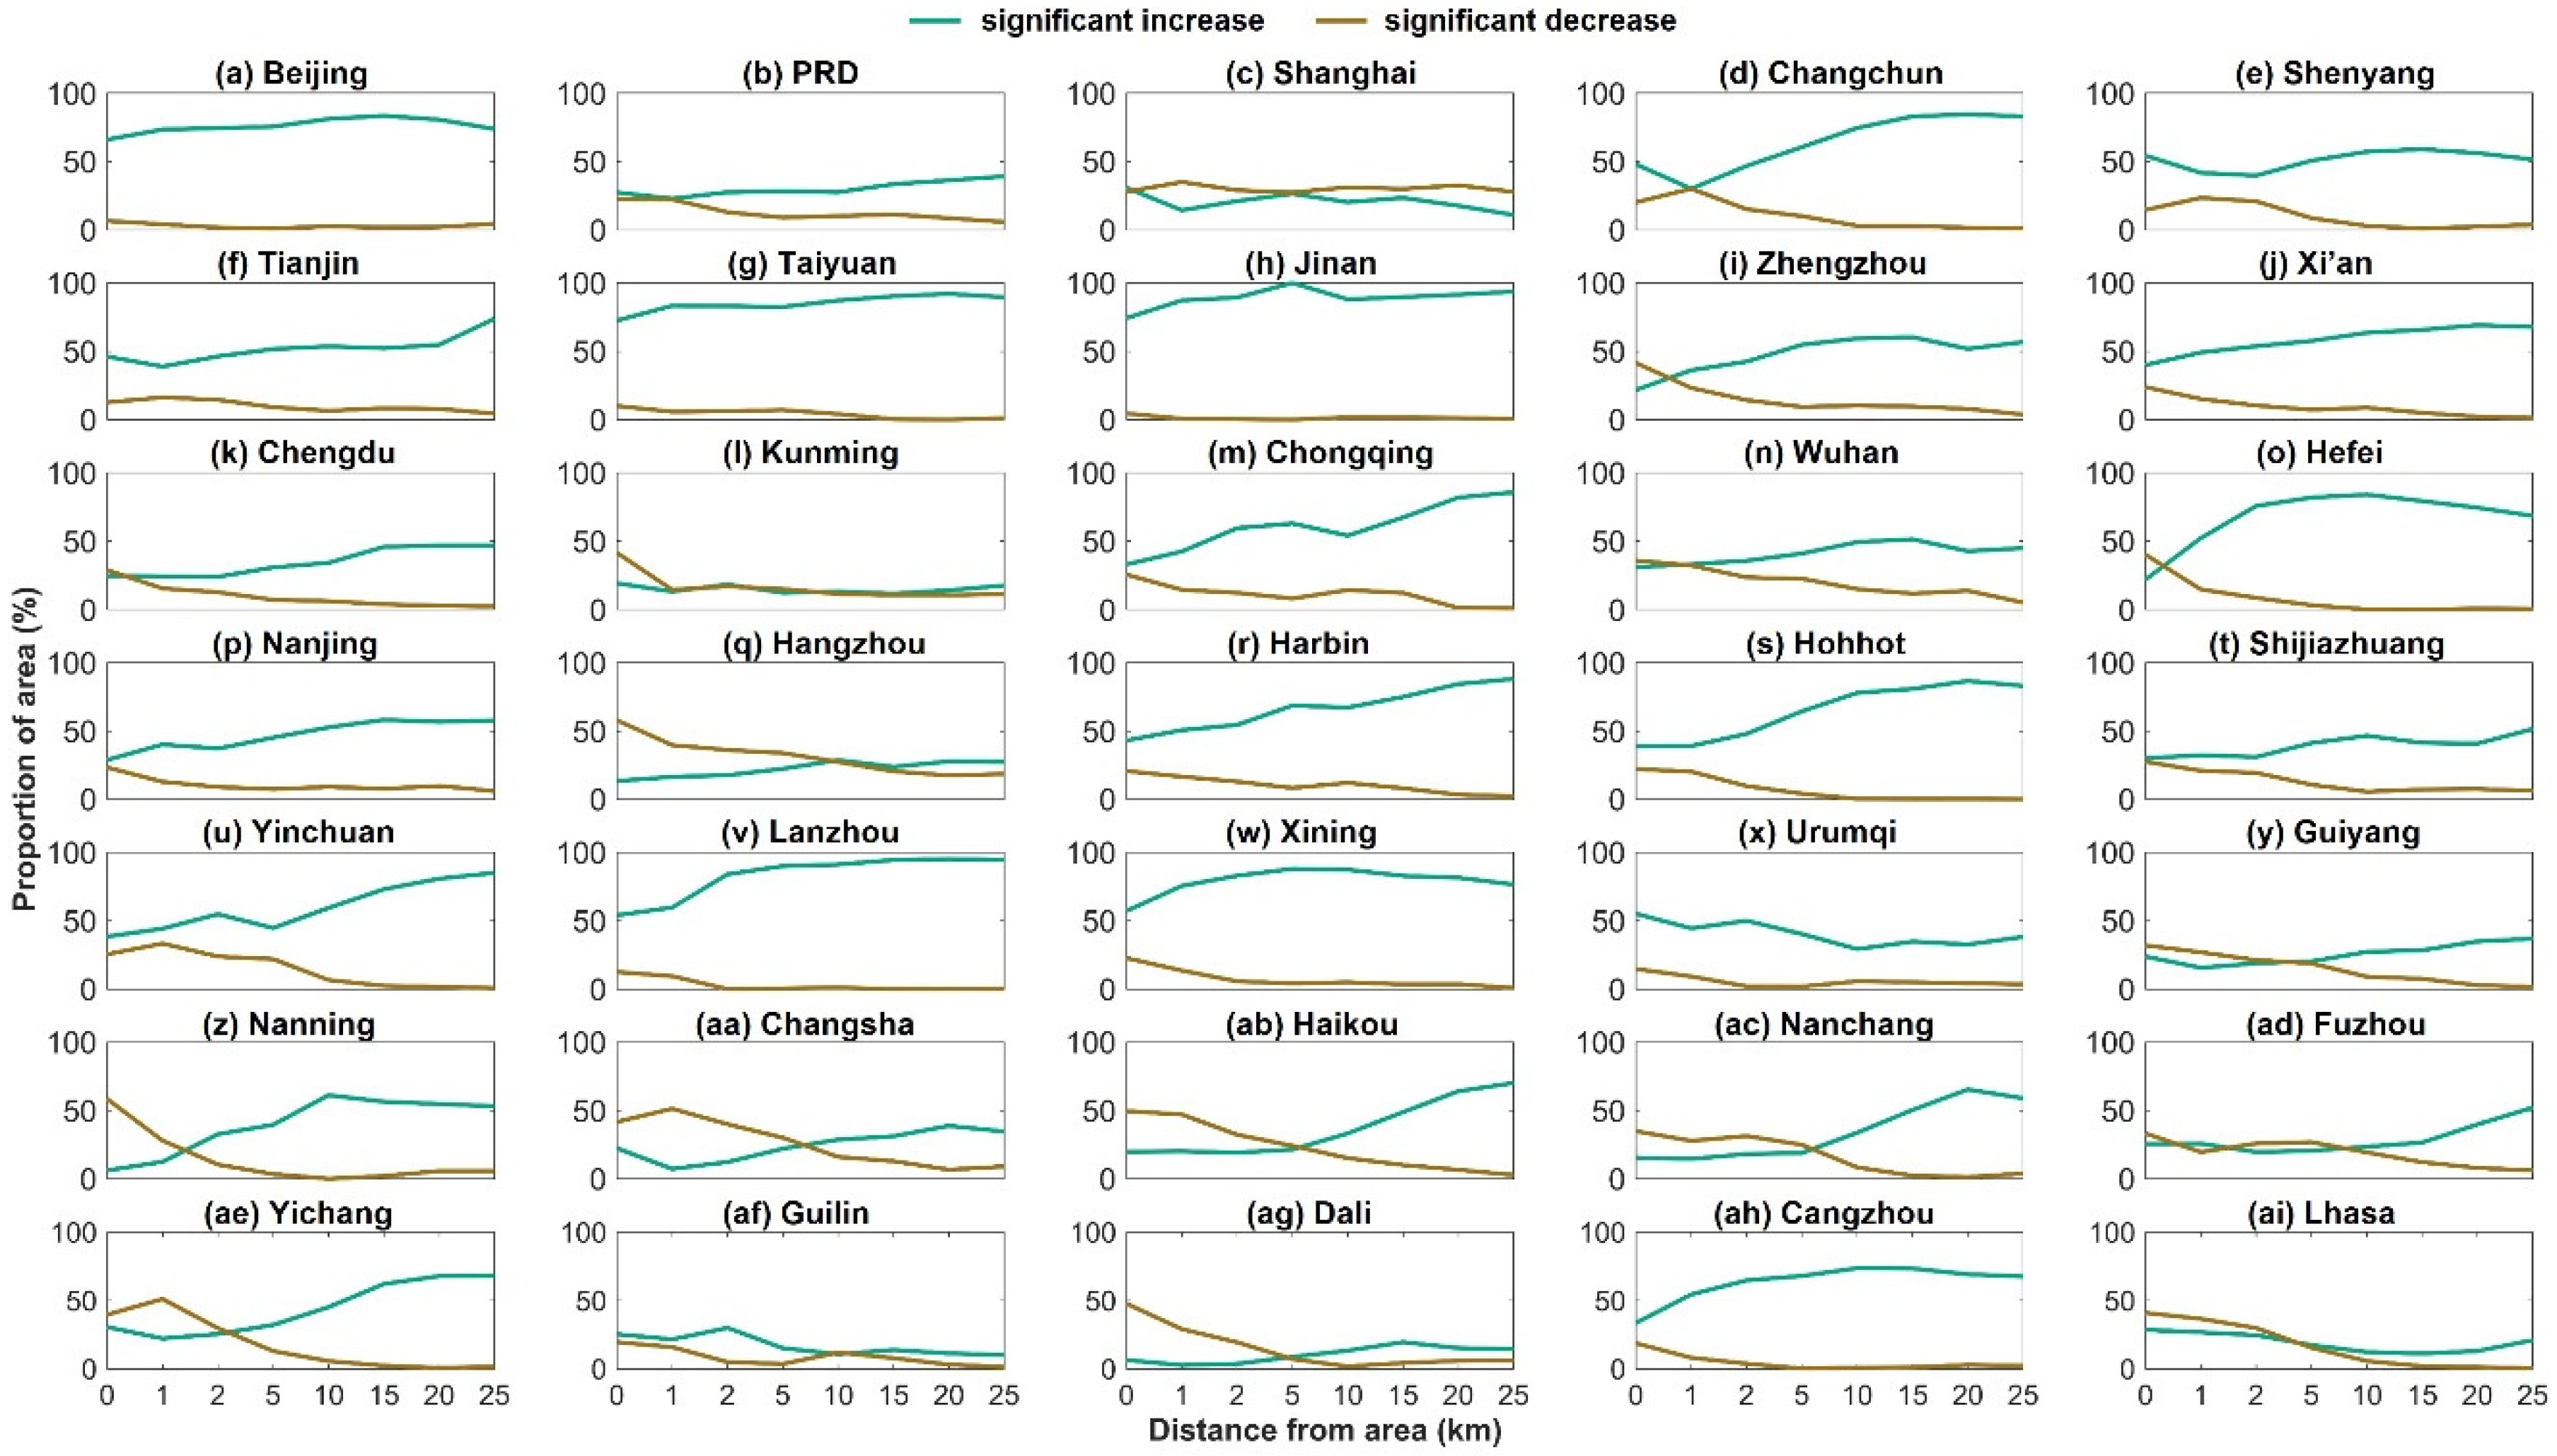
3.2. NDVI Gradients from Urban Area to Its Surrounding Buffer Zones

NDVI in urban area was consistently lower than that in its surrounding areas (as defined by 1 km, 2 km, 5 km, 10 km, 15 km, 20 km, and 25 km buffer zones, Figure 4a). Note that when the distance would get further apart, i.e., beyond the 15–20 km buffer zones, average NDVI would show a steady state and urbanization impact was found to be marginal (Figure 4a). For most cities, NDVI in buffer zones was positively related to their distance to urban area, except for Changchun (i.e., the brown point in Figure 4b). NDVI trends in the distance from urban area to 25 km buffer zone in southern cities (e.g., Fuzhou) were found to be relatively higher than their counterparts in northern cities (Figure 4b).
On average, 47% greening pixels in urban area and its seven buffer zones were detected across all 35 cities. The percentage of degradation pixels was only 13%. The proportion of significant greening pixels (35%) in urban area was slightly higher than the proportion of significant degrading pixels (29%). The percentage of significantly greening pixels increased at a rate of 0.0354 per km from the urban area to the 25 km buffer zone during the research period (Figure 5). The significantly degrading pixels in urban area was only 29% and decreased at a rate of 0.0351 per km from the urban area to the 25 km buffer zone.

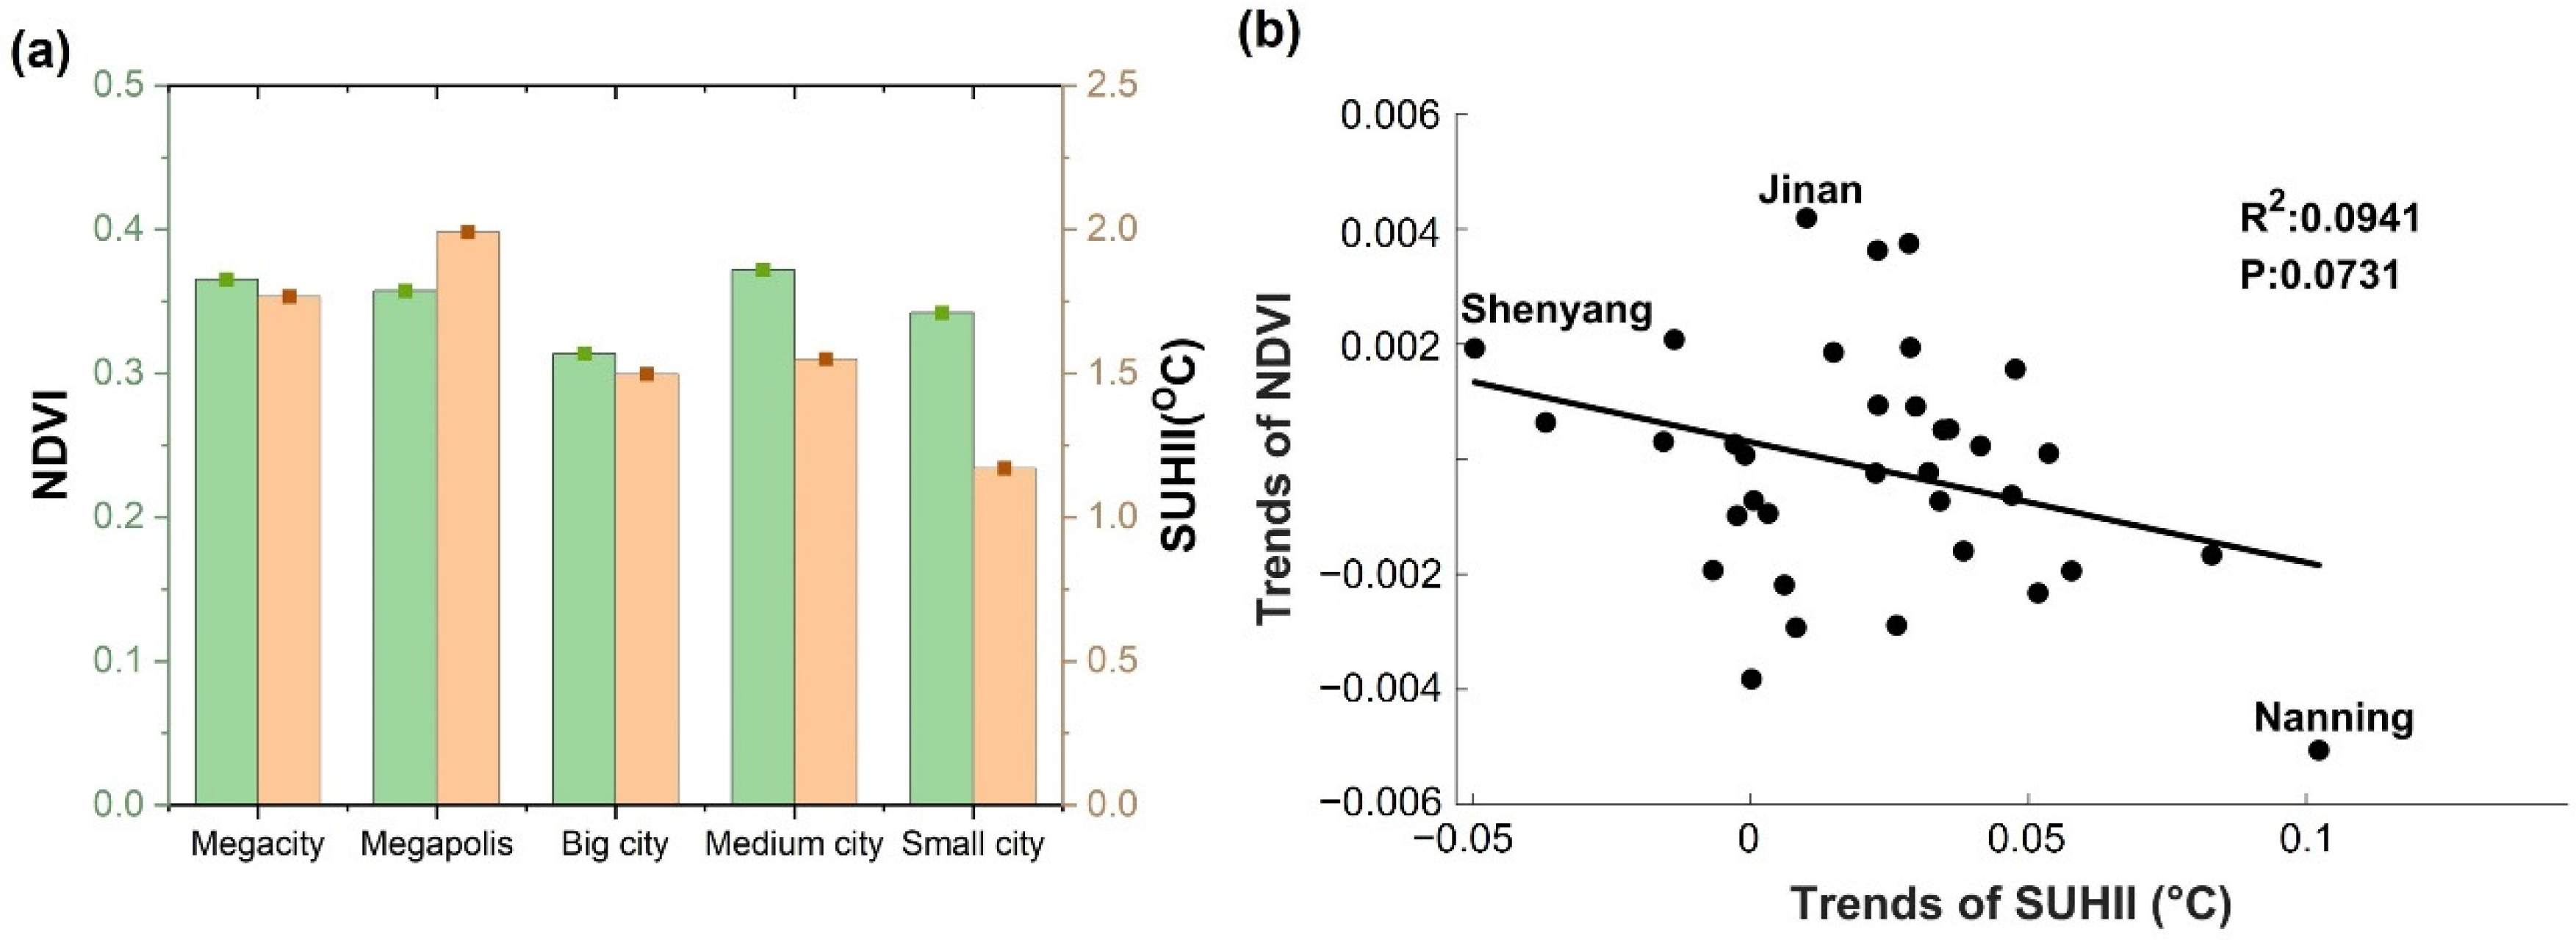
3.3. The Impact of Urbanization on NDVI across Different City Categories

The percentage of significantly greening pixels mostly increased in urban area, and all 7 buffer zones, except for the megacity Shanghai (Figure 6). Overall, the percentage of significant greening pixels within the regions from urban area to its 25 km buffer zone (48%) was much higher than the percentage of significant degrading pixels (12%). Shanghai was found to be an exception, where the percentage of significantly greening pixels (21%) was less than that of significantly degrading pixels (30%). Except megacities, the proportion of significant greening pixels in the buffer zone increased as the distance from the urban boundary would also increase (Figure 6d–aj) at an average rate of 0.037 per km. In detail, 88% of cities experienced significant increase in the proportion of greening pixels, and 91% of cities showed significant decrease in the percentage of degrading pixels at a rate of −0.036 per km (Figure 6d–ai). The megacity Shanghai was quite unique, in that there were no significant changes in the proportion of greening and degradation pixels, despite the distance from the urban boundary increasing. Nonetheless, the negative result of urbanization effect on NDVI was detected, albeit there were differences in the distance from the urban centre to buffer zones for megapolis, big cities, medium cities, and small cities. Although the negative influence of urbanization on NDVI in megacities still existed and was more extensive, no significant changes were detected as the distance from the urban boundary increased.
Overall, the spatial distribution of NDVI trends indicated a “sandwich” shape, i.e., darker greenness was observed in the urban area, vegetation degradation was detected further in the near buffer zones (the 1–5 km buffer zones) from the urban area, and afterward, vegetation greening was found in the far buffer zones (the 5–25 km buffer zones). To be specific, the greening pixels were found to be more concentrated in urban centres. For megacities and megapolis, the greening trend of NDVI was more apparent as shown in the figure as the darker green (Figure 7a–d). Meanwhile, the proportion of significant degradation pixels in megacities (e.g., 30.1% in Shanghai, and 12.8% in PRD) was found to be relatively higher than it in megapolis, big cities, mid-sized cities, and small cities (e.g., 4.8–15.2% in Figure 7e–j). In summary, as for the urban area and its surrounding area, the negative impact of urbanization on vegetation in megacities was higher than in other cities. However, the positive impact of urbanization on NDVI in urban centre in megacities and megapoliswas found to be more apparent than in the other cities.

3.4. Relationship between NDVI and Land Surface Temperature

The areas of increasing LST were predominant in the urban boundaries (Figure S2). Warming trends qualified by LST are more apparent in megacities and megapolis than that in big, mid-sized and small cities from 2000 to 2020 (Figure S2a–d). As shown in Figure 7, the distribution of warming regions coincided with the pattern of vegetation degradation. The correlation coefficients were found to be positive in urban areas but negative at city boundaries, especially for megacities and megapolis (Figure 8). The combination of Figure 7 and Figure S2 implied that the LST at city boundaries was increasing from 2000 to 2020, despite the observed vegetation browning. For example, NDVI was negatively correlated with LST at city boundaries (ranging from −0.68 to −0.76) for megacities and megapolis.

3.5. Relationship between NDVI and SUHII for all Cities

The range of average SUHII across 34 out of the 35 cities varied from 0 °C to 5 °C during 2000–2020 (Table S2). NDVI and SUHII in five categories cities showed that SUHII is higher in megapolis (1.99 °C) and megacities (1.77 °C), but lower in big cities (1.5 °C), medium cities (1.55 °C), and small cities (1.17 °C) (Figure 9a). However, the vegetation NDVI was found to be the lowest in big cities (0.314), but higher in megacities (0.365), megapolis (0.357), medium cities (0.372) and small cities (0.342). Both megacities and megapolis had higher SUHII and NDVI. The top three cities with the highest increase in SUHII were Nanning (0.102 °C per year, p < 0.01), Hefei (0.083 °C per year, p < 0.01), and Nanchang (0.058 °C per year, p < 0.01). The rate of changes in NDVI was found to be negatively correlated with SUHII from 2000–2020 (Figure 9b). Specifically, the slower change in NDVI was accompanied with the faster change in SUHII, and the vegetation even showed a shift, as the negative growth in cities where the rate of change in SUHII was greater than 0.014. Overall, the rate of changes in NDVI decreased by 0.14% per 1 °C increase in SUHII.

4. Discussion

Satellite-derived NDVI serves as key indicators for monitoring vegetation growth at regional and global scales [48,49,50]. Such a dataset has become potentially important to understand vegetation growth patterns between urban areas and surrounding regions (i.e., buffer zones) in 35 cities of China from 2000 to 2020, as well as the relationship between surface urban heat island and NDVI. There was a dual impact of urbanization on vegetation dynamics in China’s cities. The city size determines the trends of urban vegetation greenness, where the valid spatial factor such as distance, would play an important role in divergences in the vegetation cover specially in megacities. For example, in 35 cities and buffer zones, urbanization could have a diverse impact on urban vegetation, in the form of a decreasing trend of NDVI in urban centre and an increasing trend of NDVI in buffer zones. We noted that the annual average NDVI was consistently smaller in urban areas than in their buffer zones in 34 of 35 cities. These results were in line with previous regional-scale studies in China [10,20]. Vegetation degradation in urban area may be caused by conversion of the original vegetation cover to impervious surfaces [11,42]. Previous studies have found that the increase in built-up area is mainly at the expense of vegetation cover [51]. China has progressed from a traditional form of urbanization which focuses on growth rate to a new type of urbanization emphasizing on improved quality products as per increasing demands of the affluent population [52]. There was a significant greening trend in China over the past 30 years, but the growth rate has decreased over time, the increasing trend from 2000–2010 decreased in comparison to that of the 1982–1999 period [53,54].
Some studies suggest urbanization has resulted in urban vegetation browning in the past decades [5,48]. However, our results showed that despite the negative impact of urbanization (i.e., the gradual decline in urban vegetation greening), the percentage of greening pixels in the core urban area was more apparent than that in near buffer zones in megacities, such as Shanghai. In 2007, Shanghai government put forward the Greening Regulations of Shanghai Municipality, which set a standard for the proportion of the green area to the total land area of construction, specifying the greening objectives and the green area, the implementation of the regulation has contributed to the greening of the urban area in Shanghai. Moreover, the spatial distribution of NDVI trends indicated that the urban centres in China were gradually greening [55]. Based on these scientific outcomes, most Chinese municipal governments have begun to create new urban green areas, protect existing green areas and promote vegetation growth through artificial irrigation program. Such program was designed in the way where the local government authority would maximize urban ecosystem health using modern technologies [56]. Additionally, since vegetation growth is also influenced by rainfall [57], some studies found that urban precipitation increases along with the level of urbanization, which might further enhance vegetation growth in urban areas [58]. As a result, the negative effects of urbanization might be neutralized. Megacities and megapolis which urban centres with high urbanization levels might be more deeply affected by greater human attentions and activities including urban planning and policies.
We also found that urbanization impacts on vegetation growth appears to diminish as the distance to the urban area getting further. Our study suggested a valid distance of about 15–20 km, which was also very close to the range of previous studies (e.g., 20 km in radius [59]). Such difference was thought to be related to the differences in the spatial resolution of data sources, the study period, or inconsistent methods being used while demarking the buffer zones. The percentage of significant greening pixels in the urban centres was higher than it was in the 1–2 km buffer zones, and NDVI in urban centres of 35 analysed cities is increasing during the period 2000–2020. This means that urban centre favours its vegetation growth, which could be ascribed to the rapid reform in the construction of green areas in the core city area [49]. However, within the near buffer zones (1–2 km), the percentage of greening pixels was relatively low, and the vegetation browning was becoming more prevalent during 2000–2020, as shown in Figure 7, indicating that no occurrence of significant vegetation growth or transitions from impervious surface to vegetation cover in this area, similar conclusions were drawn by Gui et al. [60]. Hence, it was worth noting that urbanization in some megacities in China might have a wider valid distance impact on vegetation growth [5]. Because megacities (e.g., Shanghai, PRD) have reached the late stage or mature form of urbanization, and the surrounding areas have a wider industrial distribution, as a result, the vegetation was affected across a wider range.
Finally, the surface urban heat island intensity (SUHII) is significantly increased for most cities in China during 2000–2020, and it is in line with a study based on more than 419 global cities [46]. Contrary to the impact of artificial impervious surfaces (e.g., roads and buildings), vegetation could trap more latent heat fluxes and release less sensible heat fluxes during evapotranspiration, which then lowers the urban temperature [11]. (Unprecedented urban sprawls could rapidly transform urban vegetation areas (e.g., forest and farmland) into impervious surfaces by reducing the surface vegetation cover, which consequently leads to higher SUHII. Municipalities, provincial capitals, and urban clusters of the Pearl River Delta and the Yangtze River Delta in China are characterised by a high level of urbanization; in these cities, SUHII was found to be increasing over the past decade [12,61]. Based on the correlations between changes in NDVI and SUHII, we found that cities with larger rates of increase in SUHII also had higher rates of decline in the NDVI. A similar conclusion has been drawn by Yao et al. [12], who argued that cities with higher decreasing rates of EVI experienced larger increasing rates of SUHII. EVI is less sensitive to soil and atmospheric effects than NDVI [62]. Chakraborty and Lee found that the daytime surface UHI shows a positive temporal trend all over the world, the decrease in surface UHI intensity is accompanied with greater urban–rural EVI differences [63]. It is suggested that the surface UHI intensity in cities prone to heat stress can be suppressed by increasing urban vegetation [63], which are in favour of this study (i.e., the higher the growth rate of NDVI, the lower the growth rate of SUHII). As urban green and ecological network play a potential role in city’s sustainable development, we propose that the cities with high SUHII growth rates should receive additional attention while constructing urban greenery buffer zones.
Uncertainties remain in the results of this analysis. First, remotely sensed vegetation index NDVI as a proxy of vegetation growth at a regional scale suggests that there may exist uncertainty in studying urban vegetation growth. The detected increase/decrease in NDVI may result from the changes in species composition within pixels [64]. Moreover, urban afforestation and the development of green infrastructure also belongs to part of the urbanization activities. It is very difficult to quantify and separate the influence of these activities. In this study, changes in city NDVI are regarded as the combined impact of these activities on vegetation growth. Second, the impact of green infrastructure-related urban policies to explore the impact of urbanization on vegetation growth is important, which may introduce uncertainty. Third, clouds have a significant impact on growing season NDVI; although the products are composed of cloud-free data, and the maximum synthesis method was used to eliminate the effect of clouds before calculating the growing season NDVI, cloud can still produce uncertainty. Despite these uncertainties, our results confirm the importance of vegetation in mitigating SUHII, as reported by many previous studies [46,65], and we found that the impact of urbanization on vegetation is influenced by city size. We also acknowledge that there still exit some difficulties in detecting actual vegetation growth based on NDVI. Vegetation properties include vegetation type and leaf area index (LAI) [66], which may be a good proxy of vegetation growth. Additionally, since the Solar-Induced Fluorescence (SIF) has close linkage with transpiration and carbon assimilation, SIF may also be a good metric of vegetation growth. These two proxies, LAI and SIF, will be used in the following-up studies to represent the vegetation growth.

5. Conclusions

We conclude that vegetation greenness is decreasing in the core urban area of China and increasing in its suburban areas. Urbanization in China has a dual impact on urban vegetation growth, which depends on a city’s population size. When urbanization hinders urban vegetation growth, such negative impact reduces with the increase in the distance of buffer zones. We have benchmarked 15–25 km as the effective distance between the core urban centre and the buffer zone. However, for megacities, the percentage of vegetation greening area and browning area in buffer zones is still close to those of urban area, indicating that the negative urbanization impact has a wider distance or ‘spread-out’ effect. While the detected increasing trend of NDVI in centres of megacities and megapolis over the past 21 years also indicates that the urbanization may facilitate vegetation growth. Cities with increased SUHII showing reduced NDVI in China also suggests that quantitative studies on the vegetation changes due to urbanization process (e.g., built-up area expansion and agricultural activities) and environmental variables (e.g., solar radiation and nitrogen deposition) in urban area at the pixel or regional scale are needed, so as the comprehensive understanding of the driving mechanism of urban vegetation change caused by urbanization.

Supplementary Materials

The following supporting information can be downloaded at: https://www.mdpi.com/article/10.3390/rs14143312/s1, Figure S1: Temporal variations of average NDVI from 2000–2020 in China’s 35 cities; Figure S2: Spatial pattern of LST trends across different cities from 2000–2020; Table S1: The temporal trends of NDVI in 35 cities urban area and 7 buffer zones from 2000–2020; Table S2: The mean and temporal trends of SUHII in 35 cities from 2000–2020.

Author Contributions

Conceptualization, L.M. and Y.H.; methodology, L.M.; software, Y.H.; validation, L.M., G.R.K. and Y.S.; formal analysis, L.M.; investigation, L.M., Y.H., Q.W. and Y.S.; resources, L.M., Y.H., Y.S. and G.R.K.; data curation, Y.H.; writing—original draft preparation, L.M.; writing—review and editing, L.M., Y.H., Q.W. and Y.S; visualization, L.M. and Y.H.; supervision, L.M., Q.W. and X.Z.; project administration, L.M.; funding acquisition, L.M. All authors have read and agreed to the published version of the manuscript.

Funding

This research is supported by the Open Fund of State Key Laboratory of Remote Sensing Science (OFSLRSS202001), the National Natural Science Foundation of China (4210010673) and The Inner Mongolia Science & Technology Plan (2021ZD0045).

Data Availability Statement

All data resources are provided in the manuscript with links.

Conflicts of Interest

The authors declare no conflict of interest.

References

  1. Dawson, R.J.; Hall, J.W.; Barr, S.; Batty, M.; Bristow, A.; Carney, S.; Evans, S.; Ford, A.; Köhler, J.; Tight, M.; et al. A Blueprint for the Integrated Assessment of Climate Change in Cities Tyndall Centre Working Paper 104; University of East Anglia: Norwich, UK, 2007; Available online: http://www.tyndall.ac.uk/publications/working_papers/twp104.pdf (accessed on 28 May 2022).
  2. Small, C.; Sousa, D.; Yetman, G.; Elvidge, C.; MacManus, K. Decades of urban growth and development on the Asian megadeltas. Glob. Planet. Change 2018, 165, 62–89. [Google Scholar] [CrossRef]
  3. Arnfield, A.J. Two decades of urban climate research: A review of turbulence, exchanges of energy and water, and the urban heat island. Int. J. Clim. 2003, 23, 1–26. [Google Scholar] [CrossRef]
  4. Jiang, L.; Bai, L. Spatio-temporal characteristics of urban air pollutions and their causal relationships: Evidence from Beijing and its neighboring cities. Sci. Rep. 2018, 8, 1279. [Google Scholar] [CrossRef] [PubMed] [Green Version]
  5. Du, J.; Fu, Q.; Fang, S.; Wu, J.; He, P.; Quan, Z. Effects of rapid urbanization on vegetation cover in the metropolises of China over the last four decades. Ecol. Indic. 2019, 107, 105458. [Google Scholar] [CrossRef]
  6. Lee, J.-S.; Kim, J.-w. South Korea’s urban green energy strategies: Policy framework and local responses under the green growth. Cities 2016, 54, 20–27. [Google Scholar] [CrossRef]
  7. Kattel, G.R.; Elkadi, H.; Meikle, H. Developing a complementary framework for urban ecology. Urban For. Urban Green. 2013, 12, 498–508. [Google Scholar] [CrossRef] [Green Version]
  8. Dallimer, M.; Tang, Z.; Bibby, P.R.; Brindley, P.; Gaston, K.J.; Davies, Z.G. Temporal changes in greenspace in a highly urbanized region. Biol. Lett. 2011, 7, 763–766. [Google Scholar] [CrossRef]
  9. Grimm, N.B.; Faeth, S.H.; Golubiewski, N.E.; Redman, C.L.; Wu, J.; Bai, X.; Briggs, J.M. Global Change and the Ecology of Cities. Science 2008, 319, 756–760. [Google Scholar] [CrossRef] [Green Version]
  10. Guan, X.; Shen, H.; Li, X.; Gan, W.; Zhang, L. A long-term and comprehensive assessment of the urbanization-induced impacts on vegetation net primary productivity. Sci. Total Environ. 2019, 669, 342–352. [Google Scholar] [CrossRef]
  11. Zhou, D.; Zhao, S.; Liu, S.; Zhang, L. Spatiotemporal trends of terrestrial vegetation activity along the urban de-velopment intensity gradient in China’s 32 major cities. Sci. Total Environ. 2014, 488, 136–145. [Google Scholar] [CrossRef]
  12. Yao, R.; Wang, L.; Gui, X.; Zheng, Y.; Zhang, H.; Huang, X. Urbanization Effects on Vegetation and Surface Urban Heat Islands in China’s Yangtze River Basin. Remote Sens. 2017, 9, 540. [Google Scholar] [CrossRef] [Green Version]
  13. Searle, S.Y.; Boelman, N.T.; Schuster, W.S.; Turnbull, M.H.; Yakir, D.; Griffin, K.L. Urban environment of New York City promotes growth in northern red oak seedlings. Tree Physiol. 2012, 32, 389–400. [Google Scholar] [CrossRef] [PubMed]
  14. Gregg, J.W.; Jones, C.; Dawson, T.E. Urbanization effects on tree growth in the vicinity of New York City. Nature 2003, 424, 183–187. [Google Scholar] [CrossRef] [PubMed]
  15. Manninen, S.; Forss, S.; Venn, S. Management mitigates the impact of urbanization on meadow vegetation. Urban Ecosyst. 2010, 13, 461–481. [Google Scholar] [CrossRef]
  16. Sun, L.; Chen, J.; Li, Q.; Huang, D. Dramatic uneven urbanization of large cities throughout the world in recent decades. Nat. Commun. 2020, 11, 5366. [Google Scholar] [CrossRef]
  17. Fensholt, R.; Langanke, T.; Rasmussen, K.; Reenberg, A.; Prince, S.D.; Tucker, C.; Scholes, R.J.; Le, Q.B.; Bondeau, A.; Eastman, R.; et al. Greenness in semi-arid areas across the globe 1981–2007—An Earth observing satellite based analysis of trends and drivers. Remote Sens. Environ. 2012, 121, 144–158. [Google Scholar] [CrossRef]
  18. Yao, R.; Cao, J.; Wang, L.; Zhang, W.; Wu, X. Urbanization effects on vegetation cover in major African cities during 2001–2017. Int. J. Appl. Earth Obs. Geoinf. 2019, 75, 44–53. [Google Scholar] [CrossRef]
  19. Rao, P.; Hutyra, L.R.; Raciti, S.M.; Finzi, A.C. Field and remotely sensed measures of soil and vegetation carbon and nitrogen across an urbanization gradient in the Boston metropolitan area. Urban Ecosyst. 2013, 16, 593–616. [Google Scholar] [CrossRef]
  20. Sussman, H.S.; Raghavendra, A.; Zhou, L. Impacts of increased urbanization on surface temperature, vegetation, and aerosols over Bengaluru, India. Remote Sens. Appl. Soc. Environ. 2019, 16, 100261. [Google Scholar] [CrossRef]
  21. Myneni, R.; Keeling, C.D.; Tucker, C.J.; Asrar, G.; Nemani, R. Increased plant growth in the northern high latitudes from 1981 to 1991. Nature 1997, 386, 698–702. [Google Scholar] [CrossRef]
  22. Leng, S.; Huete, A.; Cleverly, J.; Gao, S.; Yu, Q.; Meng, X.; Qi, J.; Zhang, R.; Wang, Q. Assessing the Impact of Extreme Droughts on Dryland Vegetation by Multi-Satellite Solar-Induced Chlorophyll Fluorescence. Remote Sens. 2022, 14, 1581. [Google Scholar] [CrossRef]
  23. Menenti, M.; Azzali, S.; Verhoef, W.; van Swol, R. Mapping agroecological zones and time lag in vegetation growth by means of fourier analysis of time series of NDVI images. Adv. Space Res. 1993, 13, 233–237. [Google Scholar] [CrossRef]
  24. Tan, J.; Piao, S.; Chen, A.; Zeng, Z.; Ciais, P.; Janssens, I.; Mao, J.; Myneni, R.B.; Peng, S.; Peñuelas, J.; et al. Seasonally different response of photosynthetic activity to daytime and night-time warming in the Northern Hemisphere. Glob. Change Biol. 2015, 21, 377–387. [Google Scholar] [CrossRef] [PubMed]
  25. Jiao, W.; Wang, L.; Smith, W.K.; Chang, Q.; Wang, H.; D’Odorico, P. Observed increasing water constraint on vegetation growth over the last three decades. Nat. Commun. 2021, 12, 3777. [Google Scholar] [CrossRef] [PubMed]
  26. Xie, Y.; Weng, Q. Detecting urban-scale dynamics of electricity consumption at Chinese cities using time-series DMSP-OLS (Defense Meteorological Satellite Program-Operational Linescan System) nighttime light imageries. Energy 2016, 100, 177–189. [Google Scholar] [CrossRef]
  27. Didan, K.; Munoz, A.B.; Solano, R.; Huete, A. MODIS Vegetation Index User’s Guide (MOD13 Series); Vegetation Index Phenology Lab, University of Arizona: Tucson, AZ, USA, 2015. [Google Scholar]
  28. Holben, B.N. Characteristics of maximum-value composite images from temporal AVHRR data. Int. J. Remote Sens. 1986, 7, 1417–1434. [Google Scholar] [CrossRef]
  29. Piao, S.; Fang, J.; Zhou, L.; Guo, Q.; Henderson, M.; Ji, W.; Li, Y.; Tao, S. Interannual variations of monthly and seasonal normalized difference vegetation index (NDVI) in China from 1982 to 1999. J. Geophys. Res. Earth Surf. 2003, 108, 4401. [Google Scholar] [CrossRef]
  30. Zhou, L.; Tucker, C.J.; Kaufmann, R.K.; Slayback, D.; Shabanov, N.V.; Myneni, R.B. Variations in Northern Vegetation Activity Inferred from Satellite Data of Vegetation Index during 1981 to 1999. J. Geophys. Res. Atmos. 2001, 106, 20069–20083. [Google Scholar] [CrossRef]
  31. Zhao, X.; Tan, K.; Fang, J. NDVI-based international and seasonal variations of vegetation activity in Xinjiang during the period of 1982–2006. Arid. Zone Res. 2011, 28, 10–16. [Google Scholar] [CrossRef]
  32. Wan, Z. MODIS Land Surface Temperature Products Users’ Guide; University of California: Santa Barbara, CA, USA, 2013. [Google Scholar]
  33. Goswami, A.; Mohammad, P.; Sattar, A. A temporal study of Urban Heat Island (UHI)—A evaluation of Ahmedabad city, Gujarat. In Proceedings of the International Conference on Climate Change Mitigation and Technologies for Adaptation 2016, Shillong, India, 20–21 June 2016; pp. 1–5. [Google Scholar]
  34. Polydoros, A.; Mavrakou, T.; Cartalis, C. Quantifying the Trends in Land Surface Temperature and Surface Urban Heat Island Intensity in Mediterranean Cities in View of Smart Urbanization. Urban Sci. 2018, 2, 16. [Google Scholar] [CrossRef] [Green Version]
  35. Li, X.; Gong, P.; Zhou, Y.; Wang, J.; Bai, Y.; Chen, B.; Hu, T.; Xiao, Y.; Xu, B.; Yang, J.; et al. Mapping global urban boundaries from the global artificial impervious area (GAIA) data. Environ. Res. Lett. 2020, 15, 094044. [Google Scholar] [CrossRef]
  36. Xi, W.; Pei, T.; Liu, Q.; Song, C.; Liu, Y.; Chen, X.; Ma, J.; Zhang, Z. Quantifying the Time-Lag Effects of Human Mobility on the COVID-19 Transmission: A Multi-City Study in China. IEEE Access 2020, 8, 216752–216761. [Google Scholar] [CrossRef] [PubMed]
  37. Yang, Q.; Huang, X.; Yang, J.; Liu, Y. The relationship between land surface temperature and artificial impervious surface fraction in 682 global cities: Spatiotemporal variations and drivers. Environ. Res. Lett. 2021, 16, 024032. [Google Scholar] [CrossRef]
  38. Zhou, D.; Zhao, S.; Zhang, L.; Sun, G.; Liu, Y. The footprint of urban heat island effect in China. Sci. Rep. 2015, 5, 11160. [Google Scholar] [CrossRef] [PubMed]
  39. Zhou, D.; Zhao, S.; Zhang, L.; Liu, S. Remotely sensed assessment of urbanization effects on vegetation phenology in China’s 32 major cities. Remote Sens. Environ. 2016, 176, 272–281. [Google Scholar] [CrossRef] [Green Version]
  40. Zhang, P.; Imhoff, M.L.; Wolfe, R.E.; Bounoua, L. Characterizing urban heat islands of global settlements using MODIS and nighttime lights products. Can. J. Remote Sens. 2010, 36, 185–196. [Google Scholar] [CrossRef] [Green Version]
  41. Tucker, C.J.; Pinzon, J.E.; Brown, M.E.; Slayback, D.A.; Pak, E.W.; Mahoney, R.; Vermote, E.F.; El Saleous, N. An extended AVHRR 8-km NDVI dataset compatible with MODIS and SPOT vegetation NDVI data. Int. J. Remote Sens. 2005, 26, 4485–4498. [Google Scholar] [CrossRef]
  42. Imhoff, M.L.; Bounoua, L.; DeFries, R.; Lawrence, W.T.; Stutzer, D.; Tucker, C.J.; Ricketts, T. The consequences of urban land transformation on net primary productivity in the United States. Remote Sens. Environ. 2004, 89, 434–443. [Google Scholar] [CrossRef]
  43. Karl, T.R.; Quayle, R.G. Climate change in fact and in theory: Are we collecting the facts? Clim. Change 1988, 13, 5–17. [Google Scholar] [CrossRef]
  44. Clinton, N.; Gong, P. MODIS detected surface urban heat islands and sinks: Global locations and controls. Remote Sens. Environ. 2013, 134, 294–304. [Google Scholar] [CrossRef]
  45. Imhoff, M.L.; Zhang, P.; Wolfe, R.E.; Bounoua, L. Remote sensing of the urban heat island effect across biomes in the continental USA. Remote Sens. Environ. 2010, 114, 504–513. [Google Scholar] [CrossRef] [Green Version]
  46. Peng, S.; Piao, S.; Ciais, P.; Friedlingstein, P.; Ottle, C.; Bréon, F.-M.; Nan, H.; Zhou, L.; Myneni, R.B. Surface Urban Heat Island Across 419 Global Big Cities. Environ. Sci. Technol. 2012, 46, 696–703. [Google Scholar] [CrossRef]
  47. Wu, Z.; Huang, N.E.; Long, S.R.; Peng, C.-K. On the trend, detrending, and variability of nonlinear and nonstationary time series. Proc. Natl. Acad. Sci. USA 2007, 104, 14889–14894. [Google Scholar] [CrossRef] [PubMed] [Green Version]
  48. Liu, Y.; Wang, Y.; Peng, J.; Du, Y.; Liu, X.; Li, S.; Zhang, D. Correlations between Urbanization and Vegetation Degradation across the World’s Metropolises Using DMSP/OLS Nighttime Light Data. Remote Sens. 2015, 7, 2067–2088. [Google Scholar] [CrossRef] [Green Version]
  49. Luo, Y.; Sun, W.; Yang, K.; Zhao, L. China urbanization process induced vegetation degradation and improvement in recent 20 years. Cities 2021, 114, 103207. [Google Scholar] [CrossRef]
  50. Zeng, J.; Zhang, R.; Qu, Y.; Bento, V.A.; Zhou, T.; Lin, Y.; Wu, X.; Qi, J.; Shui, W.; Wang, Q. Improving the drought monitoring capability of VHI at the global scale via ensemble indices for various vegetation types from 2001 to 2018. Weather Clim. Extrem. 2022, 35, 100412. [Google Scholar] [CrossRef]
  51. Siddique, S.; Uddin, M. Green space dynamics in response to rapid urbanization: Patterns, transformations and topographic influence in Chattogram city, Bangladesh. Land Use Policy 2022, 114, 105974. [Google Scholar] [CrossRef]
  52. Yu, B. Ecological effects of new-type urbanization in China. Renew. Sustain. Energy Rev. 2021, 135, 110239. [Google Scholar] [CrossRef]
  53. Peng, S.S.; Chen, A.P.; Xu, L.; Cao, C.X.; Fang, J.Y.; Myneni, R.B.; Pinzon, J.E.; Tucker, C.J.; Piao, S.L. Recent change of vegetation growth trend in China. Environ. Res. Lett. 2011, 6, 044027. [Google Scholar] [CrossRef]
  54. Piao, S.; Yin, G.; Tan, J.; Cheng, L.; Huang, M.; Li, Y.; Liu, R.; Mao, J.; Myneni, R.B.; Peng, S.; et al. Detection and attribution of vegetation greening trend in China over the last 30 years. Glob. Change Biol. 2015, 21, 1601–1609. [Google Scholar] [CrossRef]
  55. Li, D.; Wu, S.; Liang, Z.; Li, S. The impacts of urbanization and climate change on urban vegetation dynamics in China. Urban For. Urban Green. 2020, 54, 126764. [Google Scholar] [CrossRef]
  56. Nitoslawski, S.A.; Galle, N.J.; Van Den Bosch, C.K.; Steenberg, J.W. Smarter ecosystems for smarter cities? A review of trends, technologies, and turning points for smart urban forestry. Sustain. Cities Soc. 2019, 51, 101770. [Google Scholar] [CrossRef]
  57. Zhang, R.; Qi, J.; Leng, S.; Wang, Q. Long-Term Vegetation Phenology Changes and Responses to Preseason Temperature and Precipitation in Northern China. Remote Sens. 2022, 14, 1396. [Google Scholar] [CrossRef]
  58. Yang, M.-N.; Xu, Y.-P.; Pan, G.-B.; Han, L.-F. Impacts of Urbanization on Precipitation in Taihu Lake Basin, China. J. Hydrol. Eng. 2014, 19, 739–746. [Google Scholar] [CrossRef]
  59. Zhang, X.; Friedl, M.A.; Schaaf, C.B.; Strahler, A.H.; Schneider, A. The footprint of urban climates on vegetation phenology. Geophys. Res. Lett. 2004, 31, L12209. [Google Scholar] [CrossRef]
  60. Gui, X.; Wang, L.; Yao, R.; Yu, D.; Li, C. Investigating the urbanization process and its impact on vegetation change and urban heat island in Wuhan, China. Environ. Sci. Pollut. Res. 2019, 26, 30808–30825. [Google Scholar] [CrossRef]
  61. Yao, R.; Wang, L.; Huang, X.; Niu, Y.; Chen, Y.; Niu, Z. The influence of different data and method on estimating the surface urban heat island intensity. Ecol. Indic. 2018, 89, 45–55. [Google Scholar] [CrossRef]
  62. Waring, R.; Coops, N.; Fan, W.; Nightingale, J. MODIS enhanced vegetation index predicts tree species richness across forested ecoregions in the contiguous U.S.A. Remote Sens. Environ. 2006, 103, 218–226. [Google Scholar] [CrossRef]
  63. Chakraborty, T.; Lee, X. A simplified urban-extent algorithm to characterize surface urban heat islands on a global scale and examine vegetation control on their spatiotemporal variability. Int. J. Appl. Earth Obs. Geoinf. 2019, 74, 269–280. [Google Scholar] [CrossRef]
  64. Glenn, E.P.; Huete, A.R.; Nagler, P.L.; Nelson, S.G. Relationship Between Remotely-sensed Vegetation Indices, Canopy Attributes and Plant Physiological Processes: What Vegetation Indices Can and Cannot Tell Us About the Landscape. Sensors 2008, 8, 2136–2160. [Google Scholar] [CrossRef] [Green Version]
  65. Li, J.; Song, C.; Cao, L.; Zhu, F.; Meng, X.; Wu, J. Impacts of landscape structure on surface urban heat islands: A case study of Shanghai, China. Remote Sens. Environ. 2011, 115, 3249–3263. [Google Scholar] [CrossRef]
  66. Paschalis, A.; Chakraborty, T.; Fatichi, S.; Meili, N.; Manoli, G. Urban forests as main regulator of the evaporative cooling effect in cities. AGU Adv. 2021, 2, e2020AV000303. [Google Scholar] [CrossRef]
Figure 1. The geographical distribution of 35 cities in China.
Remotesensing 14 03312 g001
Figure 2. Temporal variations of NDVI in selected 35 cities of China from 2000 to 2020. Megacities (ac), megapolis (dq), big cities (rad), mid-sized cities (ae,af), and small cities (agai). Marked ‘p < 0.05’ means the city NDVI through 5% level significance test.
Remotesensing 14 03312 g002
Figure 3. (a) Average NDVI across all the selected 35 cities during 2000–2020; (b) Spatial distributions of temporal trends of NDVI across all the selected 35 cities during 2000–2020. Green dots indicate vegetation greening, and brown dots indicates vegetation degradation.
Remotesensing 14 03312 g003
Figure 4. (a) Average NDVI for all 35 cities and 5 selected cities (Shanghai, Chengdu, Harbin, Yichang, and Dali) from the urban area to its seven buffer zones; (b) NDVI trends in distance from urban area to 25 km buffer zones for all cities. Here, NDVI trends in distance indicates NDVI slope from urban area to 25 km buffer zone. Values larger than 0 indicate that NDVI increases from urban area to 25 km buffer zone, and values lower than 0 indicate the opposite trend.
Remotesensing 14 03312 g004
Figure 5. Pixel variations of significant increase and significant decrease across all the 35 cities (p < 0.05).
Remotesensing 14 03312 g005
Figure 6. Pixel percentage of vegetation changes in significant increase and significant decrease across 35 cities from 2000–2020. Megacities (ac), megapolis (dq), big cities (rad), mid-sized cities (ae,af), and small cities (agai).
Remotesensing 14 03312 g006
Figure 7. Spatial pattern of NDVI trends across different cities from 2000–2020. The ten cities are representative of different sizes, e.g., megacities (Shanghai, and PRD), megapolis (Chengdu, and Nanjing), big cities (Harbin, and Fuzhou), mid-sized cities (Yichang, and Guilin), and small cities (Dali, and Cangzhou). The cross-shaped portion illustrate the trends statistically significant at the 5% levels. The black line is the boundary of the city, and the grey line is the boundary of the buffer zones.
Remotesensing 14 03312 g007
Figure 8. Spatial pattern of correlation coefficient between NDVI and LST across ten cities from 2000–2020. The cross-shaped portion illustrate the trends statistically significant at the 5% levels. The black lines represent city boundaries.
Remotesensing 14 03312 g008
Figure 9. (a) Comparison of NDVI and SUHII in five categories; (b) Linear regression relationships between the trends of SUHII and the trends of NDVI across 35 cities during 2000–2020. Each dot represents a city.
Remotesensing 14 03312 g009
Table 1. The classifications of 35 cities in China.
City CategoriesResident PopulationNumbersCity Names
Megacities>10 million3Shanghai, Beijing, PRD
Megapolis5–10 million14Chengdu, Nanjing, Wuhan, Tianjin, Chongqing, Shenyang, Xi’an, Hangzhou, Zhengzhou, Jinan, Changchun, Taiyuan, Kunming, Hefei
Big cities1–5 million13Harbin, Fuzhou, Hohhot, Changsha, Urumqi, Shijiazhuang, Guiyang, Nanning, Lanzhou, Nanchang, Haikou, Xining, Yinchuan
Medium cities0.5–1 million2Yichang, Guilin
Small cities<0.5 million3Dali, Cangzhou, Lhasa
Publisher’s Note: MDPI stays neutral with regard to jurisdictional claims in published maps and institutional affiliations.

