
Research on the Applicability of DInSAR, Stacking-InSAR and SBAS-InSAR for Mining Region Subsidence Detection in the Datong Coalfield


Abstract
:1. Introduction
2. Data and Methods
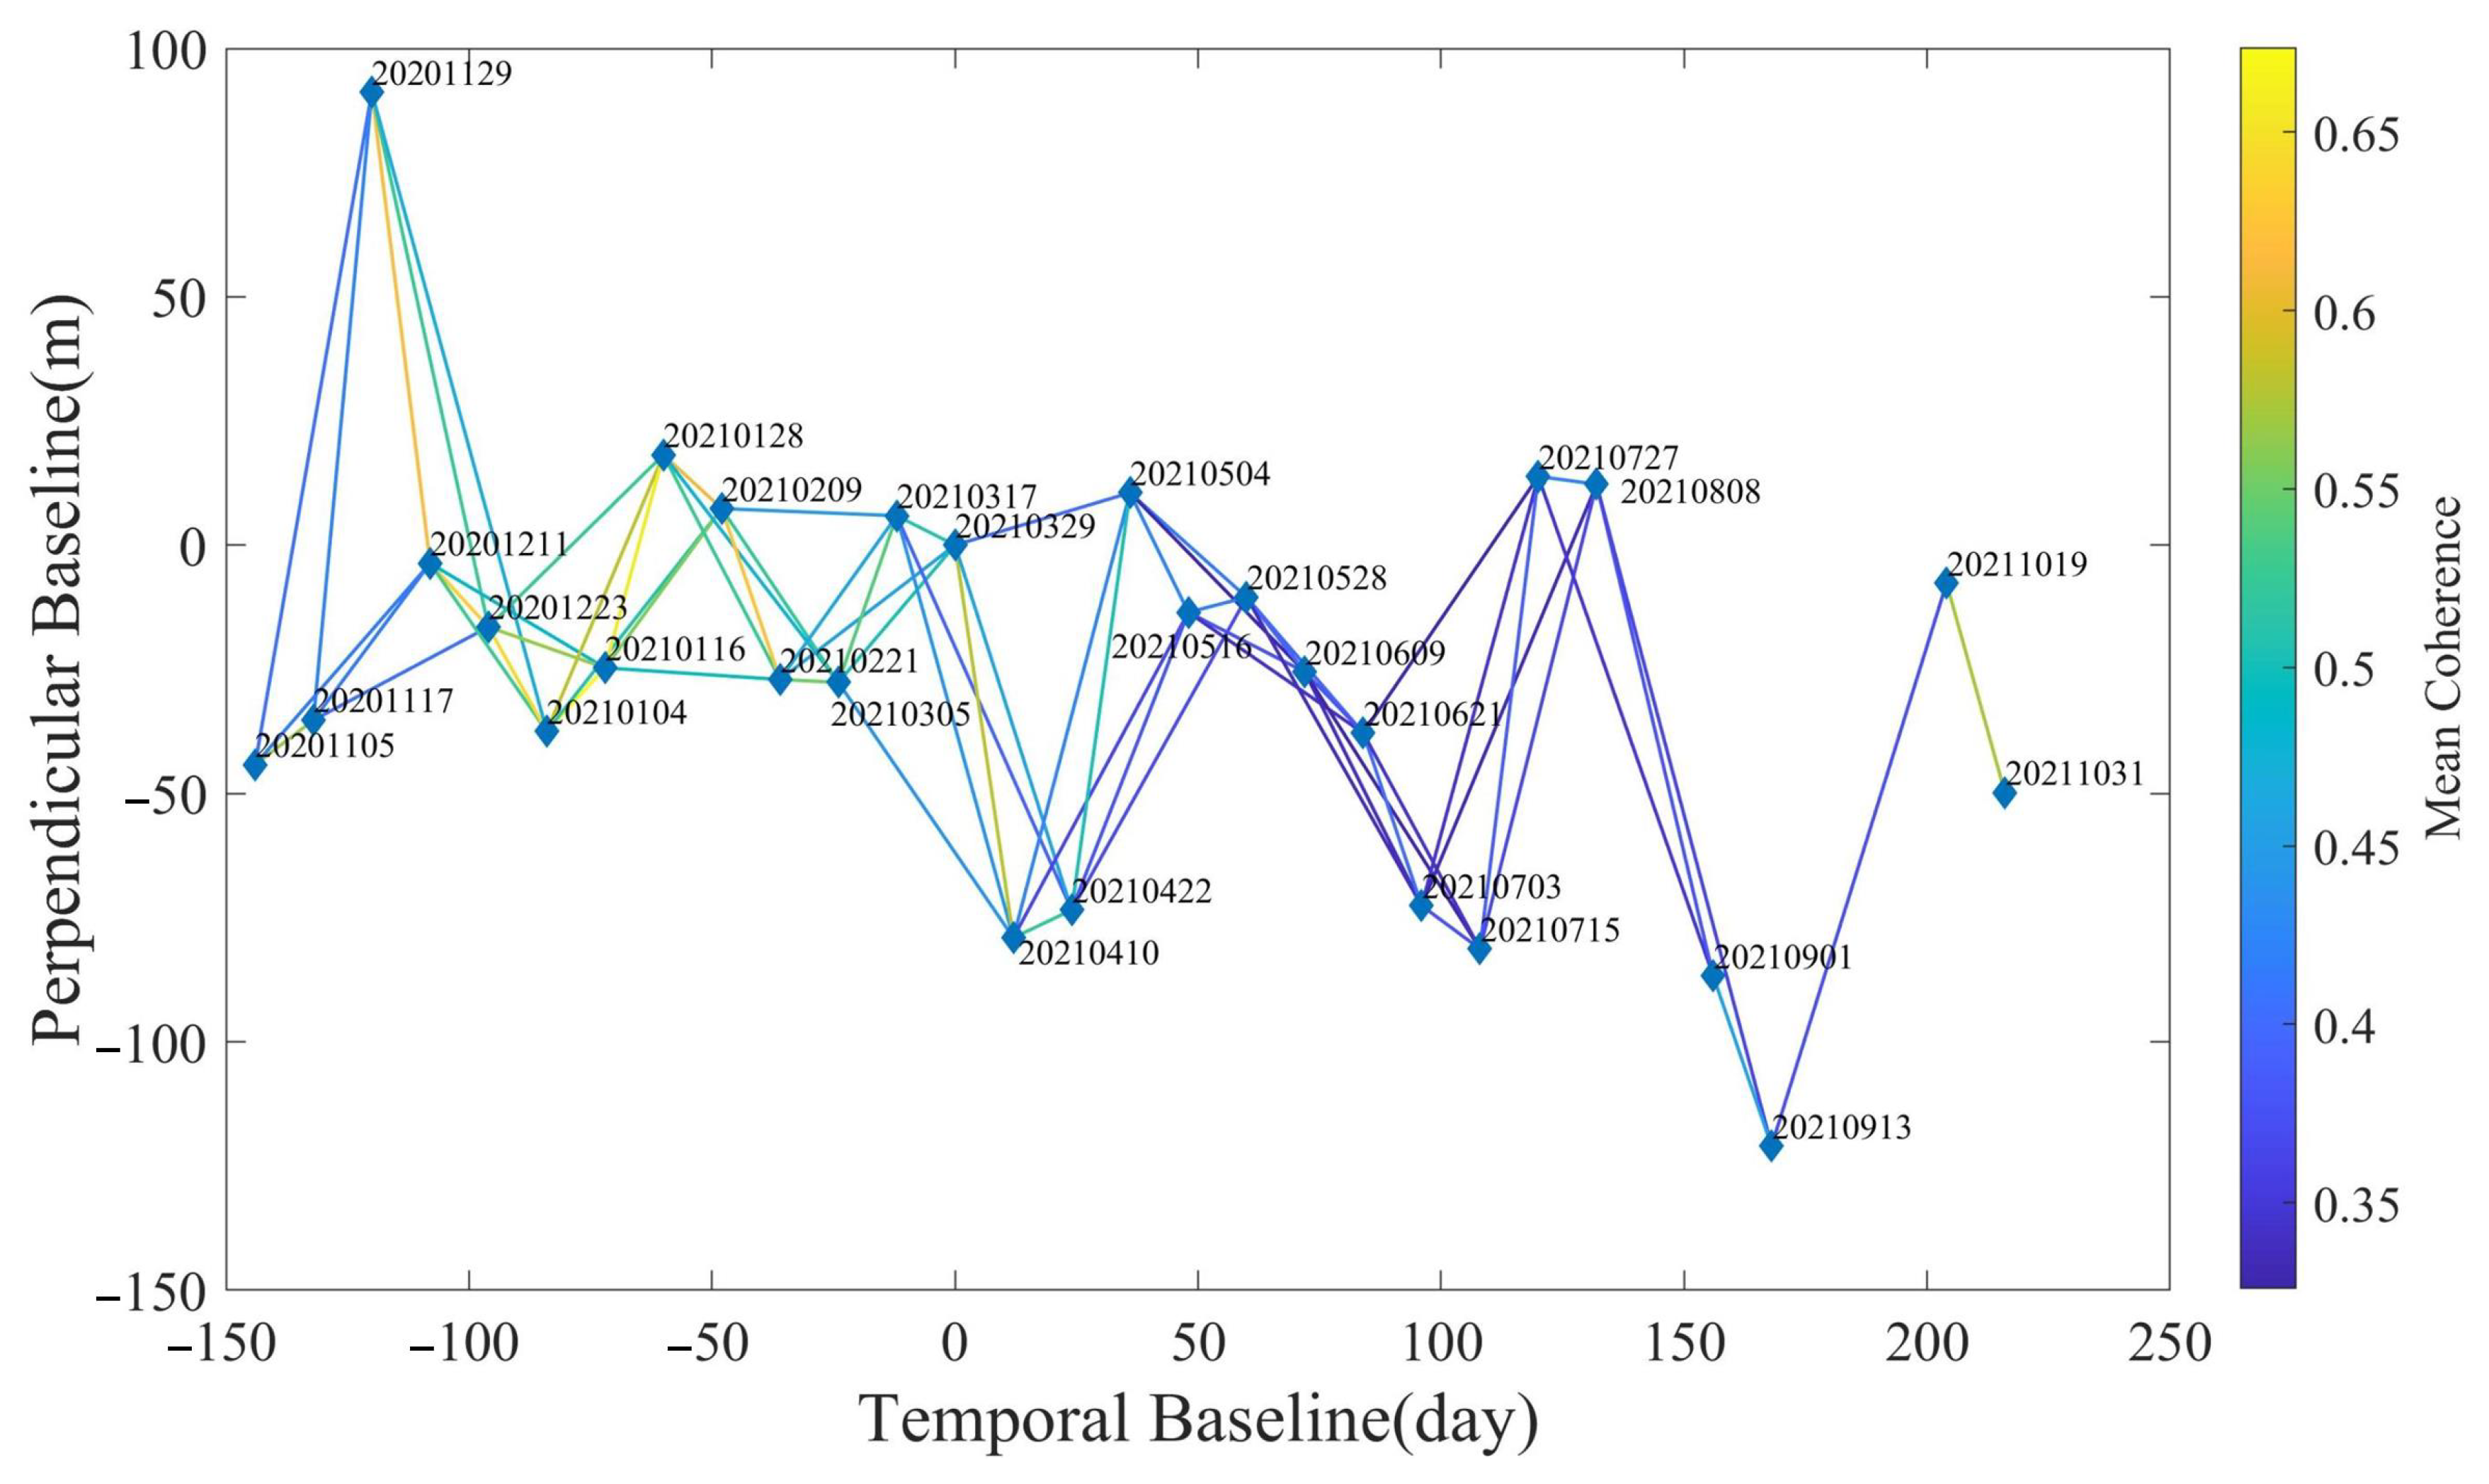
2.1. Satellite Data
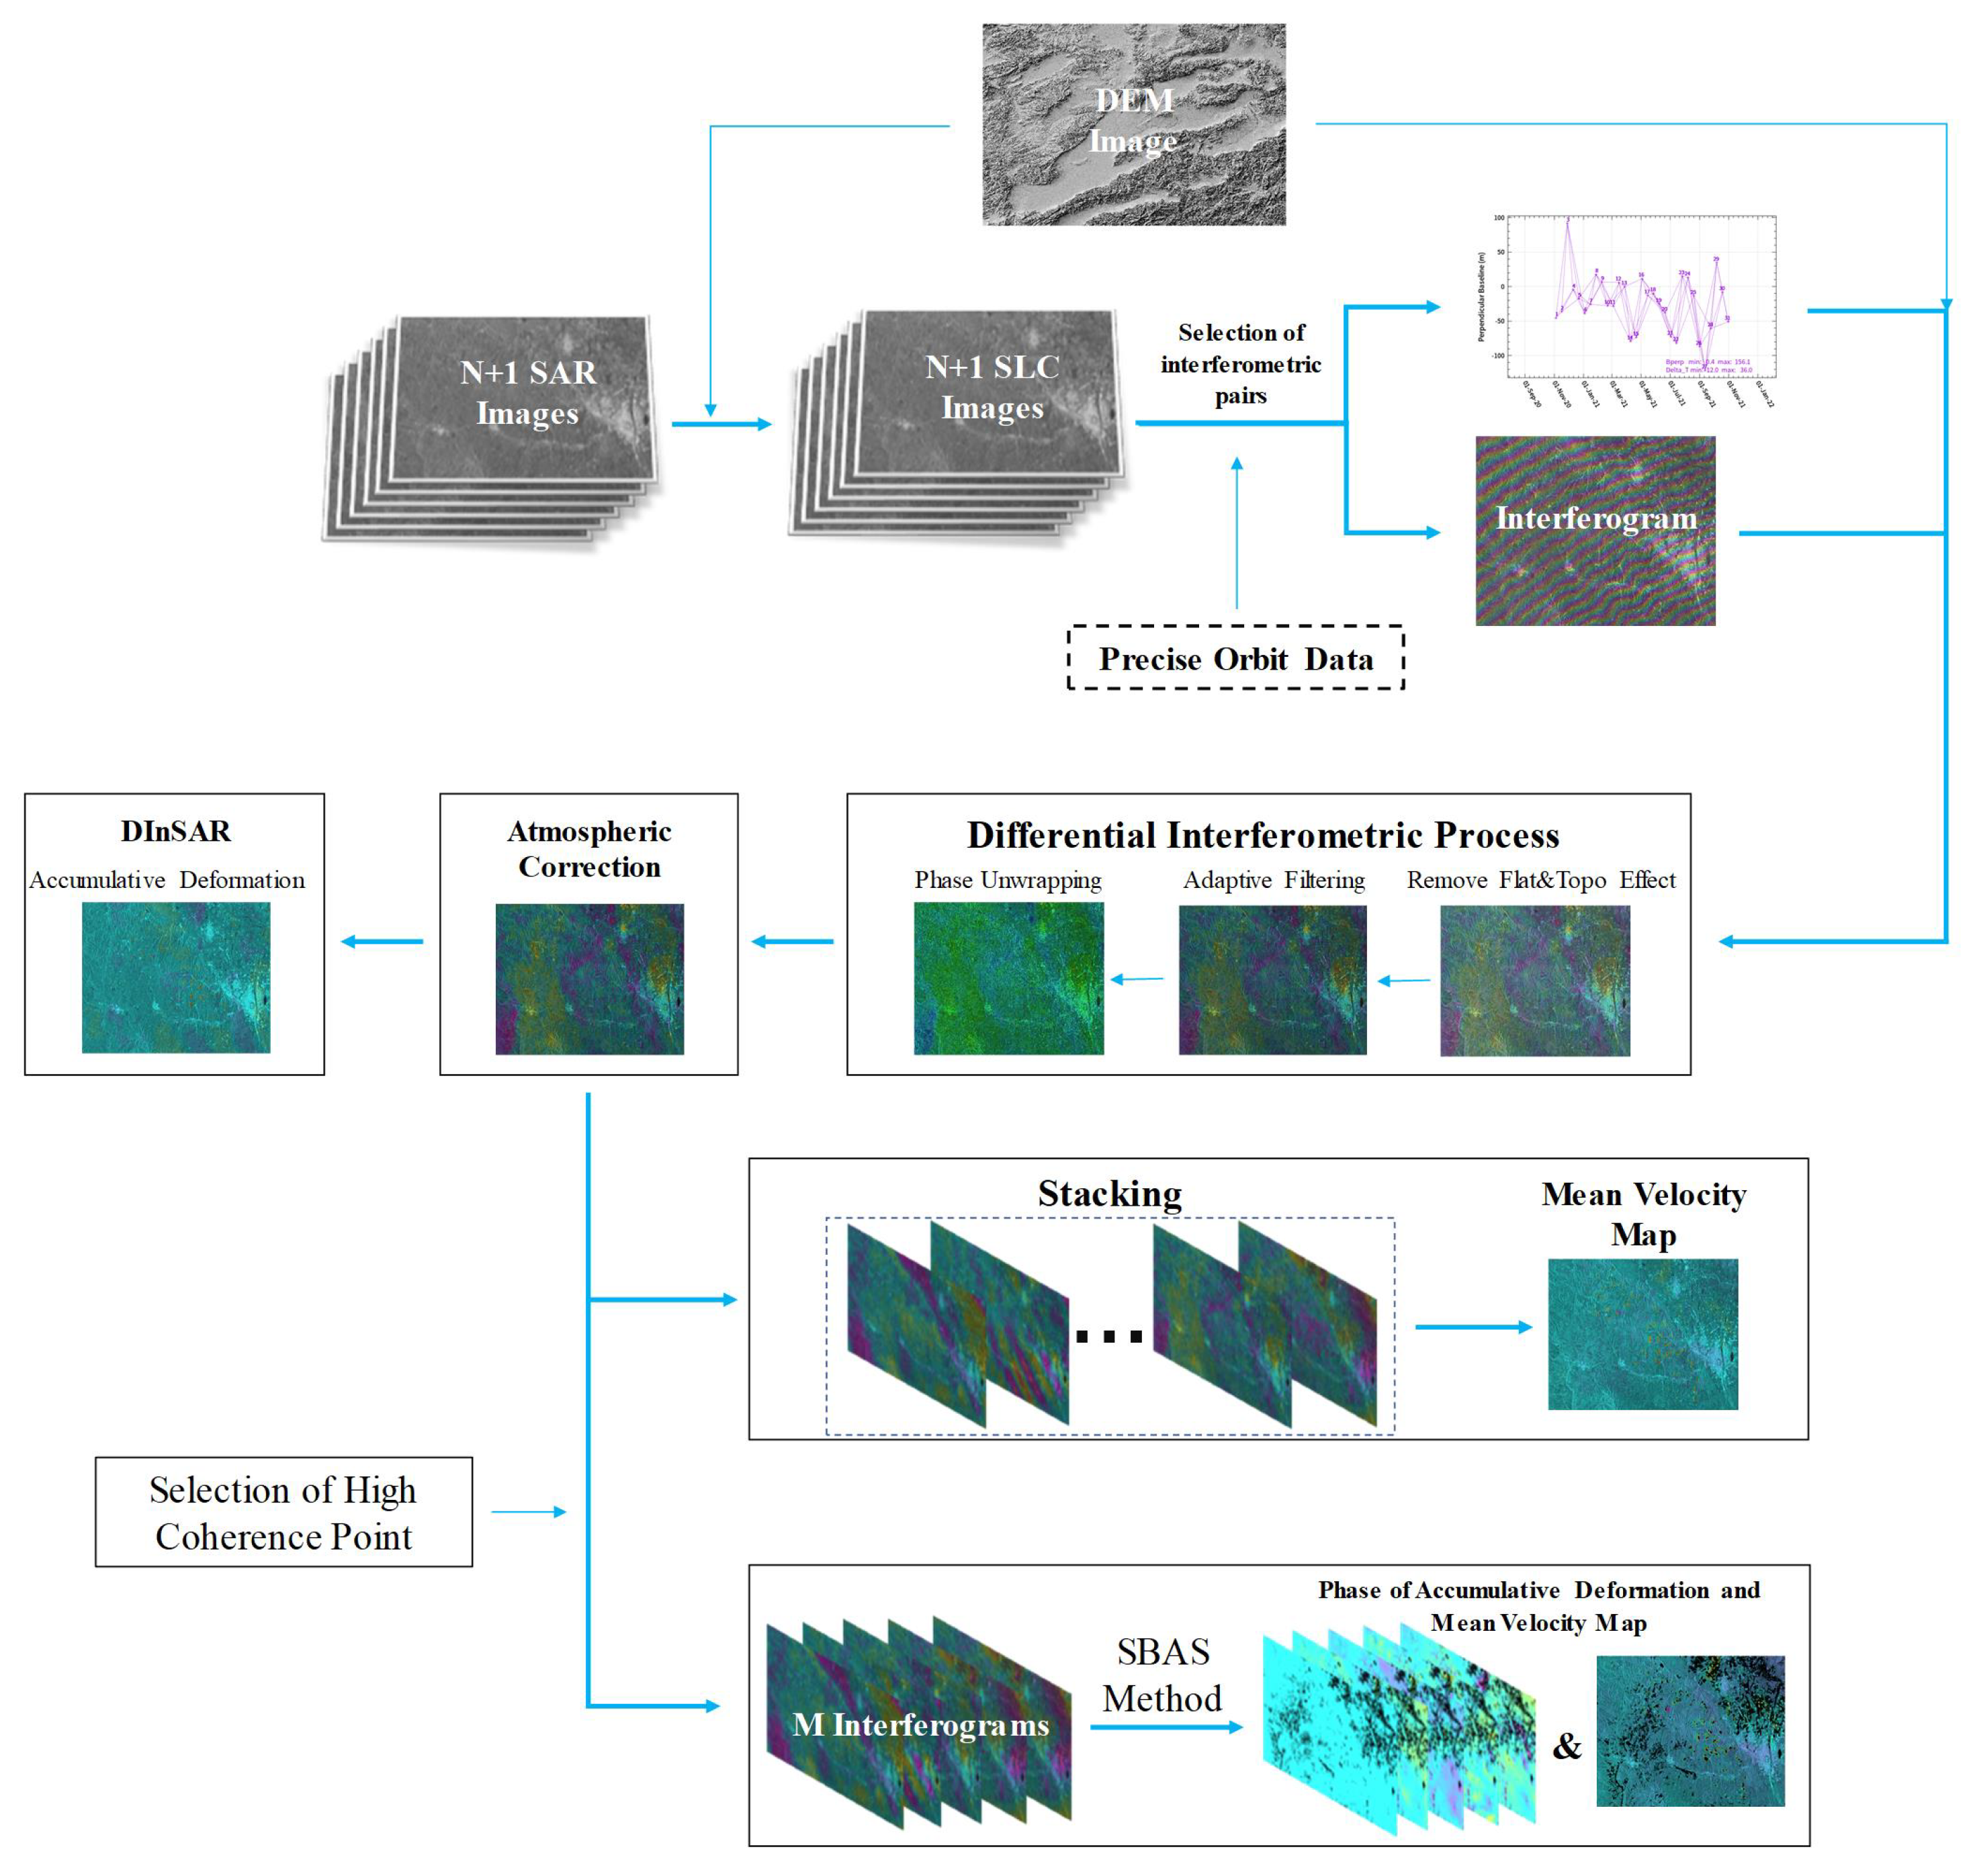
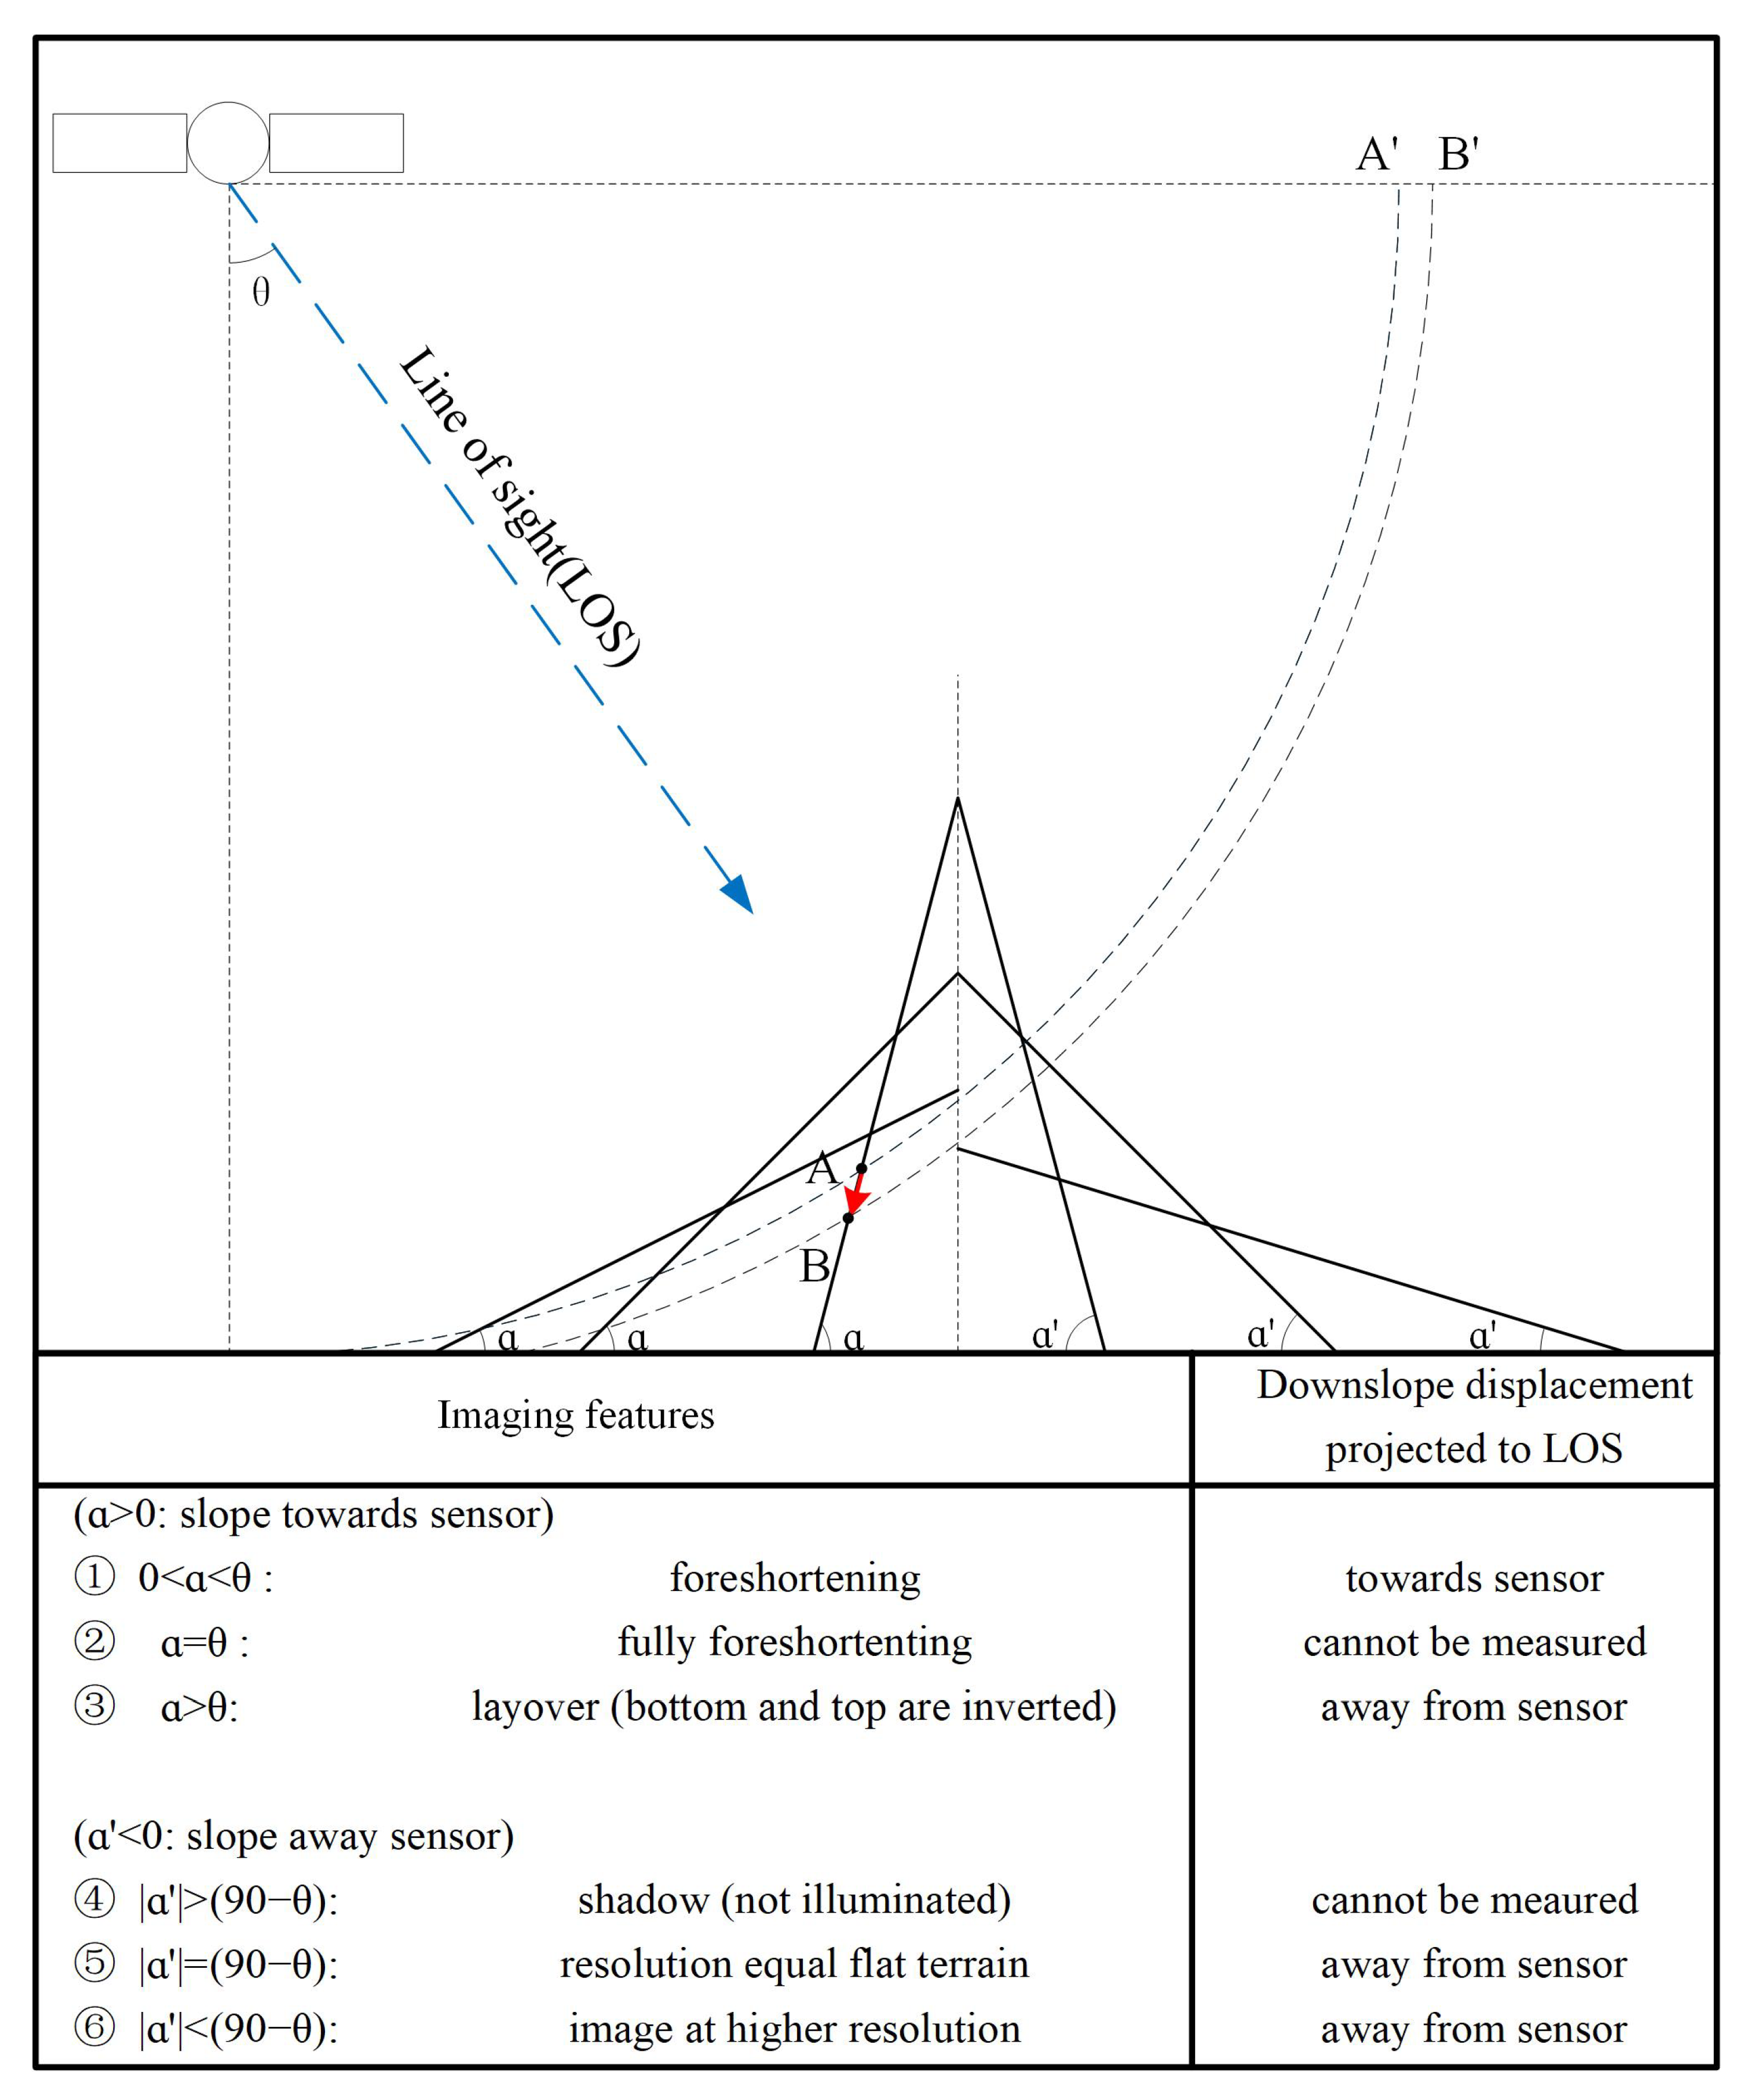
2.2. Methods
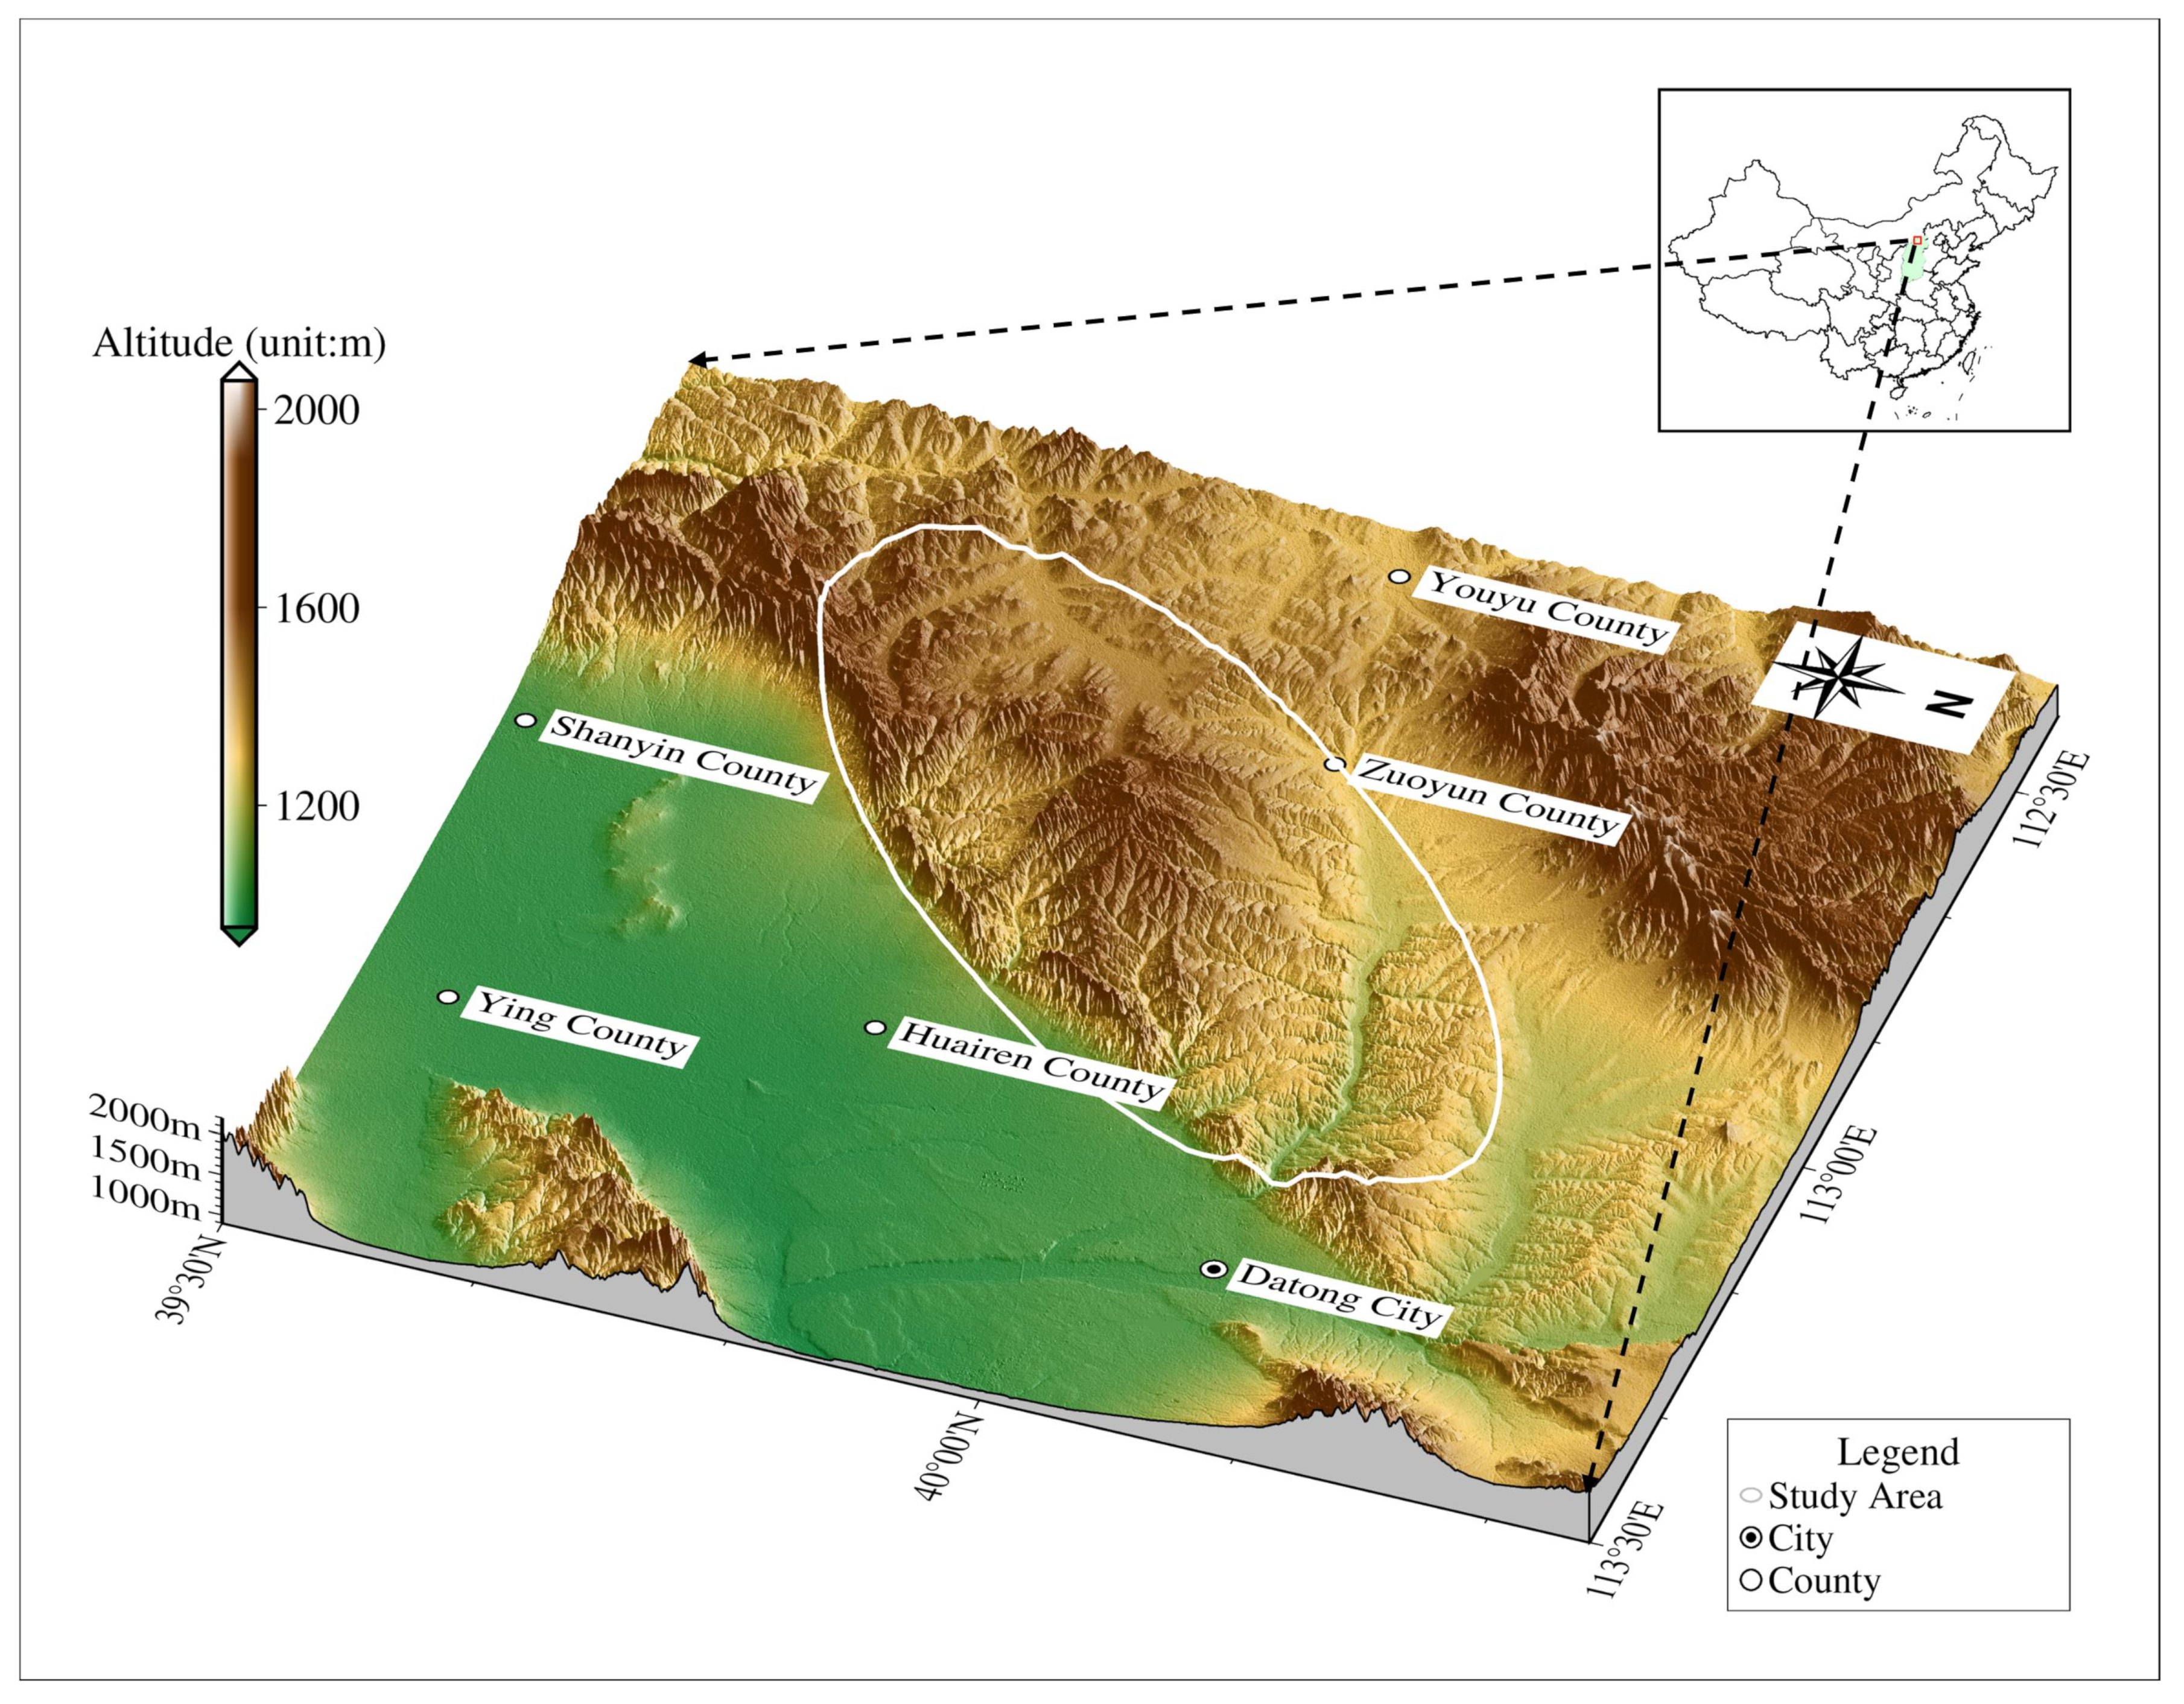
3. Study Area
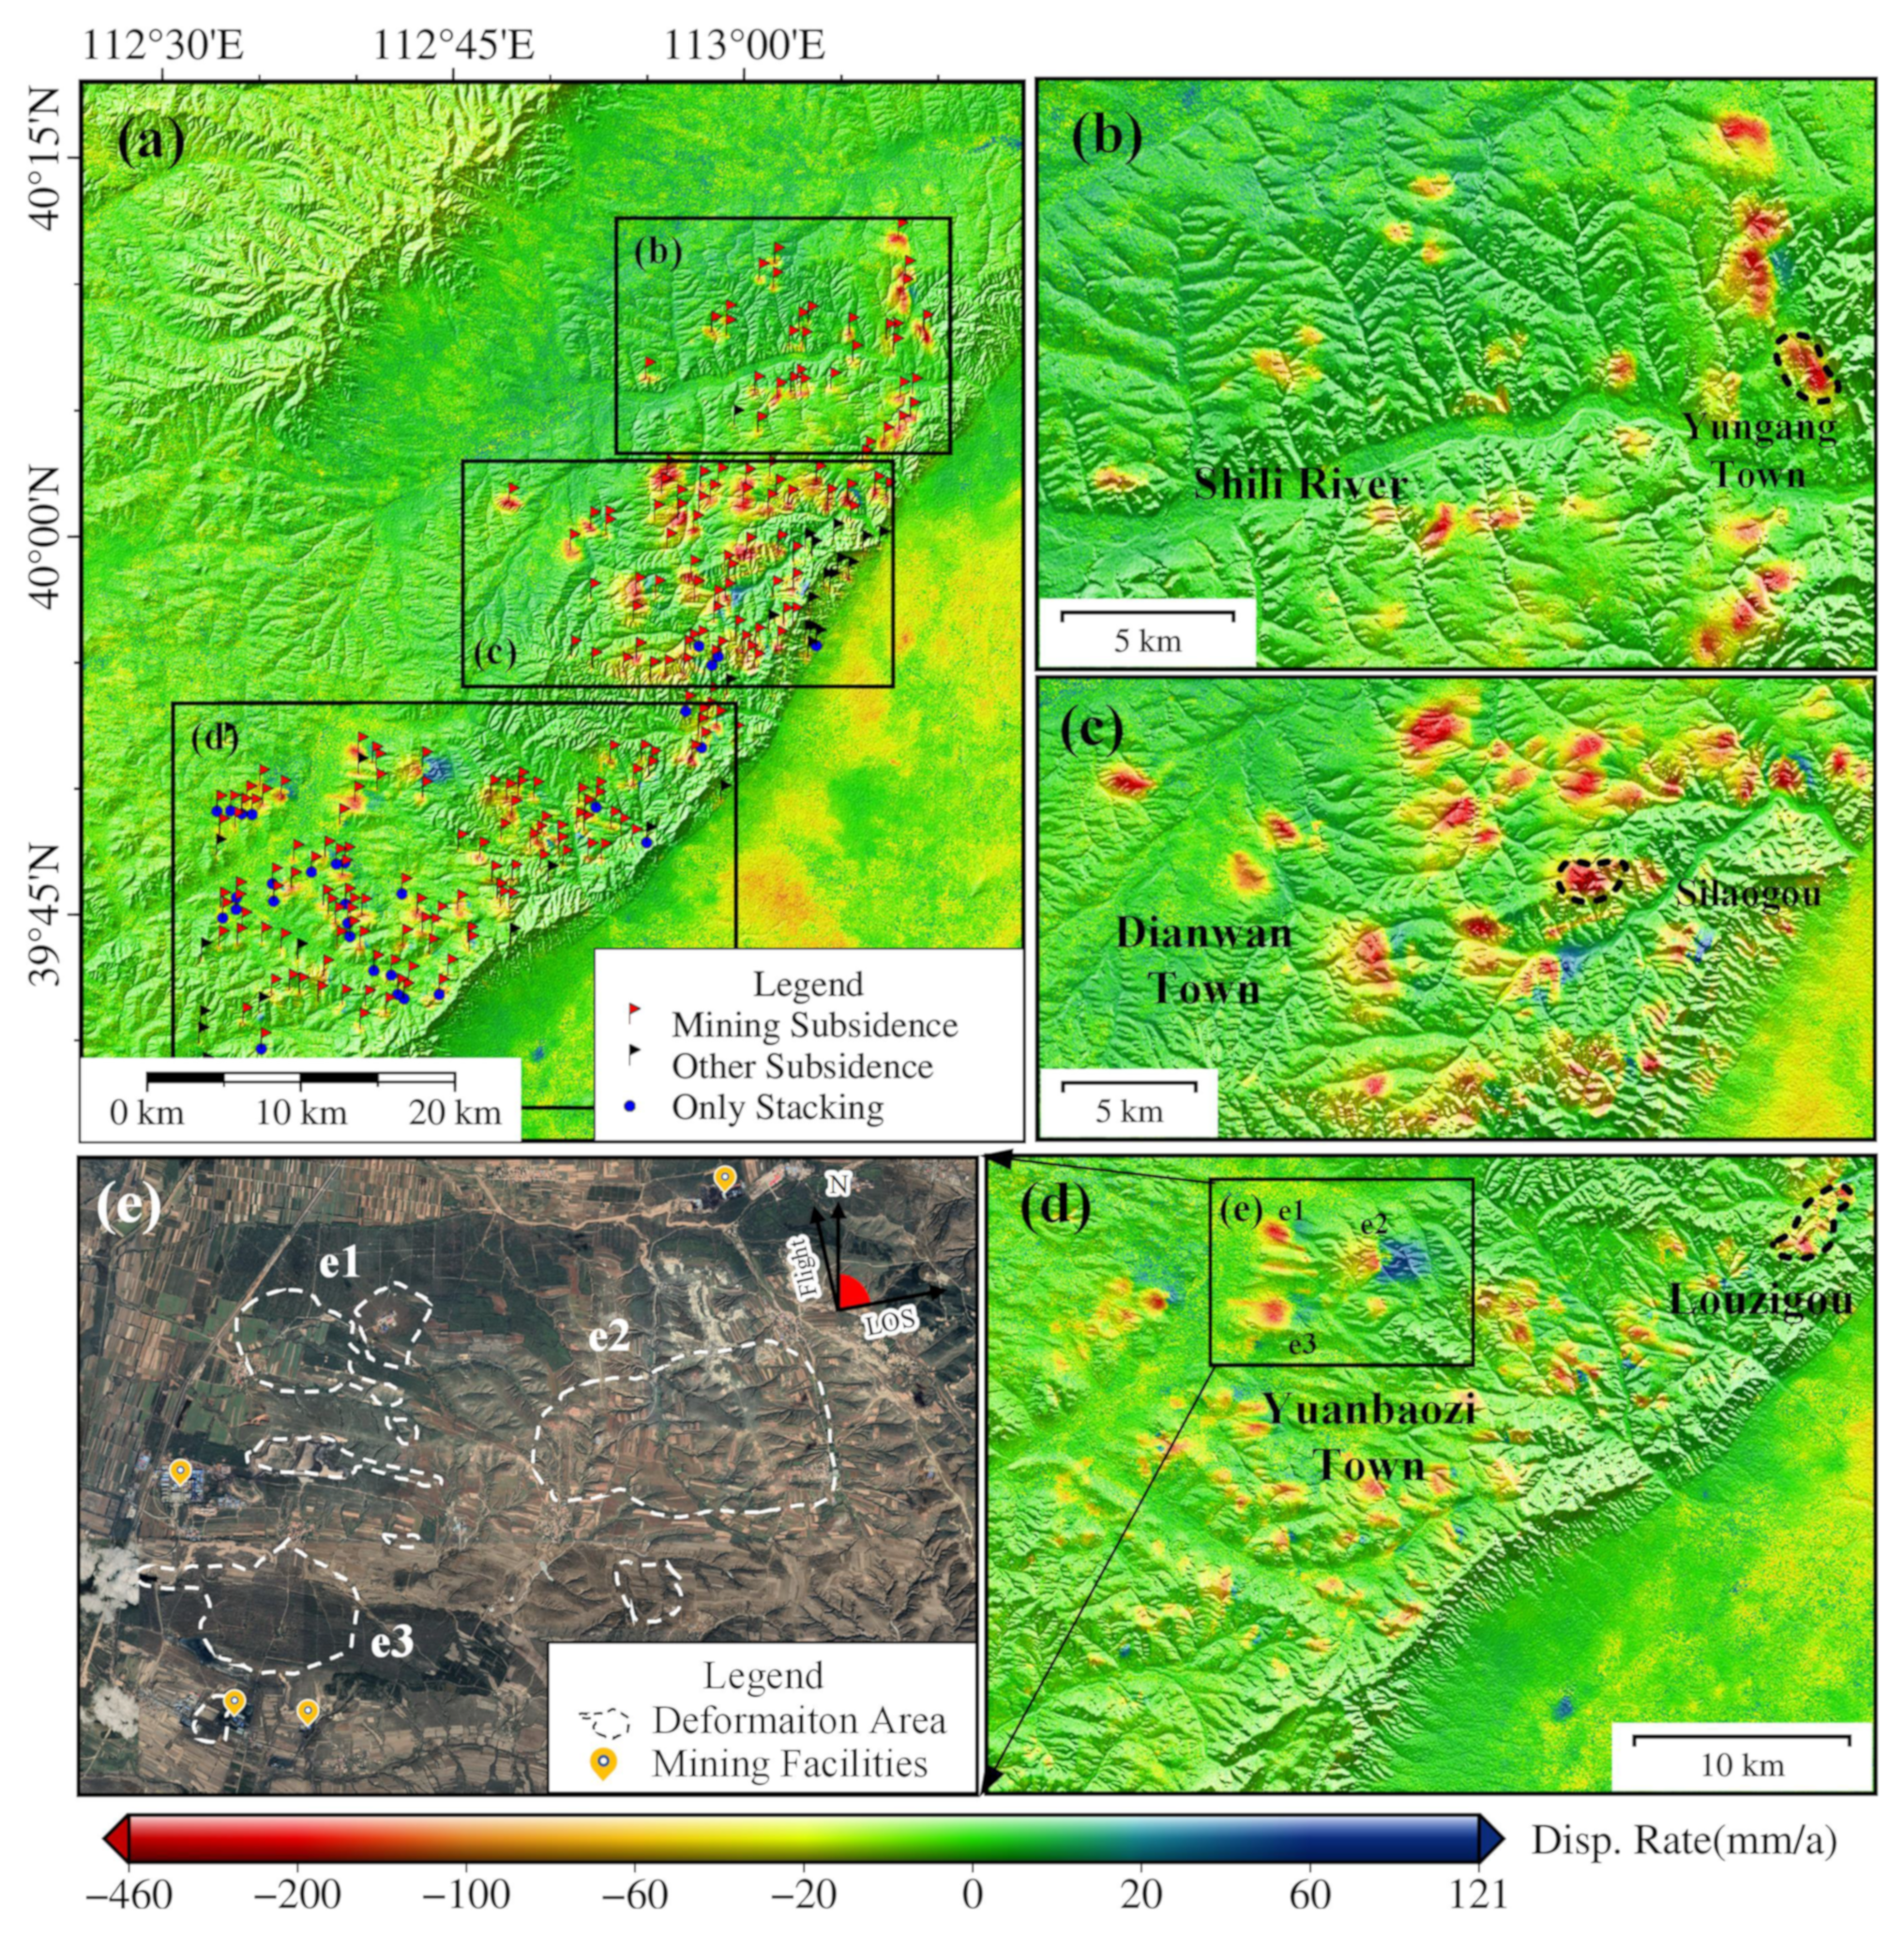
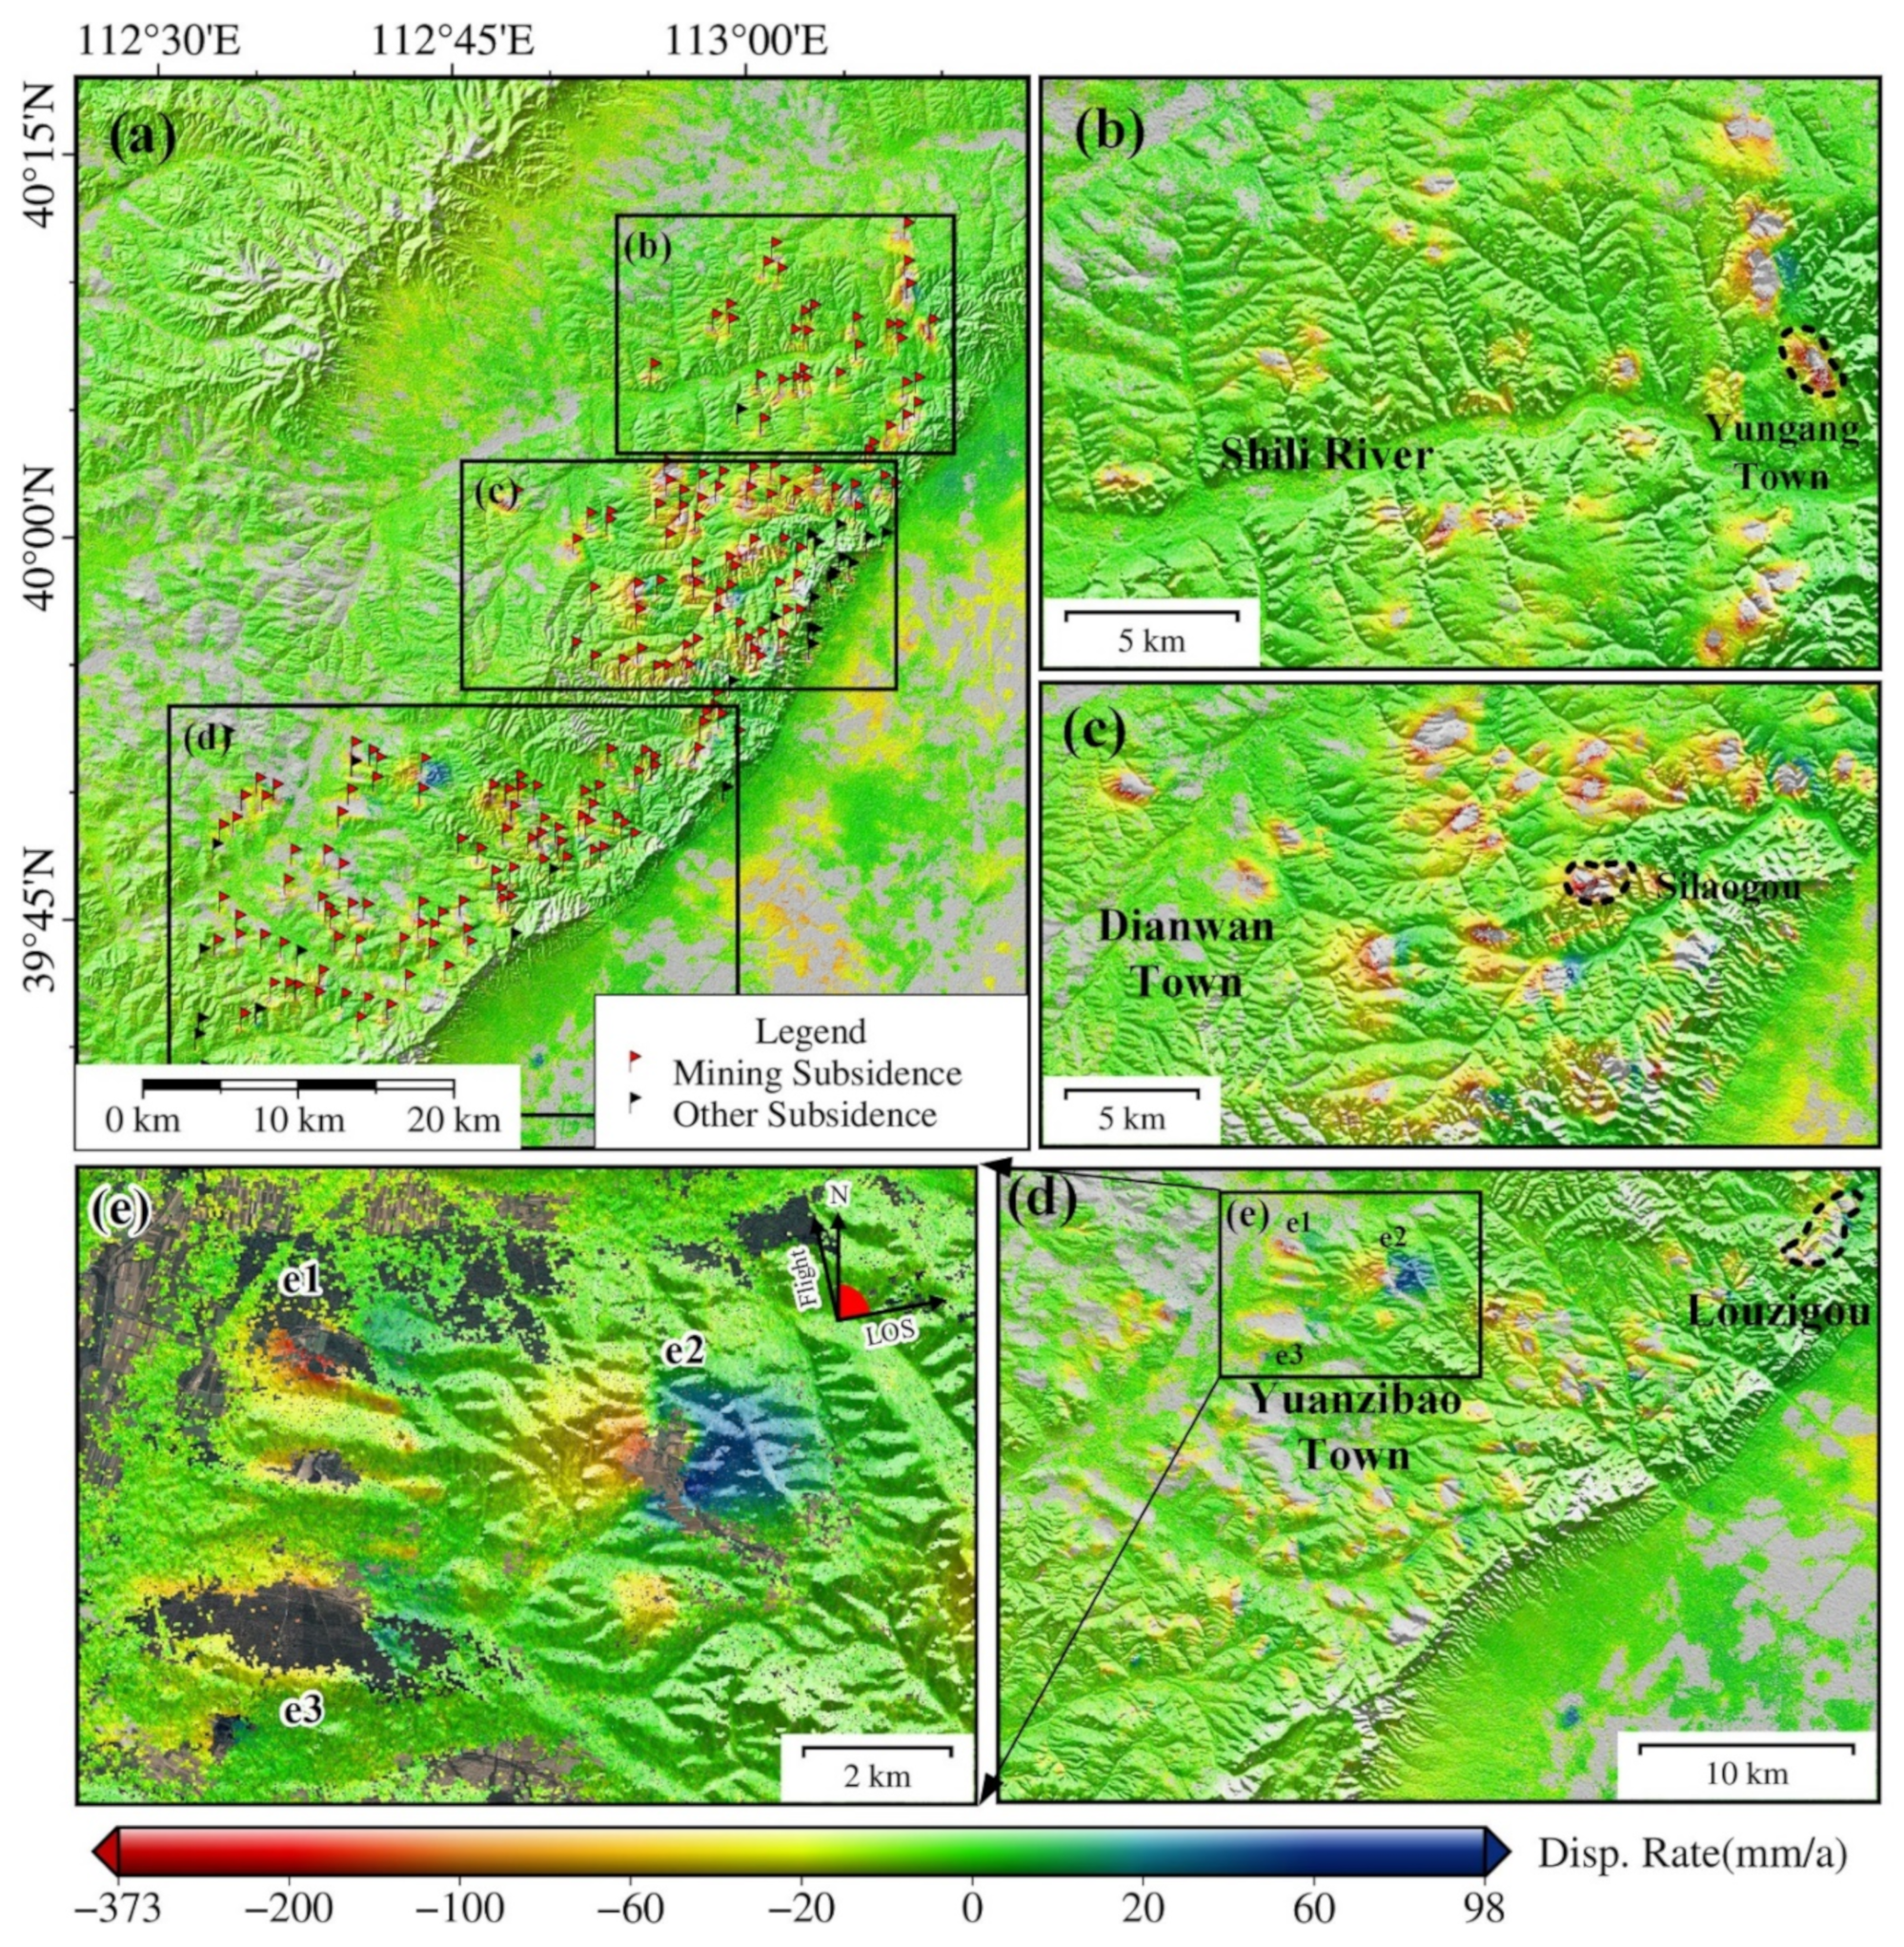
4. Results and Analysis
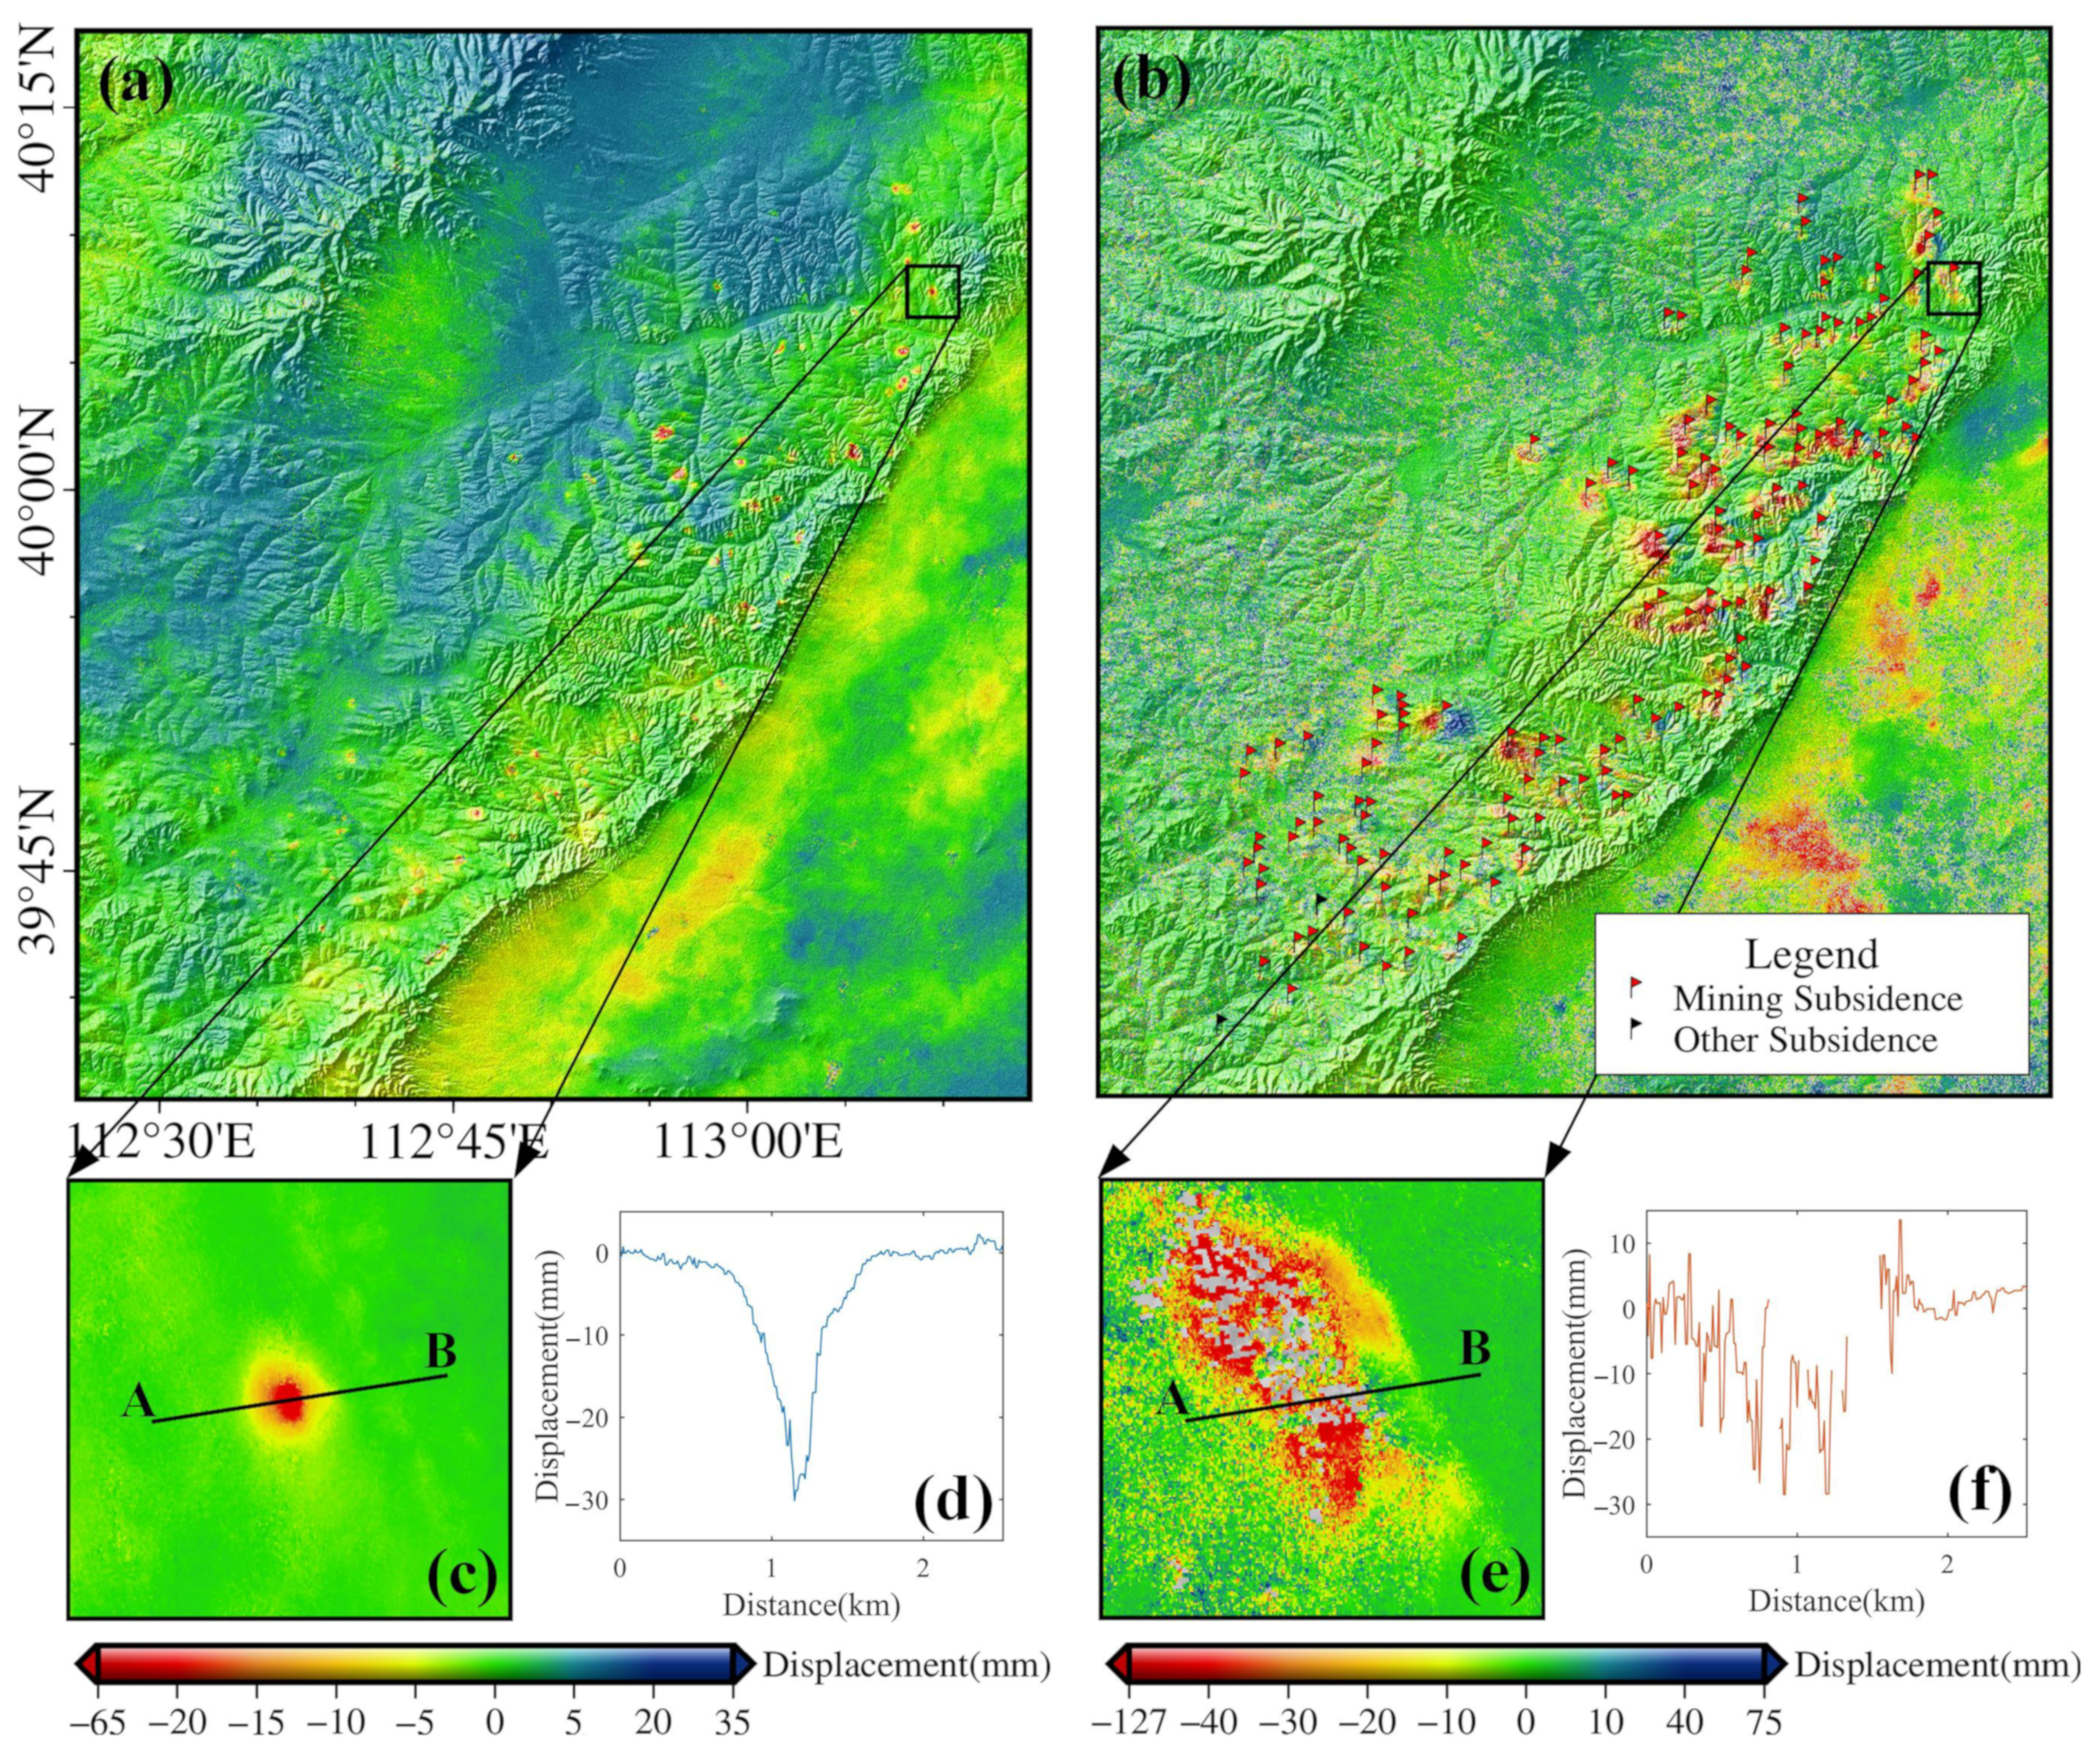
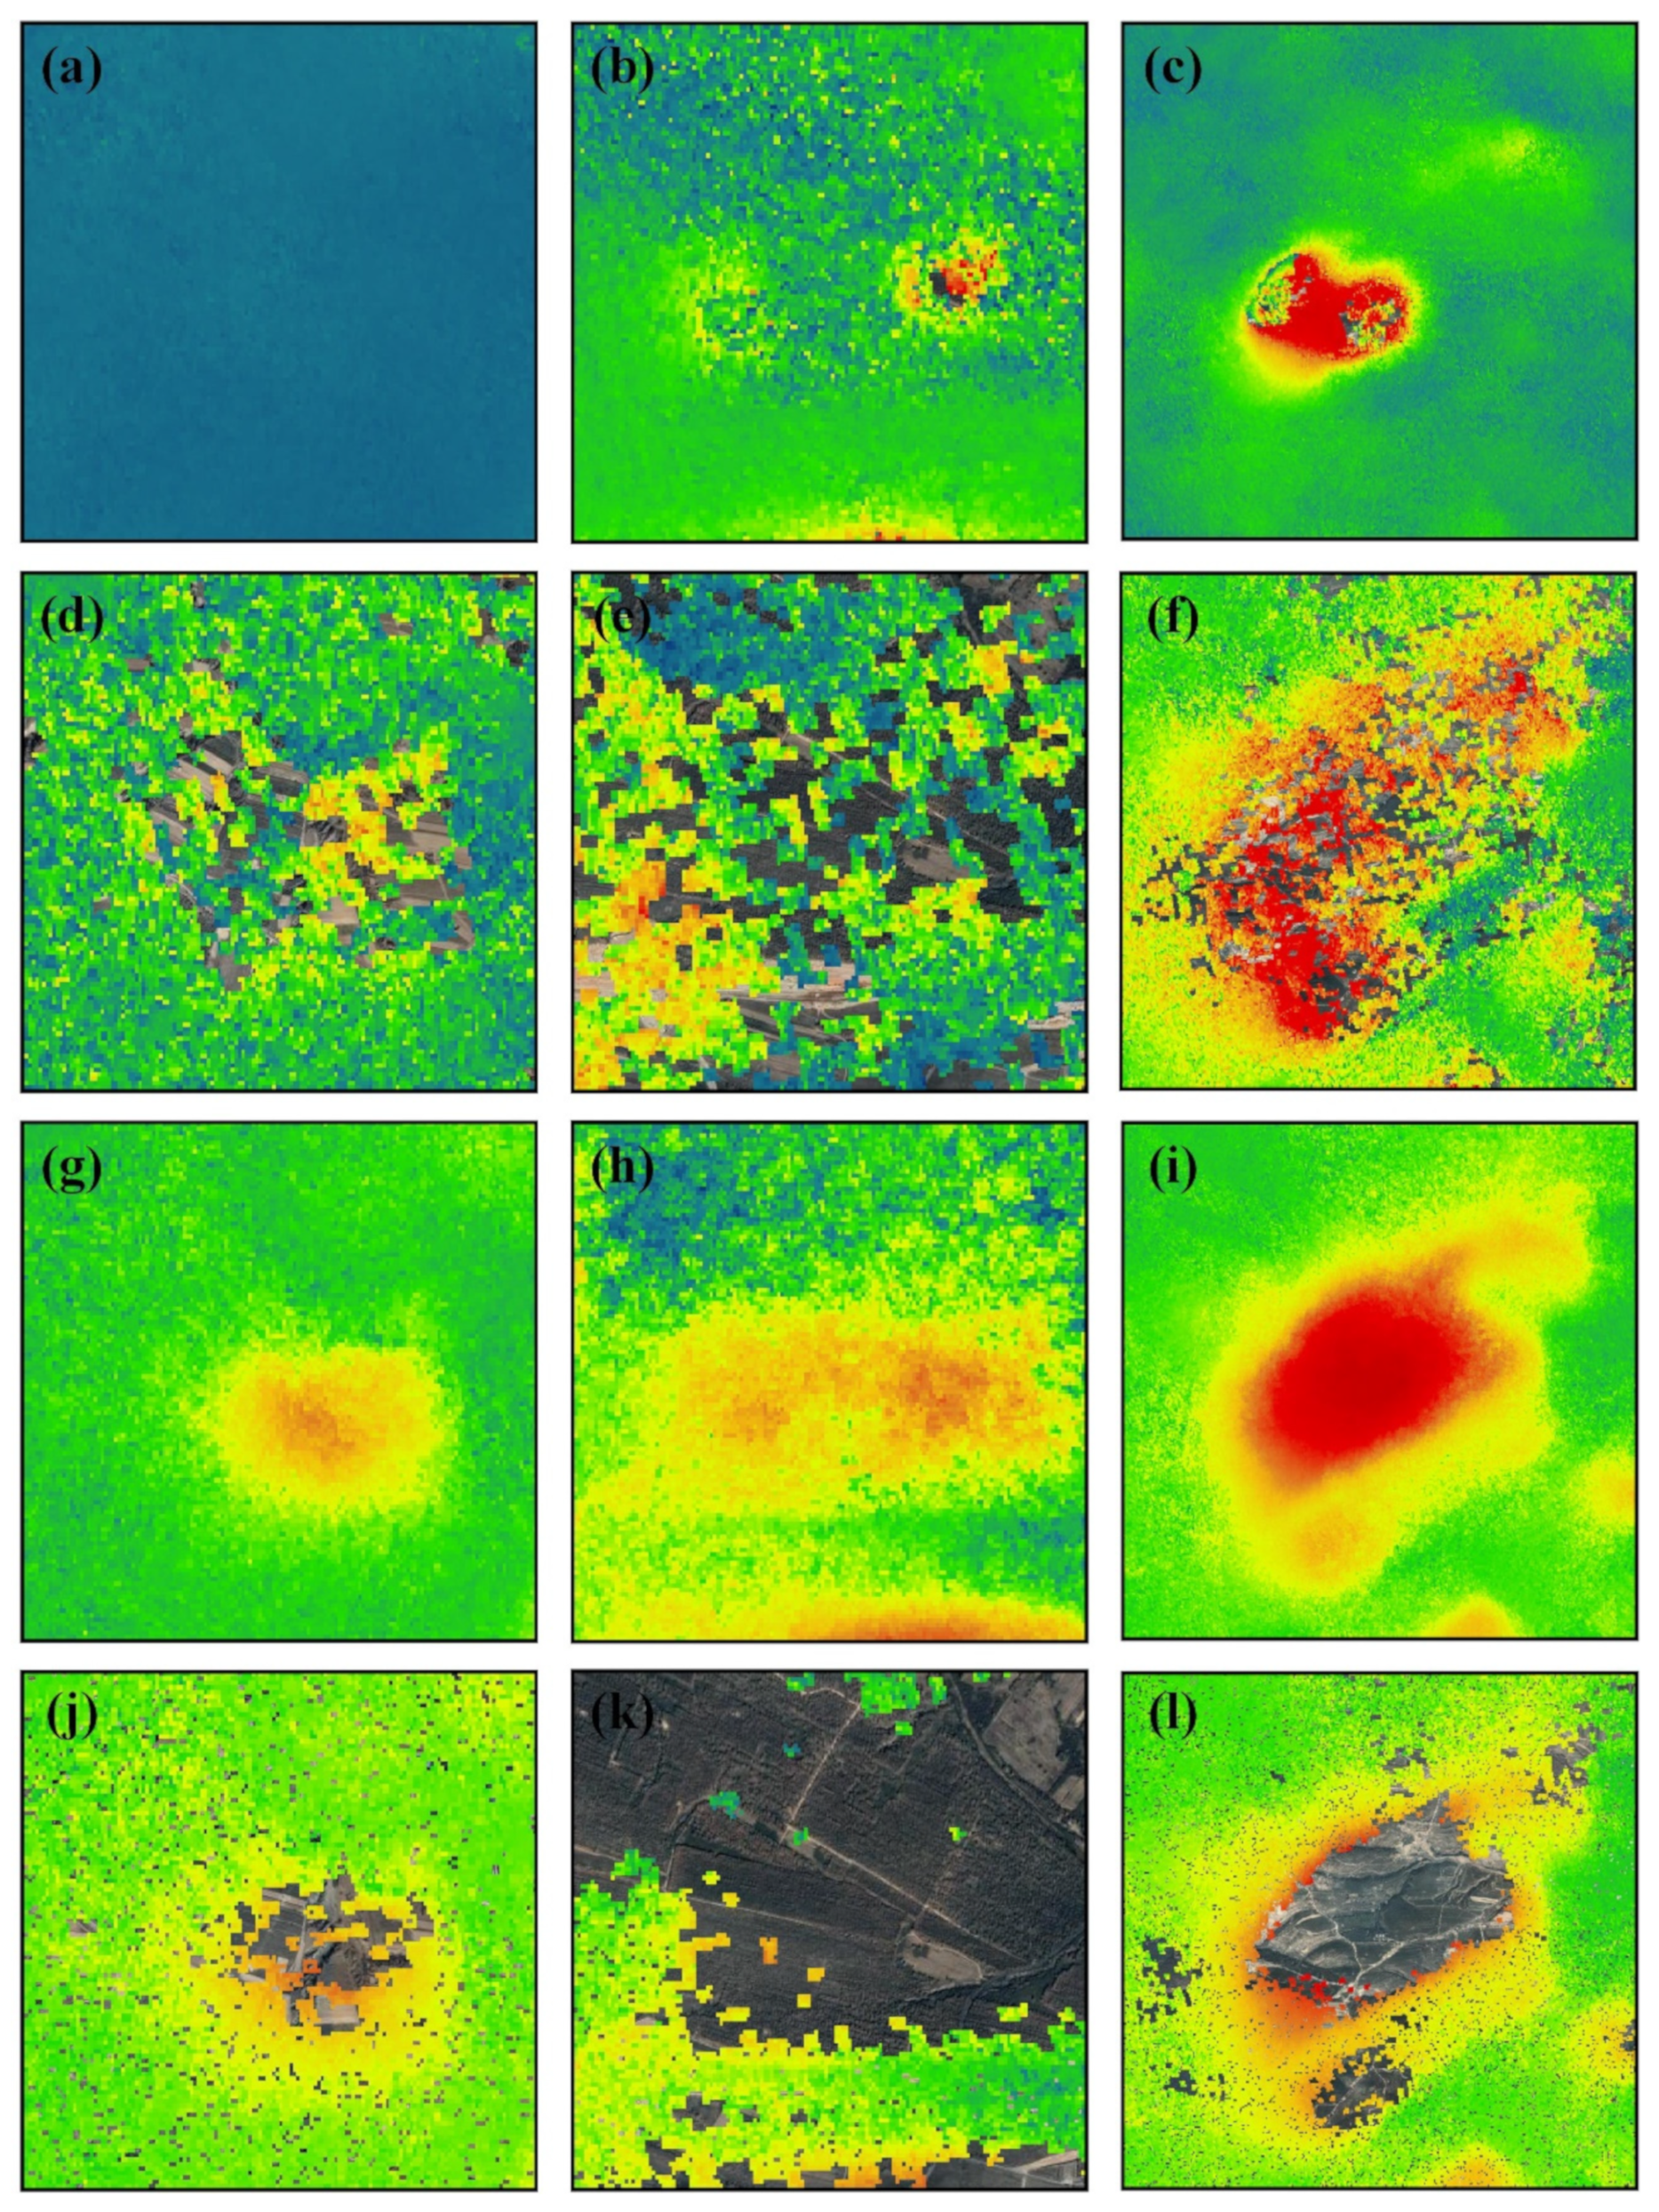
4.1. Analysis of DInSAR Results
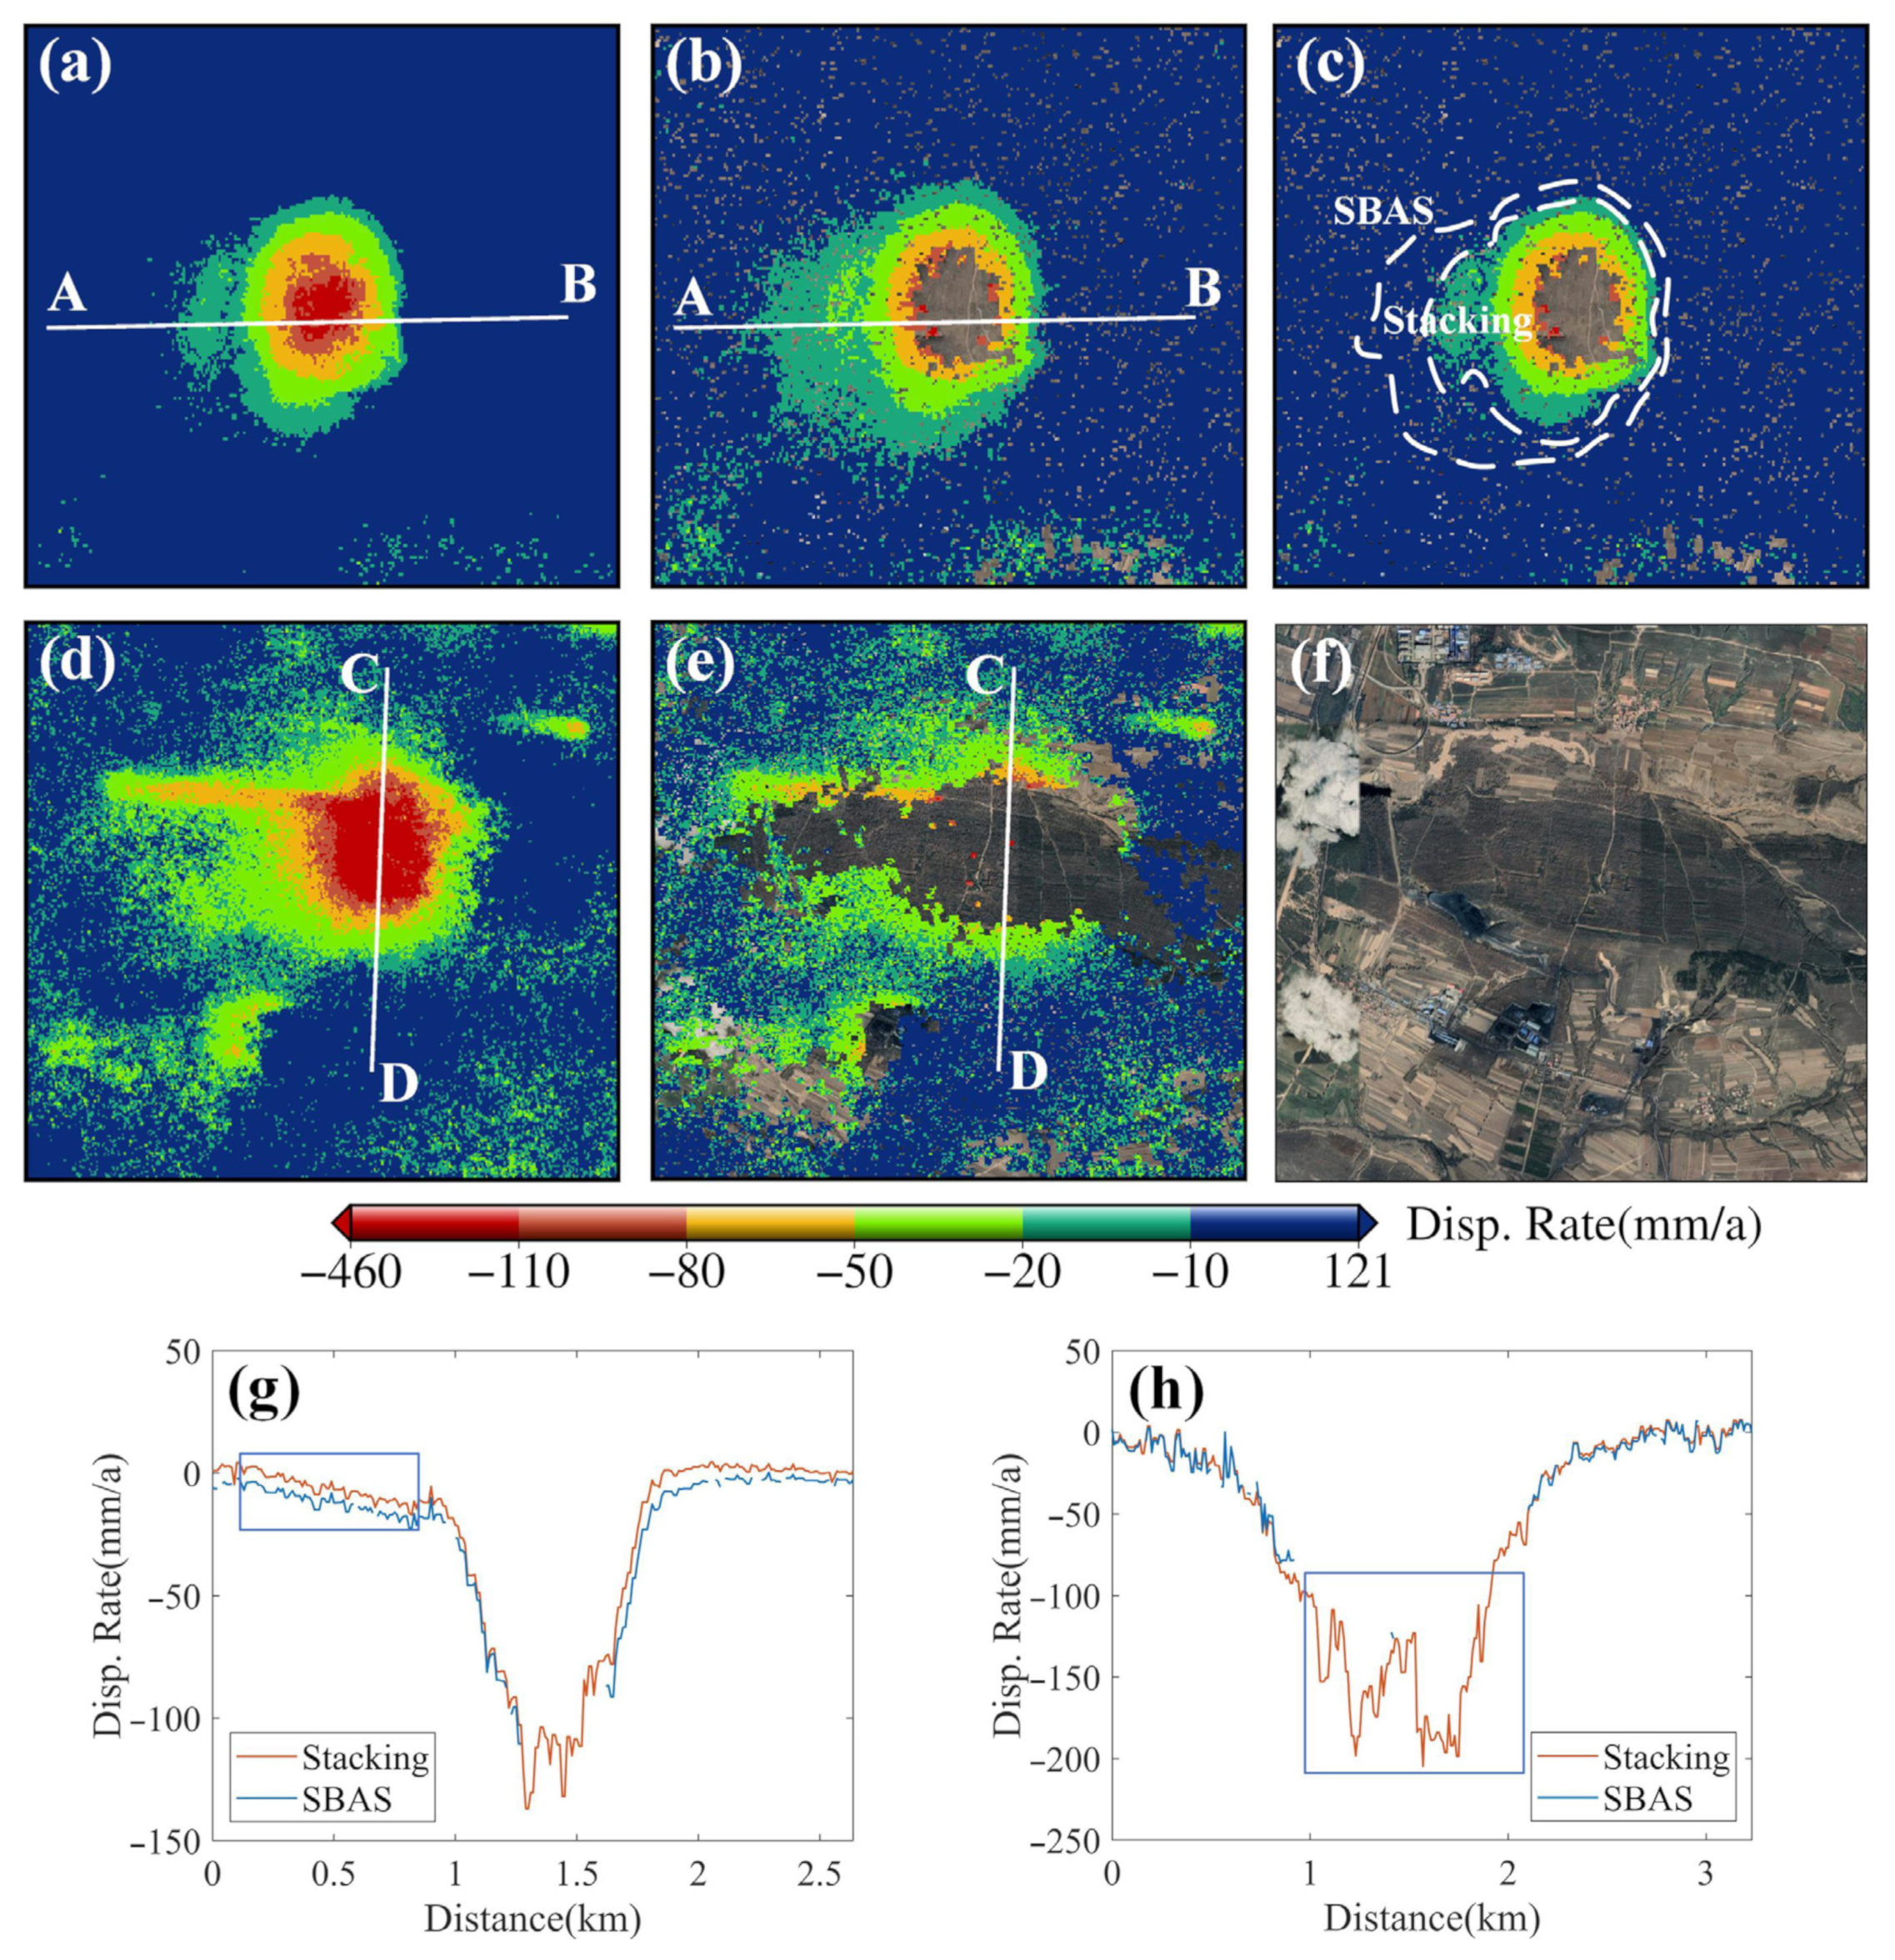
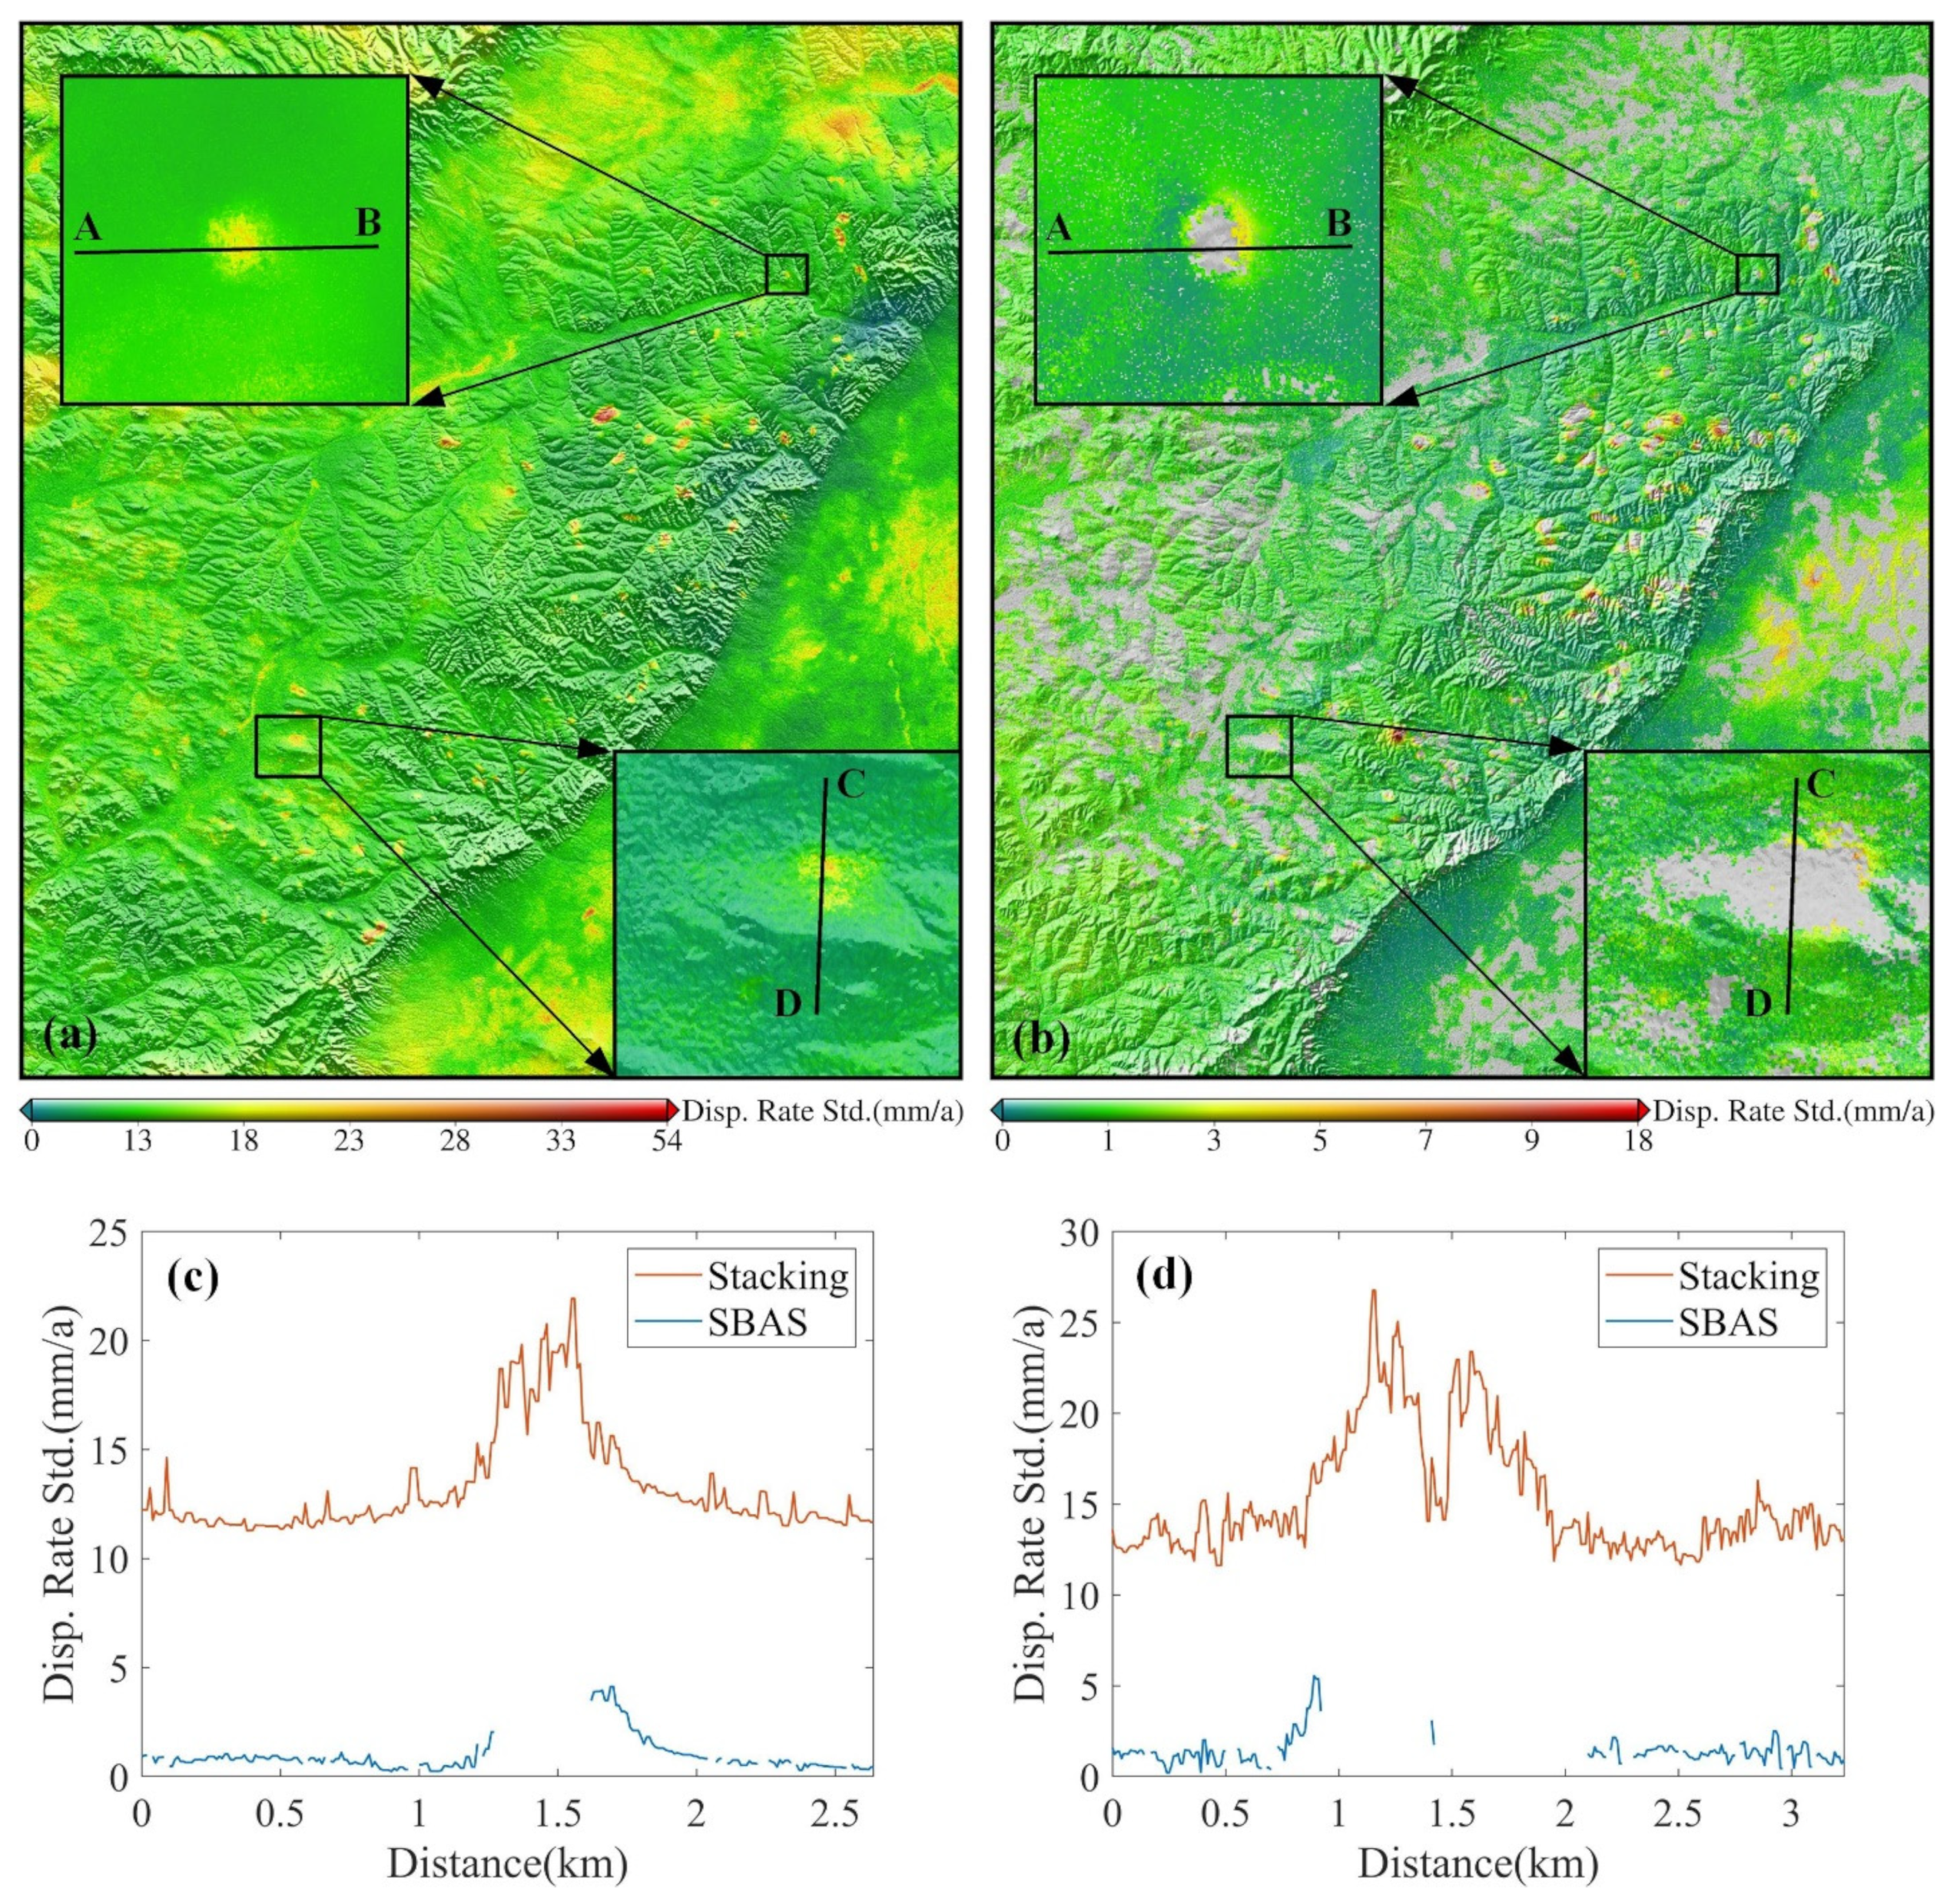
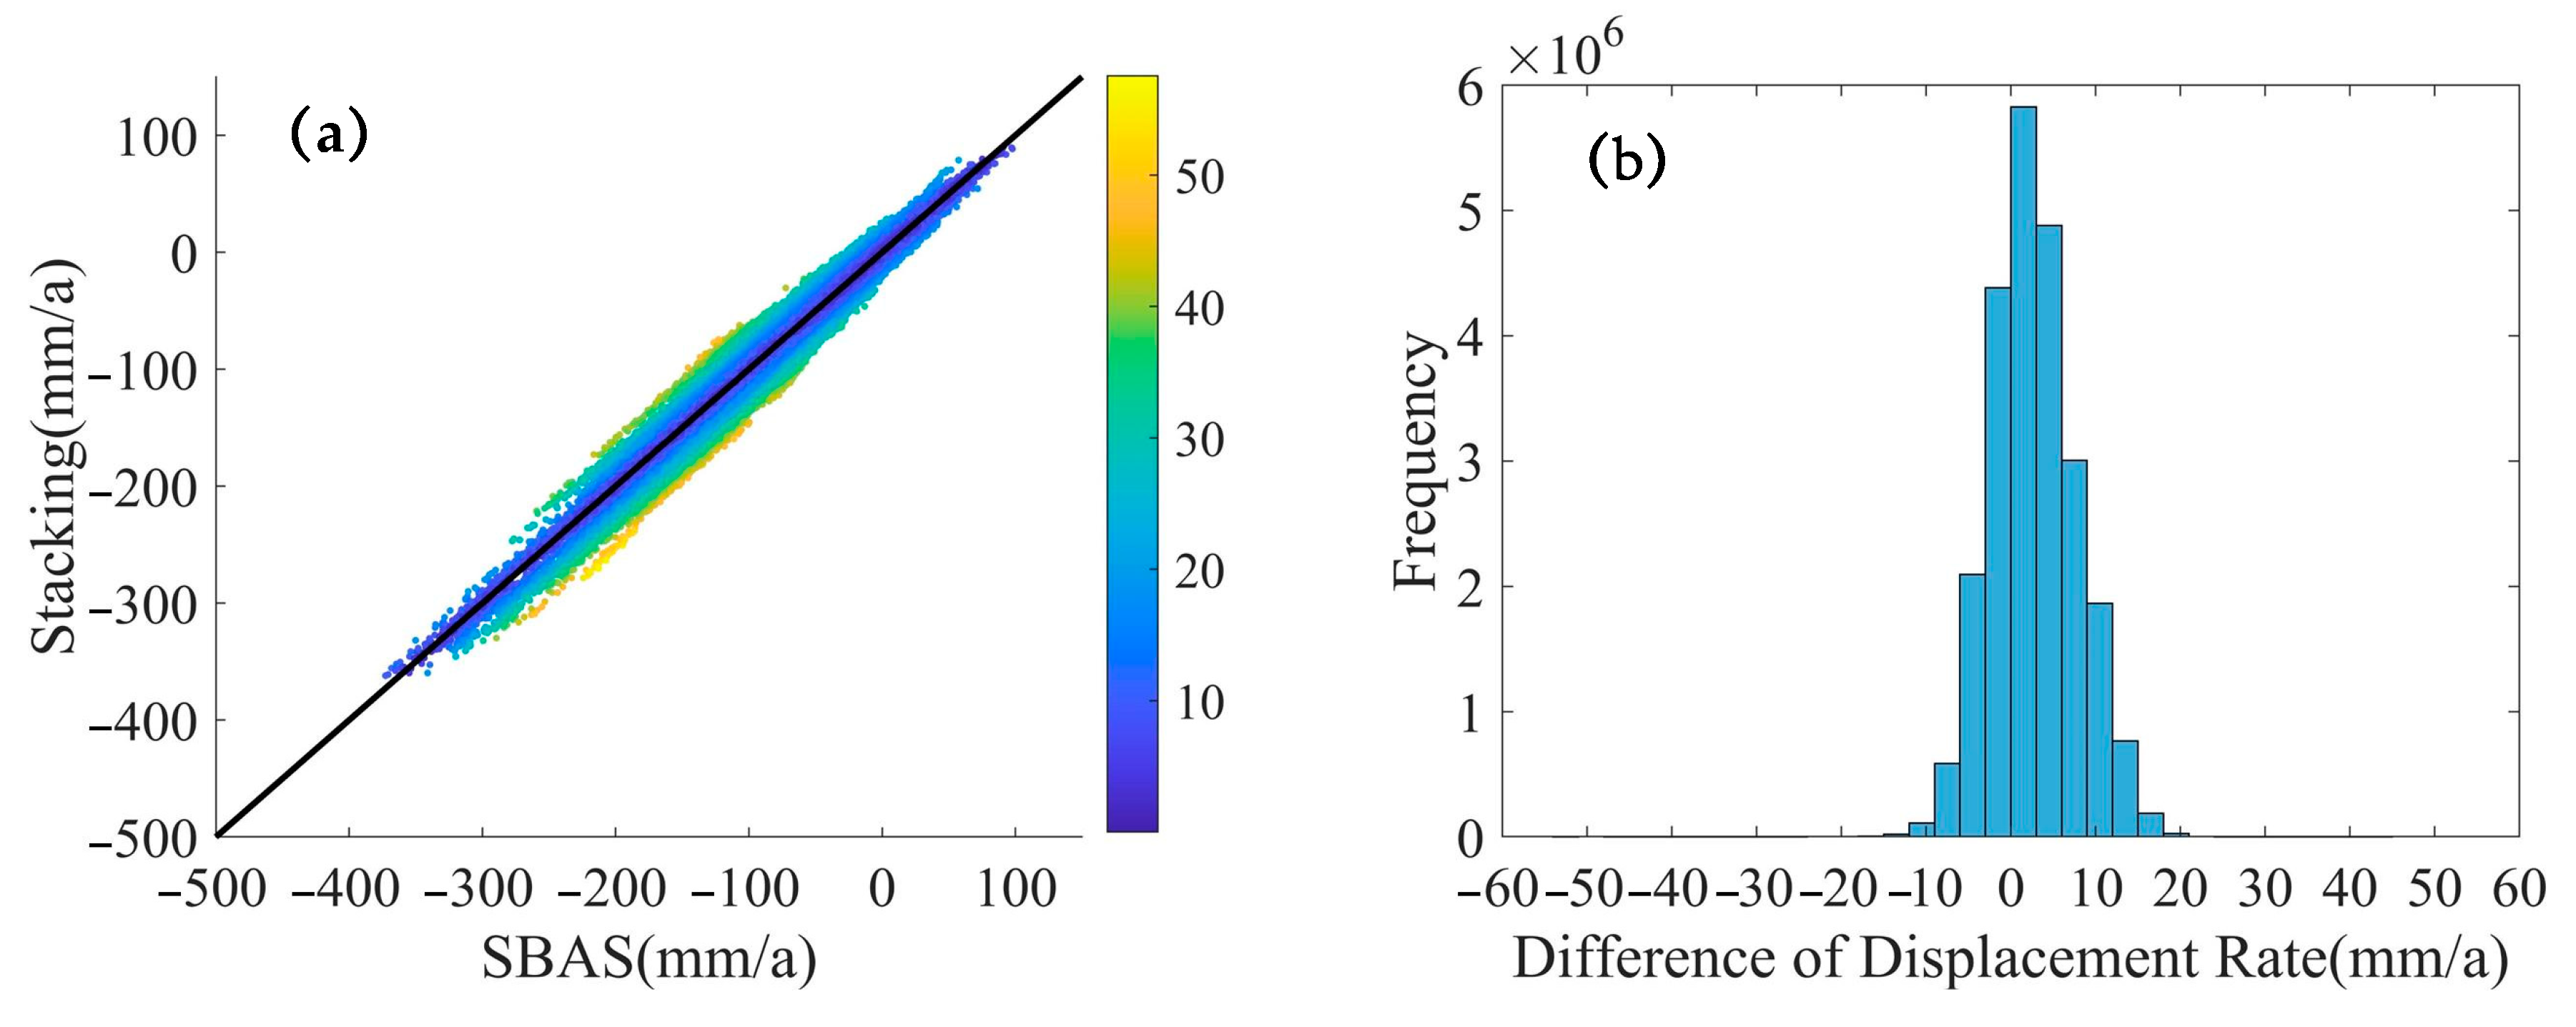
4.2. Analysis of the Stacking-InSAR Results
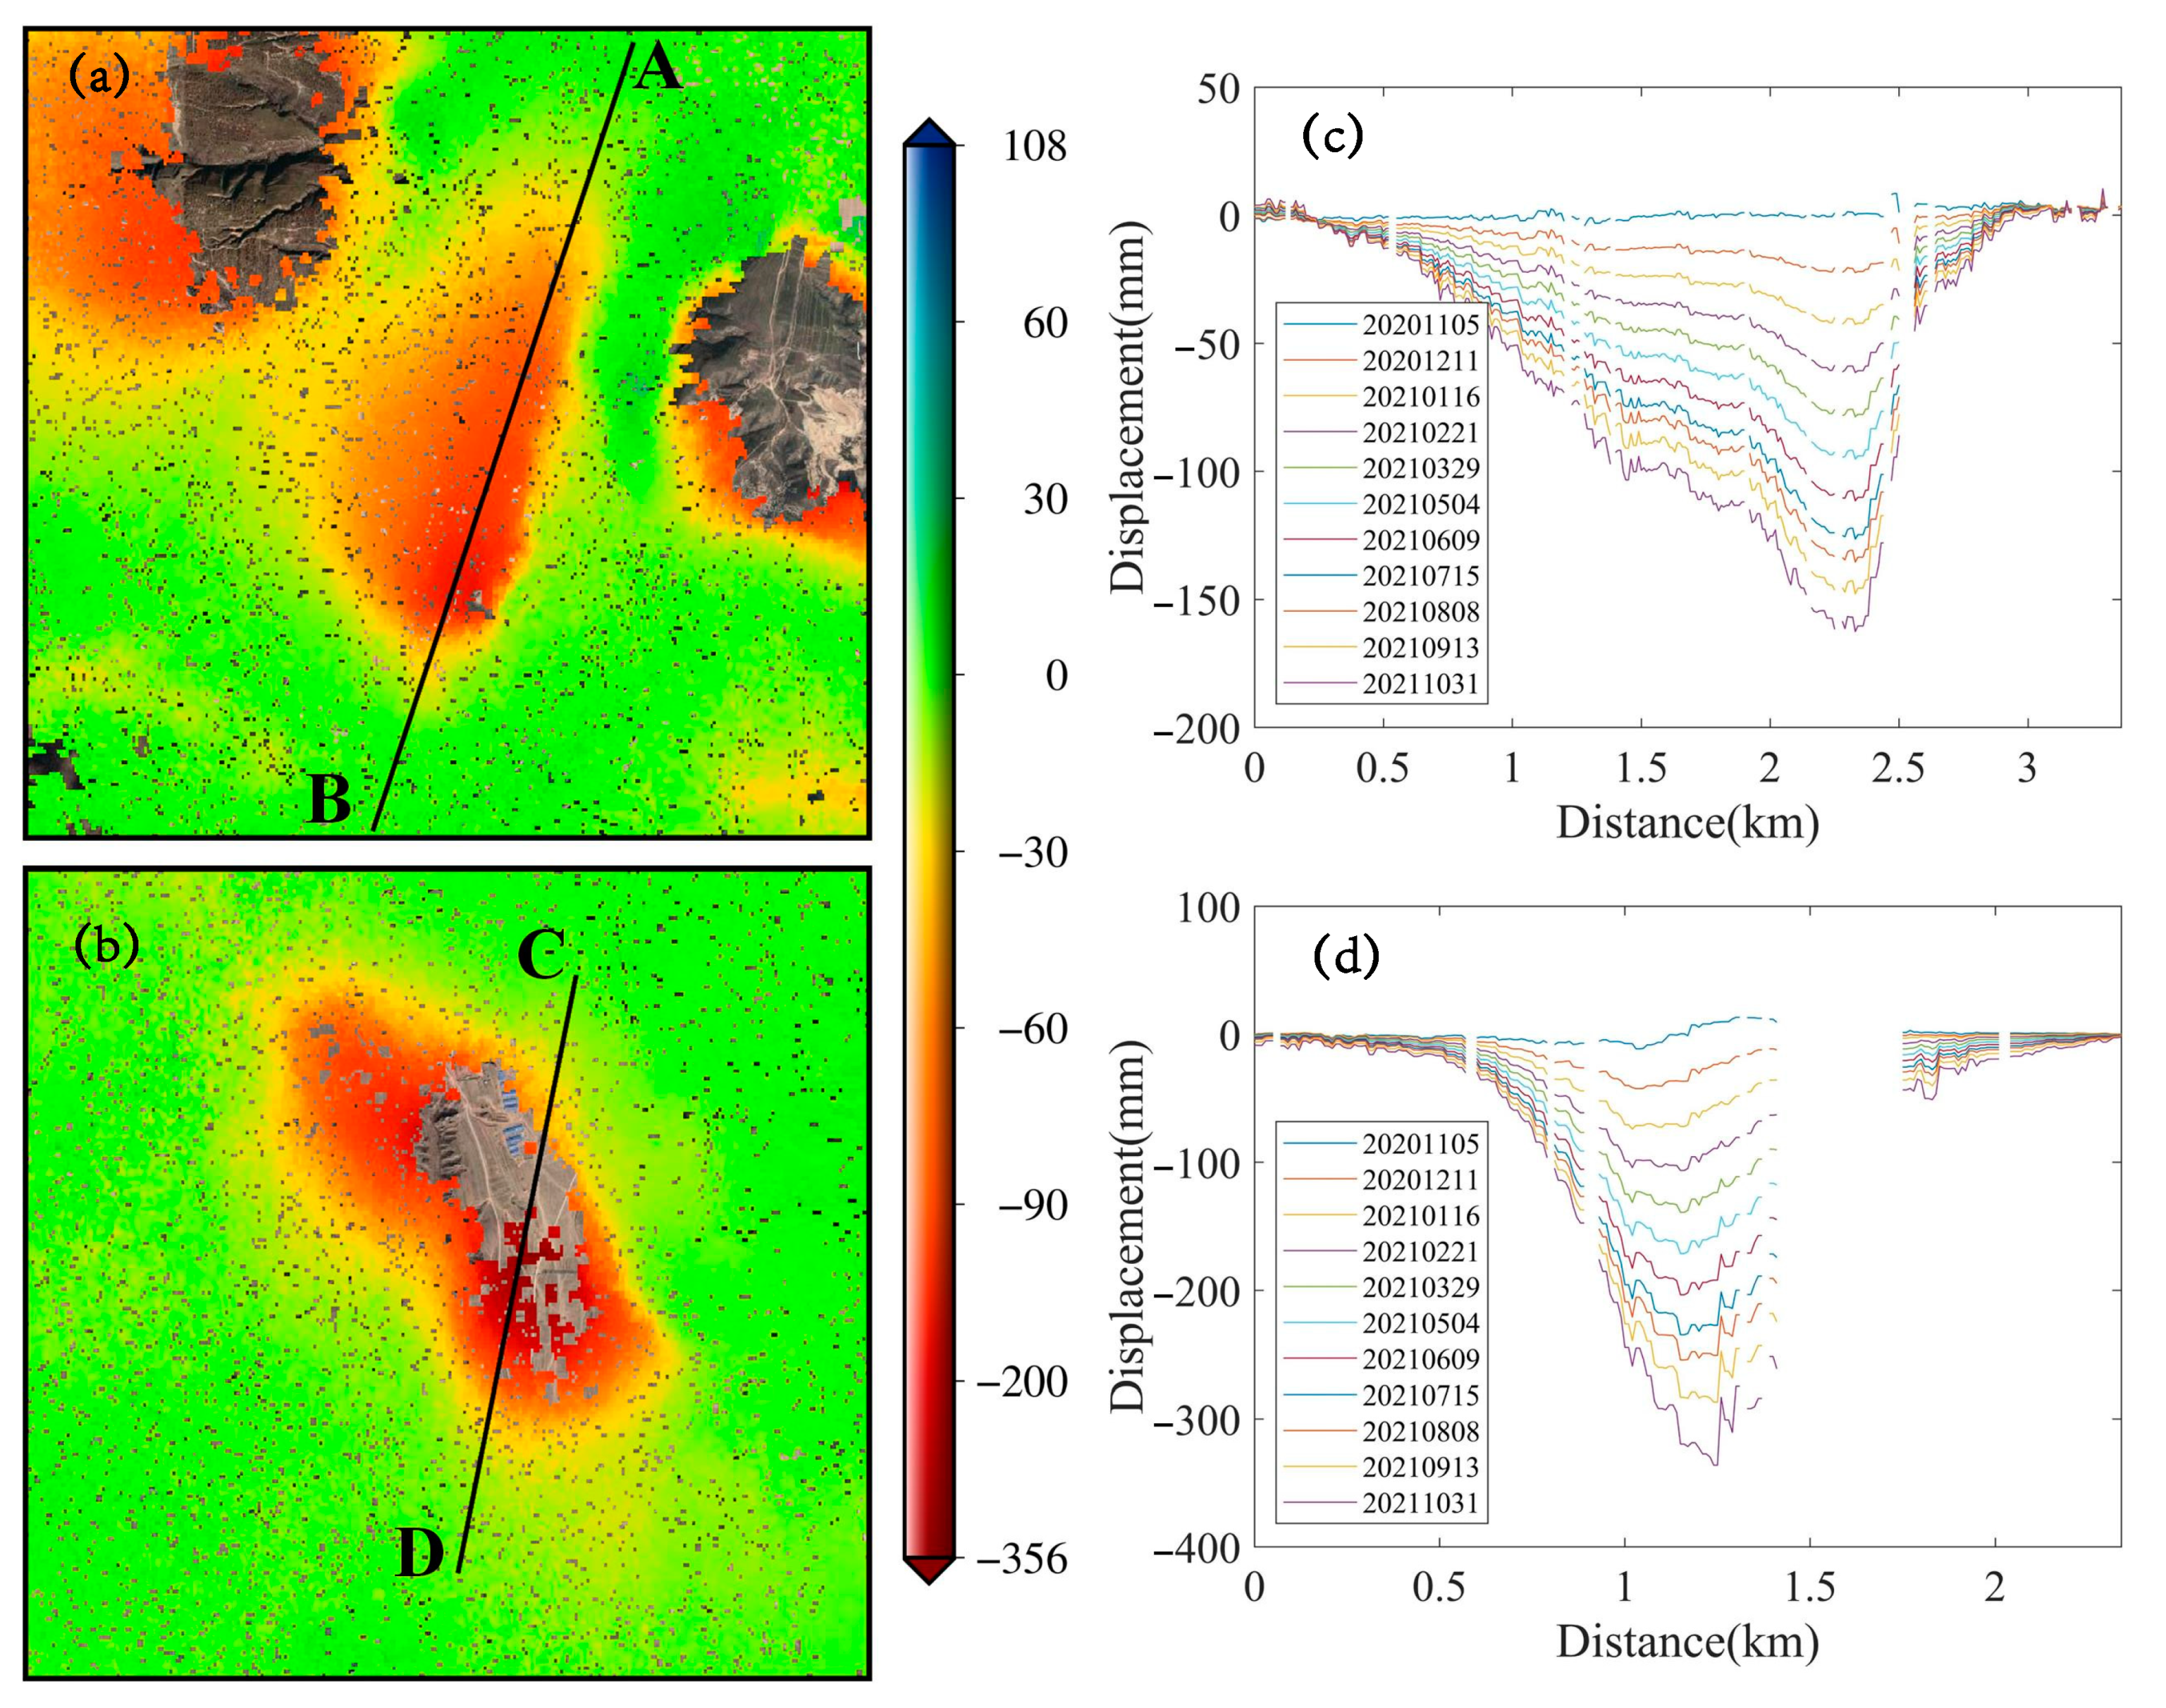
4.3. Analysis of the SBAS-InSAR Results
5. Discussion
6. Conclusions
Author Contributions
Funding
Data Availability Statement
Acknowledgments
Conflicts of Interest
References
- Xiuming, J.; Chao, M.; Anyuan, Z. Environmental investigation and evaluation of land subsidence in the Datong coalfield based on InSAR technology. Acta Geol. Sin.-Engl. Ed. 2008, 82, 1035–1044. [Google Scholar] [CrossRef]
- Yang, C.; Lu, Z.; Zhang, Q.; Liu, R.; Ji, L.; Zhao, C. Ground deformation and fissure activity in Datong basin, China 2007–2010 revealed by multi-track InSAR. Geomat. Nat. Hazards Risk 2019, 10, 465–482. [Google Scholar] [CrossRef]
- Zhao, C.-y.; Zhang, Q.; Yang, C.; Zou, W. Integration of MODIS data and Short Baseline Subset (SBAS) technique for land subsidence monitoring in Datong, China. J. Geodyn. 2011, 52, 16–23. [Google Scholar] [CrossRef]
- Rucker, M.L.; Panda, B.B.; Meyers, R.A.; Lommler, J.C. Using InSAR to detect subsidence at brine wells, sinkhole sites, and mines. Carbonates Evaporites 2013, 28, 141–147. [Google Scholar] [CrossRef]
- Fan, H.; Gao, X.; Yang, J.; Deng, K.; Yu, Y. Monitoring mining subsidence using a combination of phase-stacking and offset-tracking methods. Remote Sens. 2015, 7, 9166–9183. [Google Scholar] [CrossRef] [Green Version]
- Przyłucka, M.; Herrera, G.; Graniczny, M.; Colombo, D.; Béjar-Pizarro, M. Combination of conventional and advanced DInSAR to monitor very fast mining subsidence with TerraSAR-X data: Bytom City (Poland). Remote Sens. 2015, 7, 5300–5328. [Google Scholar] [CrossRef] [Green Version]
- Zhang, B.; Li, J.; Ren, H. Using phase unwrapping methods to apply D-InSAR in mining areas. Can. J. Remote Sens. 2019, 45, 225–233. [Google Scholar] [CrossRef]
- Chen, Y.; Tan, K.; Yan, S.; Zhang, K.; Zhang, H.; Liu, X.; Li, H.; Sun, Y. Monitoring land surface displacement over Xuzhou (China) in 2015–2018 through PCA-based correction applied to SAR interferometry. Remote Sens. 2019, 11, 1494. [Google Scholar] [CrossRef] [Green Version]
- Fan, H.; Liu, Y.; Xu, Y.; Yang, H. Surface subsidence monitoring with an improved distributed scatterer interferometric SAR time series method in a filling mining area. Geocarto Int. 2021, 1–23. [Google Scholar] [CrossRef]
- Hu, Z.; Ge, L.; Li, X.; Zhang, K.; Zhang, L. An Underground-Mining Detection System Based on DInSAR. IEEE Trans. Geosci. Remote Sens. 2013, 51, 615–625. [Google Scholar] [CrossRef]
- Carnec, C.; Massonnet, D.; King, C. Two examples of the use of SAR interferometry on displacement fields of small spatial extent. Geophys. Res. Lett. 1996, 23, 3579–3582. [Google Scholar] [CrossRef]
- Yang, Z.; Li, Z.; Zhu, J.; Yi, H.; Feng, G.; Hu, J.; Wu, L.; Preusse, A.; Wang, Y.; Papst, M. Locating and defining underground goaf caused by coal mining from space-borne SAR interferometry. ISPRS J. Photogramm. Remote Sens. 2018, 135, 112–126. [Google Scholar] [CrossRef]
- Xiao, R.; Jiang, M.; Li, Z.; He, X. New insights into the 2020 Sardoba dam failure in Uzbekistan from Earth observation. Int. J. Appl. Earth Obs. Geoinf. 2022, 107, 102705. [Google Scholar] [CrossRef]
- Ciampalini, A.; Solari, L.; Giannecchini, R.; Galanti, Y.; Moretti, S. Evaluation of subsidence induced by long-lasting buildings load using InSAR technique and geotechnical data: The case study of a Freight Terminal (Tuscany, Italy). Int. J. Appl. Earth Obs. Geoinf. 2019, 82, 101925. [Google Scholar] [CrossRef]
- Shugar, D.; Jacquemart, M.; Shean, D.; Bhushan, S.; Upadhyay, K.; Sattar, A.; Schwanghart, W.; McBride, S.; De Vries, M.V.W.; Mergili, M. A massive rock and ice avalanche caused the 2021 disaster at Chamoli, Indian Himalaya. Science 2021, 373, 300–306. [Google Scholar] [CrossRef]
- Zhang, Y.; Touzi, R.; Feng, W.; Hong, G.; Lantz, T.C.; Kokelj, S.V. Landscape-scale variations in near-surface soil temperature and active-layer thickness: Implications for high-resolution permafrost mapping. Permafr. Periglac. Processes 2021, 32, 627–640. [Google Scholar] [CrossRef]
- Dai, K.; Liu, G.; Li, Z.; Ma, D.; Wang, X.; Zhang, B.; Tang, J.; Li, G. Monitoring Highway Stability in Permafrost Regions with X-band Temporary Scatterers Stacking InSAR. Sensors 2018, 18, 1876. [Google Scholar] [CrossRef] [Green Version]
- Hanssen, R.F. Radar Interferometry: Data Interpretation and Error Analysis; Kuwer Academic Publishers: Norwell, MA, USA, 2001. [Google Scholar]
- Yang, Z. Analysing the law of dynamic subsidence in mining area by fusing InSAR and leveling measurements. Int. Arch. Photogramm. Remote Sens. Spatial Inf. Sci. 2013, XL-7/W1, 163–166. [Google Scholar] [CrossRef] [Green Version]
- He, Y.; Hu, Z.; Fu, Y.; Yang, K.; Wang, R.; Shi, G.; Feng, Z.; Yang, Q.; Yu, L. Underground Morphological Detection of Ground Fissures in Collapsible Loess Area Based on Three-Dimensional Laser Scanning Technology. Remote Sens. 2022, 14, 424. [Google Scholar] [CrossRef]
- Guolin, L.; Lianpeng, Z.; Shu, C.; Tao, J. Feasibility Analysis of Monitoring Mining Surface Substance Using InSAR GPS Data Fusion. Bull. Surv. Mapp. 2005, 13–16. [Google Scholar]
- Huang, J.; Deng, K.; Fan, H.; Yan, S. An improved pixel-tracking method for monitoring mining subsidence. Remote Sens. Lett. 2016, 7, 731–740. [Google Scholar] [CrossRef]
- Yang, C.-S.; Zhang, Q.; Zhao, C.-Y.; Wang, Q.-L.; Ji, L.-Y. Monitoring land subsidence and fault deformation using the small baseline subset InSAR technique: A case study in the Datong Basin, China. J. Geodyn. 2014, 75, 34–40. [Google Scholar] [CrossRef]
- Liu, Y.; Yang, H.; Wang, S.; Xu, L.; Peng, J. Monitoring and Stability Analysis of the Deformation in the Woda Landslide Area in Tibet, China by the DS-InSAR Method. Remote Sens. 2022, 14, 532. [Google Scholar] [CrossRef]
- Xiao, R.; Yu, C.; Li, Z.; He, X. Statistical assessment metrics for InSAR atmospheric correction: Applications to generic atmospheric correction online service for InSAR (GACOS) in Eastern China. Int. J. Appl. Earth Obs. Geoinf. 2021, 96, 102289. [Google Scholar] [CrossRef]
- Lixin, W.; Junhai, G.; Daqing, G.; Mingsheng, L. Experimental Study on Surface Subsidence Monitoring with D-InSAR in Mining Area. J. Northeast. Univ. 2005, 26, 778–782. [Google Scholar]
- Ge, L.; Chang, H.-C.; Rizos, C. Mine Subsidence Monitoring Using Multi-source Satellite SAR Images. Photogramm. Eng. Remote Sens. 2007, 73, 1742–1745. [Google Scholar] [CrossRef]
- Dong, S.; Yin, H.; Yao, S.; Zhang, F. Detecting surface subsidence in coal mining area based on DInSAR technique. J. Earth Sci. 2013, 24, 449–456. [Google Scholar] [CrossRef]
- Sandwell, D.T.; Price, E.J. Phase gradient approach to stacking interferograms. J. Geophys. Res. Solid Earth 1998, 103, 30183–30204. [Google Scholar] [CrossRef] [Green Version]
- Strozzi, T.; Wegmuller, U.; Werner, C.; Wiesmann, A. Measurement of slow uniform surface displacement with mm/year accuracy. In Proceedings of the IGARSS 2000. IEEE 2000 International Geoscience and Remote Sensing Symposium. Taking the Pulse of the Planet: The Role of Remote Sensing in Managing the Environment. Proceedings (Cat. No. 00CH37120), Honolulu, HI, USA, 24–28 July 2000; pp. 2239–2241. [Google Scholar]
- Zhao, Q.; Lin, H.; Jiang, L. Ground deformation monitoring in Pearl River Delta region with Stacking D-InSAR technique. In Proceedings of the Geoinformatics 2008 and Joint Conference on GIS and Built Environment: Monitoring and Assessment of Natural Resources and Environments, Guangzhou, China, 28–29 June 2008; p. 714513. [Google Scholar]
- Bin, L.; Daqing, G.; Shanshan, W.; Man, L.; Ling, Z.; Yan, W.; Qiong, W. Combining Application of TOPS and ScanSAR InSAR in Large-Scale Geohazards Identification. Geomat. Inf. Sci. Wuhan Univ. 2020, 45, 1756–1762. [Google Scholar] [CrossRef]
- Qin, Z.; Agarwal, V.; Gee, D.; Marsh, S.; Grebby, S.; Chen, Y.; Meng, N. Study of Ground Movement in a Mining Area with Geological Faults Using FDM Analysis and a Stacking InSAR Method. Front. Environ. Sci. 2021, 9, 787053. [Google Scholar] [CrossRef]
- Jiang, L.; Lin, H.; Ma, J.; Kong, B.; Wang, Y. Potential of small-baseline SAR interferometry for monitoring land subsidence related to underground coal fires: Wuda (Northern China) case study. Remote Sens. Environ. 2011, 115, 257–268. [Google Scholar] [CrossRef]
- Zhu, Y.; Yao, X.; Yao, L.; Yao, C. Detection and characterization of active landslides with multisource SAR data and remote sensing in western Guizhou, China. Nat Hazards 2022, 111, 973–994. [Google Scholar] [CrossRef]
- Min, H.; Xiufeng, H. Ground Subsidence Detection of Yancheng City Using Time Series Interferograms Stacking. Geomat. Inf. Sci. Wuhan Univ. 2011, 36, 1461–1465. [Google Scholar] [CrossRef]
- Jinghui, F.; Huadong, G.; Xiaofang, G.; Guang, L.; Daqing, G.; Shengwei, L. Monitoring Subsidence in Tianjin Area Using Interferogram Stacking Based on Coherent Targets. J. Remore Sens. 2008, 12, 111–118. [Google Scholar]
- Chenglong, Z.; Zhenhong, L.; Chen, Y.; Chuang, S.; Ruya, X.; Jianbing, P. Landslide Detection of the Jinsha River Using GACOS Assisted InSAR Stacking. Geomat. Inf. Sci. Wuhan Univ. 2021, 46, 1649–1657. [Google Scholar] [CrossRef]
- Berardino, P.; Fornaro, G.; Lanari, R.; Sansosti, E. A new algorithm for surface deformation monitoring based on small baseline differential SAR interferograms. IEEE Trans. Geosci. Remote Sens. 2002, 40, 2375–2383. [Google Scholar] [CrossRef] [Green Version]
- Hooper, A. A multi-temporal InSAR method incorporating both persistent scatterer and small baseline approaches. Geophys. Res. Lett. 2008, 35, L16302. [Google Scholar] [CrossRef] [Green Version]
- Bing, Y. Modelling of High-Resolution Coherent Scatterer Radar Interferometry and Methodology for Extracting Deformation. Ph.D. Thesis, Southwest Jiaotong University, Chengdu, China, 2015. [Google Scholar]
- Li, Z.; Fielding, E.J.; Cross, P. Integration of InSAR Time-Series Analysis and Water-Vapor Correction for Mapping Postseismic Motion After the 2003 Bam (Iran) Earthquake. IEEE Trans. Geosci. Remote Sens. 2009, 47, 3220–3230. [Google Scholar] [CrossRef] [Green Version]
- Lanari, R.; Casu, F.; Manzo, M.; Zeni, G.; Berardino, P.; Manunta, M.; Pepe, A. An Overview of the Small BAseline Subset Algorithm: A DInSAR Technique for Surface Deformation Analysis. Pure Appl. Geophys. 2007, 164, 637–661. [Google Scholar] [CrossRef]
- Lanari, R.; Mora, O.; Manunta, M.; Mallorqui, J.J.; Berardino, P.; Sansosti, E. A small-baseline approach for investigating deformations on full-resolution differential SAR interferograms. IEEE Trans. Geosci. Remote Sens. 2004, 42, 1377–1386. [Google Scholar] [CrossRef]
- Fan, H.; Lu, L.; Yao, Y. Method Combining Probability Integration Model and a Small Baseline Subset for Time Series Monitoring of Mining Subsidence. Remote Sens. 2018, 10, 1444. [Google Scholar] [CrossRef] [Green Version]
- Chen, Y.; Yu, S.; Tao, Q.; Liu, G.; Wang, L.; Wang, F. Accuracy Verification and Correction of D-InSAR and SBAS-InSAR in Monitoring Mining Surface Subsidence. Remote Sens. 2021, 13, 4365. [Google Scholar] [CrossRef]
- Pawluszek-Filipiak, K.; Borkowski, A. Integration of DInSAR and SBAS Techniques to Determine Mining-Related Deformations Using Sentinel-1 Data: The Case Study of Rydułtowy Mine in Poland. Remote Sens. 2020, 12, 242. [Google Scholar] [CrossRef] [Green Version]
- Ghzala, K.; Tounsi, Y.; Muhire, D.; Nassim, A. Land motion detection in central Rwanda using small baseline subset interferometry. Remote Sens. Appl. Soc. Environ. 2021, 21, 100430. [Google Scholar] [CrossRef]
- Zhao, F.; Mallorqui, J.J. Coherency matrix decomposition-based polarimetric persistent scatterer interferometry. IEEE Trans. Geosci. Remote Sens. 2019, 57, 7819–7831. [Google Scholar] [CrossRef] [Green Version]
- Touzi, R. Target scattering decomposition in terms of roll-invariant target parameters. IEEE Trans. Geosci. Remote Sens. 2006, 45, 73–84. [Google Scholar] [CrossRef]
- Ferretti, A.; Fumagalli, A.; Novali, F.; Prati, C.; Rocca, F.; Rucci, A. A new algorithm for processing interferometric data-stacks: SqueeSAR. IEEE Trans. Geosci. Remote Sens. 2011, 49, 3460–3470. [Google Scholar] [CrossRef]
- Fornaro, G.; Verde, S.; Reale, D.; Pauciullo, A. CAESAR: An approach based on covariance matrix decomposition to improve multibaseline–multitemporal interferometric SAR processing. IEEE Trans. Geosci. Remote Sens. 2014, 53, 2050–2065. [Google Scholar] [CrossRef]
- Dai, K.; Li, Z.; Tomás, R.; Liu, G.; Yu, B.; Wang, X.; Cheng, H.; Chen, J.; Stockamp, J. Monitoring activity at the Daguangbao mega-landslide (China) using Sentinel-1 TOPS time series interferometry. Remote Sens. Environ. 2016, 186, 501–513. [Google Scholar] [CrossRef] [Green Version]
- European Space Agency. Missions: SENTINEL-1. Available online: https://sentinel.esa.int/web/sentinel/missions/sentinel-1 (accessed on 10 April 2022).
- Zhang, L.; Dai, K.; Deng, J.; Ge, D.; Liang, R.; Li, W.; Xu, Q. Identifying Potential Landslides by Stacking-InSAR in Southwestern China and Its Performance Comparison with SBAS-InSAR. Remote Sens. 2021, 13, 3662. [Google Scholar] [CrossRef]


| Parameter | Value |
|---|---|
| Wavelength | 5.6 cm |
| Central incidence angle | 39.0851° |
| Polarization mode | VV |
| Orbital direction | Ascending |
| Azimuth/Rang pixel spacing | 13.96/2.33 m |
| Zone | Location | Deformation Rate | |
|---|---|---|---|
| Stacking-InSAR | SBAS-InSAR | ||
| b | Yungang Town | −365 mm/a | −373 mm/a |
| c | Silaogou | −460 mm/a | −355 mm/a |
| d | Louzigou | −269 mm/a | −265 mm/a |
| Category | Method | Count | Mining Deformation | Applicability |
|---|---|---|---|---|
| 1 | Identified by three methods | 256 | 218 | - |
| 2 | Stacking-InSAR | 256 | 218 | Low coherence Less images required Less time consuming |
| 3 | SBAS-InSAR | 226 | 190 | Influenced by atmosphere phase and DEM error Cumulative time-series deformation |
| 4 | DInSAR | 130 | 128 | Small spatiotemporal baseline Nonlinear deformation Low technical requirements |
Publisher’s Note: MDPI stays neutral with regard to jurisdictional claims in published maps and institutional affiliations. |
© 2022 by the authors. Licensee MDPI, Basel, Switzerland. This article is an open access article distributed under the terms and conditions of the Creative Commons Attribution (CC BY) license (https://creativecommons.org/licenses/by/4.0/).
Share and Cite
Xu, Y.; Li, T.; Tang, X.; Zhang, X.; Fan, H.; Wang, Y. Research on the Applicability of DInSAR, Stacking-InSAR and SBAS-InSAR for Mining Region Subsidence Detection in the Datong Coalfield. Remote Sens. 2022, 14, 3314. https://doi.org/10.3390/rs14143314
Xu Y, Li T, Tang X, Zhang X, Fan H, Wang Y. Research on the Applicability of DInSAR, Stacking-InSAR and SBAS-InSAR for Mining Region Subsidence Detection in the Datong Coalfield. Remote Sensing. 2022; 14(14):3314. https://doi.org/10.3390/rs14143314
Chicago/Turabian StyleXu, Yaozong, Tao Li, Xinming Tang, Xiang Zhang, Hongdong Fan, and Yuewen Wang. 2022. "Research on the Applicability of DInSAR, Stacking-InSAR and SBAS-InSAR for Mining Region Subsidence Detection in the Datong Coalfield" Remote Sensing 14, no. 14: 3314. https://doi.org/10.3390/rs14143314
APA StyleXu, Y., Li, T., Tang, X., Zhang, X., Fan, H., & Wang, Y. (2022). Research on the Applicability of DInSAR, Stacking-InSAR and SBAS-InSAR for Mining Region Subsidence Detection in the Datong Coalfield. Remote Sensing, 14(14), 3314. https://doi.org/10.3390/rs14143314