Abstract
We aimed to study the daily formaldehyde (HCHO) columns over urban and forested areas in São Paulo State, Brazil, from rhe TROPOMI spectrometer onboard the Sentinel-5P satellite during 2020. Nineteen specific areas were defined in four regions: 3 areas in each of two preserved Atlantic Forests (PEMD and PETAR), 3 in a sugarcane growing region (NERG) and 10 in the Metropolitan Area of São Paulo (MASP), among which 2 areas are in the Morro Grande reserve, which is a significant remnant of Atlantic Forest outside the densely urbanized area of MASP. An analysis of variance and Tukey’s test showed that the mean annual columns over the Morro Grande reserve (−4 mol/m² and −4 mol/m²) presented greater statistical similarity with the forest and rural areas of the state (<−4 mol/m²) than with MASP (>−4 mol/m²), indicating few effects from megacity anthropogenic emissions. Case studies addressing selected days in 2020 showed that fires in and around the state were related to episodes of maximum density of HCHO columns. The results showed significant seasonality, with lower concentrations during summer (wet season) and higher concentrations during winter and spring (dry and transition dry–wet seasons).
Keywords:
air quality; annual; Atlantic Forest; fire outbreaks; megacity; seasonal; vehicular emissions 1. Introduction
Formaldehyde (HCHO) is an important trace gas in the atmosphere. It affects air quality by participating in the formation of radicals such as OH and HO2 [1,2], which contribute to the production of the tropospheric ozone (O3), secondary organic aerosols (SOA) and other secondary pollutants [3]. HCHO is also an important tracer of volatile organic compounds (VOCs) emissions, since the oxidation of several VOCs produces formaldehyde and the typical lifetime of HCHO is a few hours, so it does not stray too far from the place where it was produced [4,5].
The main source of HCHO for the global troposphere (atmospheric background) is the oxidation of methane. However, in continental areas, the variation of HCHO is mainly determined by the oxidation of nonmethane volatile organic compounds (NMVOCs) [6,7]. Biogenic sources are responsible for about 85% of NMVOCs emissions [8], while 12% are represented by anthropogenic sources [9] and 3% by pyrogenic sources [7,10]. However, the emission of anthropogenic precursors in highly industrialized and polluted urban areas causes the occurrence of centers of a high concentration of HCHO [11], increasing the frequency of its adverse effects on the environment and human health [12,13]. Acetaldehyde and methanol are notable anthropogenic precursors [14]. The main biogenic VOC is isoprene, a highly reactive hydrocarbon with a lifetime of less than one hour, which makes it also the main precursor of formaldehyde in forest regions [15,16]. In areas of dense vegetation, isoprene is responsible for more than 70% of the secondary production of formaldehyde [11]. Several physiological processes of plants contribute to the emission of NMVOCs, and photosynthetic processes are the most related to the production and emission of isoprene [17].
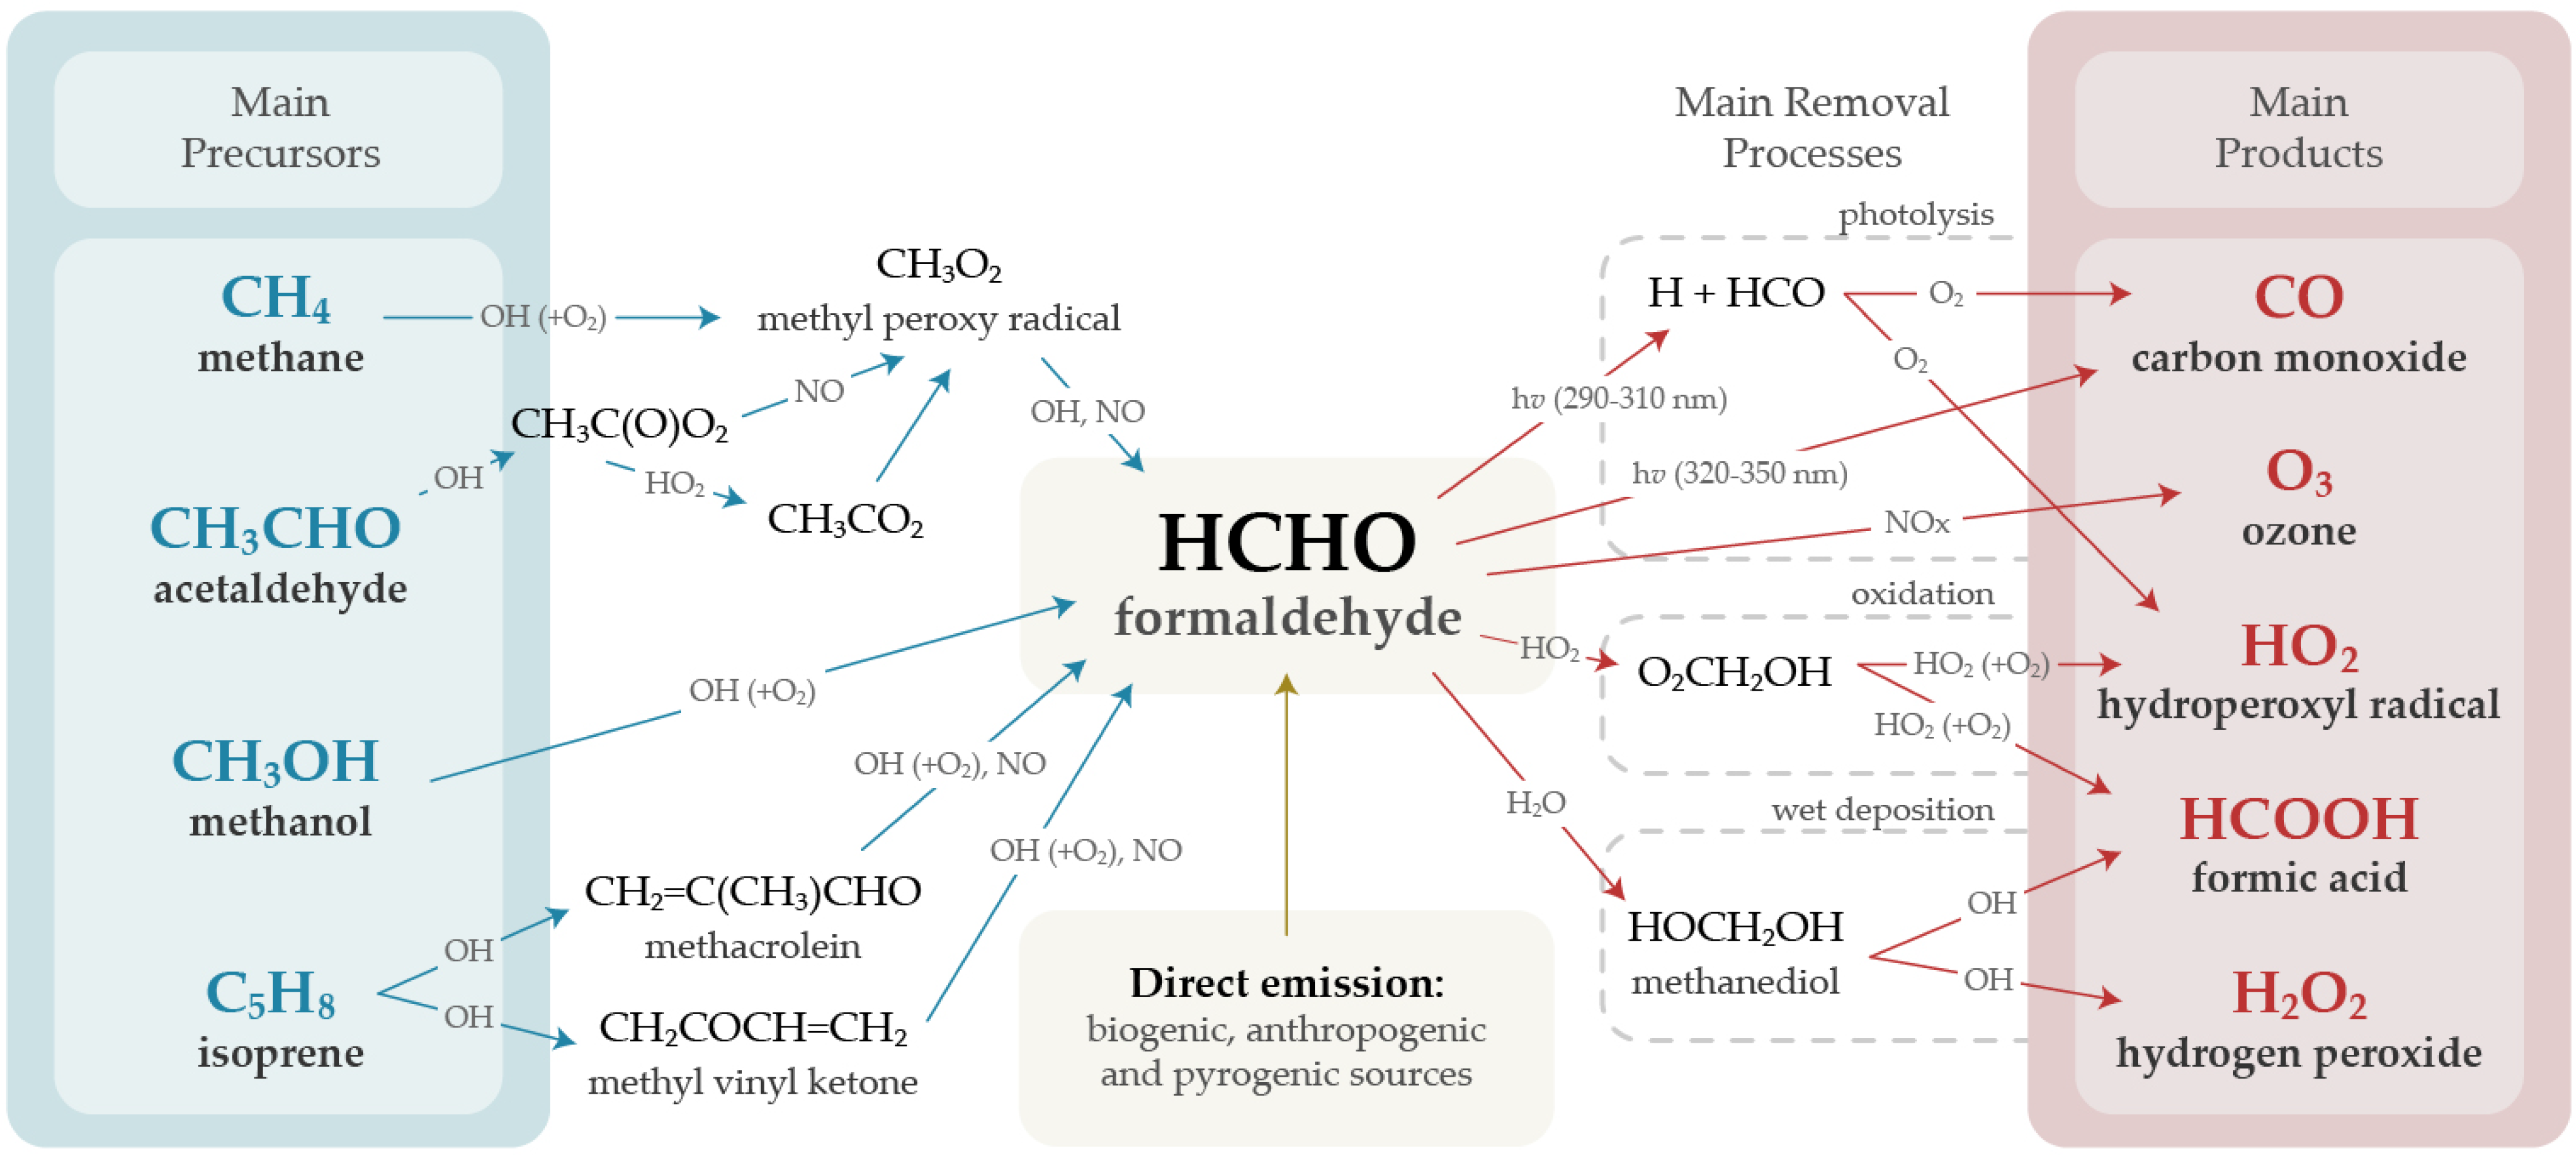
The short lifetime of formaldehyde is justified by the diversity of processes capable of removing this chemical species from the atmosphere [18]. The main ones are photolysis, by electromagnetic radiation at wavelengths from 290 to 310 nm and from 320 to 350 nm [19]; oxidation by OH and HO2 radicals [1]; and wet deposition, due to its strong electric dipole moment and consequent high solubility in water [20]. Figure 1 presents the main precursors of HCHO, intermediate species in production, removal processes and main products generated by such processes. Tropospheric ozone (O3) is an important product, and it is one of the main agents of photochemical smog; formic acid (HCOOH) and hydrogen peroxide (H2O2) are also relevant species generated as they contribute to acid rain in heavily polluted areas [21,22,23].
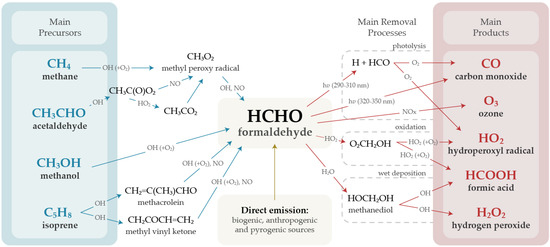
Figure 1.
Overview of the main production and removal reactions of atmospheric formaldehyde.
The monitoring of the atmospheric concentration of HCHO can be carried out from space using spectrometers attached to orbiting satellites [24,25]. When monitoring trace gases, the satellite sensor reads the entire vertical column from the ground up to the height of the orbit, so there is no detail on the vertical variation of concentrations with altitude [26]. This is a problem for the remote monitoring of tropospheric ozone, since the highest concentrations of O3 are found in the stratosphere, requiring the use of algorithms that make estimates based on the collected data [27]. However, because of its lifetime of a few hours, formaldehyde remains close to the surface, below the planetary boundary layer [28], which increases the reliability of the data and allows inferences to be made about its VOC precursors that also have a short lifetime (thus, they are oxidized and produce formaldehyde near the location where they were emitted) [29,30,31], on the photochemical activity of the atmosphere [32,33] and on tropospheric ozone concentrations, improving the aforementioned algorithms [27].
Remote formaldehyde monitoring has been performed since the 1970s with low-orbit satellites. Over the years, the resolution of spectrometers has improved significantly, making it possible to identify HCHO concentrations over individual urban centers [34,35]. However, there are still no studies on the formaldehyde columns recorded in the São Paulo State. Some studies with surface sampling were conducted in the Metropolitan Area of São Paulo (MASP) [36,37] and the Environmental Protection Agency of the State of São Paulo (CETESB) carried out formaldehyde monitoring at three sampling sites in the megacity, between 2017 and 2020, and also with surface samplers [38]. The present work aims, therefore, to use the formaldehyde columns monitored remotely over the São Paulo State for one year, 2020, to evaluate the seasonality of these concentrations, to analyze the differences in the columns measured over urban and forest areas and to compare the results with those achieved by studies that used surface formaldehyde measurements.
2. Data and Methods
2.1. Formaldehyde Columns
Data from vertical formaldehyde columns (mol/m²) were obtained from the TROPOMI spectrometer onboard the Sentinel-5P satellite, which makes one retrieval of HCHO columns per day over São Paulo State, always between 3 p.m. and 7 p.m. UTC or 12 p.m. and 4 p.m. local time [39]. This time window includes the hours of maximum incidence of solar radiation and also of maximum tropospheric ozone concentration on the day, which normally occurs around 3 p.m. in São Paulo [40]. The Level-2 product has a spatial resolution of km at nadir [41] and the instrument’s spectral bands cover the ultraviolet and visible regions at wavelengths from 270 to 500 nm [42], covering the spectral range attenuated by atmospheric formaldehyde (290 to 350 nm) [32,43].
In order to guarantee data quality, TROPOMI calculates, for each registered column, a value between 0 and 1 (QA, Quality Assurance) and recommends using only columns with QA > 0.5 (no error flag, cloud radiance fraction at 340 nm < 0.5, Solar Zenith Angle (SZA) ≤ 70°, surface albedo ≤ 0.2, no snow/ice warning and air mass factor > 0.1) [44,45]. It is also noteworthy that there were corrupted files referring to some days of 2020 (i.e., files available for download on the online platform, but which could not be read by the processing software). Most days with missing data occurred in April, affecting the analysis conducted for this month.
2.2. Study Area and Analysis Windows
The São Paulo State, located in southeastern Brazil, has direct and indirect HCHO emissions from biogenic, anthropogenic and pyrogenic sources. The area of its territory is 248,219.48 km², divided originally into 167,051.71 km² of Atlantic Forest (32.6% preserved) and 81,167.77 km² of Brazilian Savanna (Cerrado, 3.0% preserved) [46,47]. While biogenic emissions predominate in preserved forest areas [48], pyrogenic emissions play a relevant role in sugarcane growing areas, which cover more than 20% of the state [49,50]. The Metropolitan Area of São Paulo is one of the largest megacities in the world, with more than 21 million inhabitants and around 8 million vehicles [38,46]. Vehicular anthropogenic emissions predominate in MASP, and the main fuels used are gasohol (73% gasoline and 27% anhydrous ethanol) and hydrous ethanol, used by light vehicles and motorcycles; diesel (about 10% biodiesel), used by trucks and buses; in addition to fewer significantive percentages of NGV (Natural Gas Vehicles) and electric vehicles [51]. Created in 1986, the Brazilian vehicle emissions control program (PROCONVE) contributed to the gradual reduction in pollutant emissions from new vehicles [52,53], while also managing to prevent many of the potential environmental problems and health risks arising from the growth of the vehicle fleet in recent decades [54]. Between 2006 and 2019, the vehicle fleet in the MASP grew by 67%, but emissions of aldehydes, including formaldehyde, decreased by 27% and those of hydrocarbons decreased by 51% [51]. Even so, air quality standards—established by CETESB—are still exceeded for some pollutants, which mainly include the tropospheric ozone, indicating that air pollution from mobile sources continues to be a major problem for the megacity [37].
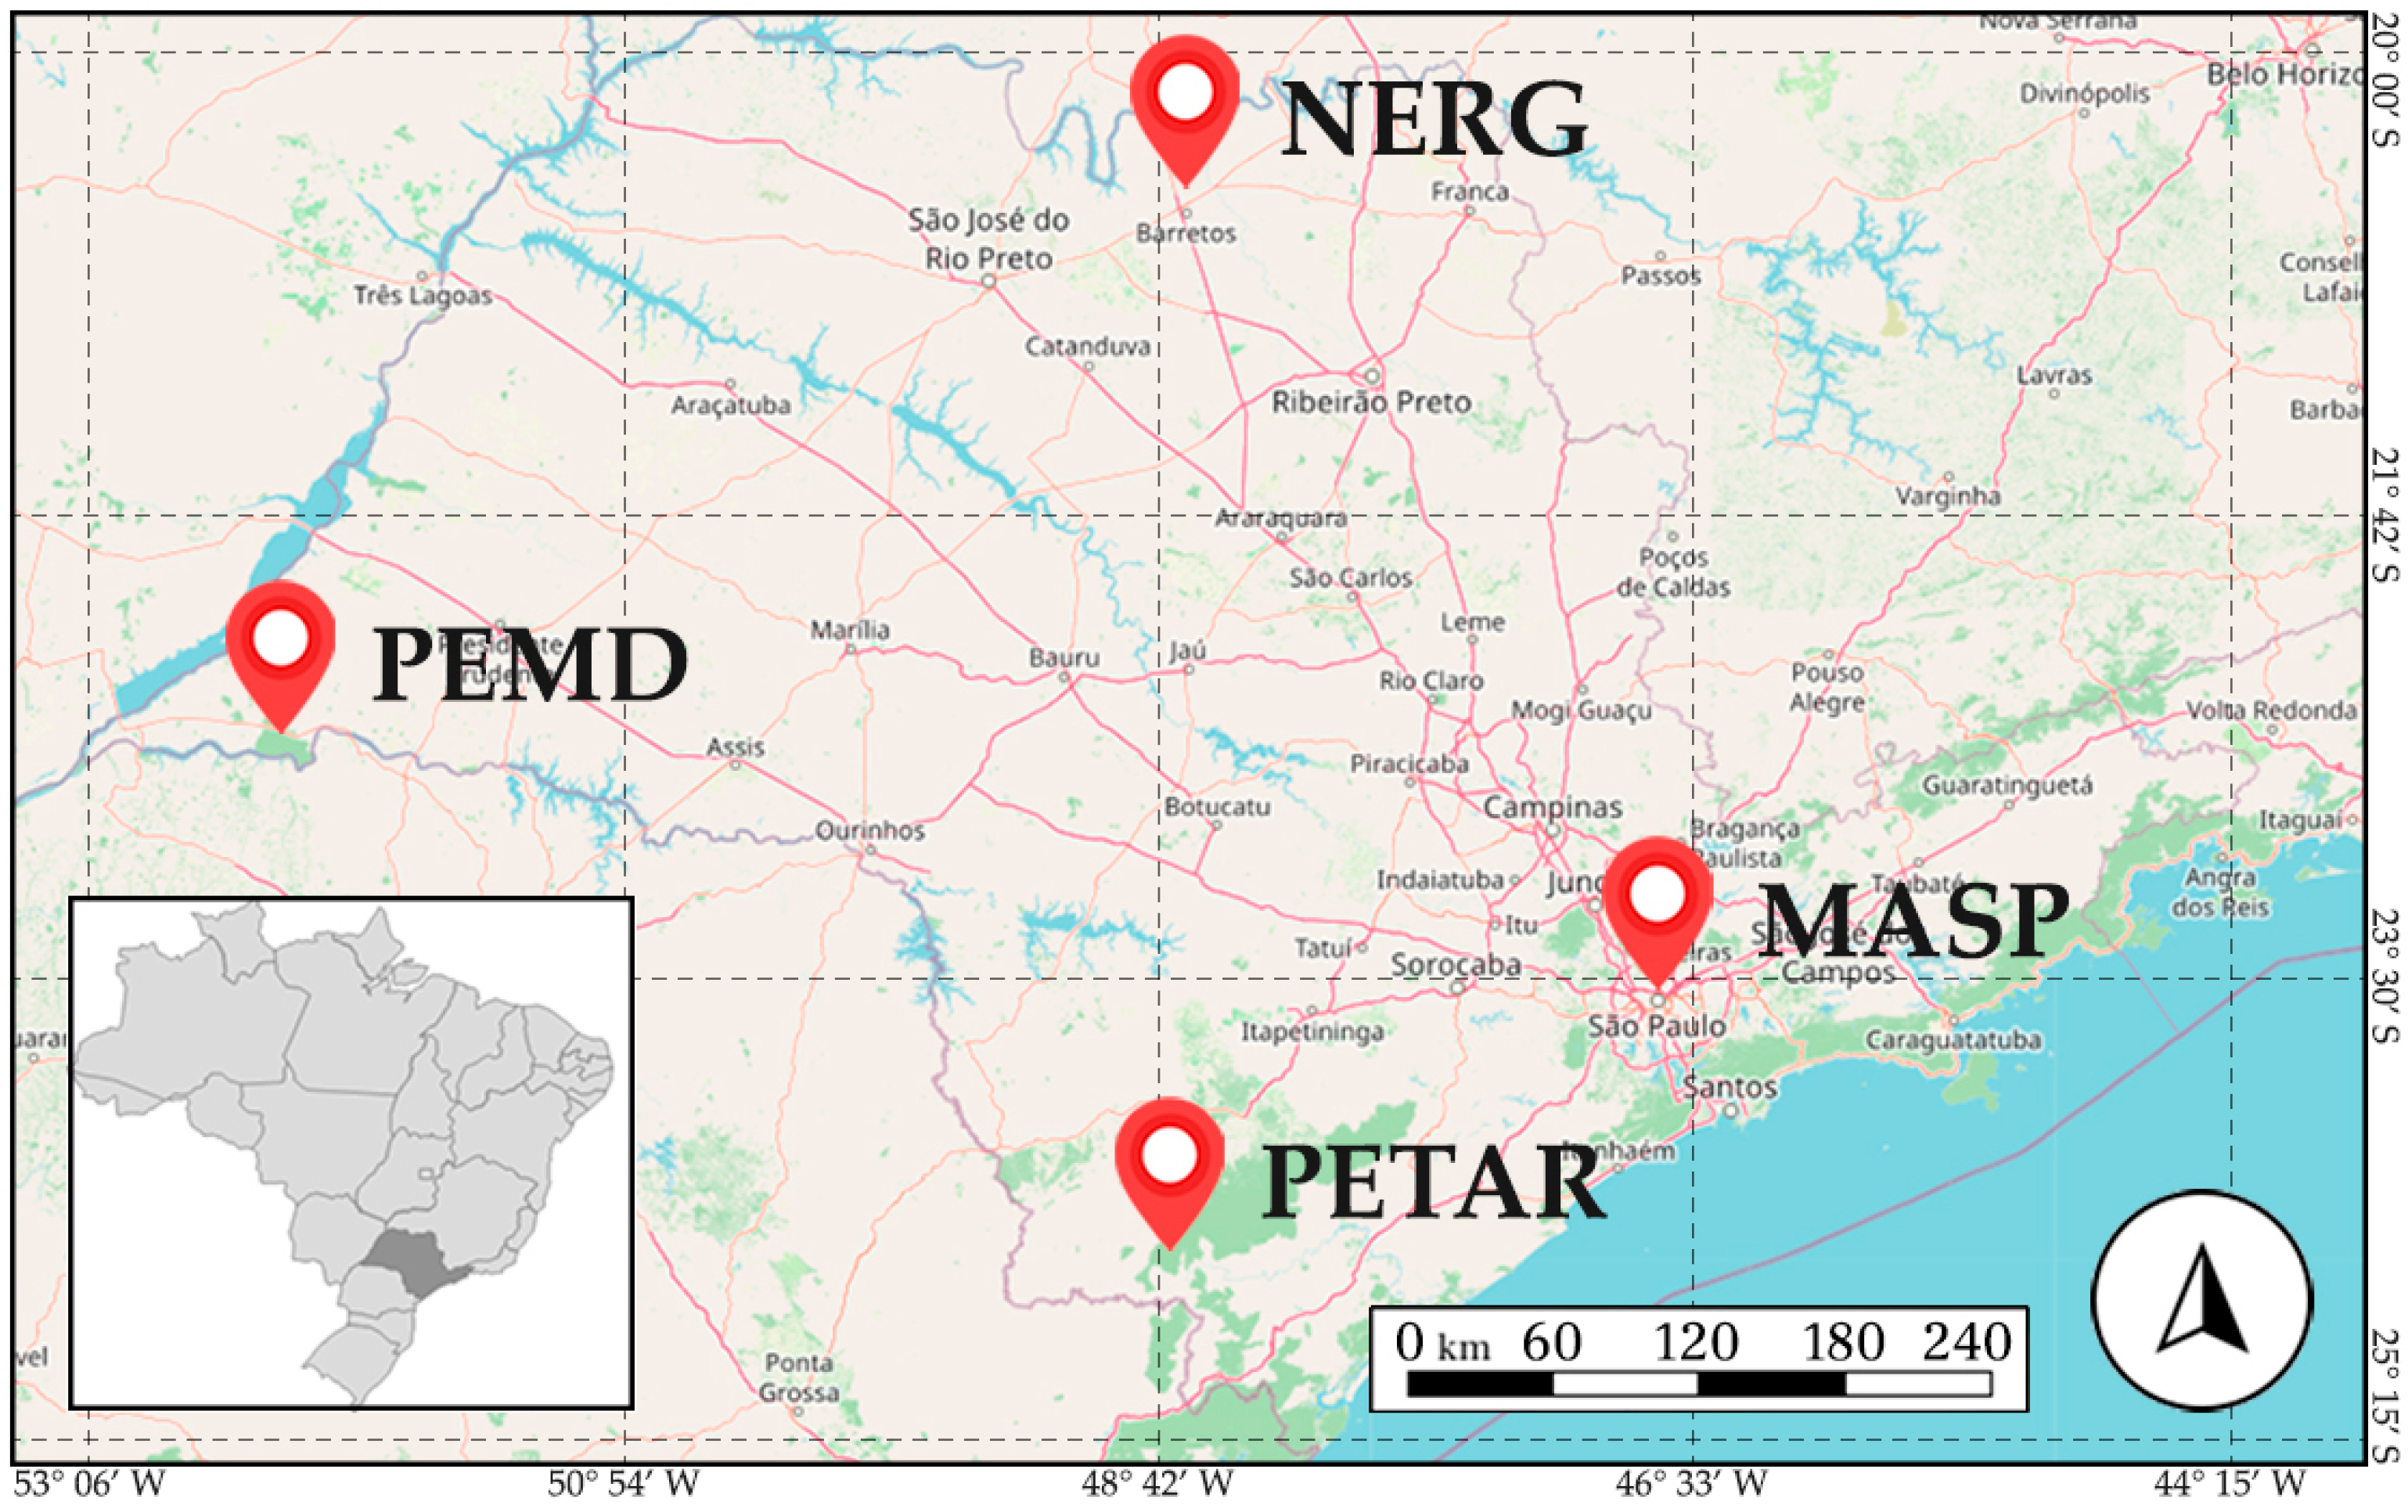
TROPOMI’s spatial resolution makes it possible to identify HCHO columns on the scale of cities, enabling the observation, if any, of the nuclei of pollution with high concentrations over individual urban centers [42]. The present work will focus on four areas of interest in the state of São Paulo: Metropolitan Area of São Paulo (MASP), Morro do Diabo State Park (PEMD), Alto Ribeira Tourist State Park (PETAR) and North of the State/Grande River (NERG) (Figure 2).
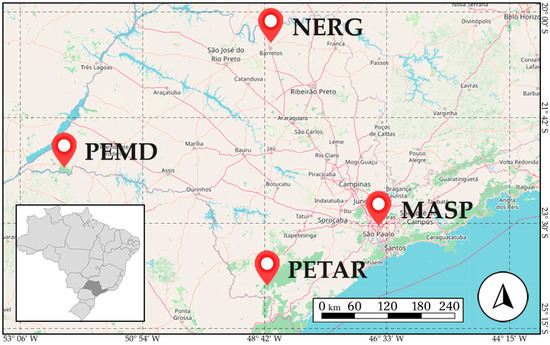
Figure 2.
Location of the four areas of interest in the São Paulo State.
The MASP covers an area of 7944 km², with over 21 million inhabitants and around 7 million vehicles. Direct emissions from burning fossil fuels and secondary formation through precursors also emitted by motor vehicles are the predominant sources of formaldehyde in this region [38]. Throughout the year, the highest concentrations of HCHO are recorded during winter, when there are thermal inversions near the surface, lower precipitation rates, weaker winds and lower radiation availability for photolysis processes [37]. The PEMD and PETAR parks have areas of 338.5 km² and 357.8 km², respectively, and keep preserved native species from Atlantic Forest. The vegetation coverage of PEMD is composed by semideciduous seasonal forest, while that of PETAR is composed by dense ombrophylous forest [47]. The major source of formaldehyde to the atmosphere of these locations is secondary production from the oxidation of isoprene, an important biogenic VOC [15].
The fourth area of interest, NERG, is located about 20 km north of the city of Barretos, with the Pardo River to the east and the Grande River to the west, and it was chosen to represent a region of large areas cultivated with sugarcane in the north of the state. Sugarcane is the main agricultural product in São Paulo, representing 35.22% of the sector’s revenue [55]; however, the production of sugarcane involves a stage called pre-harvest straw burning, which consists in the elimination, by combustion, of dry leaves close to the cultivated canes [56]. This burning is characterized as incomplete combustion, emitting various pollutants to the atmosphere, such as carbon monoxide (CO), carbon dioxide (CO2), fine particulate matter (PM2.5), inhalable particulate matter (PM10), nitrogen oxides (NOx), aldehydes (such as formaldehyde) and other volatile organic compounds (VOCs) [50,57]. In 2002, state law N° 11.241 was enacted with the intention of gradually eliminating the practice of pre-harvest straw burning in São Paulo by 2031. Studies show that the number of burnings has decreased in recent years, despite the increase in production, which can be attributed as a result of the state law [58,59]. Nonetheless, that, due to its relevance in the agricultural sector of São Paulo and to its process being an important source of pyrogenic pollutants, the production of sugarcane is of high importance for the understanding of the sources of formaldehyde, especially in the north of the state, where the largest areas used for this production are concentrated [60]. Unlike the other selected areas of interest, this one is located in the Cerrado region, with patches of preserved native vegetation and many farms [47]. The main sources of HCHO are biogenic and pyrogenic emissions, and the daily peaks of concentration are explained by occurrences of fires and, therefore, pyrogenic sources.
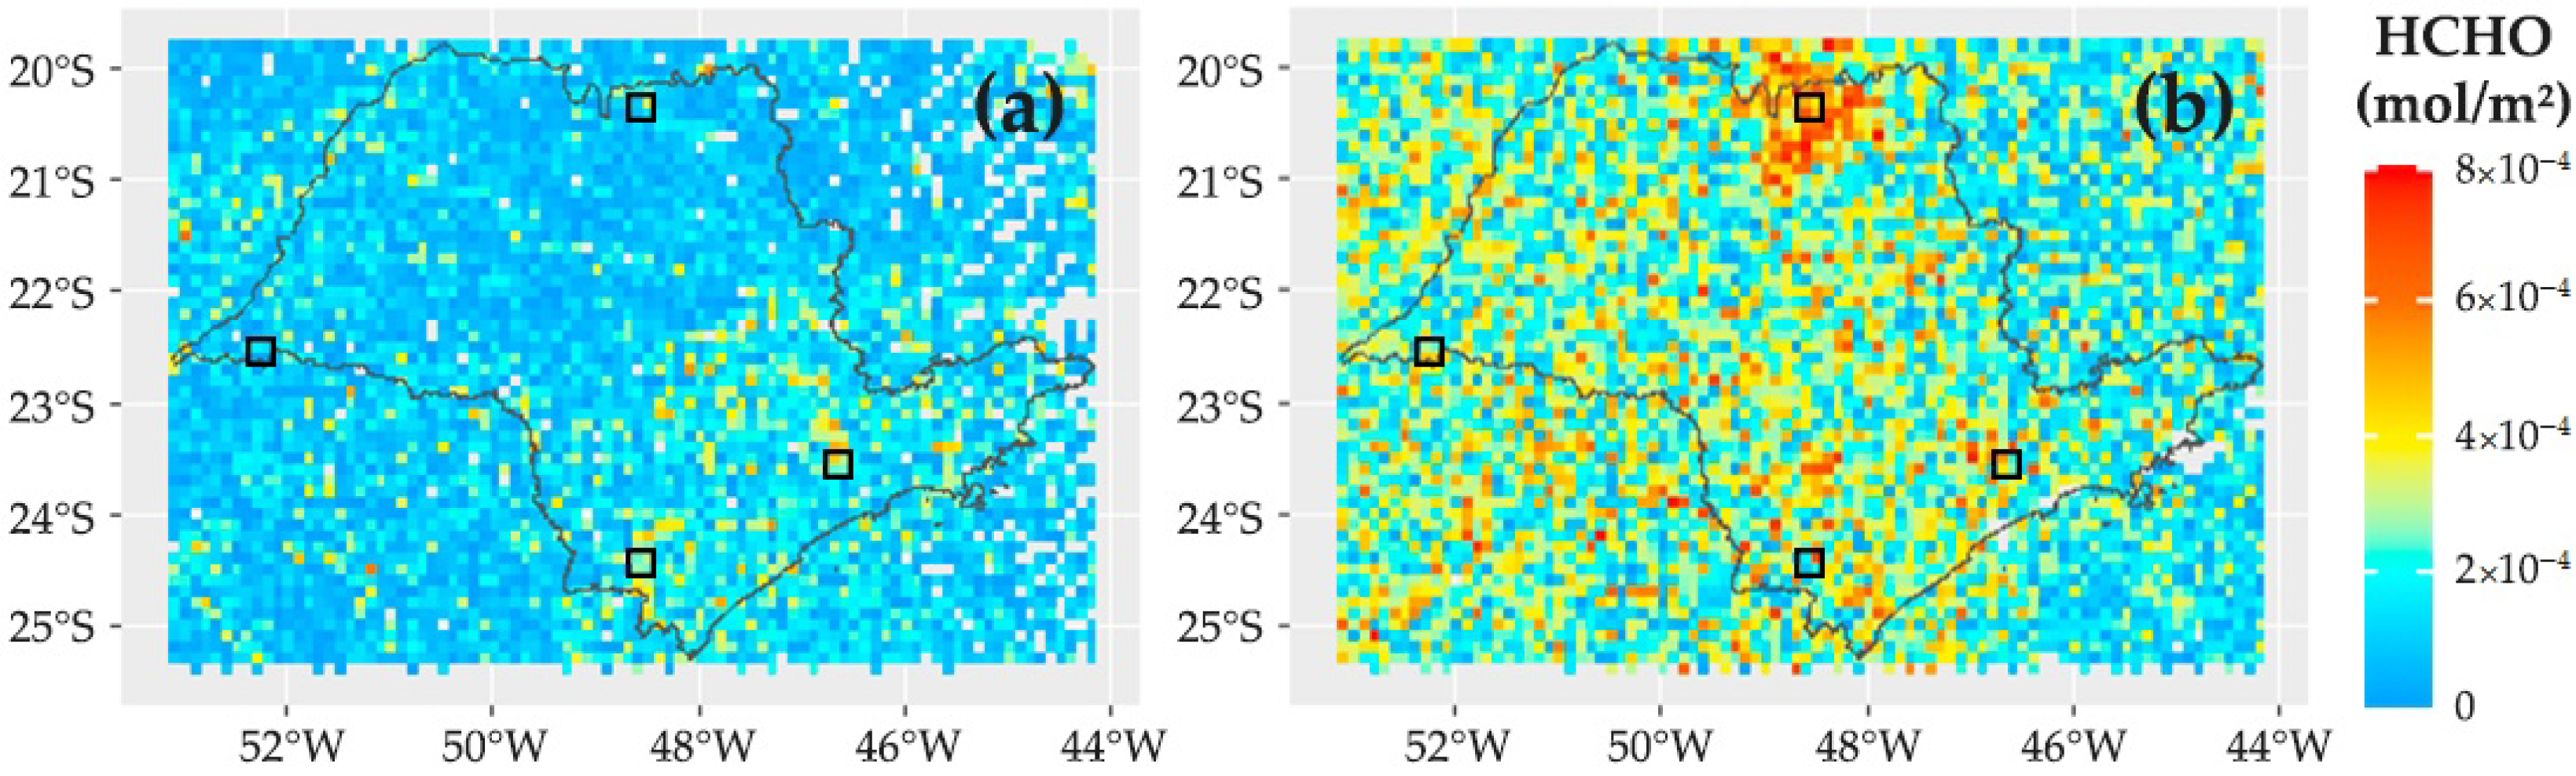
Over each area of interest, small regions of 0.1° latitude by 0.1° longitude—about km²—were defined, in order to select a group of, on average, four vertical columns of formaldehyde per region. We chose to call these regions “analysis windows”, as more in-depth analyses of each area of interest will be carried out with the columns monitored within each of these regions. Three analysis windows were defined on the PEMD: three on the PETAR, three on the NERG and ten on the MASP, eight of which were used to represent the urban sprawl of the megacity and two were used to represent a third area with remnants of the Atlantic Forest at the Morro Grande Reserve (Figure 3). This reserve is located southwest of the urban area, near the city of Cotia and covers an area of 108.7 km², and its vegetation presents mostly dense ombrophylous forest characteristics [61,62].
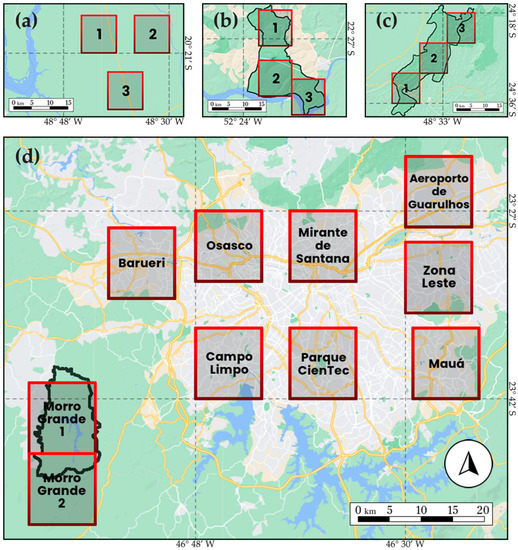
Figure 3.
Geographic positioning of the three analysis windows on the NERG (a), three on the PEMD (b), three on the PETAR (c) and ten on the MASP (d). Analysis windows are regions that select HCHO columns for more in-depth analyses.
2.3. Meteorological Parameters and Auxiliary Data
Auxiliary data were used to associate the observed formaldehyde densities with the main variables capable of controlling its formation and removal processes in the atmosphere. Hourly meteorological data (temperature, atmospheric pressure and precipitation) were provided by the Brazilian National Institute of Meteorology (INMET) and the monthly number of wildfires was provided by the Queimadas Program, which was developed by the Brazilian National Institute for Space Research (INPE). In the present study, the seasons were defined in relation to the southern hemisphere as follows: summer from December to February; autumn from March to May; winter from June to August; and spring from September to November.
2.4. Estimate of HCHO Surface Concentration
Satellite-recorded formaldehyde concentrations take into account the entire atmospheric column from the ground to the sensor—which, in the case of TROPOMI, is at an altitude of 824 km. However, HCHO is a short-lived constituent that remains below the planetary boundary layer (up to 3 km), with higher concentrations near the surface [26,28]. In order to make it possible to compare the concentrations monitored by TROPOMI and those monitored by surface stations, presented by other works [37,63,64,65], a methodology was proposed to estimate the surface formaldehyde concentration in the MASP, converting the data in mol/m² to ppbv.
A study carried out by Piñero Sánchez et al. [66] used radiosondes to estimate the monthly average heights of the planetary boundary layer (PBL) in the Metropolitan Area of São Paulo. Measurements were performed once a day, at 9 p.m. local time, for four years, from September 2009 to August 2013. Monthly averages ranged from 1061 m in September to 1632 m in May. Considering the average heights for each month, the proposed methodology considers that all formaldehyde registered in an atmospheric column is homogeneously distributed below the PBL. In this manner, the concentration per unit area (mol/m²) can be converted to a concentration (Ci) of per unit volume (mol/m³). Using the ideal gas law, it was possible to find the total molar concentration of air (Ctotal) and, dividing one concentration by the other (Ci/Ctotal), the mixing ratio of formaldehyde inside the PBL is determined. The air temperature and atmospheric pressure data entered in the ideal gas law were obtained locally at INMET meteorological stations.
3. Results
3.1. Annual and Seasonal Statistics
For each analysis window, the number of days with valid columns retrieved in the year, the annual mean concentration of formaldehyde and the standard deviation of the concentrations were calculated. On average, the data covered 193 days of the year, with a total of 3677 validated daily average columns distributed over the 19 analysis windows. To study the statistical similarity among the windows, analysis of variance (one-way ANOVA and confidence interval = 95%) and Tukey’s test (for pairwise comparisons) were applied (Table 1).

Table 1.
Number of days with valid data, annual arithmetic mean and standard deviation of HCHO columns (12 p.m.–4 p.m. local time, from January to December 2020) and Tukey’s test results for each analysis window. Windows with the same letter in the Tukey’s test result presented statistically equal mean HCHO concentrations.
Observing the annual means of the columns, it can be seen that the concentration of formaldehyde in the MASP windows is higher than those calculated for all other areas of interest, exceeding −4 mol/m² in seven of the ten analysis windows. The three windows below this mark were the furthest away from the densely urbanized area: Aeroporto de Guarulhos, which still presented a concentration very close to those registered in the other windows; and Morro Grande 1 and 2, delimited over the Atlantic Forest reserve, with −4 mol/m² and −4 mol/m², concentrations that are closer to those recorded for the three other areas of interest than for MASP. It is also noted that the windows of the Morro Grande reserve showed greater statistical similarity with all the windows outside MASP (with all the locations that received the letters B, C, D, E or F) than with three inside the same (Zona Leste, Campo Limpo and Mirante de Santana, which received the letter A). Thus, despite its proximity to the urban area, the reserve suffered little influence from anthropogenic emissions from the Metropolitan Area of São Paulo, showing greater statistical similarity with PEMD, PETAR and NERG. It can also be observed that these three areas of interest showed no significant difference between them (all received the letter F), indicating that the annual mean concentrations of all of them are statistically equal.
In addition to the annual assessment of the HCHO columns, a seasonal assessment was carried out in order to find which seasons of the year had the highest and lowest mean concentrations in each analysis window (Table 2).
Table 2.
Mean of the HCHO columns (12 p.m.–4 p.m. local time) for each season of 2020. The number of days with data is shown in parentheses, and the maximum (yellow) and minimum (green) mean values are highlighted for each analysis window.
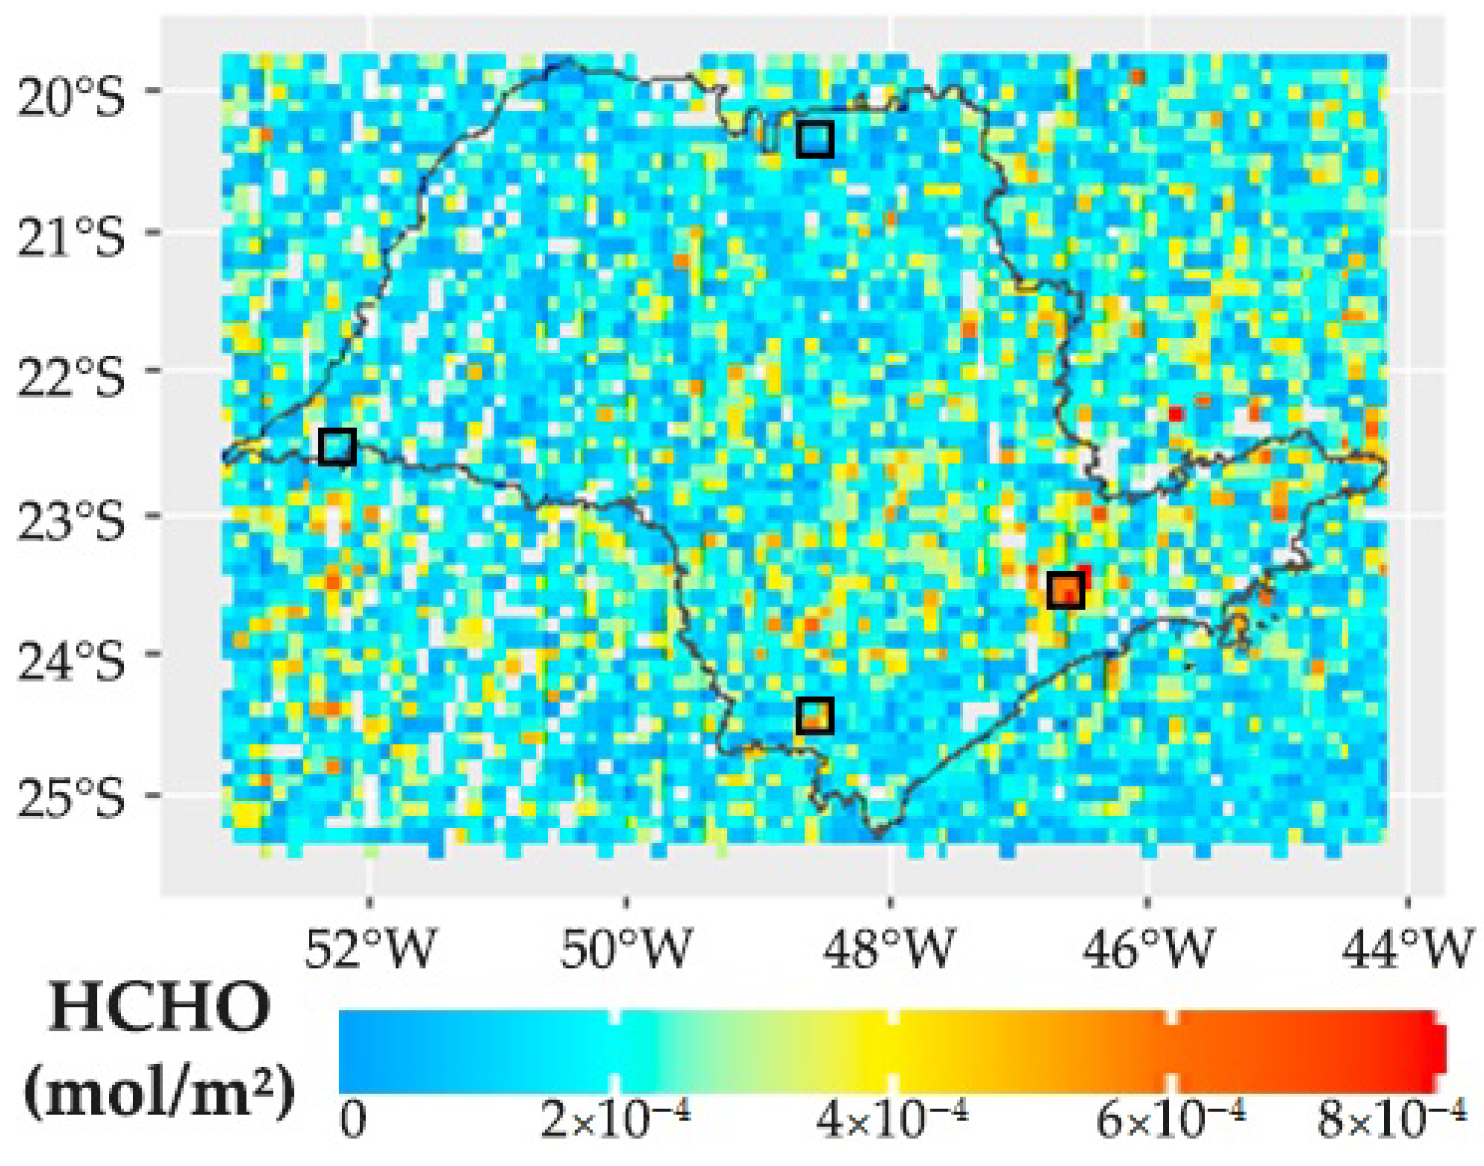
It is observed that the lowest seasonal averages occur mostly in summer (wet season) for almost all analysis windows, except for Mirante de Santana, Parque CienTec, Mauá and Morro Grande 2, with minimums in autumn. On the other hand, the highest seasonal averages were between winter and spring (dry season) throughout the state, but with a predominance in spring over the MASP (except for Campo Limpo, Zona Leste and Morro Grande 2). This high seasonality is even more visual when analyzing Figure 4, with HCHO columns retrieved on 26 January (wet season) and 13 September (dry season) plotted on the São Paulo State map.
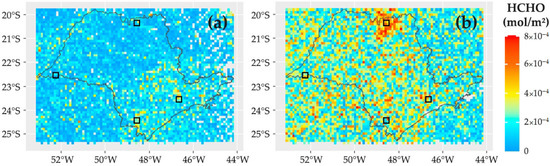
Figure 4.
Satellite HCHO data (12 p.m.–4 p.m. local time) in São Paulo State: (a) 26 January 2020 (summer) and (b) 13 September 2020 (winter-spring). The black squares indicate the locations of the four areas of interest shown in Figure 2.
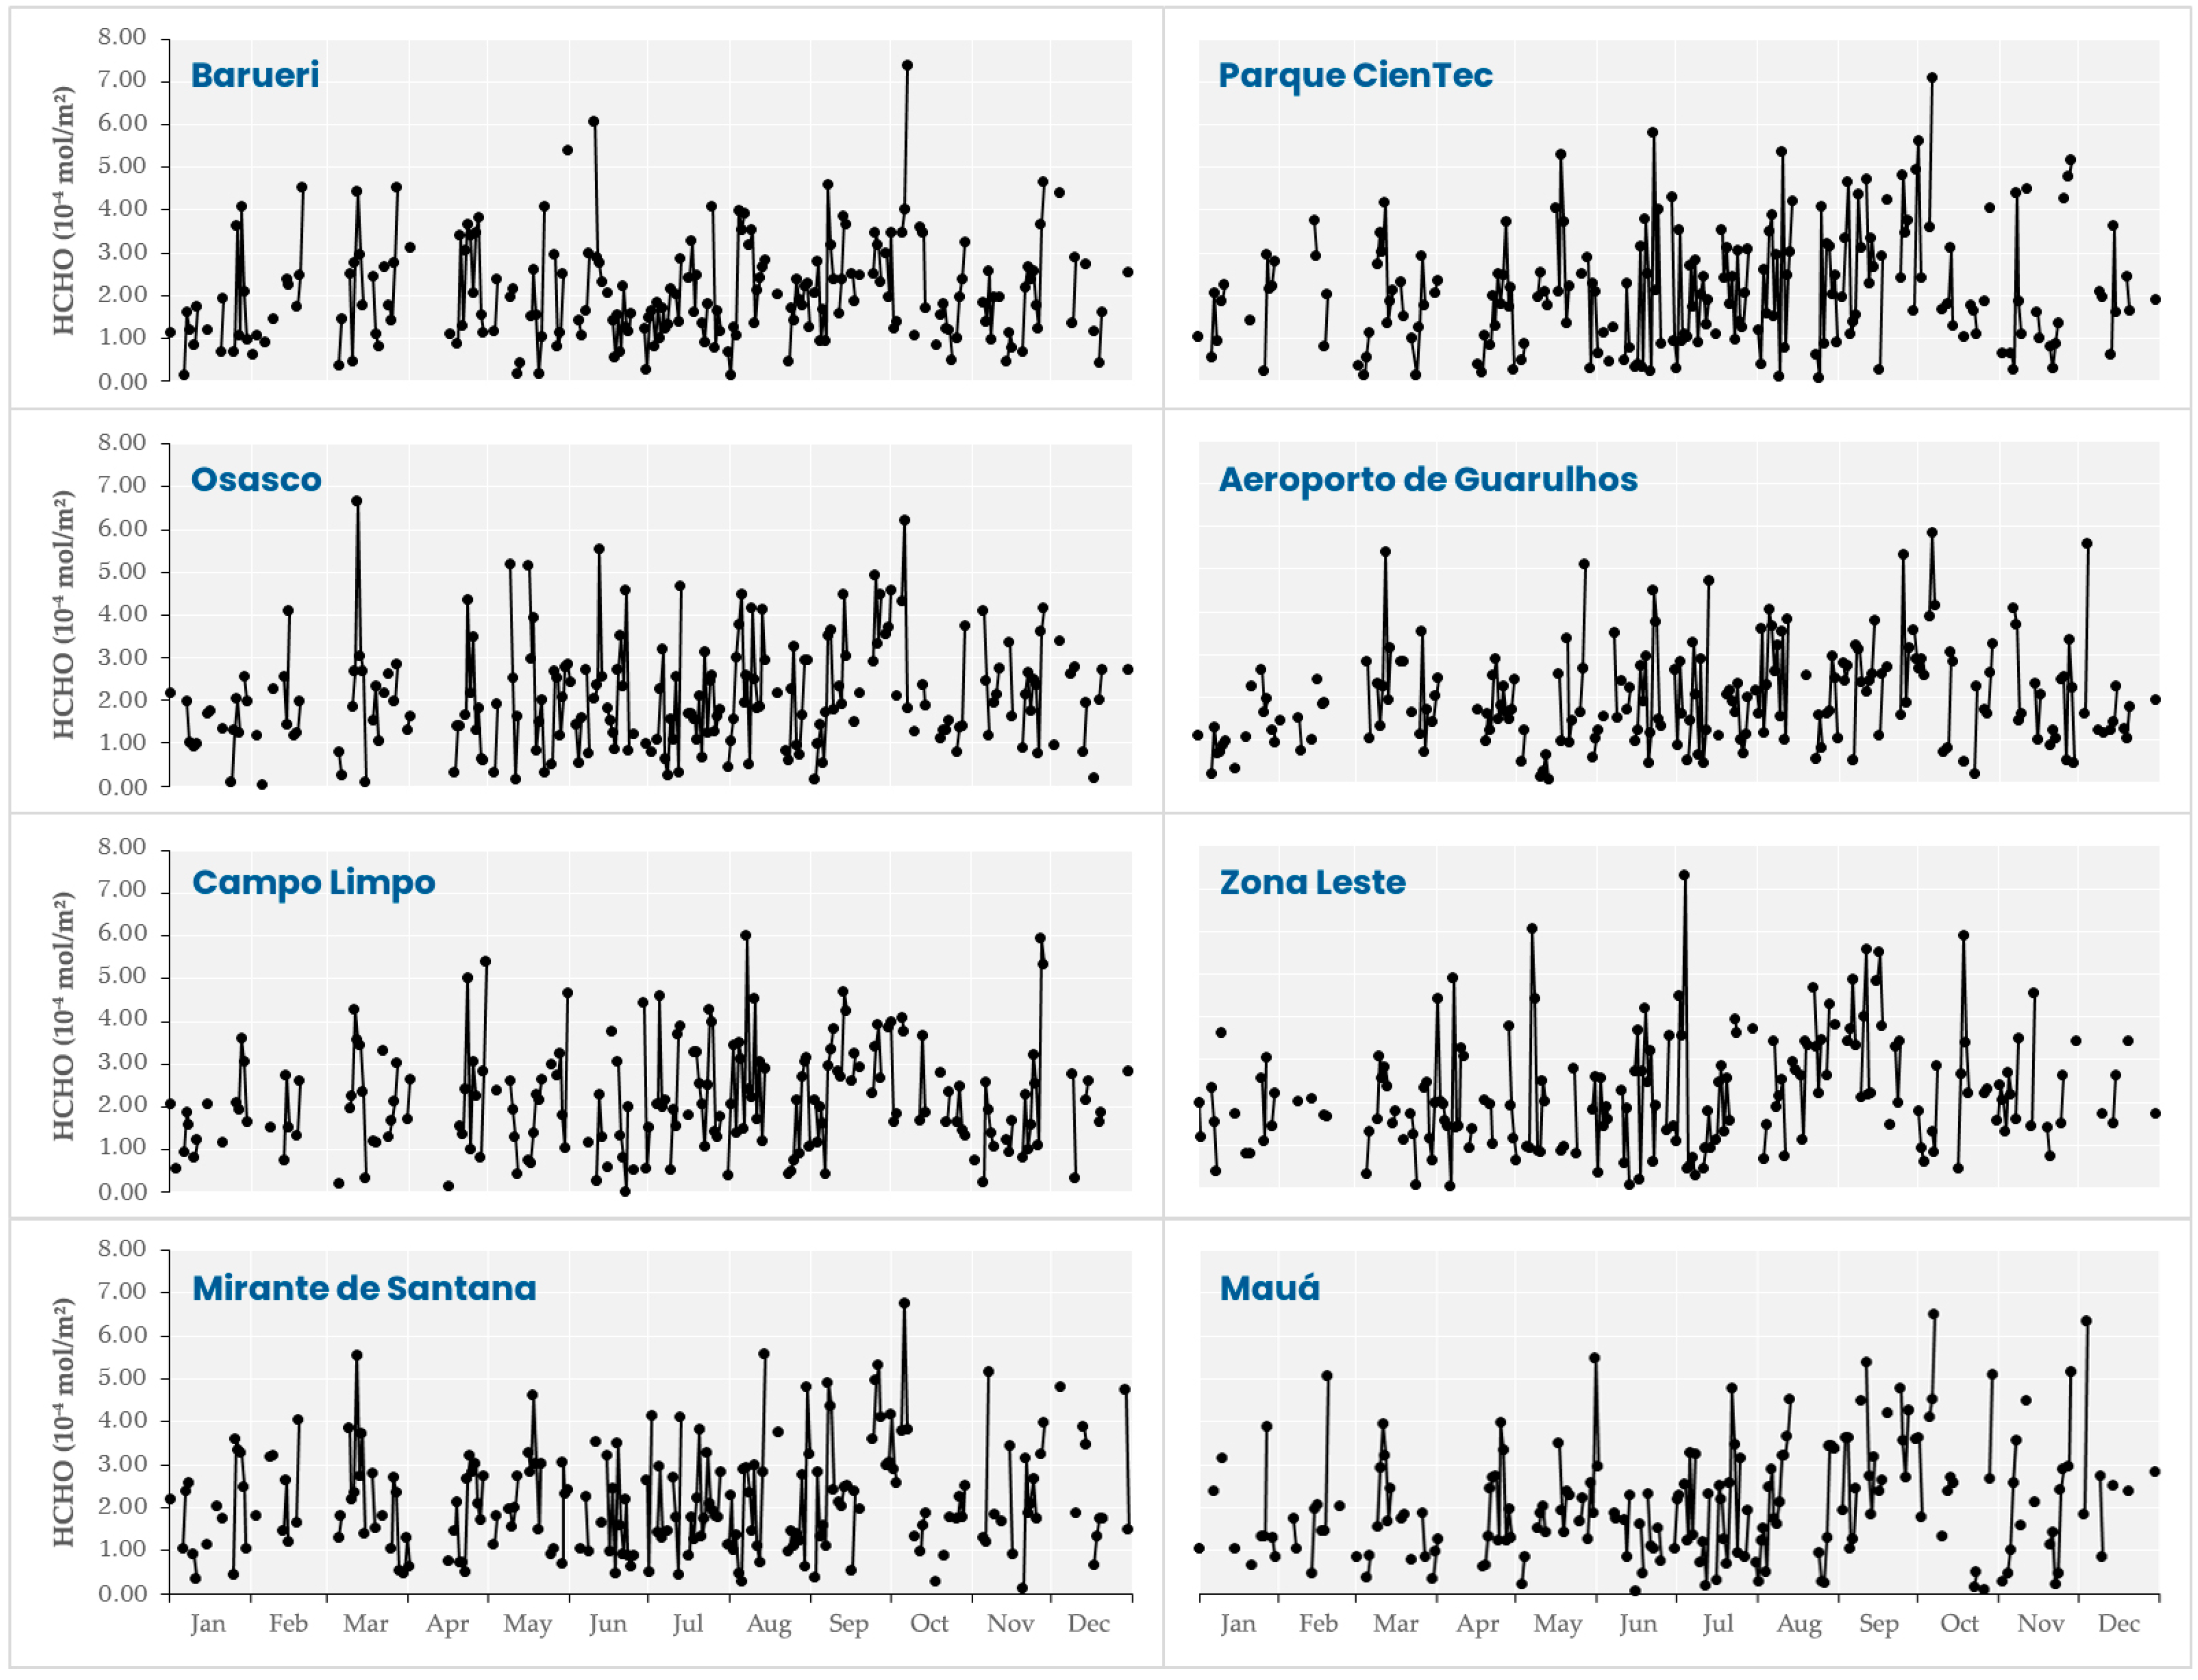
With the eight analysis windows on the densely urbanized region of the MASP, graphs were produced with the daily variation of HCHO concentrations throughout 2020 (Figure 5).

Figure 5.
Daily HCHO mean columns (12 p.m.–4 p.m. local time) located in the MASP analysis windows throughout 2020.
It is noted that the summer months presented low concentrations and smaller variance between maximums and minimums, while the situation is opposite in the winter months, with high concentrations and greater dispersion between very concentrated days and less concentrated days. It is also possible to observe that the months of September and October presented the most concentrated HCHO columns, which may be related to the plume of pollution from the fires that occurred in the Brazilian Pantanal in these same months of 2020 [67,68,69]. Some episodes of high concentration can be observed, such as those that occurred on 12 March and 6 October. They repeated this in different analysis windows, which highlights the high spatial extent of these episodes. With the daily data from the other areas of interest, it was observed that other days also showed high concentrations of HCHO, such as 28 September for the PEMD and 13 September for the NERG. To study these episodes in more detail, four case studies were conducted.
3.2. Case Studies
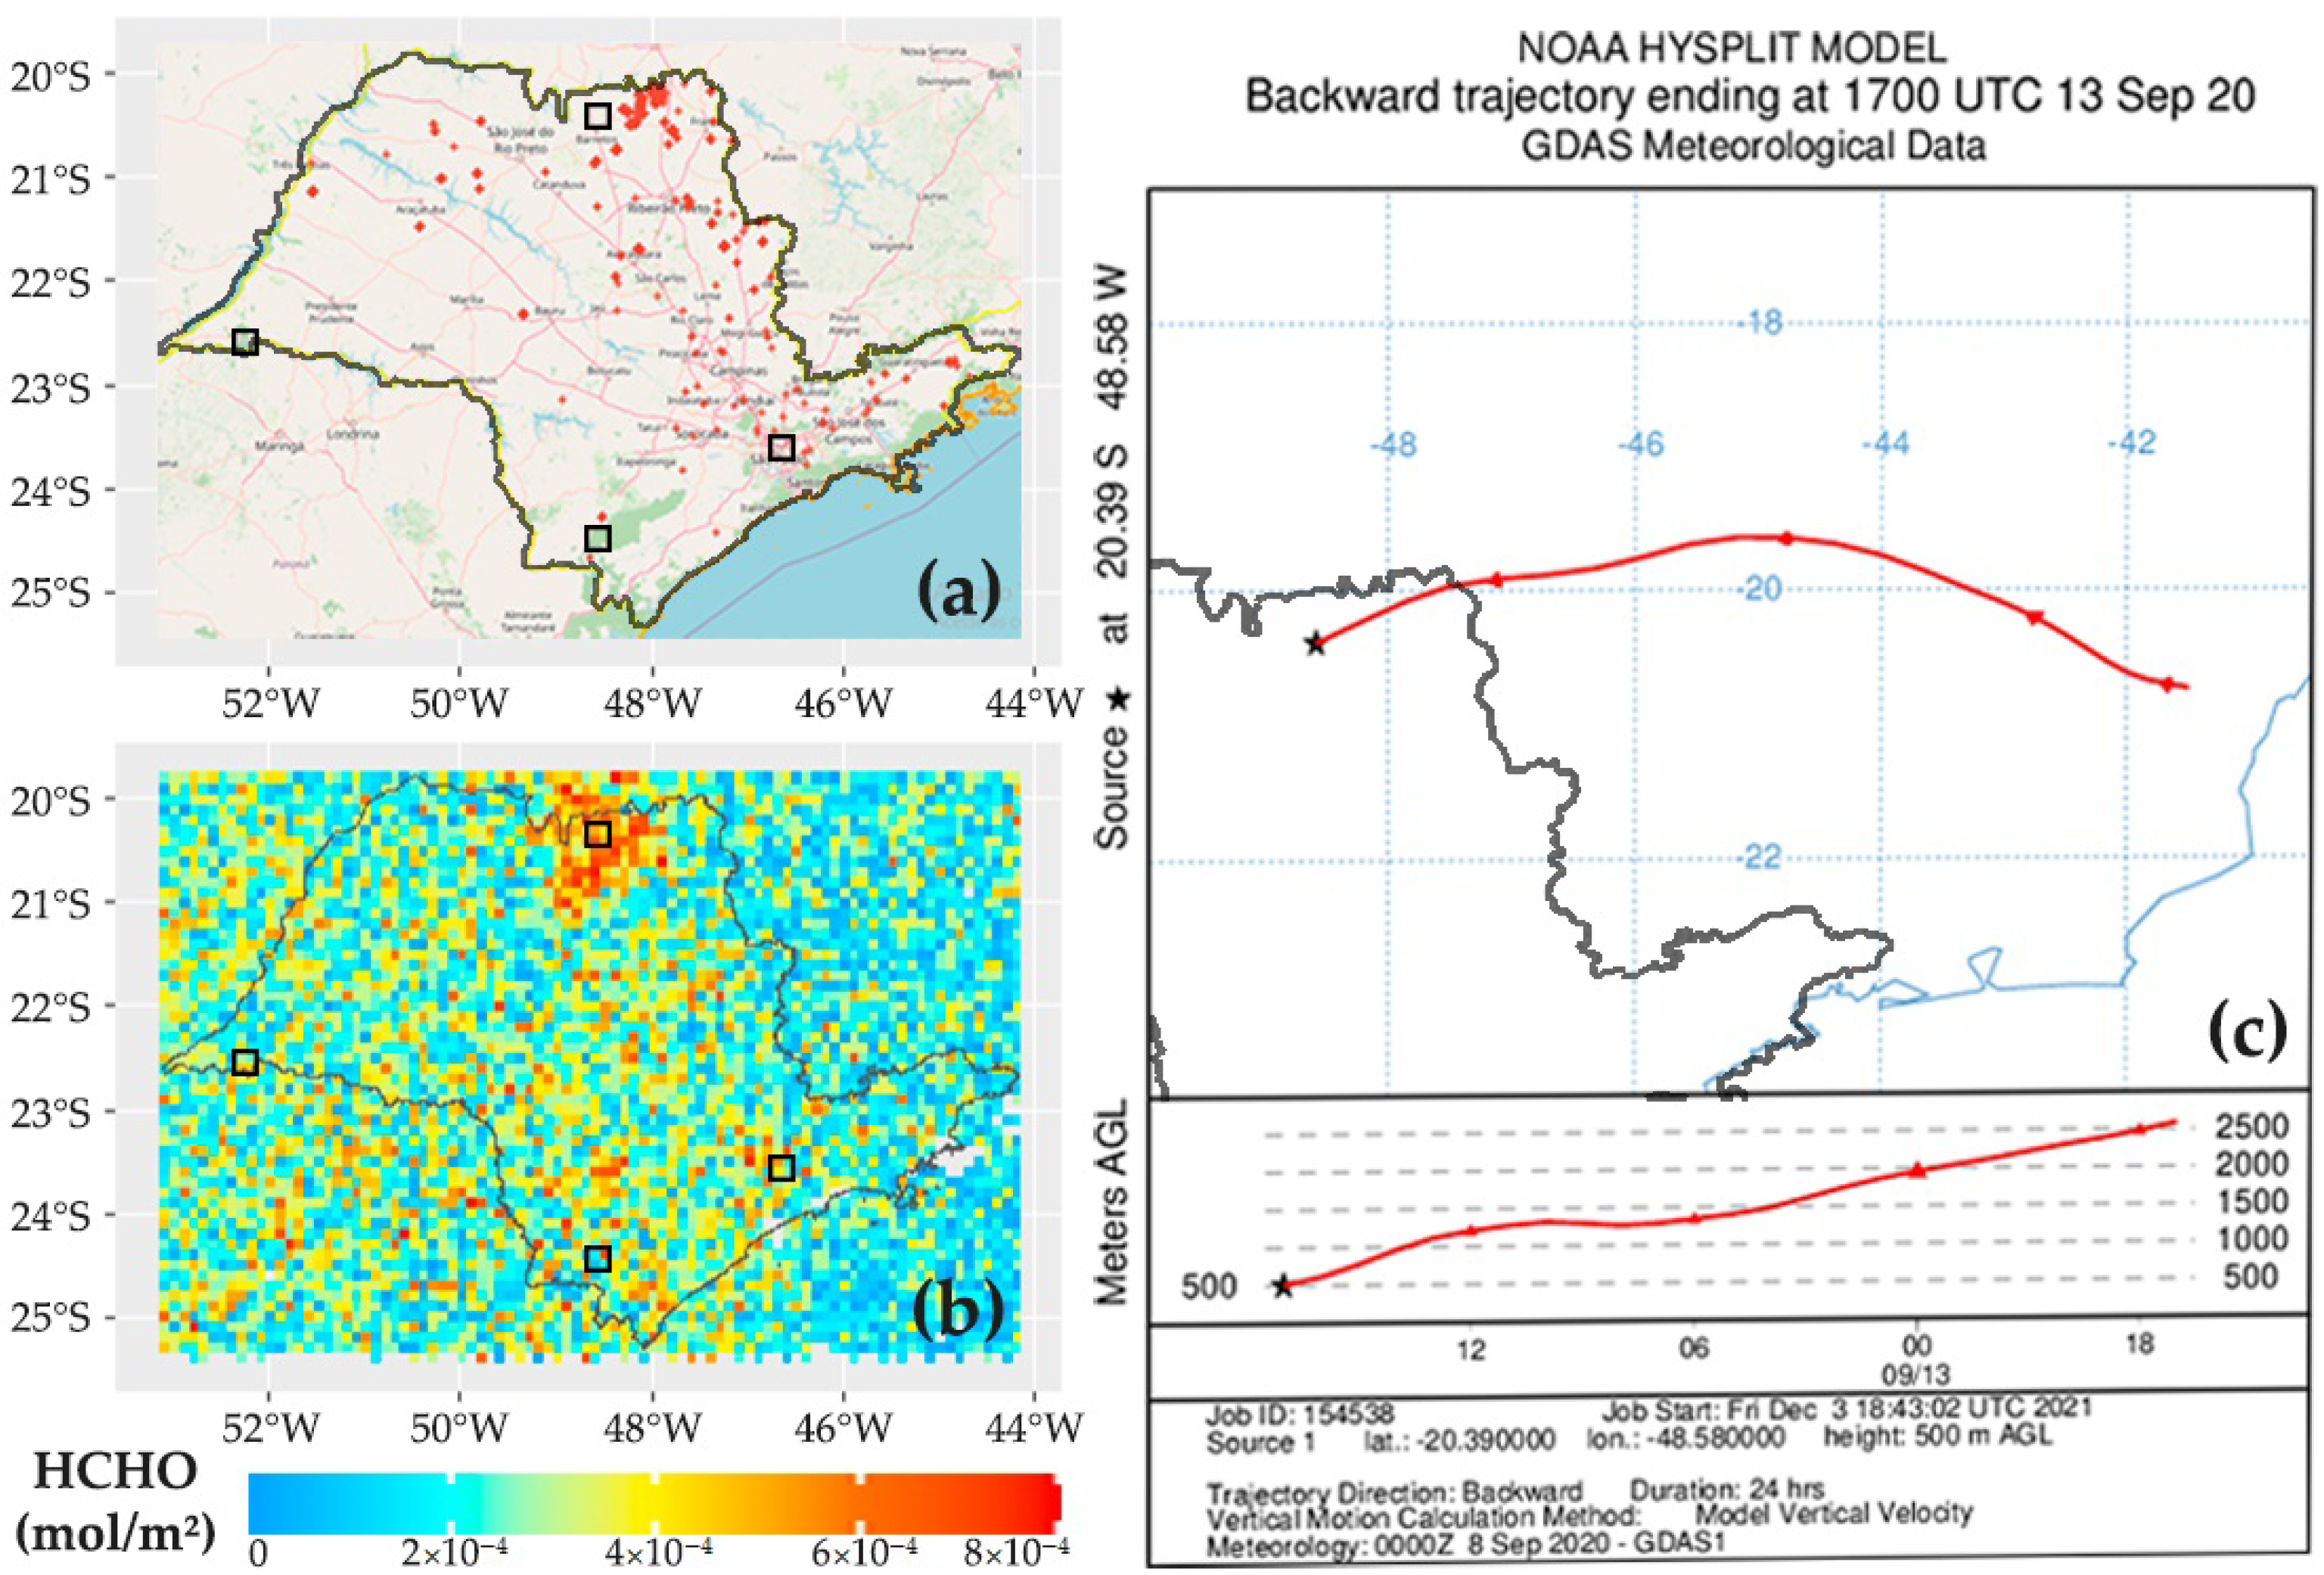
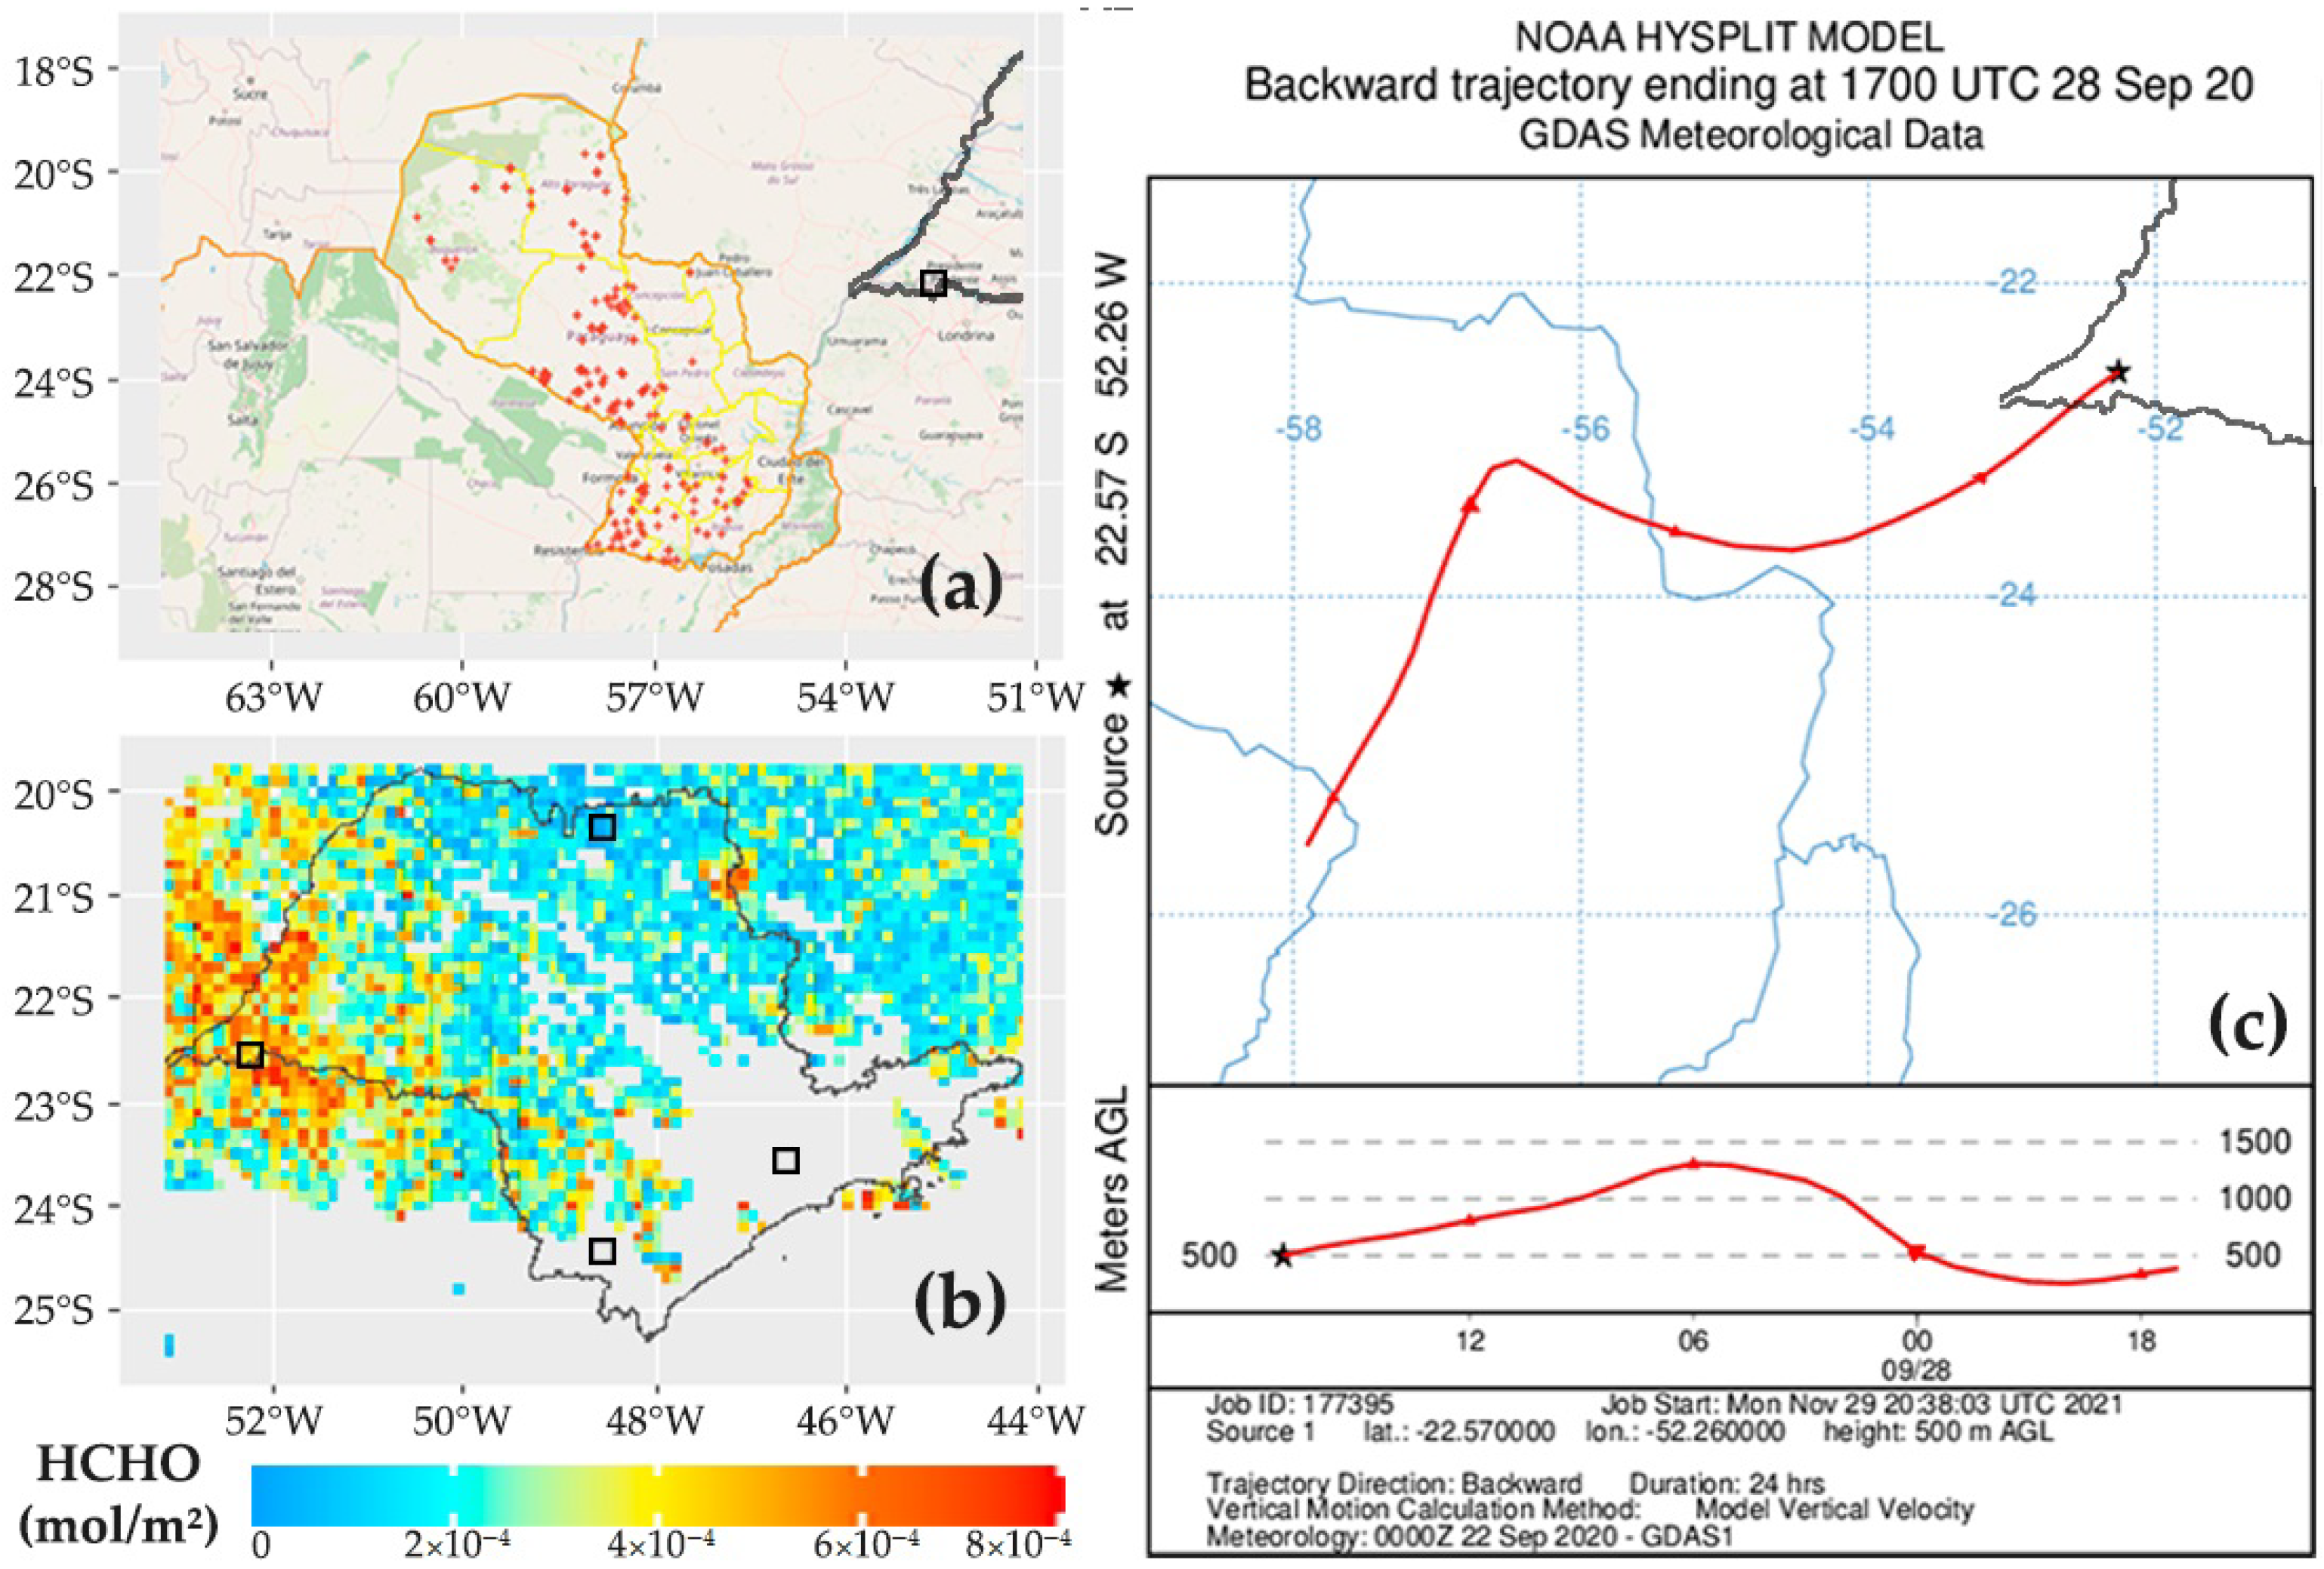
The episode of high concentration of HCHO over NERG, on 13 September, was marked by many fire outbreaks in the region, indicating that the peak of formaldehyde identified by TROPOMI had, mainly, pyrogenic sources (Figure 6).
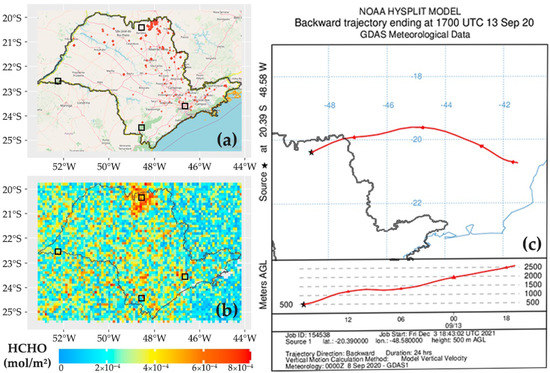
Figure 6.
Data for 13 September from (a) INPE’S Queimadas Program, where the red dots represent fire outbreaks; (b) TROPOMI’s vertical columns of formaldehyde (12 p.m.–4 p.m. local time); and (c) HYSPLIT’s backtrajectory of air masses to the NERG area. The black squares indicate the locations of the four areas of interest showed in Figure 2.
Data from INPE’s Queimadas Program indicated several fires that occurred northeast of the NERG on this day, in rural areas near the municipalities of Igarapava and Miguelópolis, in the state of São Paulo, and Uberaba, in the state of Minas Gerais. Using NOAA’s HYSPLIT (Hybrid Single-Particle Lagrangian Integrated Trajectory) model, the backtrajectory of air masses was performed to the NERG area at a height of 500 m at 5 p.m. UTC on 13 September. Figure 6 shows that the air masses arrived from the northeast on this day, which may have brought pollutants from the fires that occurred nearby.
On 28 September, in the episode over the PEMD, the most likely cause was also pyrogenic emission but from fires in the Pantanal and in the Paraguayan Chaco region [68,70]. In Figure 7, it was observed that the HCHO columns with high density are not only over the PEMD but also over the entire west of the state of São Paulo. In this manner, the high concentrations recorded over the park on that day did not come from its vegetation, but came loaded from another location. To confirm this hypothesis, the 24 h backtrajectory of the air masses was again carried out using the HYSPLIT model. It can be seen that the air masses that arrived at PEMD at 5 p.m. UTC—and, therefore, within the time window of the TROPOMI passage—came from the southwest, passing through Paraguay. Moreover, according to the Queimadas Program, there were many active fires in this country on 28 September, indicating that the VOCs emitted by the burnings after being oxidized in the atmosphere may have caused the increase in formaldehyde column densities in the west of São Paulo State.
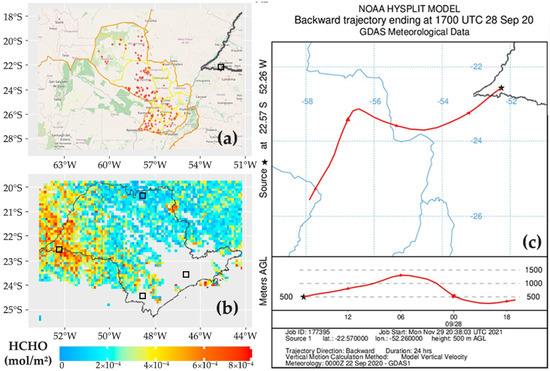
Figure 7.
Data for 28 September from (a) INPE’S Queimadas Program over Paraguay; (b) TROPOMI’s vertical columns of formaldehyde (12 p.m.–4 p.m. local time); and (c) HYSPLIT’s backtrajectory of air masses to the PEMD area. The black squares indicate the locations of the four areas of interest showed in Figure 2.
The third episode occurred on 12 March over MASP (Figure 8). The CETESB Air Quality Report [38] explains that, during this period, the state of São Paulo was under the action of a high pressure system (anticyclone), which prevented the entry of cold fronts, with high temperatures and high incidence of solar radiation. Associated with this, 2020 had the driest month of March in the last 36 years [38]. These conditions, combined, favored the secondary production of formaldehyde and, consequently, also of tropospheric ozone, with several exceedances of the established air quality standard. The 8 h average of hourly ozone concentrations reached values above 168 µg/m3 on this day, with the standard being 140 µg/m3. During the spring of 2020, there were 33 days with exceedances of the standard, while there were four exceedances during the summer, during the autumn there were 14 (9 being in March) and only one during the winter [38].
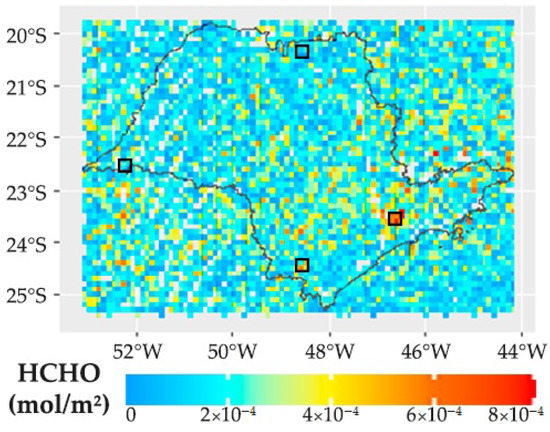
Figure 8.
Vertical HCHO columns (12 p.m.–4 p.m. local time) over São Paulo State on 12 March. The black squares indicate the locations of the four areas of interest shown in Figure 2.
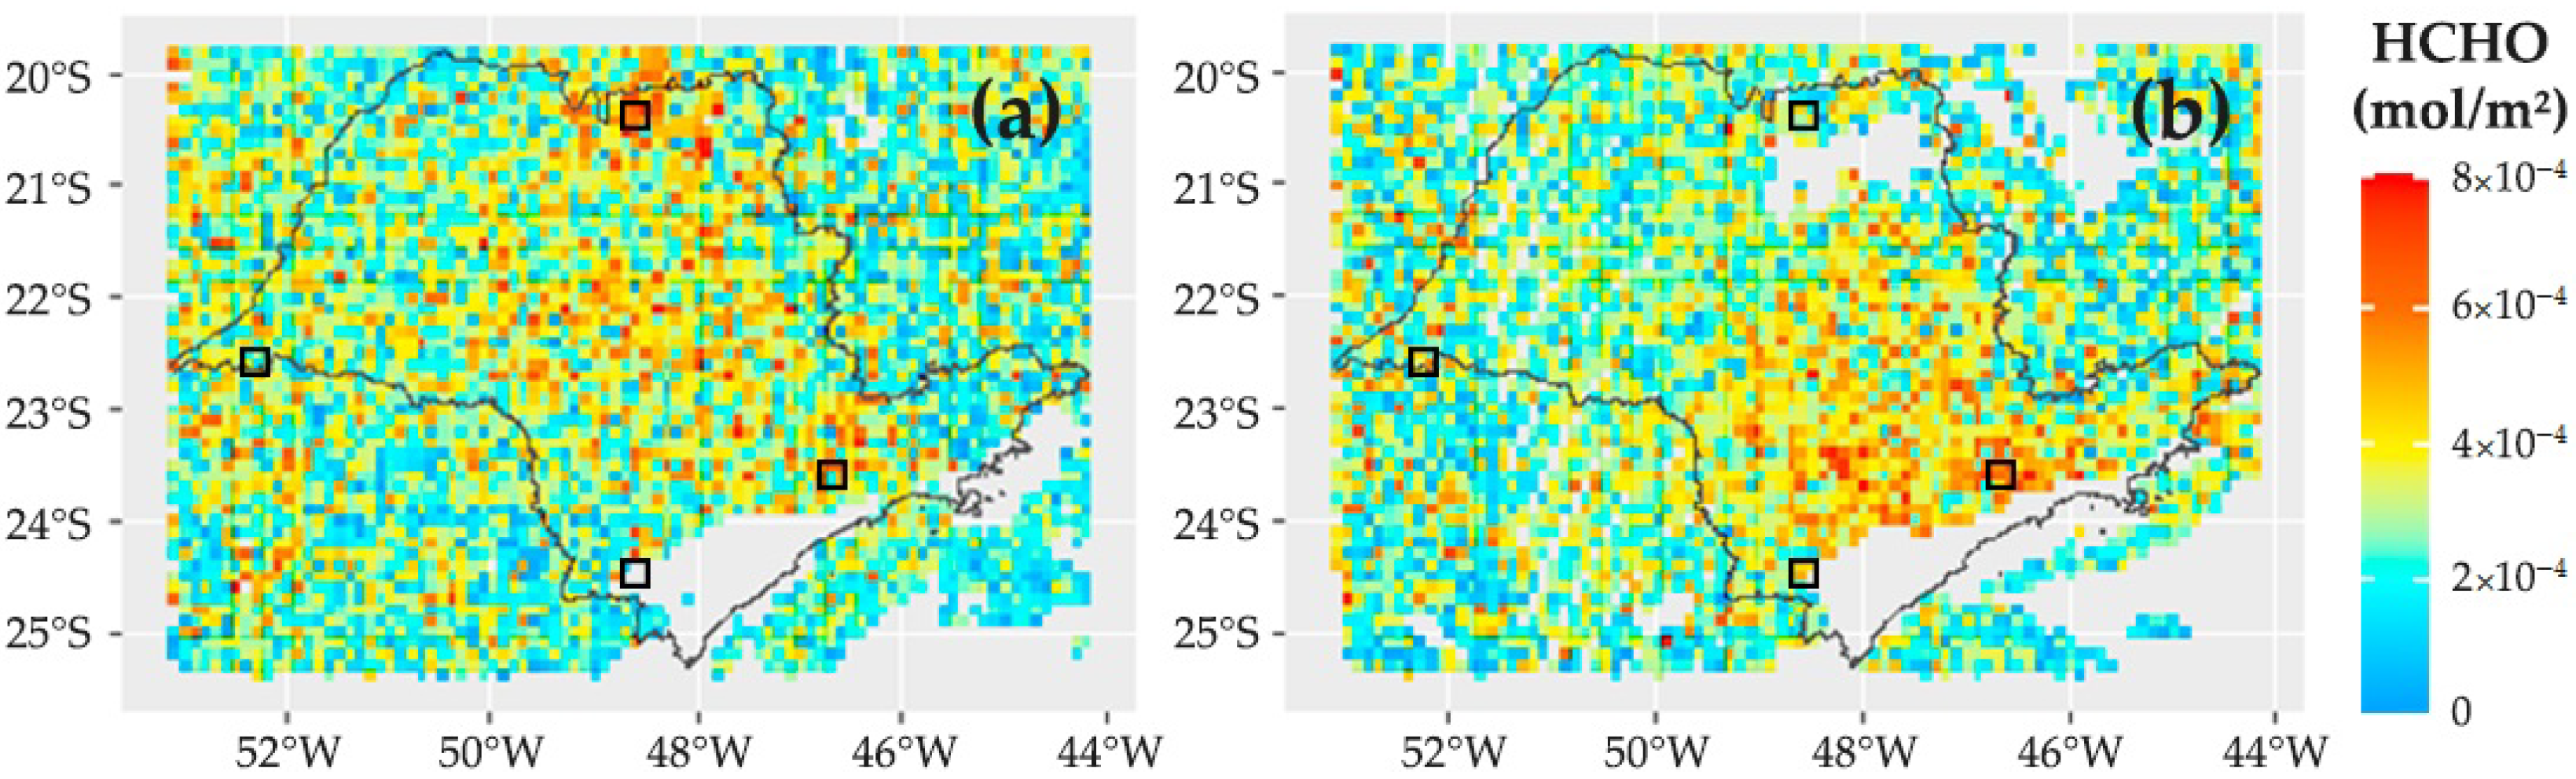
Finally, the last episode included two days of high densities in the MASP: 5 and 6 October. This episode caused the highest mean column in more than a half of the analysis windows in this area of interest—Barueri, Mirante de Santana, Parque CienTec, Aeroporto de Guarulhos, Mauá and Morro Grande 1—which shows its great spatial and temporal amplitude (Figure 9).

Figure 9.
Vertical HCHO columns (12 p.m.–4 p.m. local time) over São Paulo State on (a) 5 October and (b) 6 October. The black squares indicate the locations of the four areas of interest showed in Figure 2.
The maps with HCHO columns for these days reveal high concentrations over the entire state, demonstrating the influence of meteorology and, possibly, also of the fires that occurred in the Pantanal, but with more concentrated spots over the metropolitan region, indicating that there was, in addition to favorable weather conditions, also strong anthropogenic emissions. The 5th and 6th of October, and also the 12th of March, were weekdays, with more intense traffic in the city and greater anthropogenic emissions of HCHO precursors by mobile sources.
4. Discussion
The results shown in Table 1 were compared with those found in studies conducted in urban and forest areas in other countries. Mean values were reported in molecules/cm², but they are presented here in mol/m². Using the average of the vertical columns of HCHO recorded between 2006 and 2015 by the OMI instrument onboard NASA’s Aura satellite, Wang et al. [71] found concentrations close to −4 mol/m² in the southeastern United States, especially in regions near the Ozark Mountains, characterized by the dense cover of oak forests and high temperatures. High isoprene emission rates, associated with anthropogenic emissions related to oil and gas extraction, were identified as possible causes of the retrieved HCHO densities.
Moreover, using OMI data, Zhang et al. [48] studied formaldehyde columns over the Amazon, which is the largest rainforest in the world. It is the greatest emitter of biogenic VOCs, especially isoprene, but it has also been an important source of pyrogenic pollutants, particularly in a region called “Arc of Deforestation” [16]. Data from January 2005 to December 2010 were used, and the results were separated into two groups: one only with days in which there were no fires and the other with all days sampled. Disregarding the days when there were fires, the average density of the HCHO columns was around −4 mol/m², while considering the entire period, this density rises to more than −4 mol/m².
Finally, using data from three satellite instruments, SCIAMACHY (Envisat), OMI (Aura) and GOME-2 (MetOp-A), Shen et al. [11] studied HCHO densities over China. The highest concentrations of HCHO were identified between the months of May and September; thus, the work focused on these months. The columns retrieved by satellites followed the distribution pattern of anthropogenic production due to the dense urbanization and intense industrial activity in the regions of the megacities Beijing, Shanghai, Wuhan and Hong Kong, in which the columns approach a concentration equal to −4 mol/m². Biogenic production also plays an important role in Southern China, and it is the main source in some regions.
Forest or agricultural areas in São Paulo State (PEMD, PETAR, NERG and Morro Grande) showed concentrations close to those recorded in the southeastern United States [71] and in the Amazon on days without records of fire outbreaks [48]. On the other hand, the densities registered in the most densely urbanized area of the MASP were below those measured in Chinese megacities, probably due to the difference in the typology of sources: predominance of industrial sources in China and mobile sources in São Paulo.
The results shown in Table 2 are in accordance with a study by Nogueira et al. [37], which used surface formaldehyde measurements, from 2012 to 2016 in the Metropolitan Area of São Paulo, and found smaller average concentrations during the autumn ( ppbv) and higher during the winter ( ppbv). It is important to note that surface measurements perform sampling during 24-hour periods, while satellite measurements sample a single moment of the day in the time window between 12 p.m. and 4 p.m. local time. In order to enable the quantitative comparison between the results, the smallest (−4 mol/m²) and the highest (−4 mol/m²) values for MASP in Table 2 were taken, disregarding the reserve of Morro Grande, and the conversion was made to ppbv, finding the values ppbv and ppbv, respectively. Thus, satellite data presented high reliability after the proposed conversion, with results that achieve the same order of magnitude as surface measurements.
Formaldehyde can cause adverse effects on human health at mixing ratios greater than 0.1 ppm, such as eye, nose, throat and skin irritation; effects on the nervous system and lung function; and headache and some types of cancer [13,72]. In São Paulo State, external HCHO concentrations rarely exceed 0.025 ppm [36]. Nevertheless, monitoring HCHO in outdoor environments remains necessary to identify episodes of peaks in its concentrations; estimate biogenic, anthropogenic and pyrogenic VOC emissions; and monitor the adverse environmental effects that can be caused by this constituent [30].
Another study, carried out with data measured on the surface in 2002 by Pinto and Solci [65] in Londrina, a city in southern Brazil, found the same seasonal pattern of concentrations, with ppbv during summer and ppbv during winter. With an interval of 18 years between this study and the present work, the main difference lies in the technological advance applied to the automotive industry, since PROCONVE was in the L3 and P4 phases in 2002, with a higher limit for the emission of aldehydes and hydrocarbons, and the commercialization of flex-fuel vehicles (designed to be fuelued with gasohol, ethanol or any blend of the two) had not yet started in Brazil, which began in 2003 [73].
Observing Figure 9, a gap in the data can be observed in the first half of April, corresponding to the corrupted files that could not be read by the processing software. The year 2020 was marked by the COVID-19 pandemic; however, the low number of data for April should not be confused with the effects of the reduction in emissions caused by social isolation and restrictions on mobility. In the state of São Paulo, although the population initially adhered to the recommendations of limiting circulation in public spaces (with a reduction of 75 to 80%), overtime, this adherence decreased, causing a partial lockdown, with low impact on emissions of atmospheric pollutants [74]. The changes observed in the HCHO columns between 2019 and 2020 in southeastern Brazil were caused by weather conditions (lower air temperature) and they were not influenced by the pandemic [75]. In addition, pollutants with standards established by Brazilian legislation, such as tropospheric ozone, did not show a substantial reduction in their concentrations when comparing the years 2019 and 2020 [76].
5. Conclusions
Vertical formaldehyde columns, monitored remotely by the TROPOMI spectrometer, were used to study atmospheric chemistry conditions in four areas of interest in São Paulo State throughout 2020, covering urban and forest regions. This was the first work to study the atmospheric concentrations of HCHO in the state of São Paulo through satellite observations.
The summer and autumn months had the lowest mean concentrations of formaldehyde (minimum = −4 mol/m²), while the winter and spring months had the highest ones (maximum = −4 mol/m²). This was due to the precipitation regimes, temperature, photochemical activity of the atmosphere and seasonality of fires in the state and nearby. Such results agree with studies carried out with surface measurements, including with respect to the magnitude of concentrations, after carrying out the conversion of units proposed in the methodology of this work.
By performing statistical procedures such as analysis of variance and Tukey’s test, it was found that the analysis windows located on the densely urbanized area (MASP) differed from the windows selected on the other areas of interest, which showed no significant difference between them. The analysis windows on the Morro Grande reserve, despite its proximity to the MASP, had HCHO columns significantly less concentrated than those identified on the urban area, which were more similar to the other forest areas, with preserved Atlantic Forest and a predominance of secondary formaldehyde from the oxidation of isoprene.
September and October, the months that presented the most concentrated formaldehyde columns, seemed to be related to the driest period of the year and to the high number of fires registered by the INPE monitoring, especially in the north of the state. In addition, most of the highly concentrated columns in the MASP occurred during weekdays, with greater vehicle circulation and, therefore, higher emissions from fuel burning, mainly including ethanol and gasohol.
Comparison with other studies that also used satellite-monitored HCHO columns showed that the densities observed in forest areas in the state of São Paulo presented magnitudes close to those recorded in the Amazon for days without fire and that those observed in the urban areas of the MASP were below those identified in other megacities, possibly due to the reduction in the emission of HCHO and hydrocarbons from mobile sources promoted over the last few years by the PROCONVE program.
Author Contributions
Conceptualization, A.D.F. and A.F.; methodology, A.D.F. and A.F.; software, A.D.F.; formal analysis, A.D.F.; investigation, A.D.F.; resources, A.D.F.; writing—original draft preparation, A.D.F.; writing—review and editing, A.D.F. and A.F.; visualization, A.D.F. and A.F.; supervision, A.F.; project administration, A.F.; funding acquisition, A.F. All authors have read and agreed to the published version of the manuscript.
Funding
This study was financed by the CAPES-PROEX Graduate Program in Meteorology at the University of São Paulo, the Conselho Nacional de Desenvolvimento Científico e Tecnológico (CNPq) and the Fundação de Amparo à Pesquisa do Estado de São Paulo (FAPESP, Grant No. 2020/07141-2).
Data Availability Statement
The TROPOMI Level-2 data product used in this research are open access and available online (https://doi.org/10.5270/S5P-vg1i7t0) (accessed on 18 June 2021).
Acknowledgments
We would like to thank the team that realized the TROPOMI instrument, consisting of a partnership between Airbus Defence and Space Netherlands, the Royal Netherlands Meteorological Institute (KNMI), the Netherlands Institute for Space Research (SRON) and the Netherlands Organisation for Applied Scientific Research (TNO), commissioned by the Netherlands Space Office (NSO) and the European Space Agency (ESA). The Sentinel-5 Precursor is part of the European Union (EU) Copernicus programme, and Copernicus Sentinel data from 2020 have been used here. The authors gratefully acknowledge the financial support received from the FAPESP, CNPq and CAPES. Arthur Dias Freitas would like to thank the Postgraduate Program in Meteorology at the University of São Paulo Institute of Astronomy, Geophysics and Atmospheric Sciences (IAG) for providing the fellowship. We thank Rachel Ifanger Albrecht and Camila da Cunha Lopes for their help with R programming. We are also grateful to the CETESB—Companhia Ambiental do Estado de São Paulo (Environmental Protection Agency of the State of São Paulo; www.cetesb.sp.gov.br, (accessed on 28 May 2022)); INMET—Instituto Nacional de Meteorologia (Brazilian National Institute of Meteorology; www.portal.inmet.gov.br, (accessed on 28 May 2022)); and INPE—Instituto Nacional de Pesquisas Espaciais (Brazilian National Institute for Space Research; www.gov.br/inpe, (accessed on 28 May 2022)) for providing access to their data.
Conflicts of Interest
The authors declare no conflict of interest.
References
- de Andrade, M.V.A.S.; Pinheiro, H.L.C.; Pereira, P.A.d.P.; de Andrade, J.B. Compostos carbonílicos atmosféricos: Fontes, reatividade, níveis de concentração e efeitos toxicológicos. Química Nova 2002, 25, 1117–1131. [Google Scholar] [CrossRef] [Green Version]
- Manahan, S.E. Organic Air Pollutants and Photochemical Smog. In Fundamentals of Environmental Chemistry; CRC Press LLC: Boca Raton, FL, USA, 2001; Chapter 16. [Google Scholar]
- Cooke, M.C.; Utembe, S.R.; Gorrotxategi Carbajo, P.; Archibald, A.T.; Orr-Ewing, A.J.; Jenkin, M.E.; Derwent, R.G.; Lary, D.J.; Shallcross, D.E. Impacts of formaldehyde photolysis rates on tropospheric chemistry. Atmos. Sci. Lett. 2010, 11, 33–38. [Google Scholar] [CrossRef]
- Fortems-Cheiney, A.; Chevallier, F.; Pison, I.; Bousquet, P.; Saunois, M.; Szopa, S.; Cressot, C.; Kurosu, T.P.; Chance, K.; Fried, A. The formaldehyde budget as seen by a global-scale multi-constraint and multi-species inversion system. Atmos. Chem. Phys. 2012, 12, 6699–6721. [Google Scholar] [CrossRef] [Green Version]
- Wolfe, G.M.; Kaiser, J.; Hanisco, T.F.; Keutsch, F.N.; De Gouw, J.A.; Gilman, J.B.; Graus, M.; Hatch, C.D.; Holloway, J.; Horowitz, L.W.; et al. Formaldehyde production from isoprene oxidation across NOx regimes. Atmos. Chem. Phys. 2016, 16, 2597–2610. [Google Scholar] [CrossRef] [PubMed] [Green Version]
- Millet, D.B.; Jacob, D.J.; Turquety, S.; Hudman, R.C.; Wu, S.; Fried, A.; Walega, J.; Heikes, B.G.; Blake, D.R.; Singh, H.B.; et al. Formaldehyde distribution over North America: Implications for satellite retrievals of formaldehyde columns and isoprene emission. J. Geophys. Res. Atmos. 2006, 111. [Google Scholar] [CrossRef] [Green Version]
- Stavrakou, T.; Müller, J.F.; De Smedt, I.; Van Roozendael, M.; Van Der Werf, G.R.; Giglio, L.; Guenther, A. Global emissions of non-methane hydrocarbons deduced from SCIAMACHY formaldehyde columns through 2003–2006. Atmos. Chem. Phys. 2009, 9, 3663–3679. [Google Scholar] [CrossRef] [Green Version]
- Guenther, A.; Hewitt, C.N.; Erickson, D.; Fall, R.; Geron, C.; Graedel, T.; Harley, P.; Klinger, L.; Lerdau, M.; McKay, W.A.; et al. A global model of natural volatile organic compound emissions. J. Geophys. Res. 1995, 100, 8873–8892. [Google Scholar] [CrossRef]
- Andreae, M.O.; Merlet, P. Emission of trace gases and aerosols from biomass burning. Glob. Biogeochem Cycles 2001, 15, 955–966. [Google Scholar] [CrossRef] [Green Version]
- Olivier, J.G.J.; Berdowski, J.J.M.; Peters, J.A.H.; Bakker, W.; Visschedijk, A.J.H.; Bloos, J.P.J. Applications of EDGAR. Including a description of EDGAR 3.0: Reference Database with Trend Data for 1970–1995; Technical Report; Rijksinstituut voor Volksgezondheid en Milieu RIVM: Bilthoven, The Netherlands, 2001. [Google Scholar]
- Shen, L.; Jacob, D.J.; Zhu, L.; Zhang, Q.; Zheng, B.; Sulprizio, M.P.; Li, K.; De Smedt, I.; González Abad, G.; Cao, H.; et al. The 2005–2016 Trends of Formaldehyde Columns Over China Observed by Satellites: Increasing Anthropogenic Emissions of Volatile Organic Compounds and Decreasing Agricultural Fire Emissions. Geophys. Res. Lett. 2019, 46, 4468–4475. [Google Scholar] [CrossRef] [Green Version]
- Kim, K.H.; Jahan, S.A.; Lee, J.T. Exposure to formaldehyde and its potential human health Hazards. J. Environ. Sci. Health Part C 2011, 29, 277–299. [Google Scholar] [CrossRef]
- Suresh, S.; Bandosz, T.J. Removal of formaldehyde on carbon-based materials: A review of the recent approaches and findings. Carbon 2018, 137, 207–221. [Google Scholar] [CrossRef]
- Nussbaumer, C.M.; Crowley, J.N.; Schuladen, J.; Williams, J.; Hafermann, S.; Reiffs, A.; Axinte, R.; Harder, H.; Ernest, C.; Novelli, A.; et al. Measurement report: Photochemical production and loss rates of formaldehyde and ozone across Europe. Atmos. Chem. Phys. 2021, 21, 18413–18432. [Google Scholar] [CrossRef]
- Palmer, P.I.; Jacob, D.J.; Fiore, A.M.; Martin, R.V.; Chance, K.; Kurosu, T.P. Mapping isoprene emissions over North America using formaldehyde column observations from space. J. Geophys. Res. 2003, 108. [Google Scholar] [CrossRef] [Green Version]
- Rasmussen, R.A.; Khalil, M.A. Isoprene over the Amazon Basin. J. Geophys. Res. 1988, 93, 1417–1421. [Google Scholar] [CrossRef]
- Fall, R. Biogenic Emissions of Volatile Organic Compounds from Higher Plants. React. Hydrocarb. Atmos. 1999, 41–96. [Google Scholar] [CrossRef]
- Borbon, A.; Ruiz, M.; Bechara, J.; Aumont, B.; Chong, M.; Huntrieser, H.; Mari, C.; Reeves, C.E.; Scialom, G.; Hamburger, T.; et al. Transport and chemistry of formaldehyde by mesoscale convective systems in West Africa during AMMA 2006. J. Geophys. Res. 2012, 117, 1–19. [Google Scholar] [CrossRef] [Green Version]
- Horowitz, A.; Calvert, J.G. The quantum efficiency of the primary processes in formaldehyde photolysis at 3130 Å and 25 °C. Int. J. Chem. Kinet. 1978, 10, 713–732. [Google Scholar] [CrossRef]
- Seinfeld, J.H.; Pandis, S.N. Atmospheric Chemistry and Physics: From Air Pollution to Climate Change; John Wiley & Sons: Hoboken, NJ, USA, 2006. [Google Scholar]
- Hazra, M.K.; Francisco, J.S.; Sinha, A. Gas phase hydrolysis of formaldehyde to form methanediol: Impact of formic acid catalysis. J. Phys. Chem. A 2013, 117, 11704–11710. [Google Scholar] [CrossRef]
- Lee, Y.N.; Zhou, X. Method for the Determination of Some Soluble Atmospheric Carbonyl Compounds. Environ. Sci. Technol. 1993, 27, 749–756. [Google Scholar] [CrossRef]
- Santos, M.A.; Pedrotti, J.J.; Fornaro, A. Evaluation of hydrogen peroxide in rainwater in downtown São Paulo. In Highway and Urban Environment, Proceedings of the 8th Highway and Urban Environment Symposium, Series: Alliance for Global Sustainability Bookseries; Morrison, G.M., Rauch, S., Eds.; Springer: Dordrecht, The Netherlands, 2007; pp. 119–128. [Google Scholar]
- Barkley, M.P.; Smedt, I.D.; Van Roozendael, M.; Kurosu, T.P.; Chance, K.; Arneth, A.; Hagberg, D.; Guenther, A.; Paulot, F.; Marais, E.; et al. Top-down isoprene emissions over tropical South America inferred from SCIAMACHY and OMI formaldehyde columns. J. Geophys. Res. Atmos. 2013, 118, 6849–6868. [Google Scholar] [CrossRef] [Green Version]
- Boeke, N.L.; Marshall, J.D.; Alvarez, S.; Chance, K.V.; Fried, A.; Kurosu, T.P.; Rappenglück, B.; Richter, D.; Walega, J.; Weibring, P.; et al. Formaldehyde columns from the Ozone Monitoring Instrument: Urban versus background levels and evaluation using aircraft data and a global model. J. Geophys. Res. Atmos. 2011, 116, 1–11. [Google Scholar] [CrossRef] [PubMed]
- Schroeder, J.R.; Crawford, J.H.; Fried, A.; Walega, J.; Weinheimer, A.; Wisthaler, A.; Müller, M.; Mikoviny, T.; Chen, G.; Shook, M.; et al. Formaldehyde column density measurements as a suitable pathway to estimate near-surface ozone tendencies from space. J. Geophys. Res. 2016, 121, 13088–13112. [Google Scholar] [CrossRef] [PubMed] [Green Version]
- Fishman, J.; Bowman, K.W.; Burrows, J.P.; Richter, A.; Chance, K.V.; Edwards, D.P.; Martin, R.V.; Morris, G.A.; Pierce, R.B.; Ziemke, J.R.; et al. Remote sensing of tropospheric pollution from space. Bull. Am. Meteorol. Soc. 2008, 89, 805–821. [Google Scholar] [CrossRef] [Green Version]
- Biswas, M.S.; Pandithurai, G.; Aslam, M.Y.; Patil, R.D.; Anilkumar, V.; Dudhambe, S.D.; Lerot, C.; De Smedt, I.; Van Roozendael, M.; Mahajan, A.S. Effect of boundary layer evolution on nitrogen dioxide (NO2) and formaldehyde (HCHO) concentrations at a high-altitude observatory in western India. Aerosol. Air Qual. Res. 2021, 21, 1–21. [Google Scholar] [CrossRef]
- Abbot, D.S.; Palmer, P.I.; Martin, R.V.; Chance, K.V.; Jacob, D.J.; Guenther, A. Seasonal and interannual variability of North American isoprene emissions as determined by formaldehyde column measurements from space. Geophys. Res. Lett. 2003, 30, 1999–2002. [Google Scholar] [CrossRef] [Green Version]
- Chance, K.; Palmer, P.I.; Spurr, R.J.; Martin, R.V.; Kurosu, T.P.; Jacob, D.J. Satellite observations of formaldehyde over North America from GOME. Geophys. Res. Lett. 2000, 27, 3461–3464. [Google Scholar] [CrossRef] [Green Version]
- Zhu, L.; Jacob, D.J.; Mickley, L.J.; Marais, E.A.; Cohan, D.S.; Yoshida, Y.; Duncan, B.N.; Abad, G.G.; Chance, K.V. Anthropogenic emissions of highly reactive volatile organic compounds in eastern Texas inferred from oversampling of satellite (OMI) measurements of HCHO columns. Environ. Res. Lett. 2014, 9. [Google Scholar] [CrossRef] [Green Version]
- Bai, J.; de Leeuw, G.; van der, A.R.; De Smedt, I.; Theys, N.; Van Roozendael, M.; Sogacheva, L.; Chai, W. Variations and photochemical transformations of atmospheric constituents in North China. Atmos. Environ. 2018, 189, 213–226. [Google Scholar] [CrossRef]
- Chang, C.Y.; Faust, E.; Hou, X.; Lee, P.; Kim, H.C.; Hedquist, B.C.; Liao, K.J. Investigating ambient ozone formation regimes in neighboring cities of shale plays in the Northeast United States using photochemical modeling and satellite retrievals. Atmos. Environ. 2016, 142, 152–170. [Google Scholar] [CrossRef]
- Gonzalez Abad, G.; Souri, A.H.; Bak, J.; Chance, K.; Flynn, L.E.; Krotkov, N.A.; Lamsal, L.; Li, C.; Liu, X.; Miller, C.C.; et al. Five decades observing Earth’s atmospheric trace gases using ultraviolet and visible backscatter solar radiation from space. J. Quant. Spectrosc. Radiat. Transf. 2019, 238, 106478. [Google Scholar] [CrossRef]
- World Meteorological Organization. Measurement Timeline for HCHO Total Column; World Meteorological Organization: Geneva, Switzerland, 2021. [Google Scholar]
- Nogueira, T.; Dominutti, P.A.; De Carvalho, L.R.F.; Fornaro, A.; Andrade, M.D.F. Formaldehyde and acetaldehyde measurements in urban atmosphere impacted by the use of ethanol biofuel: Metropolitan Area of Sao Paulo (MASP), 2012–2013. Fuel 2014, 134, 505–513. [Google Scholar] [CrossRef]
- Nogueira, T.; Dominutti, P.A.; Fornaro, A.; Andrade, M.d.F. Seasonal Trends of Formaldehyde and Acetaldehyde in the Megacity of São Paulo. Atmosphere 2017, 8, 18. [Google Scholar] [CrossRef] [Green Version]
- CETESB. Qualidade do Ar no Estado de São Paulo—2020; Secretaria de Infraestrutura e Meio Ambiente, Série Relatórios: São Paulo, Brazil, 2021; p. 152.
- Siddans, R.; Smith, A. Sentinel-5 Precursor/TROPOMI Level 2 Product User Manual NPP Cloud; DLR: Cologne, Germany, 2018. [Google Scholar]
- Carbone, S. Modelagem de Ozônio Troposférico em Regiões Urbanas—AperfeiçOamento do módulo Químico no Modelo CIT. Ph.D. Thesis, Universidade de São Paulo, São Paulo, Brazil, 2008. [Google Scholar]
- De Smedt, I.; Theys, N.; Yu, H.; Vlietinck, J.; he Lerot, C.; Roozendael, M.V. S5P/TROPOMI HCHO ATBD; Technical Report 2.3.0; BIRA-IASB: Uccle, Belgium, 2021. [Google Scholar]
- Veefkind, J.P.; Aben, I.; McMullan, K.; Förster, H.; de Vries, J.; Otter, G.; Claas, J.; Eskes, H.J.; de Haan, J.F.; Kleipool, Q.; et al. TROPOMI on the ESA Sentinel-5 Precursor: A GMES mission for global observations of the atmospheric composition for climate, air quality and ozone layer applications. Remote Sens. Environ. 2012, 120, 70–83. [Google Scholar] [CrossRef]
- Chance, K.; Kurucz, R.L. An improved high-resolution solar reference spectrum for earth’s atmosphere measurements in the ultraviolet, visible, and near infrared. J. Quant. Spectrosc. Radiat. Transf. 2010, 111, 1289–1295. [Google Scholar] [CrossRef]
- De Smedt, I.; Eichmann, K.U.; Lambert, J.C.; Loyola, D.; Veefkind, J.P. S5P Mission Performance Centre Formaldehyde [L2__HCHO___] Readme; Technical Report; BIRA-IASB: Uccle, Belgium, 2019. [Google Scholar]
- Vigouroux, C.; Langerock, B.; Augusto Bauer Aquino, C.; Blumenstock, T.; Cheng, Z.; De Mazière, M.; De Smedt, I.; Grutter, M.; Hannigan, J.W.; Jones, N.; et al. TROPOMI-Sentinel-5 Precursor formaldehyde validation using an extensive network of ground-based Fourier-transform infrared stations. Atmos. Meas. Technol. 2020, 13, 3751–3767. [Google Scholar] [CrossRef]
- IBGE, Panorama: São Paulo. 2020. Available online: https://cidades.ibge.gov.br/brasil/sp/panorama (accessed on 10 December 2021).
- Instituto Florestal. Inventário Florestal do Estado de São Paulo—Mapeamento da Cobertura Vegetal Nativa; Secretaria de Infraestrutura e Meio Ambiente, Instituto Florestal: São Paulo, Brazil, 2020; Volume 60.
- Zhang, Y.; Li, R.; Min, Q.; Bo, H.; Fu, Y.; Wang, Y.; Gao, Z. The Controlling Factors of Atmospheric Formaldehyde (HCHO) in Amazon as Seen From Satellite. Earth Space Sci. 2019, 6, 959–971. [Google Scholar] [CrossRef] [Green Version]
- Observatório da Cana. Área Cultivada Com Cana-de-Açúcar—Área Total por Estado; Observatório da Cana: São Paulo, Brazil, 2018. [Google Scholar]
- Ribeiro, H.; de Assunção, J.V. Efeitos das queimadas na saúde humana. Estudos Avançados 2002, 16, 125–148. [Google Scholar] [CrossRef] [Green Version]
- CETESB. Emissões Veiculares no Estado de São Paulo; Secretaria de Infraestrutura e Meio Ambiente, Série Relatórios: São Paulo, Brazil, 2019; p. 140.
- CONAMA. Resolução n° 18/1986; Diário Oficial da República Federativa do Brasil: Brasília, Brazil, 1986.
- IBAMA. PROCONVE/PROMOT, 3rd ed.; Coleção Meio Ambiente, Série Diretrizes: Brasília, Brazil, 2011; p. 584.
- Carvalho, V.S.B.; Freitas, E.D.; Martins, L.D.; Martins, J.A.; Mazzoli, C.R.; Andrade, M.d.F. Air quality status and trends over the Metropolitan Area of São Paulo, Brazil as a result of emission control policies. Environ. Sci. Policy 2015, 47, 68–79. [Google Scholar] [CrossRef]
- IEA. Valor da Produção Agropecuária do Estado de São Paulo: Resultado Preliminar 2020; Instituto de Economia Agrícola: São Paulo, Brazil, 2020. [Google Scholar]
- da Costa, M.L.O. A Queima da Palha da Cana-de-Açúcar no Estado de São Paulo; Migalhas: São Paulo, Brazil, 2013. [Google Scholar]
- Paraiso, M.L.d.S.; Gouveia, N. Riscos à saúde devido à queima prévia da palha de cana-de-açúcar no Estado de São Paulo, Brasil. Rev. Bras. Epidemiol. 2015, 18, 691. [Google Scholar] [CrossRef] [Green Version]
- Baccarin, J.G.; de Oliveira, J.A.; Mardegan, G.E. The environmental, social and economic effects of recent technological changes in sugarcane on the State of São Paulo, Brazil. J. Agrar. Chang. 2020, 20, 598–617. [Google Scholar] [CrossRef]
- Valente, F.; Laurini, M. Pre-harvest sugarcane burning: A statistical analysis of the environmental impacts of a regulatory change in the energy sector. Clean. Eng. Technol. 2021, 4, 14. [Google Scholar] [CrossRef]
- Aguiar, D.A.; Rudorff, B.F.T.; Silva, W.F.; Adami, M.; Mello, M.P. Remote sensing images in support of environmental protocol: Monitoring the sugarcane harvest in São Paulo State, Brazil. Remote Sens. 2011, 3, 2682–2703. [Google Scholar] [CrossRef] [Green Version]
- Metzger, J.P.; Alves, L.F.; Goulart, W.; Teixeira, A.M.d.G.; Simões, S.J.C.; Catharino, E.L.M. Uma área de relevante interesse biológico, porém pouco conhecida: A Reserva Florestal do Morro Grande. Biota Neotrop. 2006, 6, 1–33. [Google Scholar] [CrossRef] [Green Version]
- Thomaziello, S.A. Sustentabilidade Ambiental e serviços Ecossistêmicos: Uma Estratégia para Avaliar Zonas Amortecimento de Paisagens Protegidas—O caso da Reserva Florestal do Morro Grande/SP. Ph.D. Thesis, Universidade Estadual de Campinas, Campinas, Brazil, 2016. [Google Scholar]
- Corrêa, S.M.; Arbilla, G.; Martins, E.M.; Quitério, S.L.; de Souza Guimarães, C.; Gatti, L.V. Five years of formaldehyde and acetaldehyde monitoring in the Rio de Janeiro downtown area—Brazil. Atmos. Environ. 2010, 44, 2302–2308. [Google Scholar] [CrossRef]
- De Andrade, J.B.; Andrade, M.V.; Pinheiro, H.L. Atmospheric levels of formaldehyde and acetaldehyde and their relationship with the vehicular fleet composition in Salvador, Bahia, Brazil. J. Braz. Chem. Soc. 1998, 9, 219–223. [Google Scholar] [CrossRef]
- Pinto, J.P.; Solci, M.C. Comparison of rural and urban atmospheric aldehydes in Londrina, Brazil. J. Braz. Chem. Soc. 2007, 18, 928–936. [Google Scholar] [CrossRef]
- Piñero Sánchez, M.; de Oliveira, A.P.; Varona, R.P.; Tito, J.V.; Codato, G.; Ribeiro, F.N.D.; Marques Filho, E.P.; da Silveira, L.C. Rawinsonde based analysis of the urban boundary layer in the metropolitan region of São Paulo, Brazil. Earth Space Sci. 2020, 7. [Google Scholar] [CrossRef]
- de Souza, A.; Abreu, M.C.; de Oliveira-Júnior, J.F.; Aviv-Sharon, E.; Fernandes, W.A.; Aristone, F. Variations in the tropospheric concentration of NO2 in the central west of Brazil, MS, and their relationship with the COVID-19. Air Qual. Atmos. Health 2021. [Google Scholar] [CrossRef]
- Libonati, R.; Geirinhas, J.L.; Silva, P.S.; Russo, A.; Rodrigues, J.A.; Belém, L.B.; Nogueira, J.; Roque, F.O.; Dacamara, C.C.; Nunes, A.M.; et al. Assessing the role of compound drought and heatwave events on unprecedented 2020 wildfires in the Pantanal. Environ. Res. Lett. 2022, 17. [Google Scholar] [CrossRef]
- do Rosário, N.É.; Sena, E.T.; Yamasoe, M.A.; Paulo, S. South American regional smoke plume in recent years: Main sources and impact on solar radiation focusing on the Pantanal 2020 biomass burning season. Atmos. Chem. Phys. 2022, 24. [Google Scholar] [CrossRef]
- Garcia, L.C.; Szabo, J.K.; de Oliveira Roque, F.; de Matos Martins Pereira, A.; Nunes da Cunha, C.; Damasceno-Júnior, G.A.; Morato, R.G.; Tomas, W.M.; Libonati, R.; Ribeiro, D.B. Record-breaking wildfires in the world’s largest continuous tropical wetland: Integrative fire management is urgently needed for both biodiversity and humans. J. Environ. Manag. 2021, 293, 112870. [Google Scholar] [CrossRef] [PubMed]
- Wang, P.; Holloway, T.; Bindl, M.; Harkey, M.; De Smedt, I. Ambient Formaldehyde over the United States from Ground-Based (AQS) and Satellite (OMI) Observations. Remote Sens. 2022, 14, 2191. [Google Scholar] [CrossRef]
- Friedenson, B. Inherited mutations impair responses to environmental carcinogens: Cancer prevention in mutation carriers. Nat. Preced. 2011. [Google Scholar] [CrossRef] [Green Version]
- ANFAVEA. Autoveículos—Produção, Vendas Internas e Exportações; Technical Report; Anuário da Indústria Automobilística Brasileira: Indianópolis, São Paulo, Brazil, 2008. [Google Scholar]
- Siciliano, B.; Carvalho, G.; da Silva, C.M.; Arbilla, G. The Impact of COVID-19 Partial Lockdown on Primary Pollutant Concentrations in the Atmosphere of Rio de Janeiro and São Paulo Megacities (Brazil). Bull. Environ. Contam. Toxicol. 2020, 105, 2–8. [Google Scholar] [CrossRef] [PubMed]
- Sun, W.; Zhu, L.; De Smedt, I.; Bai, B.; Pu, D.; Chen, Y.; Shu, L.; Wang, D.; Fu, T.M.; Wang, X.; et al. Global Significant Changes in Formaldehyde (HCHO) Columns Observed From Space at the Early Stage of the COVID-19 Pandemic. Geophys. Res. Lett. 2021, 48. [Google Scholar] [CrossRef] [PubMed]
- Rudke, A.P.; Martins, J.A.; de Almeida, D.S.; Martins, L.D.; Beal, A.; Hallak, R.; Freitas, E.D.; Andrade, M.F.; Foroutan, H.; Baek, B.H.; et al. How mobility restrictions policy and atmospheric conditions impacted air quality in the State of São Paulo during the COVID-19 outbreak. Environ. Res. 2021, 198. [Google Scholar] [CrossRef] [PubMed]

Publisher’s Note: MDPI stays neutral with regard to jurisdictional claims in published maps and institutional affiliations. |
© 2022 by the authors. Licensee MDPI, Basel, Switzerland. This article is an open access article distributed under the terms and conditions of the Creative Commons Attribution (CC BY) license (https://creativecommons.org/licenses/by/4.0/).