
Existence of Glacier Anomaly in the Interior and Northern Tibetan Plateau between 2000 and 2012


Abstract
:
1. Introduction
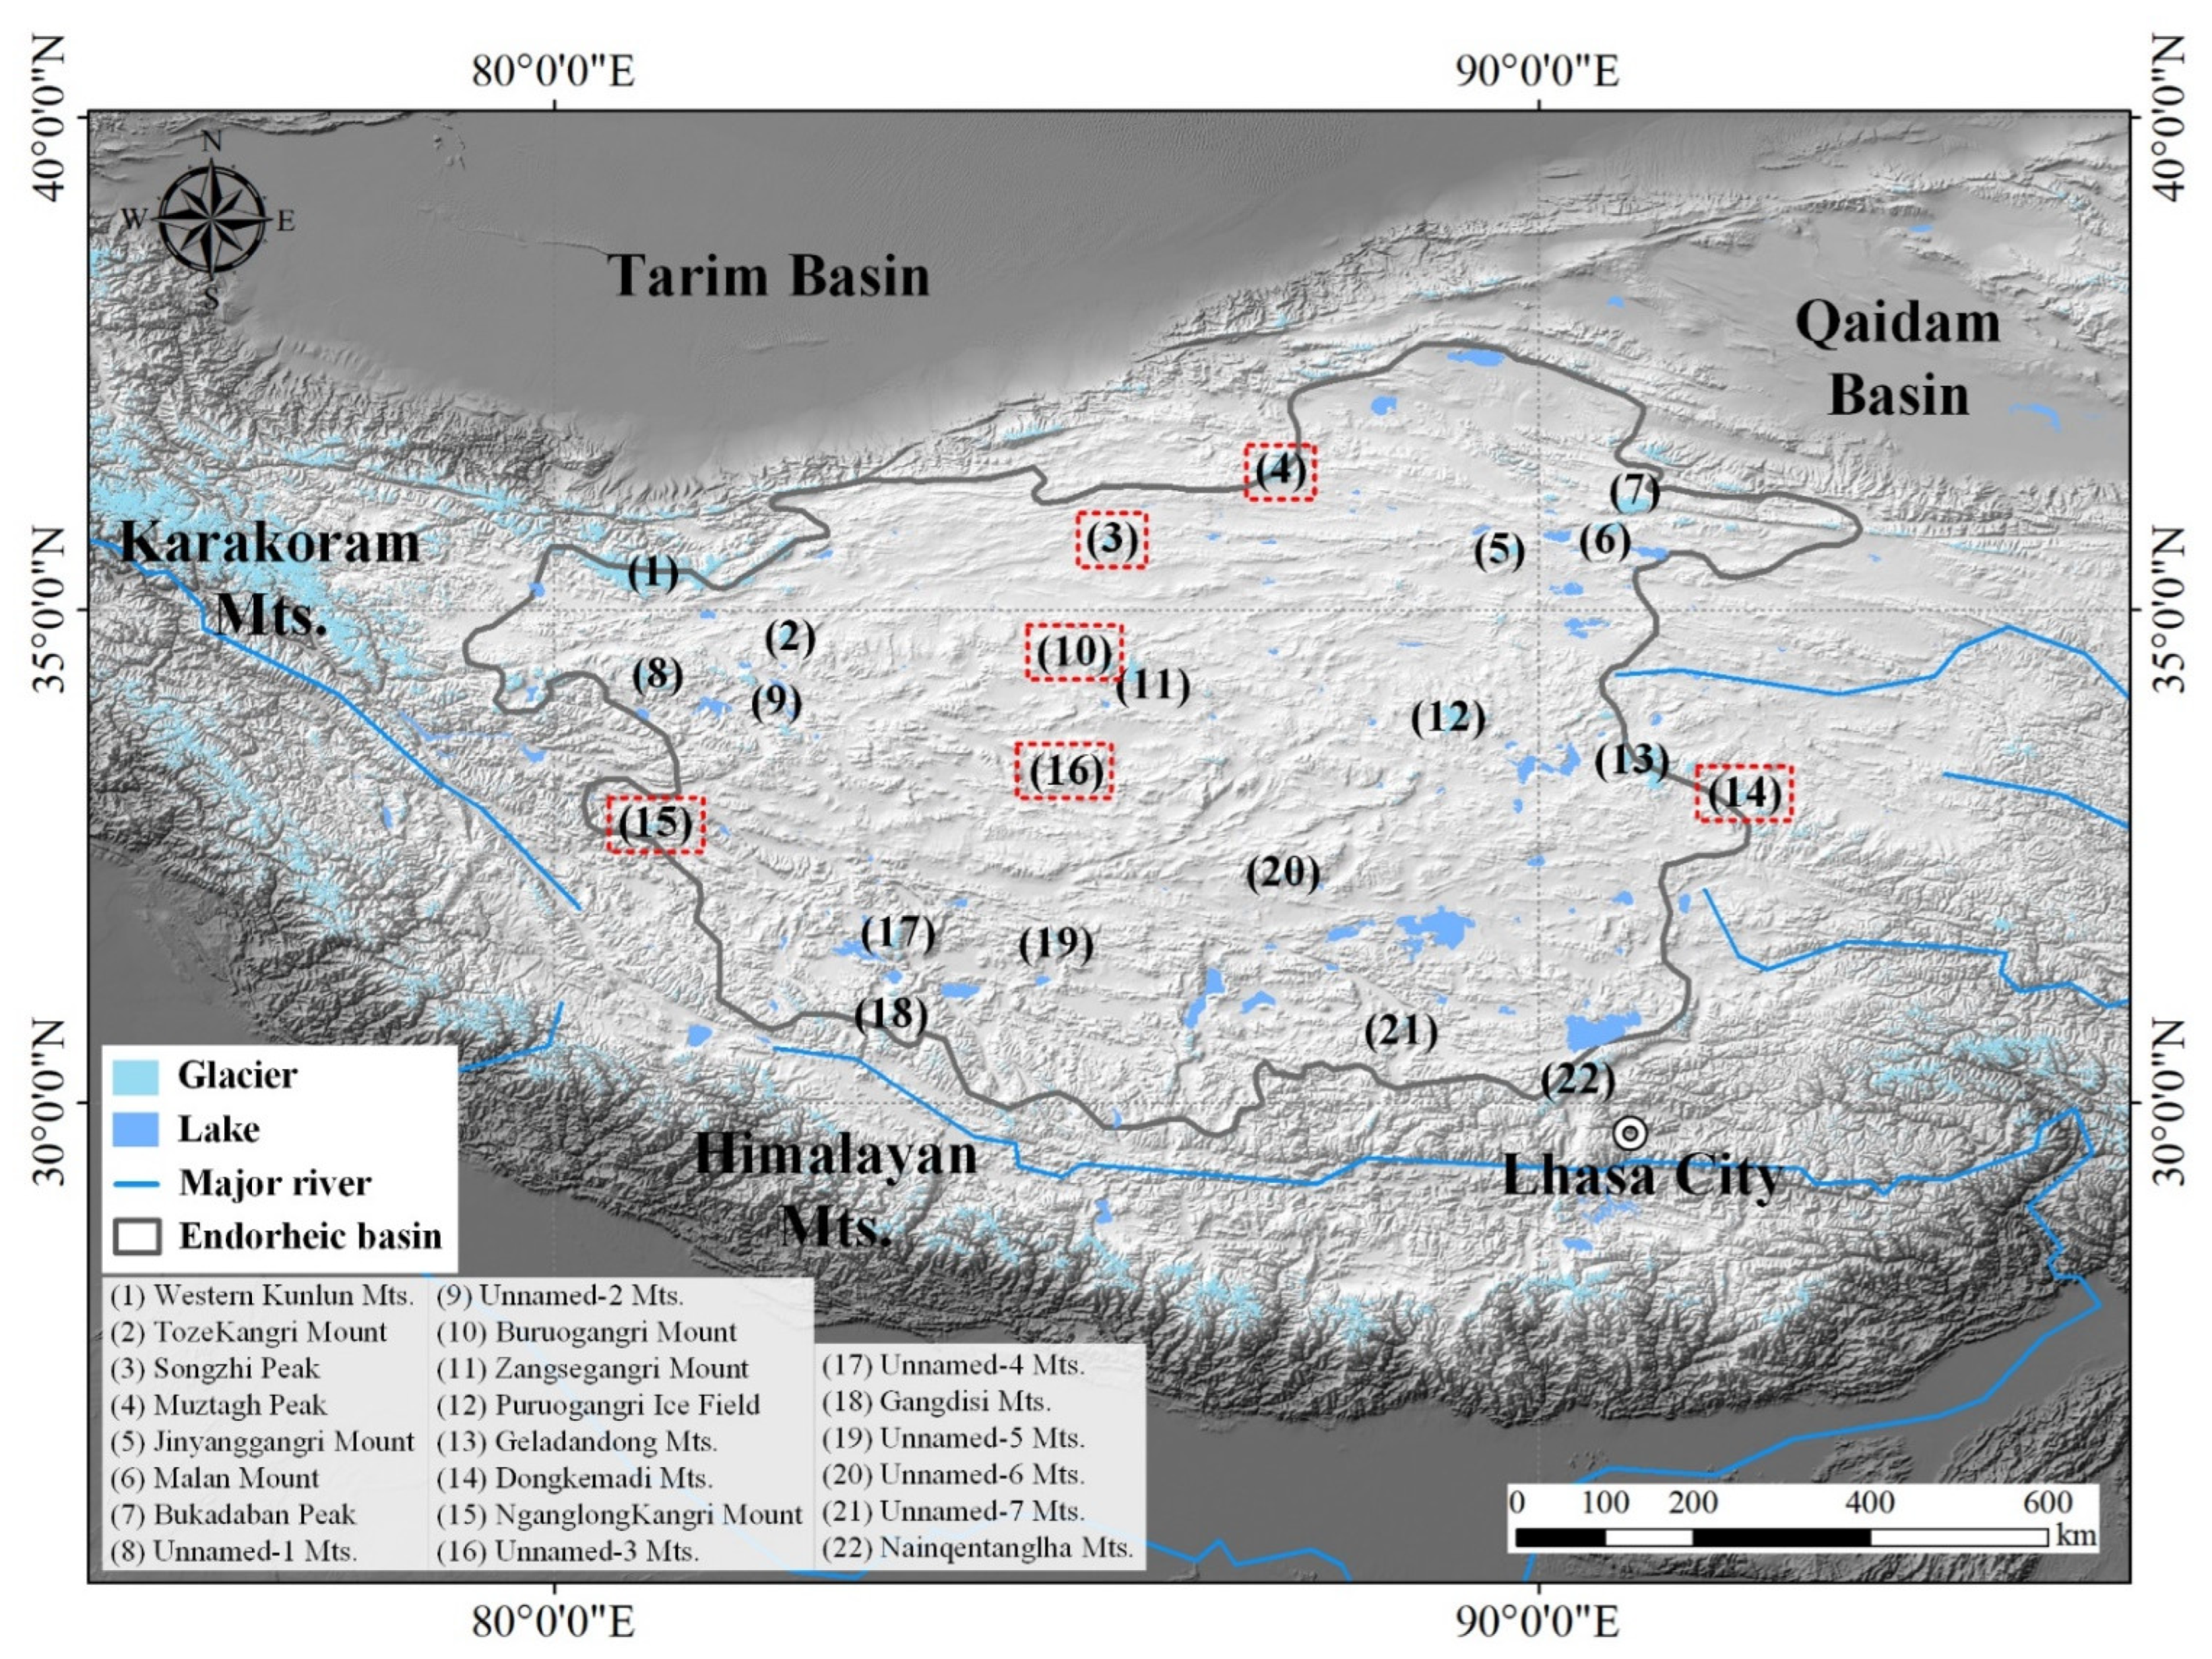
2. Study Area
3. Data and Methods
3.1. Single-Pass InSAR DEMs
3.2. Glacier Elevation Change Calculation
3.3. Glacier Mass Balances Estimation
3.3.1. C/X-Band Radar Signal Penetration Difference
3.3.2. Seasonality Correction
3.3.3. Decade-Average Glacier Mass Balance Estimation
3.4. Uncertainty Analysis
4. Results
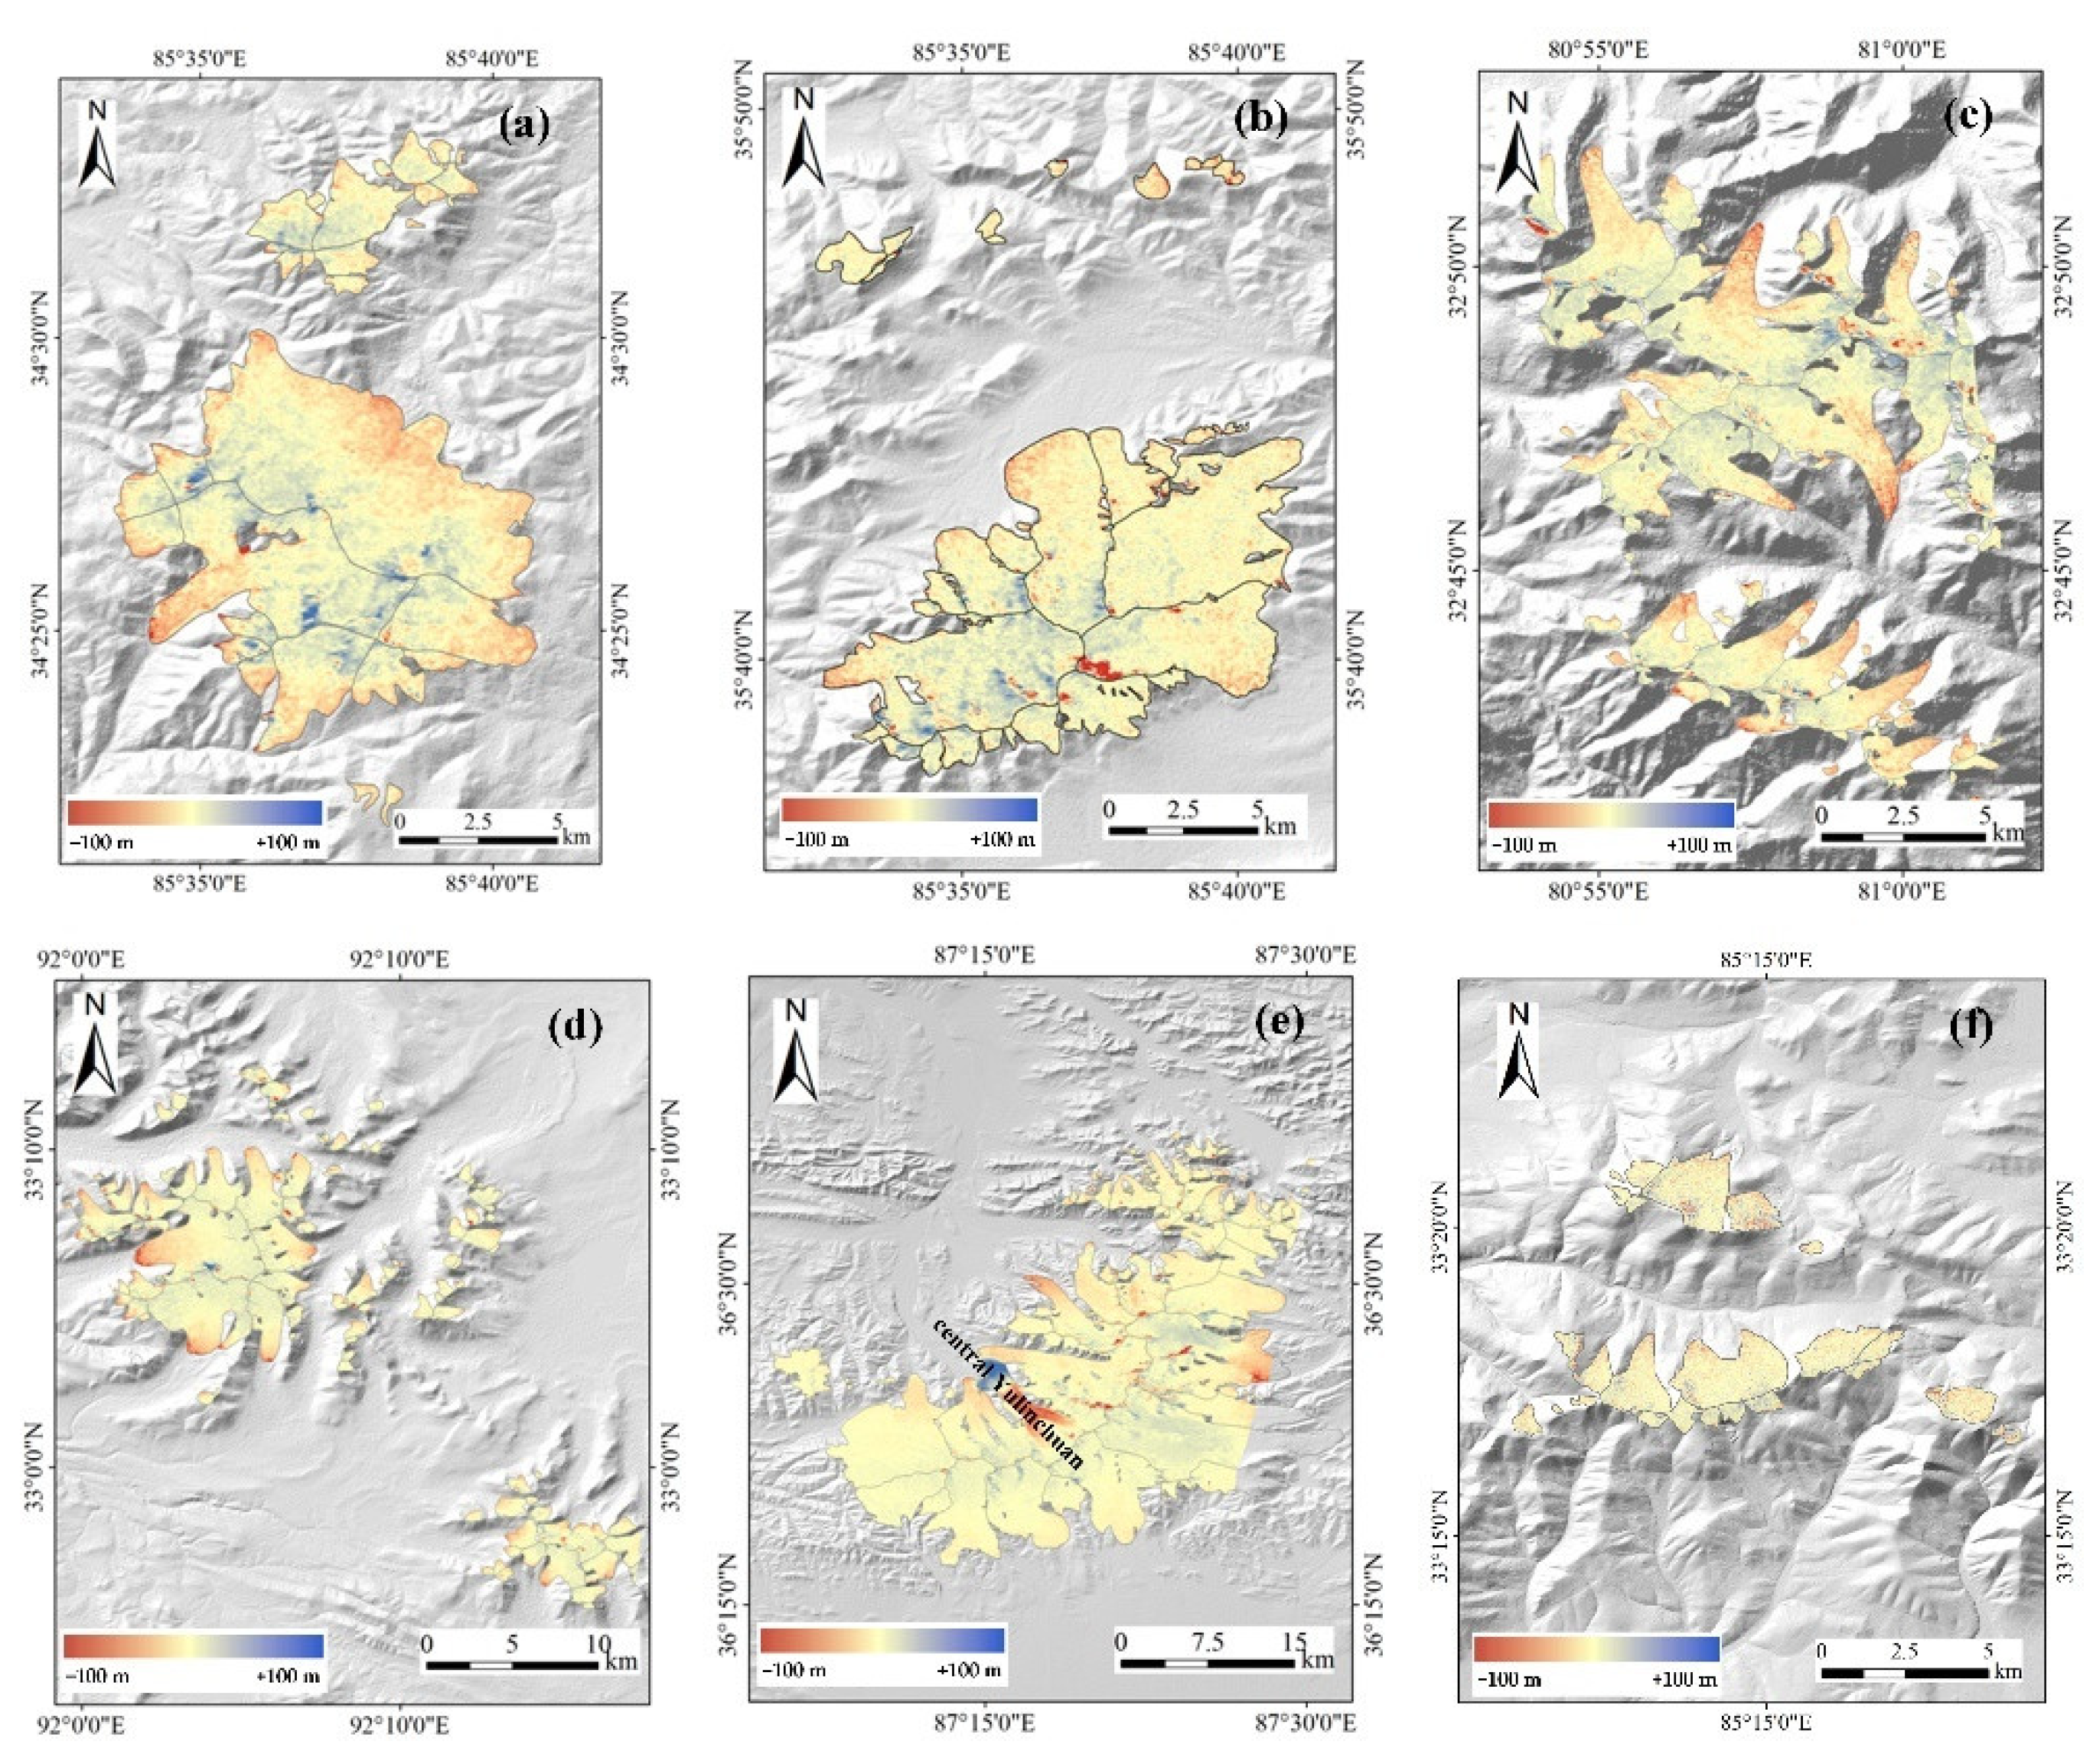
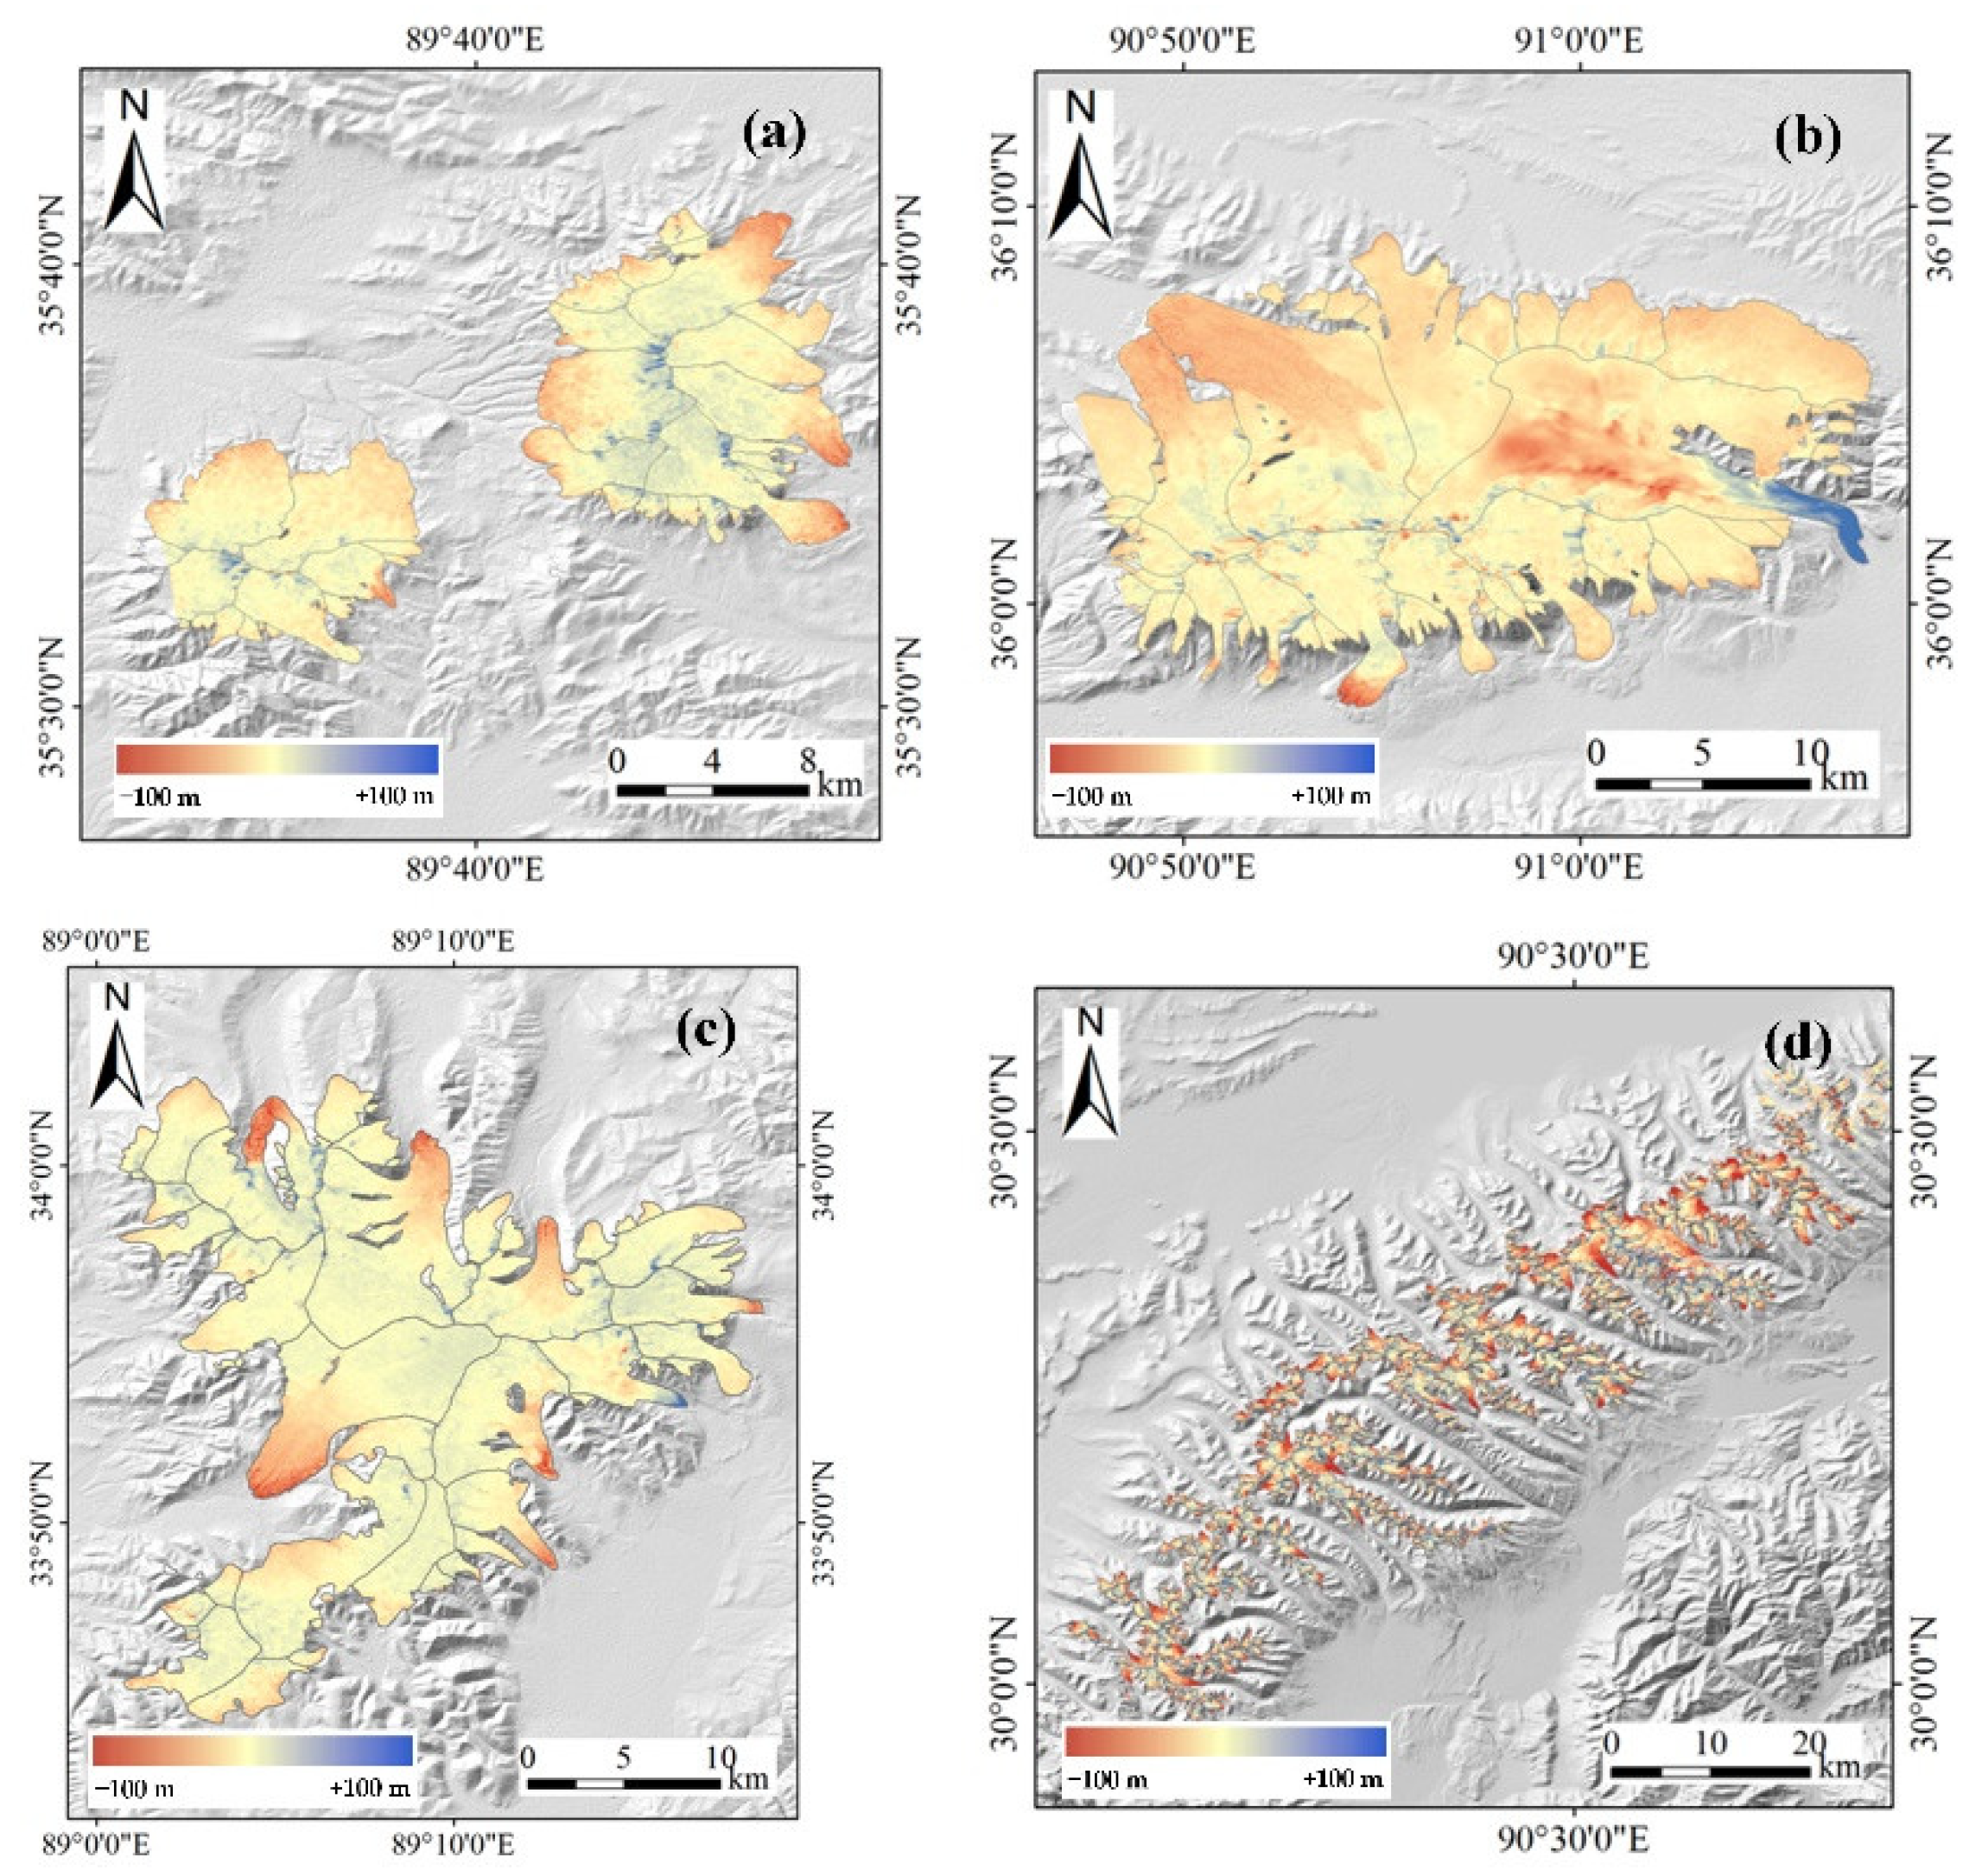
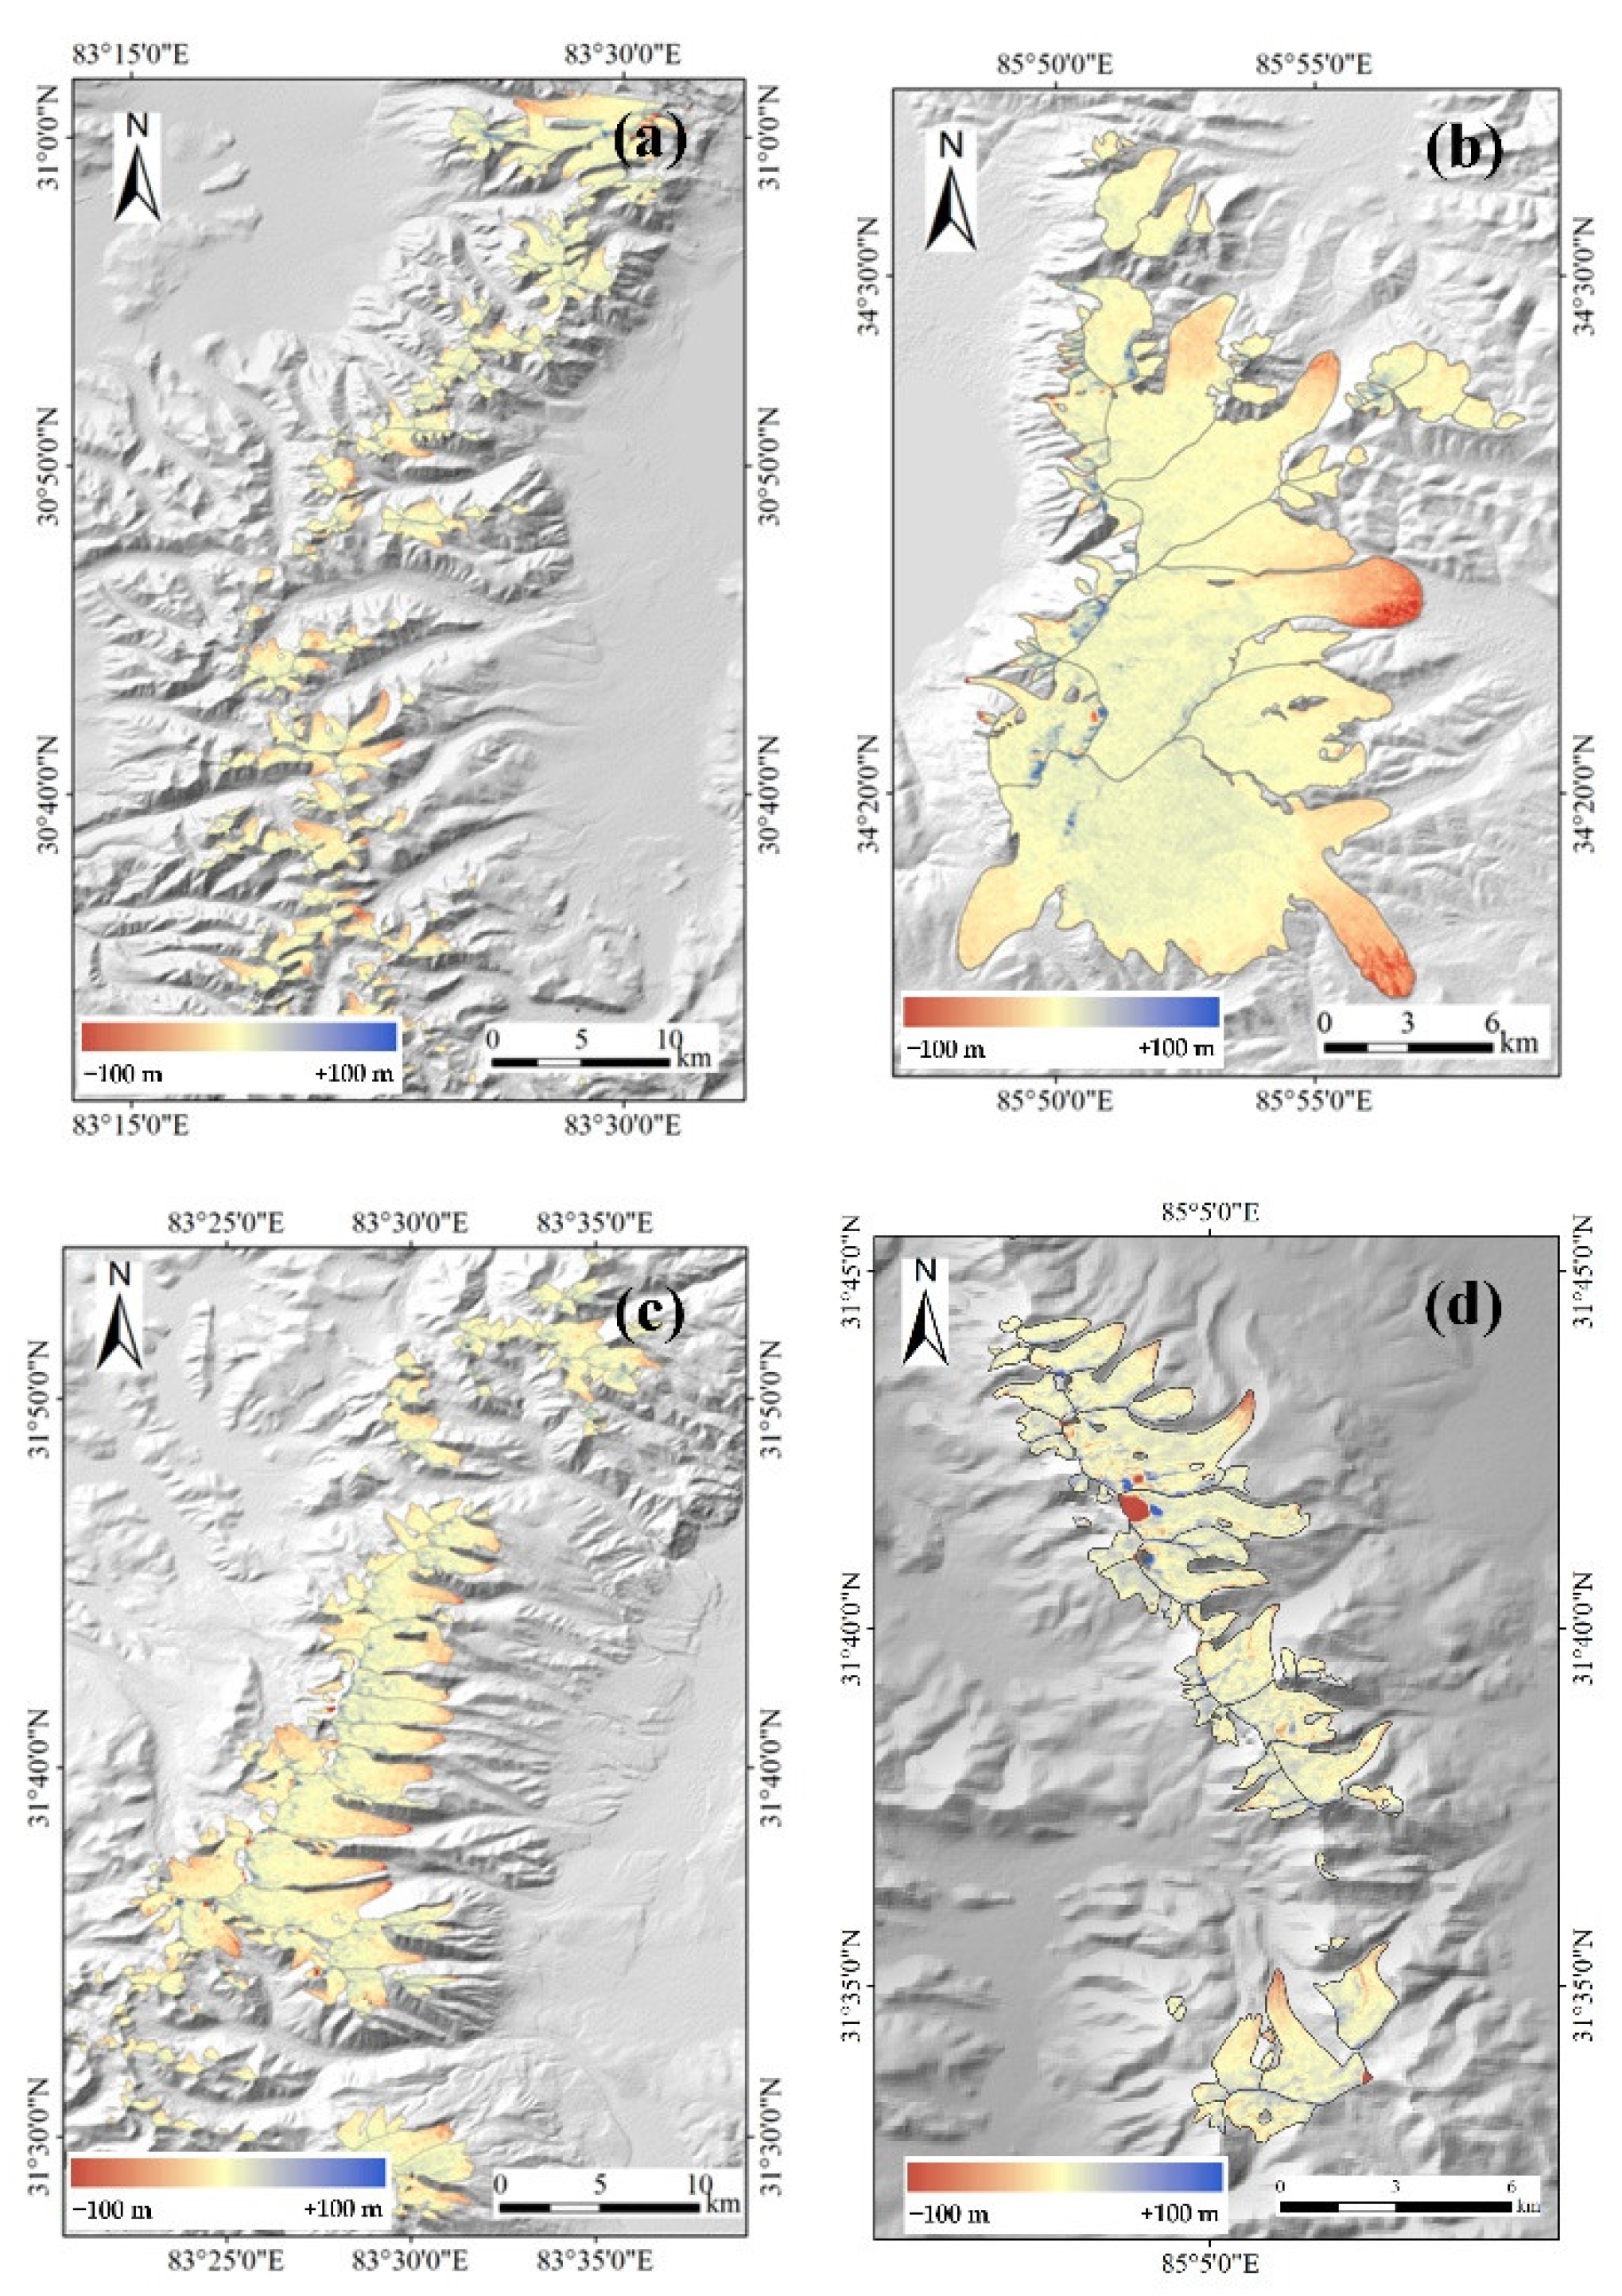
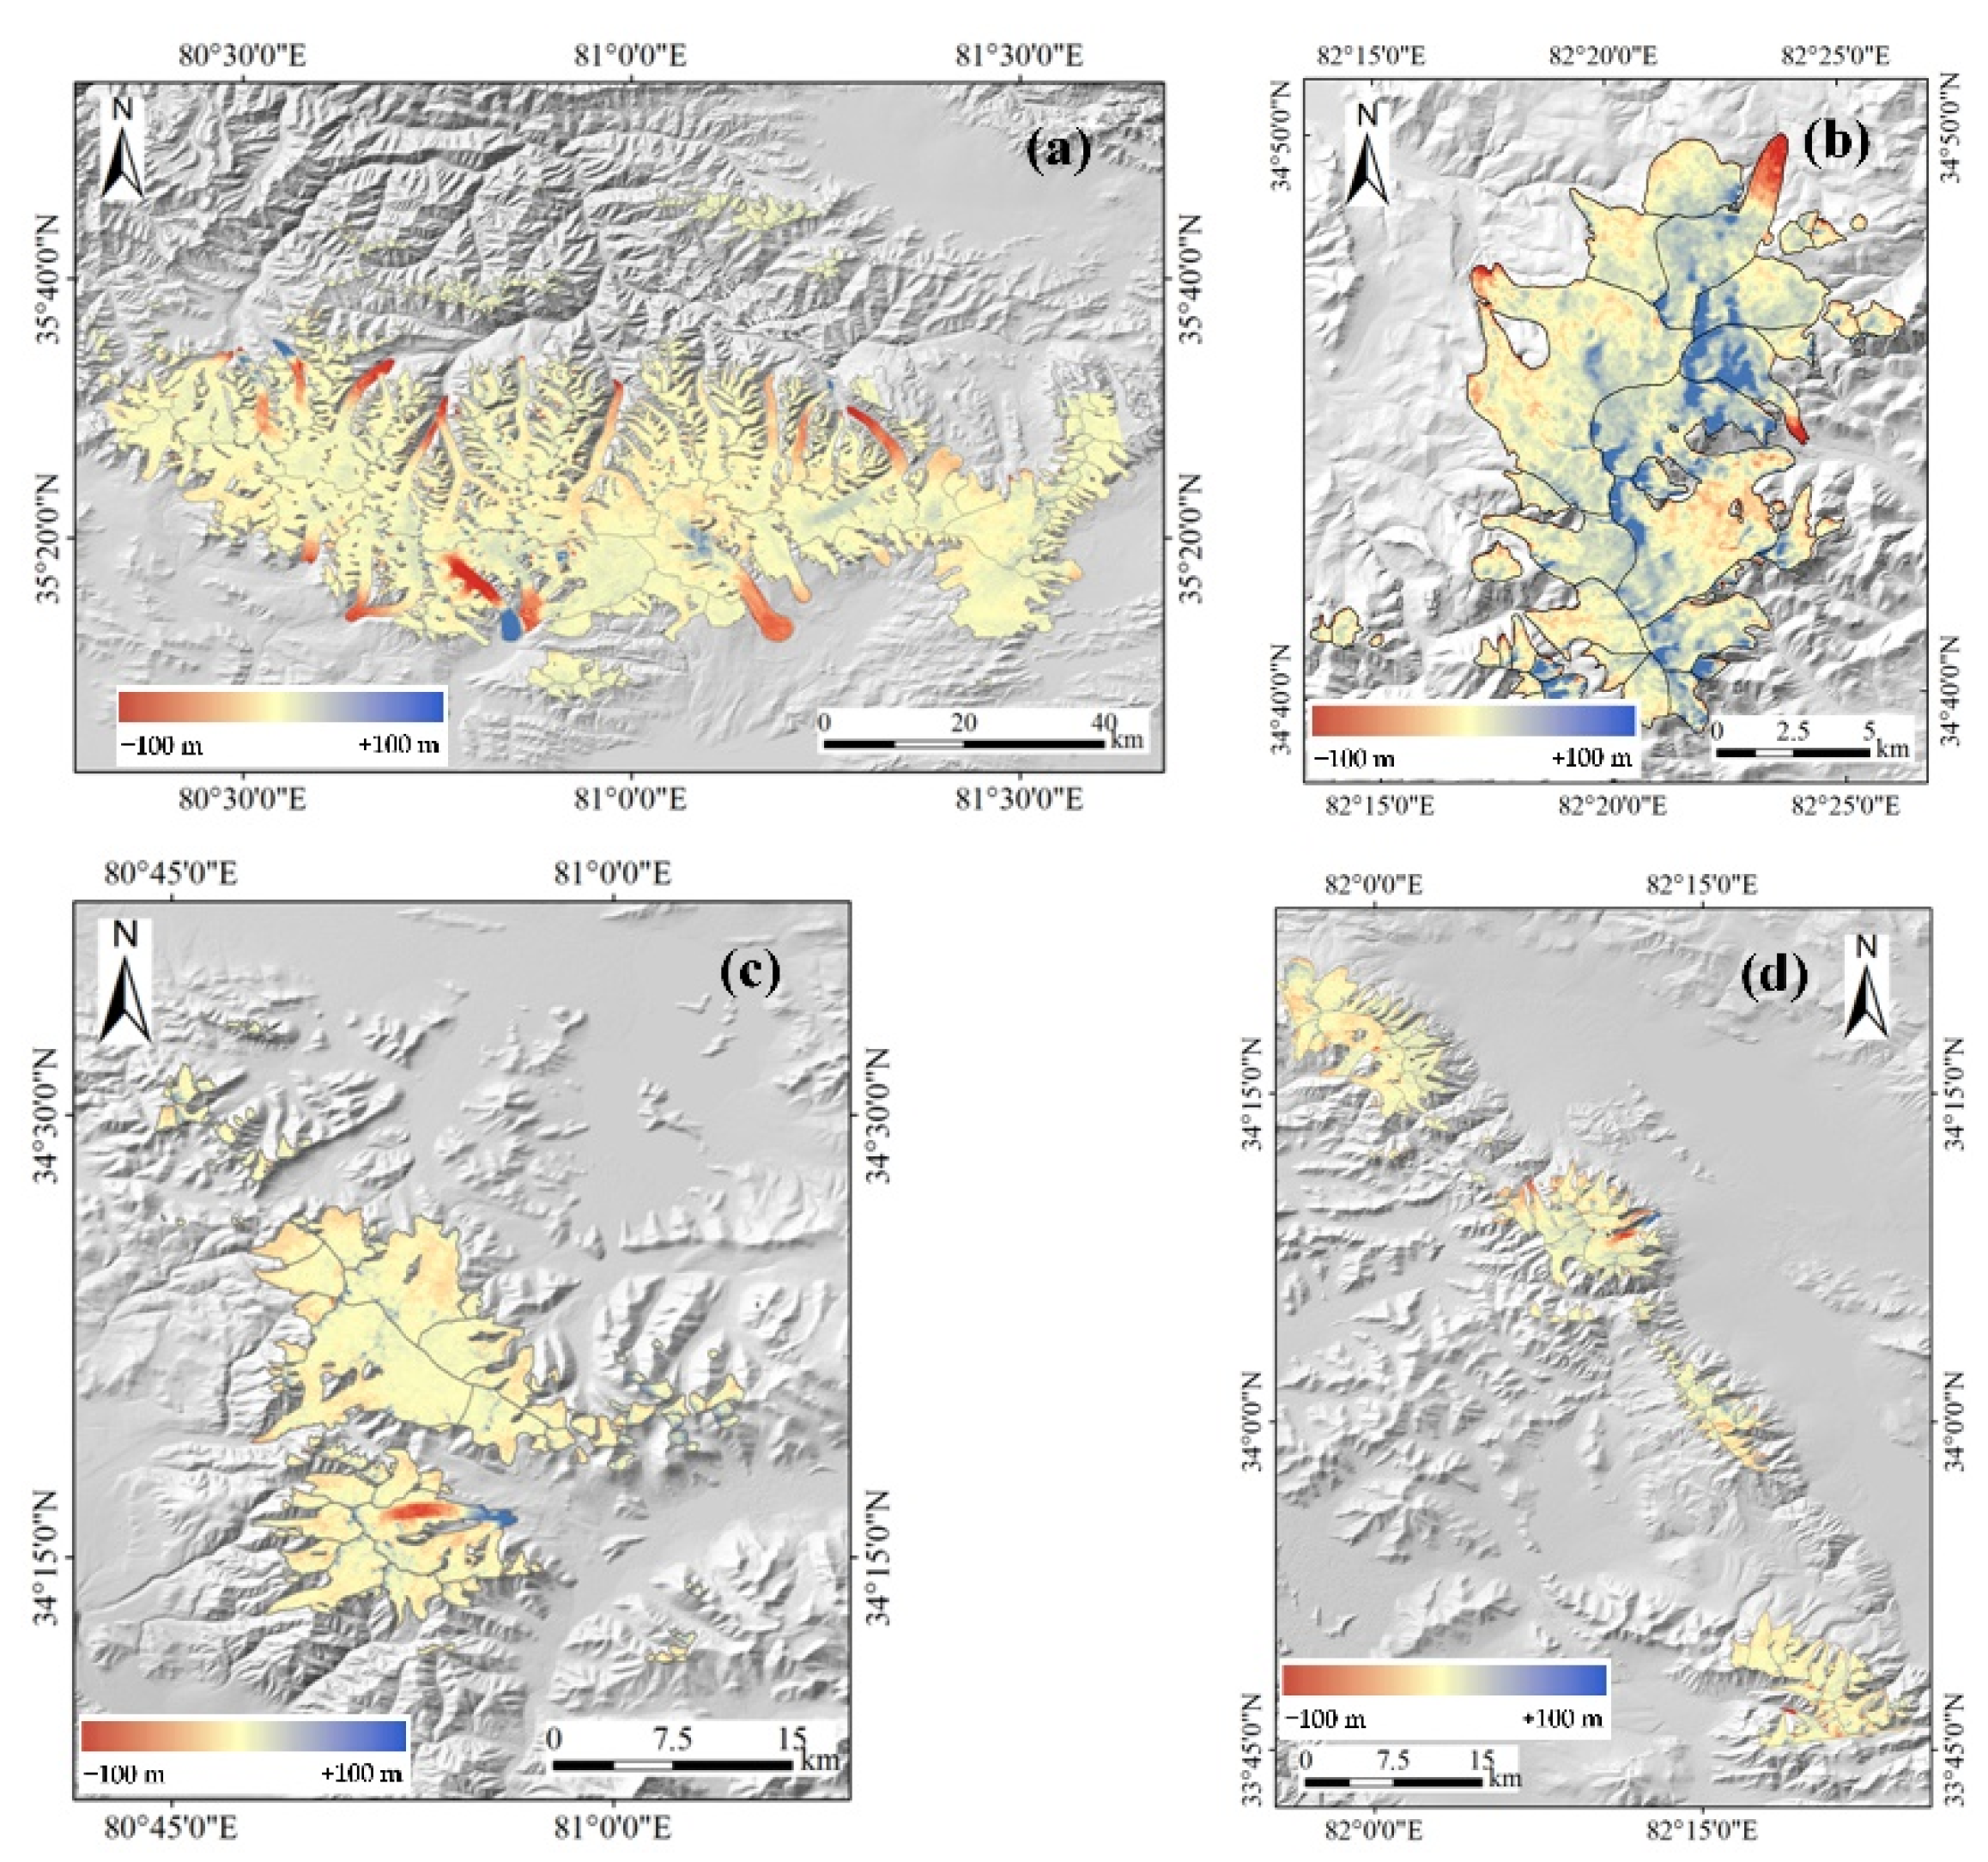
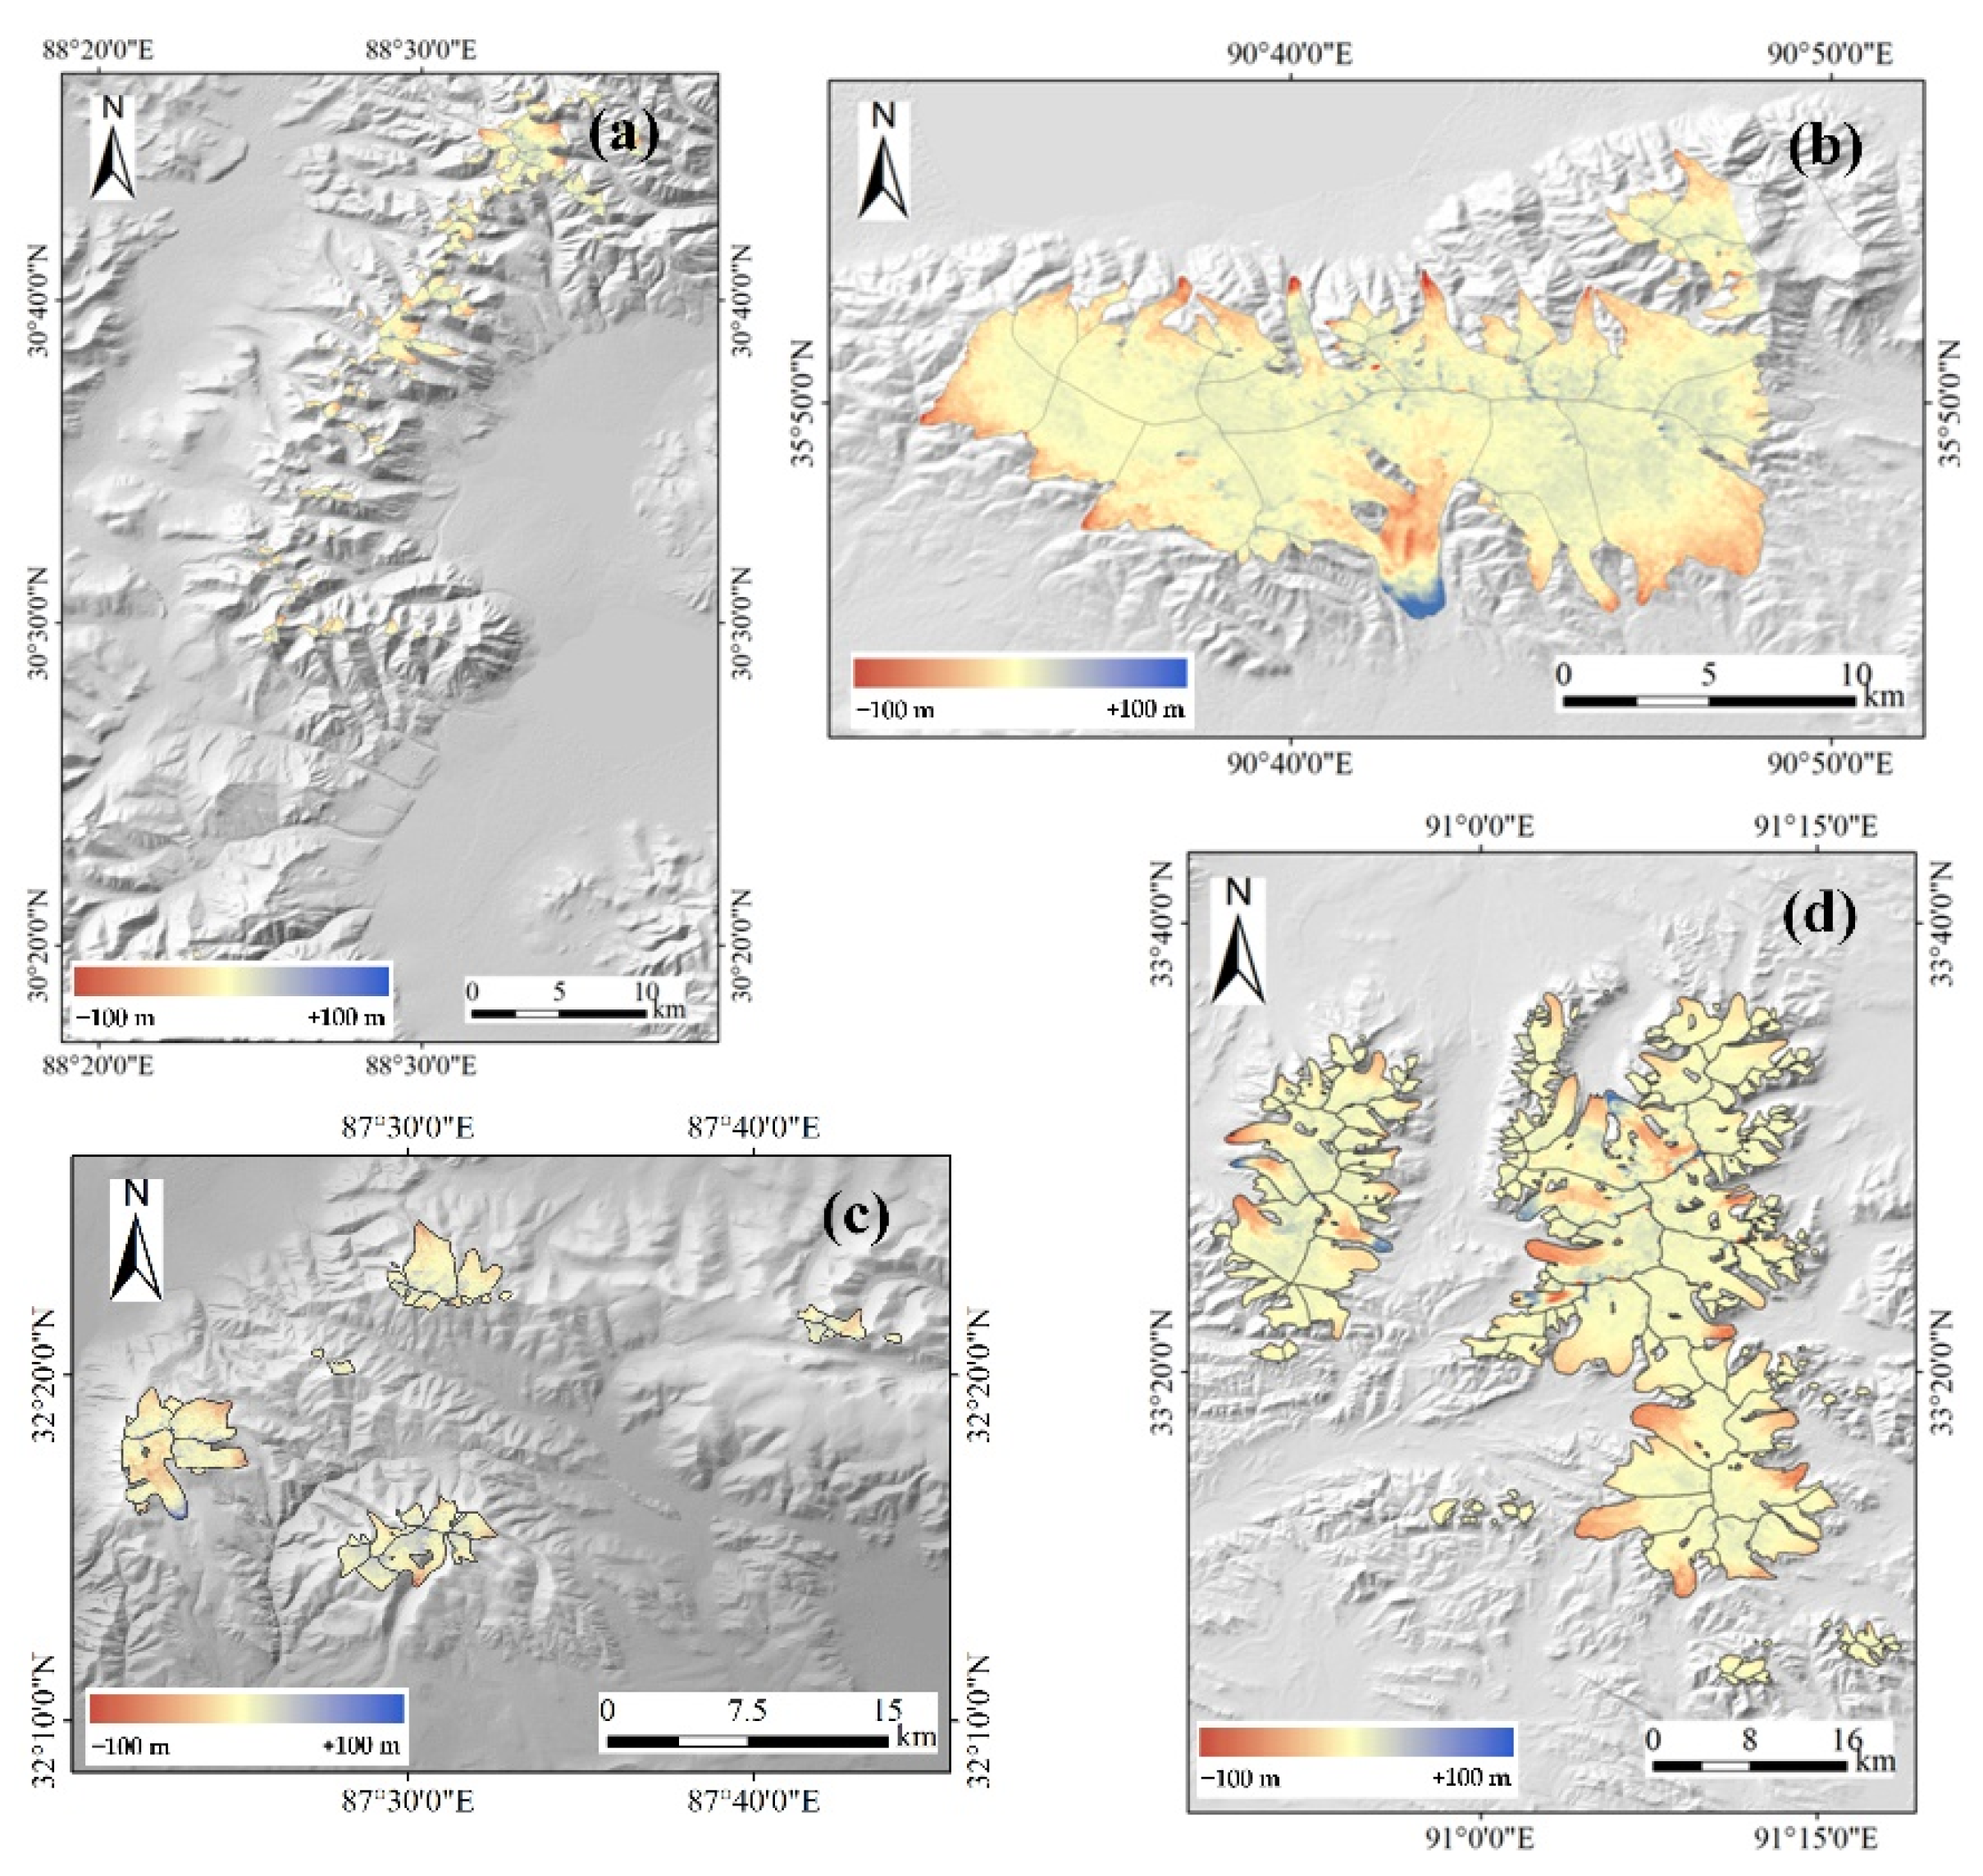
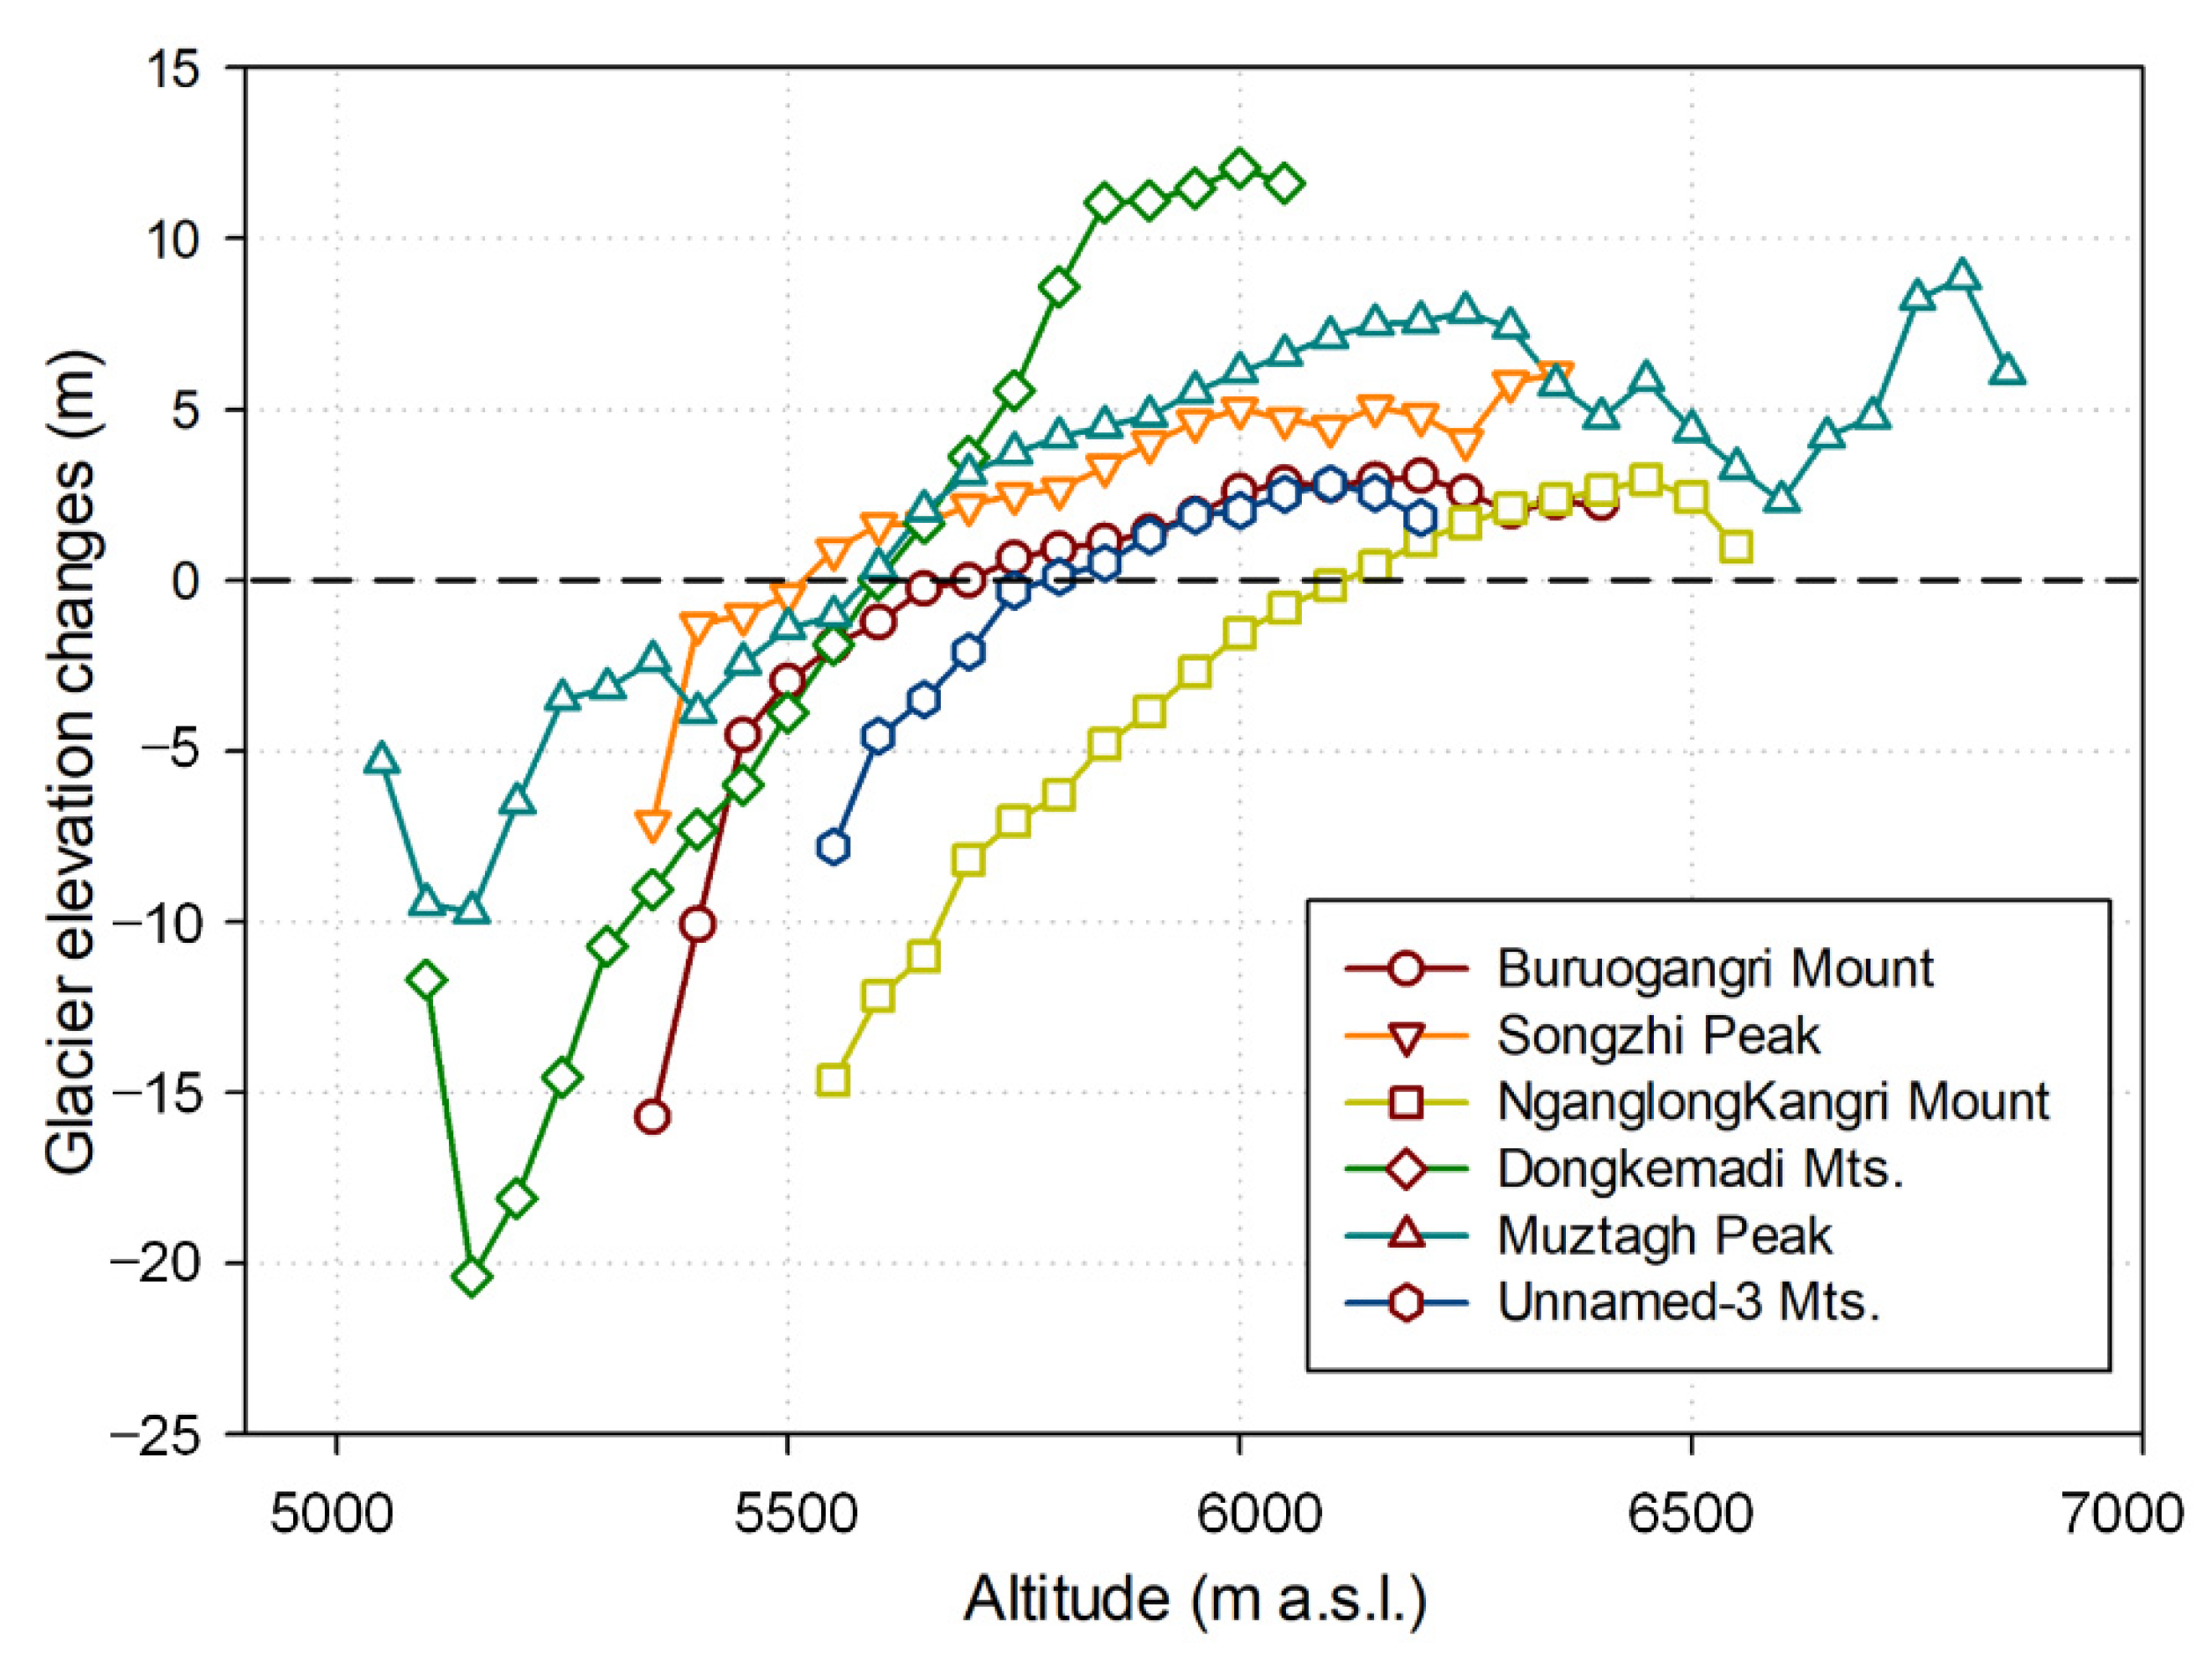
4.1. Glacier Elevation Changes
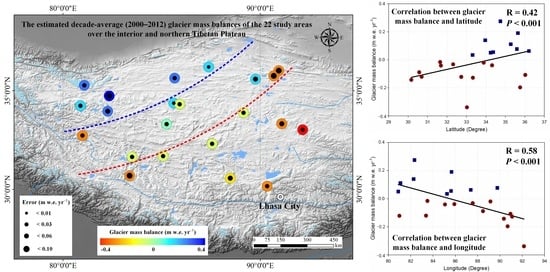
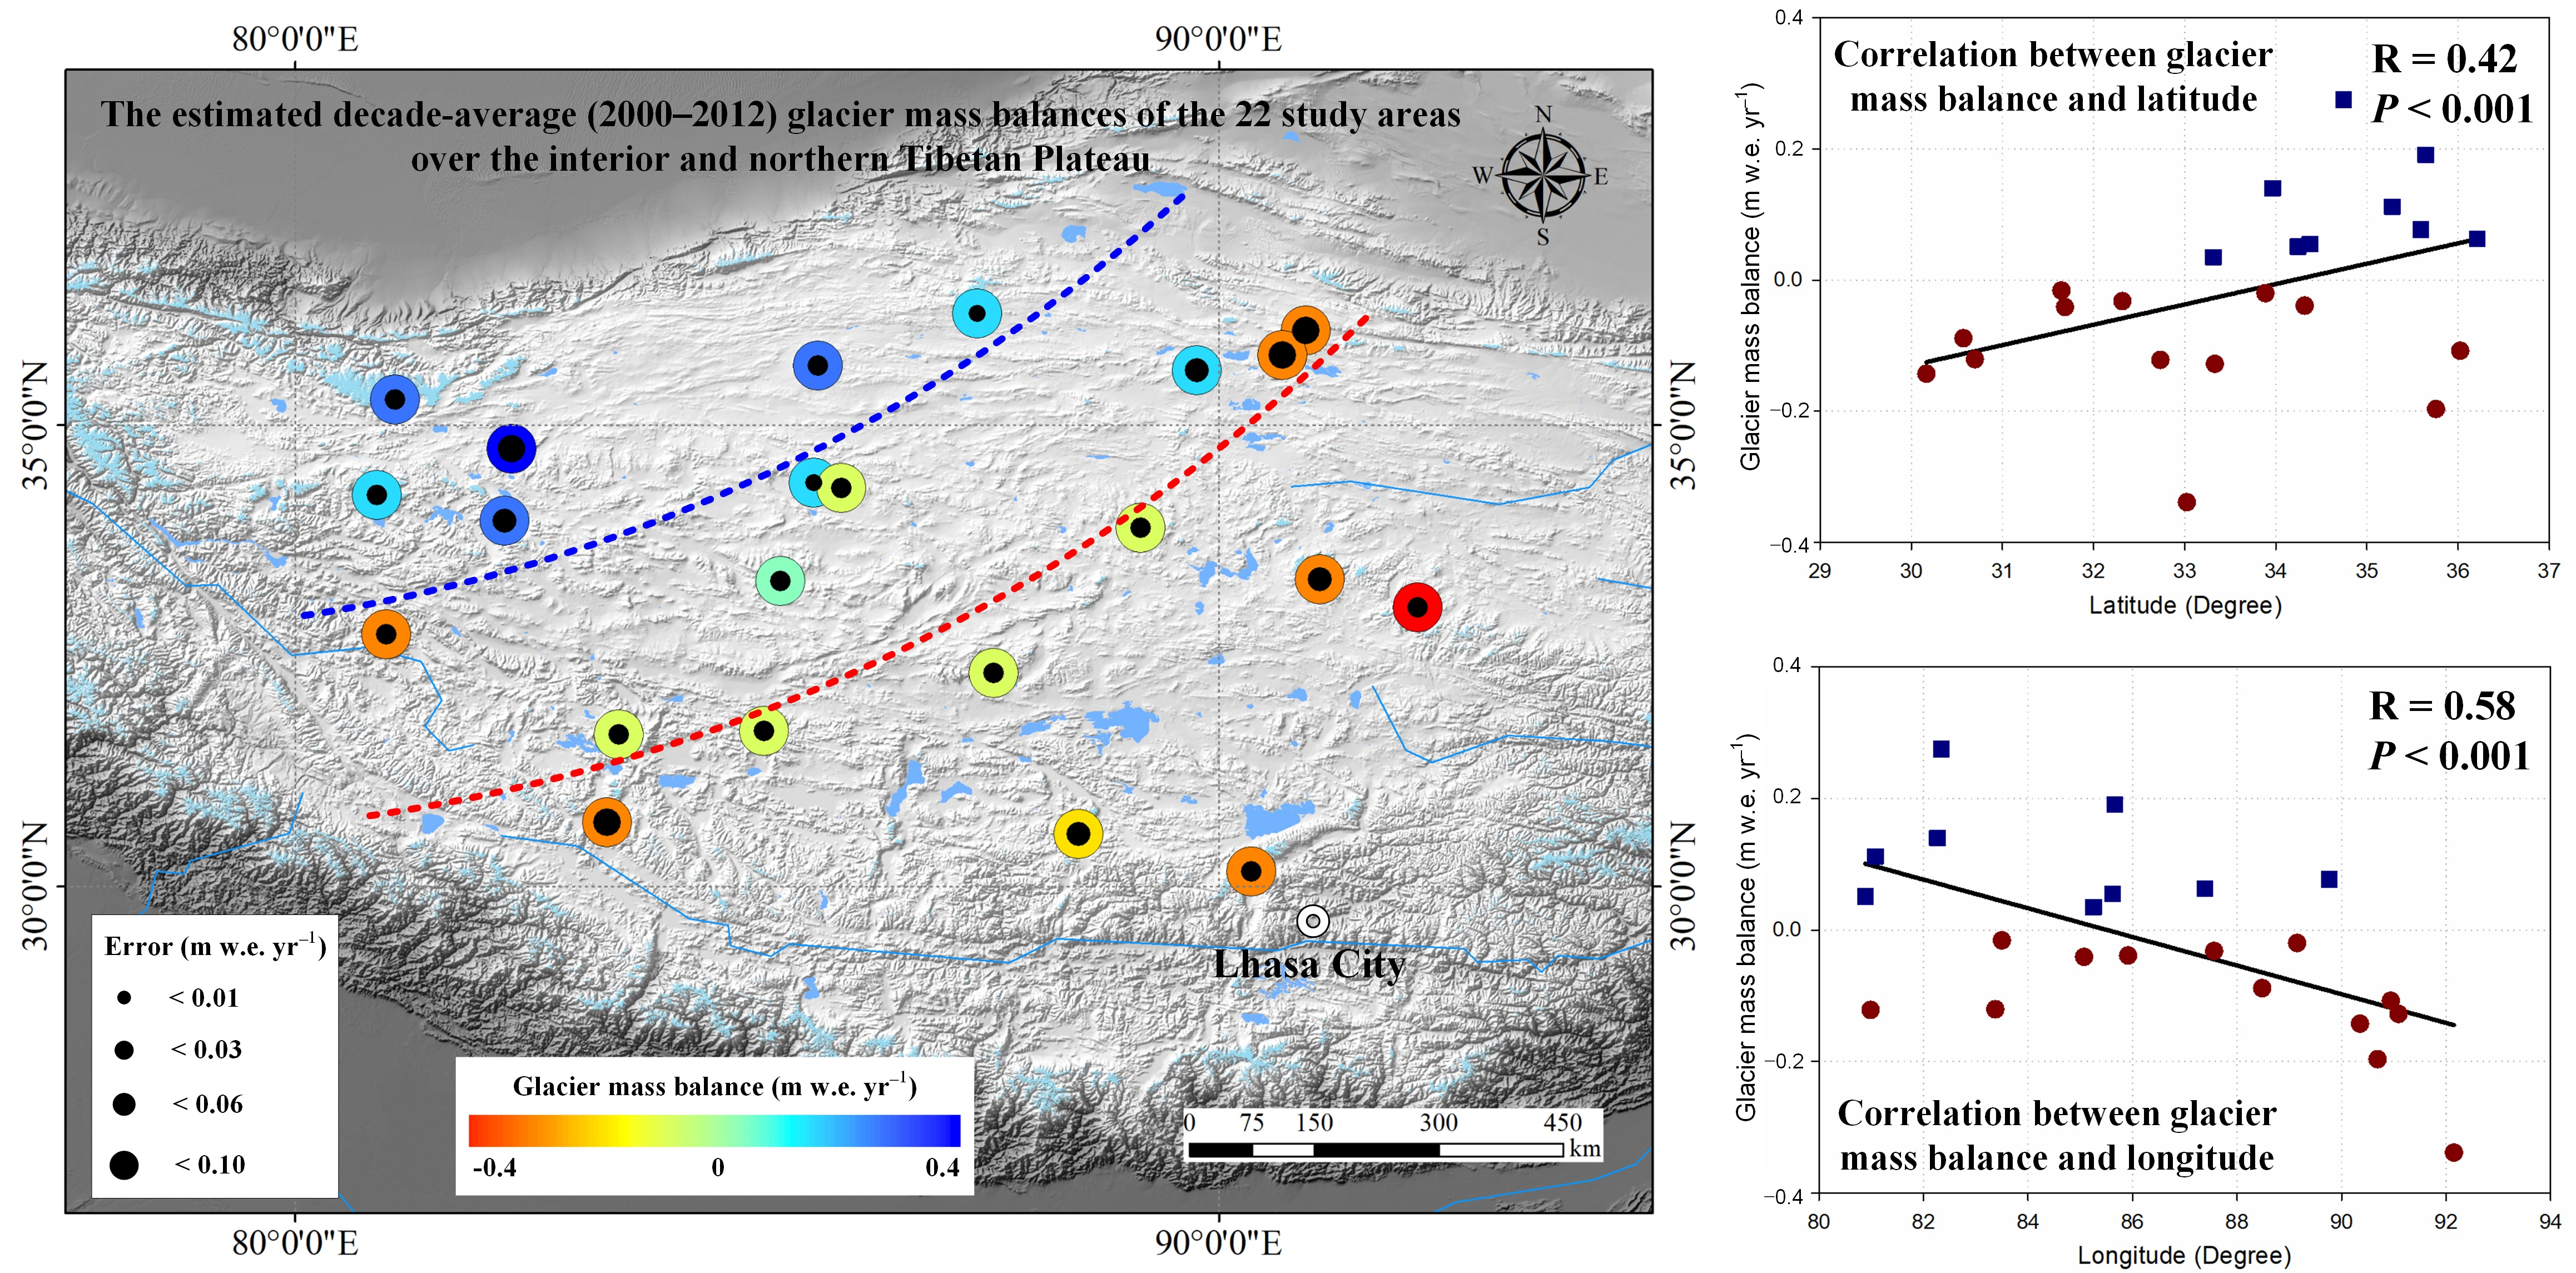
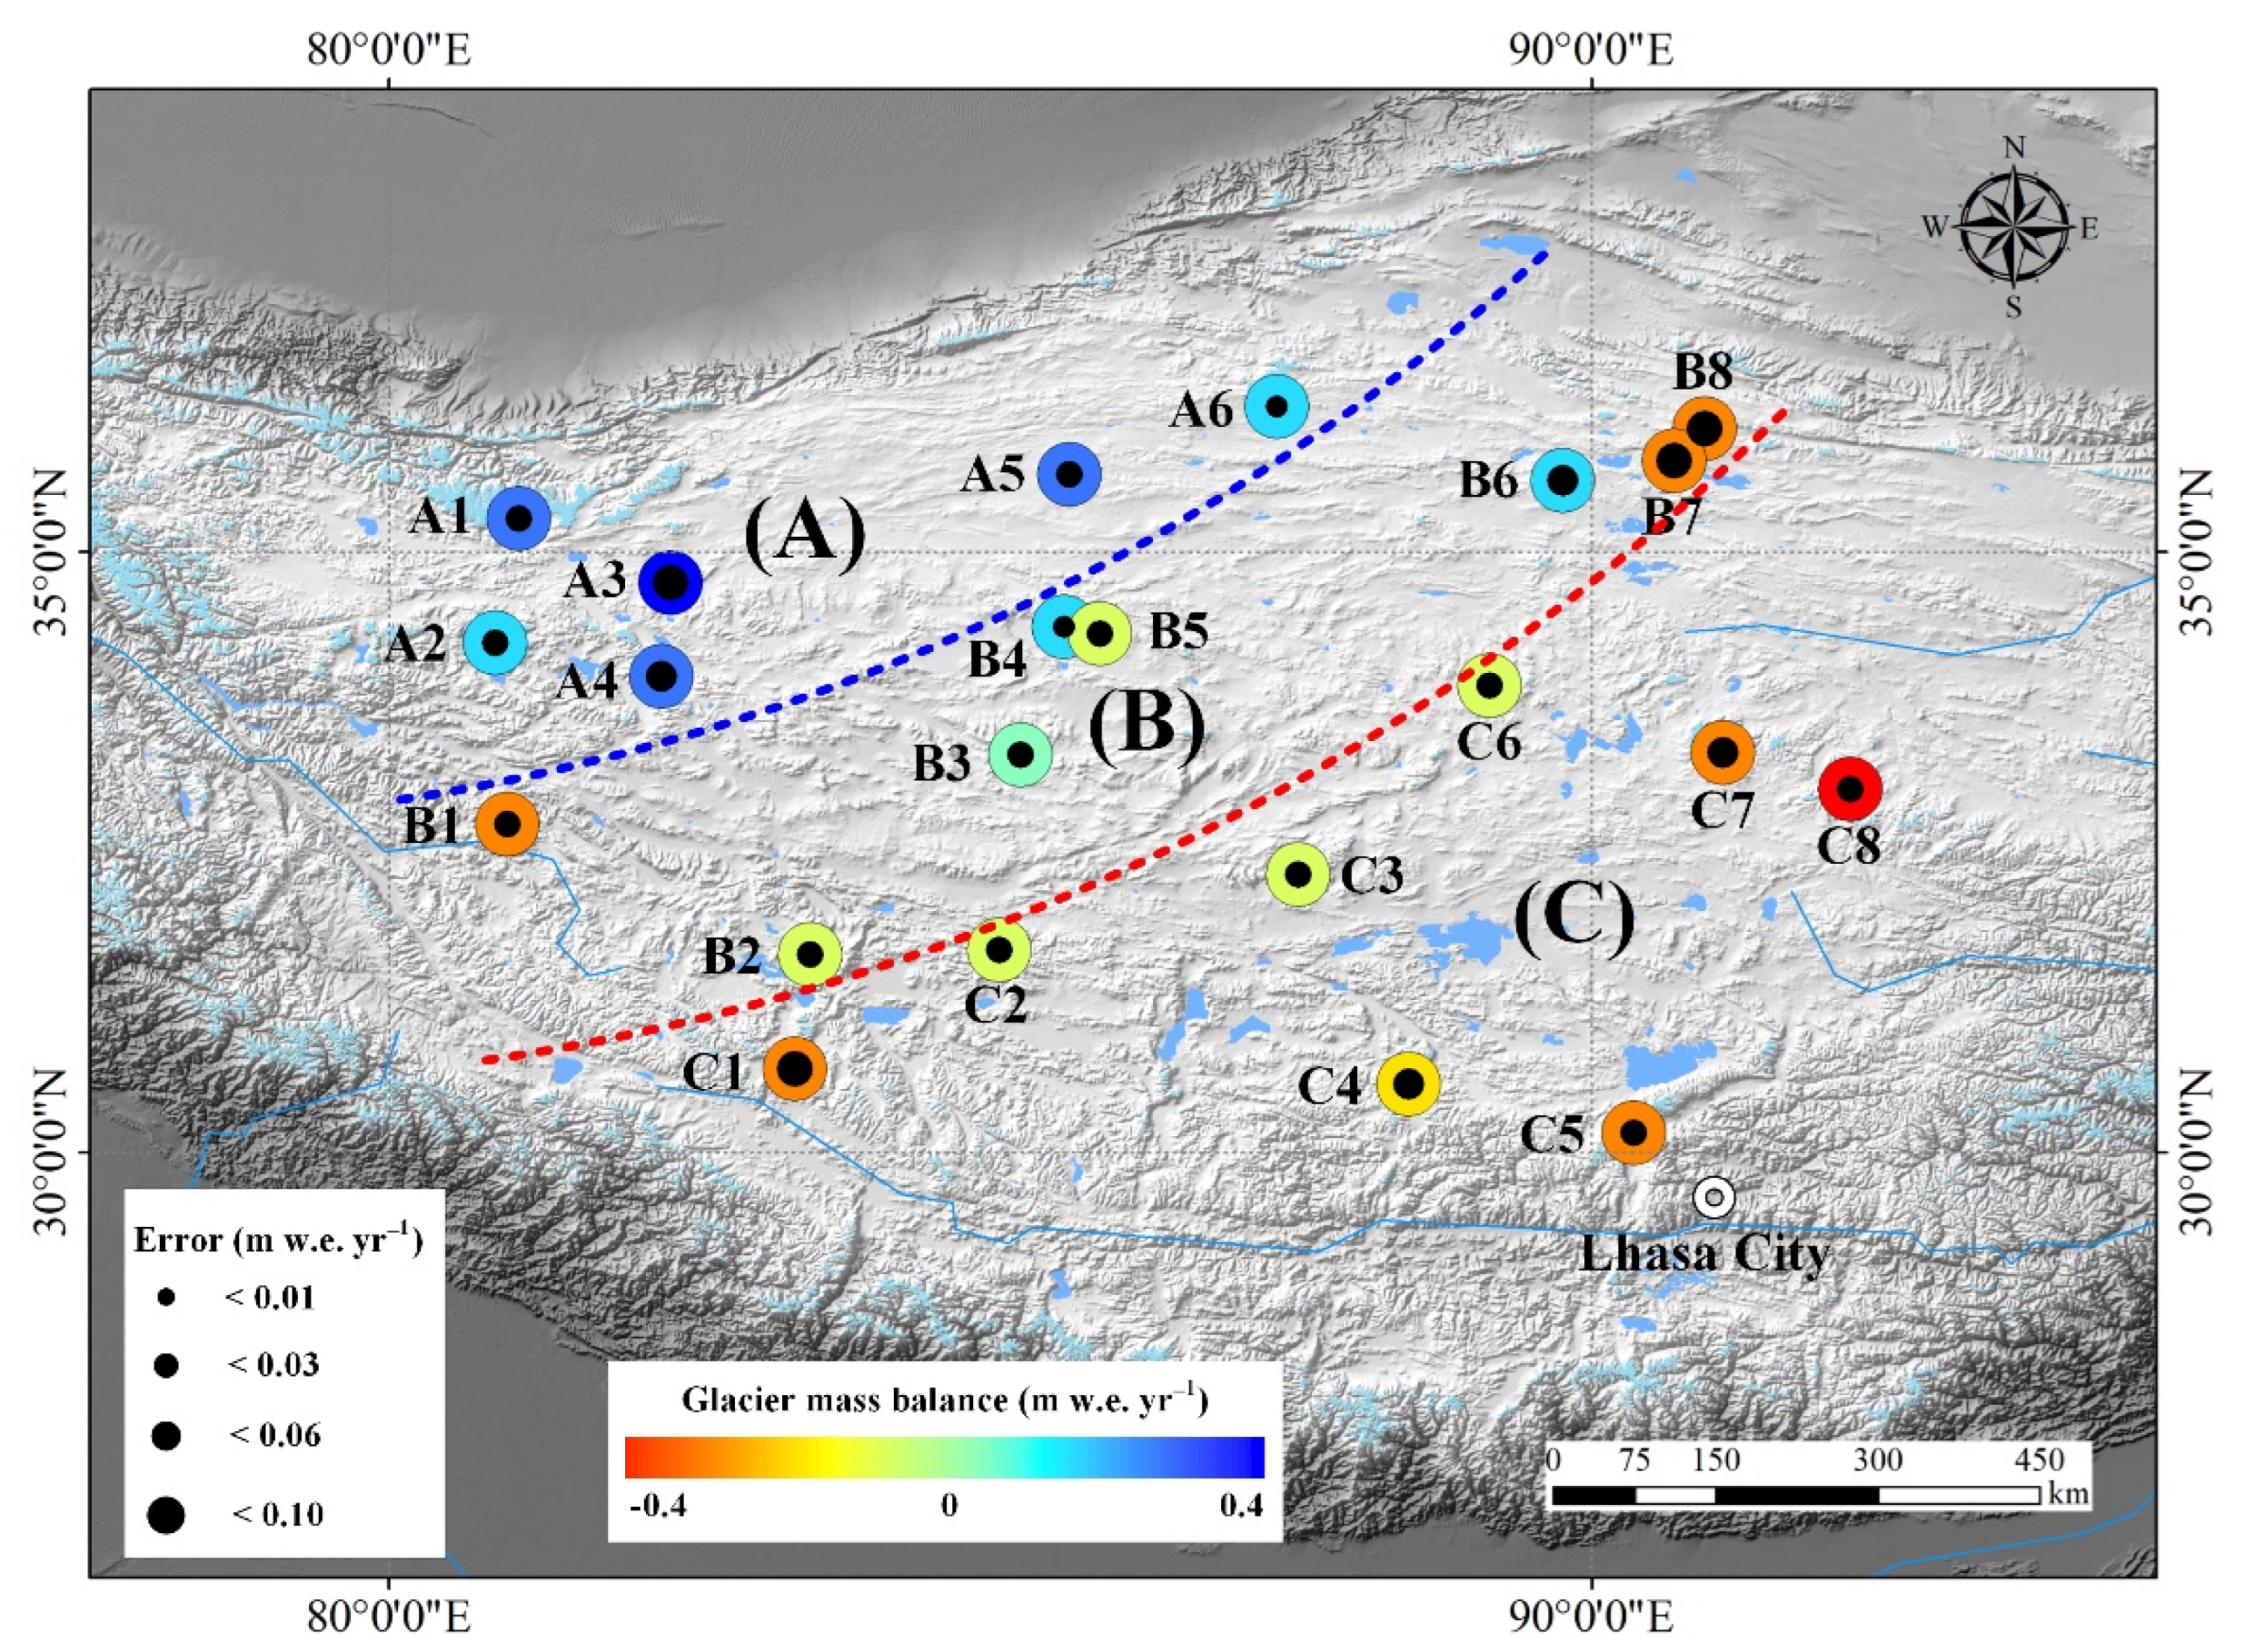
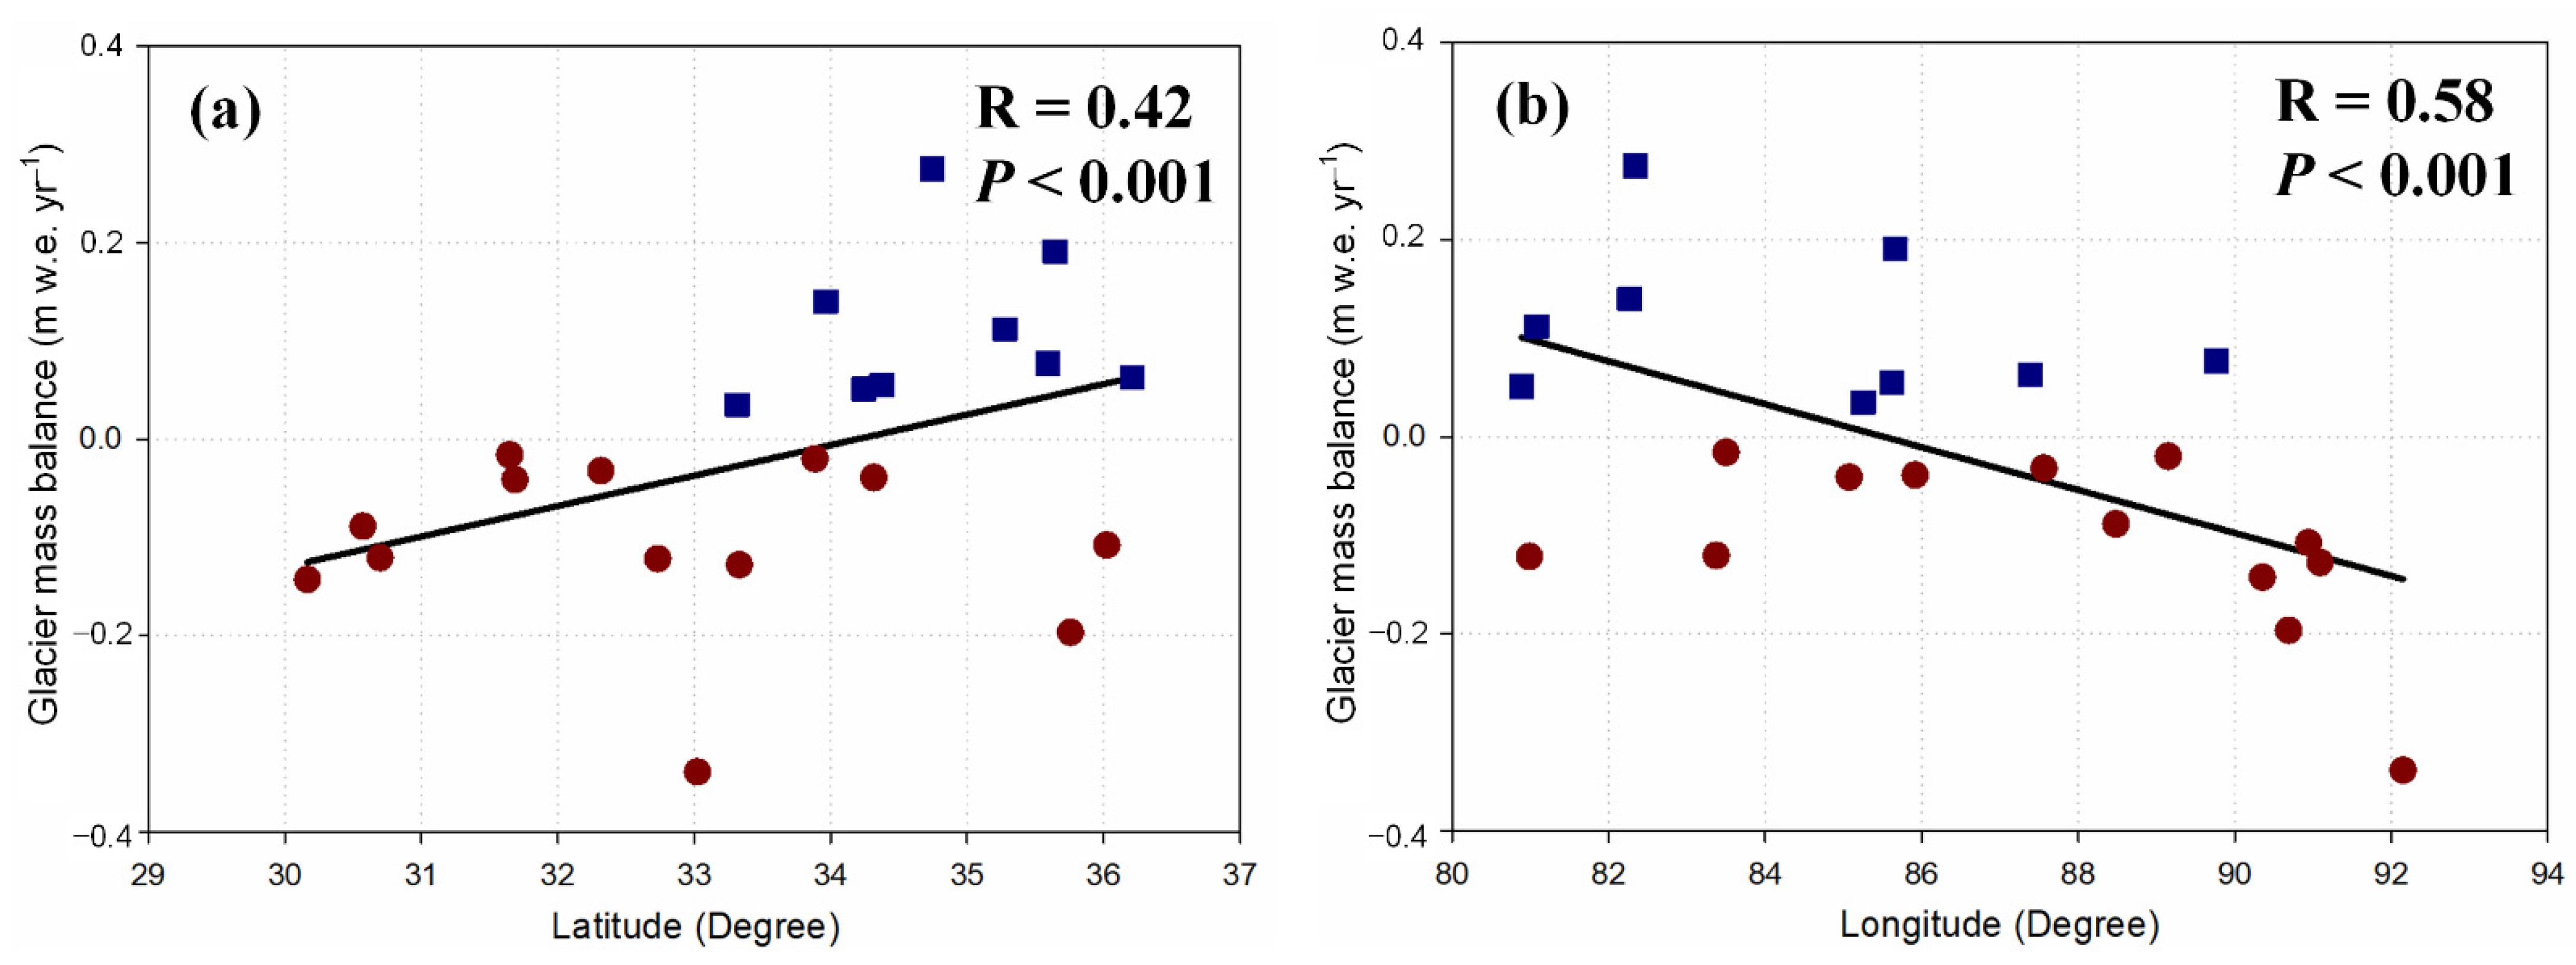
4.2. Spatial Variation in Glacier Mass Balances
5. Discussion
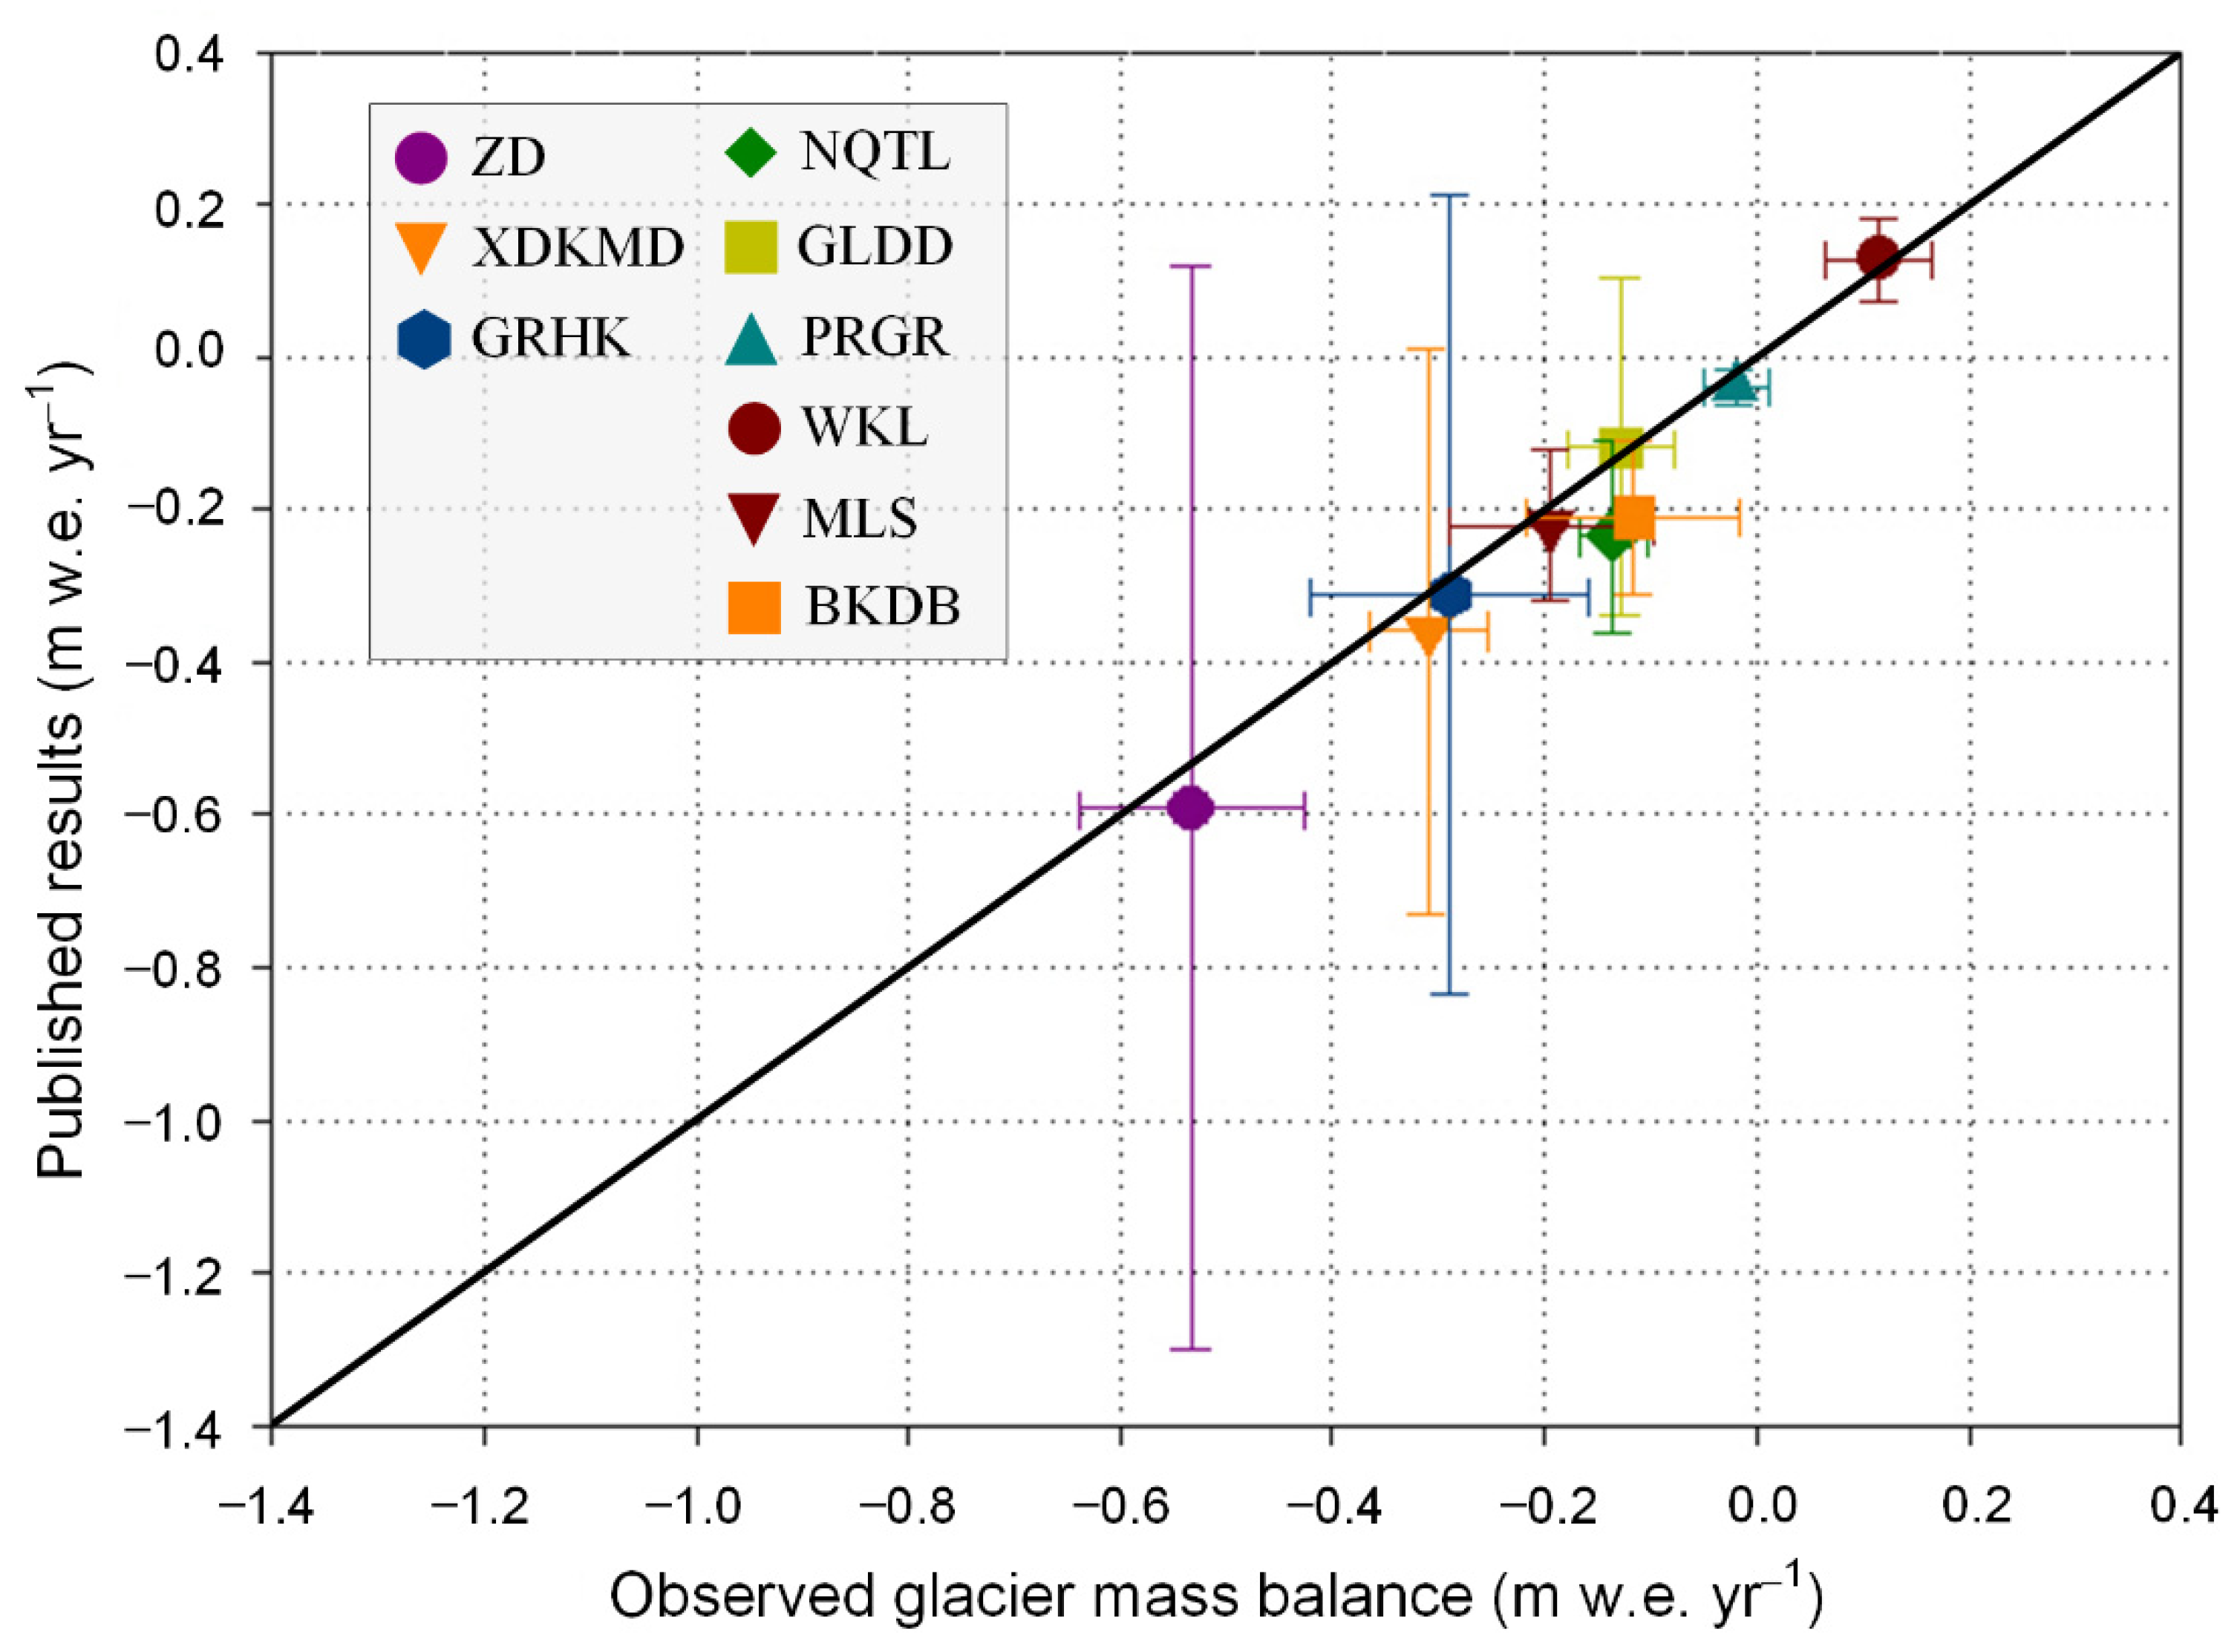
5.1. Comparison to Previously Published Estimates
5.2. Glacier Anomalous Regions in the HMA
5.3. Impact of Atmospheric Circulations in the TP
6. Conclusions
Author Contributions
Funding
Data Availability Statement
Acknowledgments
Conflicts of Interest
References
- Wouters, B.; Gardner, A.S.; Moholdt, G. Global glacier mass loss during the grace satellite mission (2002–2016). Front. Earth Sci. 2019, 7, 96. [Google Scholar] [CrossRef] [Green Version]
- Zemp, M.; Huss, M.; Thibert, E.; Eckert, N.; McNabb, R.; Huber, J.; Barandun, M.; Machguth, H.; Nussbaumer, S.U.; Gärtner-Roer, I.; et al. Global glacier mass changes and their contributions to sea-level rise from 1961 to 2016. Nature 2019, 568, 382–386. [Google Scholar] [CrossRef] [PubMed]
- Song, C.; Huang, B.; Richards, K.; Ke, L.; Hien Phan, V. Accelerated lake expansion on the Tibetan Plateau in the 2000s: Induced by glacial melting or other processes? Water Resour. Res. 2014, 50, 3170–3186. [Google Scholar] [CrossRef] [Green Version]
- Yao, T.; Li, Z.; Yang, W.; Guo, X.; Zhu, L.; Kang, S.; Wu, Y.; Yu, W. Glacial distribution and mass balance in the Yarlung Zangbo River and its influence on lakes. Chin. Sci. Bull. 2010, 55, 2072–2078. [Google Scholar] [CrossRef]
- Pritchard, H.D. Asia’s glaciers are a regionally important buffer against drought. Nature 2017, 545, 169–174. [Google Scholar] [CrossRef]
- Pritchard, H.D. Asia’s shrinking glaciers protect large populations from drought stress. Nature 2019, 569, 649–654. [Google Scholar] [CrossRef]
- Shean, D.E.; Bhushan, S.; Montesano, P.M.; Rounce, D.R.; Arendt, A.; Osmanoglu, B. A systematic, regional assessment of high mountain Asia glacier mass balance. Front. Earth Sci. 2020, 7, 363. [Google Scholar] [CrossRef] [Green Version]
- Gardelle, J.; Berthier, E.; Arnaud, Y. Slight mass gain of Karakoram glaciers in the early twenty-first century. Nat. Geosci. 2012, 5, 322–325. [Google Scholar] [CrossRef]
- Gardelle, J.; Berthier, E.; Arnaud, Y.; Kääb, A. Region-wide glacier mass balances over the Pamir-Karakoram-Himalaya during 1999–2011. Cryosphere 2013, 7, 1263–1286. [Google Scholar] [CrossRef] [Green Version]
- Lin, H.; Li, G.; Cuo, L.; Hooper, A.; Ye, Q. A decreasing glacier mass balance gradient from the edge of the Upper Tarim Basin to the Karakoram during 2000–2014. Sci. Rep. 2017, 7, 6712. [Google Scholar] [CrossRef]
- Kääb, A.; Treichler, D.; Nuth, C.; Berthier, E. Brief communication: Contending estimates of 2003–2008 glacier mass balance over the Pamir-Karakoram-Himalaya. Cryosphere 2015, 9, 557–564. [Google Scholar] [CrossRef] [Green Version]
- Zhou, Y.; Li, Z.; Li, J.; Zhao, R.; Ding, X. Glacier mass balance in the Qinghai-Tibet Plateau and its surroundings from the mid-1970s to 2000 based on Hexagon KH-9 and SRTM DEMs. Remote Sens. Environ. 2018, 210, 96–112. [Google Scholar] [CrossRef]
- Guo, W.; Liu, S.; Xu, J.; Wu, L.; Shangguan, D.; Yao, X.; Wei, J.; Bao, W.; Yu, P.; Liu, Q.; et al. The second Chinese glacier inventory: Data, methods and results. J. Glaciol. 2015, 61, 357–372. [Google Scholar] [CrossRef] [Green Version]
- Gardner, A.S.; Moholdt, G.; Cogley, J.G.; Wouters, B.; Arendt, A.A.; Wahr, J.; Berthier, E.; Hock, R.; Pfeffer, W.T.; Kaser, G.; et al. A reconciled estimate of glacier contributions to sea level rise: 2003 to 2009. Science 2013, 340, 852–857. [Google Scholar] [CrossRef] [PubMed] [Green Version]
- Treichler, D.S.; Kääb, A. Icesat laser altimetry over small mountain glaciers. Cryosphere 2016, 10, 2129–2146. [Google Scholar] [CrossRef] [Green Version]
- Neckel, N.; Kropáček, J.; Bolch, T.; Hochschild, V. Glacier mass changes on the Tibetan Plateau 2003–2009 derived from ICESat laser altimetry measurements. Environ. Res. Lett. 2014, 9, 014009. [Google Scholar] [CrossRef]
- Yao, T.; Thompson, L.; Yang, W.; Yu, W.; Gao, Y.; Guo, X.; Yang, X.; Duan, K.; Zhao, H.; Xu, B.; et al. Different glacier status with atmospheric circulations in Tibetan Plateau and surroundings. Nat. Clim. Chang. 2012, 2, 663–667. [Google Scholar] [CrossRef]
- Brun, F.; Berthier, E.; Wagnon, P.; Kääb, A.; Treichler, D. A spatially resolved estimate of High Mountain Asia glacier mass balances from 2000 to 2016. Nat. Geosci. 2017, 10, 668–673. [Google Scholar] [CrossRef] [Green Version]
- Berthier, E.; Arnaud, Y.; Kumar, R.; Ahmad, S.; Wagnon, P.; Chevallier, P. Remote sensing estimates of glacier mass balances in the Himachal Pradesh (western Himalaya, India). Remote Sens. Environ. 2007, 108, 327–338. [Google Scholar] [CrossRef] [Green Version]
- Wu, K.; Liu, S.; Jiang, Z.; Xu, J.; Wei, J.; Guo, W. Recent glacier mass balance and area changes in the Kangri Karpo Mountains from DEMs and glacier inventories. Cryosphere 2018, 12, 103–121. [Google Scholar] [CrossRef] [Green Version]
- Neckel, N.; Braun, A.; Kropáček, J.; Hochschild, V. Recent mass balance of the Purogangri Ice Cap, central Tibetan Plateau, by means of differential X-band SAR interferometry. Cryosphere 2013, 7, 1623–1633. [Google Scholar] [CrossRef] [Green Version]
- Liu, G.; Fan, J.; Zhao, F.; Mao, K.; Dou, C. Monitoring elevation change of glaciers on Geladandong Mountain using TanDEM-X SAR interferometry. J. Mt. Sci. 2017, 14, 859–869. [Google Scholar] [CrossRef]
- Li, G.; Lin, H. Recent decadal glacier mass balances over the western Nyainqentanglha Mountains and the increase in their melting contribution to Nam Co Lake measured by differential bistatic SAR interferometry. Glob. Planet. Chang. 2017, 149, 177–190. [Google Scholar] [CrossRef] [Green Version]
- Yao, T.; Masson-Delmotte, V.; Gao, J.; Yu, W.; Yang, X.; Risi, C.; Sturm, C.; Werner, M.; Zhao, H.; He, Y.; et al. A review of climatic controls on δ18o in precipitation over the Tibetan Plateau: Observations and simulations. Rev. Geophys. 2013, 51, 525–548. [Google Scholar] [CrossRef]
- Tian, L.; Yao, T.; MacClune, K.; White, J.W.C.; Schilla, A.; Vaughn, B.; Vachon, R.; Ichiyanagi, K. Stable isotopic variations in west China: A consideration of moisture sources. J. Geophys. Res. 2007, 112, D10112. [Google Scholar] [CrossRef]
- Maussion, F.; Scherer, D.; Mölg, T.; Collier, E.; Curio, J.; Finkelnburg, R. Precipitation seasonality and variability over the Tibetan Plateau as resolved by the high Asia reanalysis. J. Clim. 2014, 27, 1910–1927. [Google Scholar] [CrossRef] [Green Version]
- Jiang, L.; Nielsen, K.; Andersen, O.B.; Bauer-Gottwein, P. Monitoring recent lake level variations on the Tibetan Plateau using CryoSat-2 SARIn mode data. J. Hydrol. 2017, 544, 109–124. [Google Scholar] [CrossRef] [Green Version]
- Zhang, G.; Yao, T.; Xie, H.; Zhang, K.; Zhu, F. Lakes’ state and abundance across the Tibetan Plateau. Chin. Sci. Bull. 2014, 59, 3010–3021. [Google Scholar] [CrossRef]
- Zhang, G.; Xie, H.; Kang, S.; Yi, D.; Ackley, S.F. Monitoring lake level changes on the Tibetan Plateau using ICESat altimetry data (2003–2009). Remote Sens. Environ. 2011, 115, 1733–1742. [Google Scholar] [CrossRef]
- Lei, Y.; Yao, T.; Bird, B.W.; Yang, K.; Zhai, J.; Sheng, Y. Coherent lake growth on the central Tibetan Plateau since the 1970s: Characterization and attribution. J. Hydrol. 2013, 483, 61–67. [Google Scholar] [CrossRef]
- Wei, J.; Liu, S.; Guo, W.; Yao, X.; Xu, J.; Bao, W.; Jiang, Z. Surface-area changes of glaciers in the Tibetan Plateau interior area since the 1970s using recent Landsat images and historical maps. Ann. Glaciol. 2014, 55, 213–222. [Google Scholar]
- Zhou, Y.; Hu, J.; Li, Z.; Li, J.; Zhao, R.; Ding, X. Quantifying glacier mass change and its contribution to lake growths in central Kunlun during 2000–2015 from multi-source remote sensing data. J. Hydrol. 2019, 570, 38–50. [Google Scholar] [CrossRef]
- Liu, L.; Jiang, L.; Sun, Y.; Yi, C.; Wang, J.; Hsu, H. Glacier elevation changes (2012–2016) of the Puruogangri Ice Field on the Tibetan Plateau derived from bi-temporal TanDEM-X InSAR data. Int. J. Remote Sens. 2016, 37, 5687–5707. [Google Scholar] [CrossRef]
- Rabus, B.; Eineder, M.; Roth, A.; Bamler, R. The shuttle radar topography mission—a new class of digital elevation models acquired by spaceborne radar. ISPRS J. Photogramm. Remote Sens. 2003, 57, 241–262. [Google Scholar] [CrossRef]
- Nuth, C.; Kääb, A. Co-registration and bias corrections of satellite elevation data sets for quantifying glacier thickness change. Cryosphere 2011, 5, 271–290. [Google Scholar] [CrossRef] [Green Version]
- Berthier, E.; Arnaud, Y.; Baratoux, D.; Vincent, C.; Rémy, F. Recent rapid thinning of the “Mer de Glace” glacier derived from satellite optical images. Geophys. Res. Lett. 2004, 31, L17401. [Google Scholar] [CrossRef] [Green Version]
- Huss, M. Density assumptions for converting geodetic glacier volume change to mass change. Cryosphere 2013, 7, 877–887. [Google Scholar] [CrossRef] [Green Version]
- Kääb, A.; Berthier, E.; Nuth, C.; Gardelle, J.; Arnaud, Y. Contrasting patterns of early twenty-first-century glacier mass change in the Himalayas. Nature 2012, 488, 495–498. [Google Scholar] [CrossRef]
- Liu, L.; Jiang, L.; Jiang, H.; Wang, H.; Ma, N.; Xu, H. Accelerated glacier mass loss (2011–2016) over the Puruogangri Ice Field in the inner Tibetan Plateau revealed by bistatic InSAR measurements. Remote Sens. Environ. 2019, 231, 111241. [Google Scholar] [CrossRef]
- Lambrecht, A.; Mayer, C.; Wendt, A.; Floricioiu, D.; Völksen, C. Elevation change of Fedchenko Glacier, Pamir Mountains, from GNSS field measurements and TanDEM-X elevation models, with a focus on the upper glacier. J. Glaciol. 2018, 64, 637–648. [Google Scholar] [CrossRef] [Green Version]
- Li, S.; Yao, T.; Yang, W.; Yu, W.; Zhu, M. Glacier energy and mass balance in the inland Tibetan Plateau: Seasonal and interannual variability in relation to atmospheric changes. J. Geophys. Res. 2018, 123, 6390–6409. [Google Scholar] [CrossRef]
- Liu, L.; Jiang, L.; Zhang, Z.; Wang, H.; Ding, X. Recent accelerating glacier mass loss of the Geladandong Mountain, inner Tibetan Plateau, estimated from ZiYuan-3 and TanDEM-X measurements. Remote Sens. 2020, 12, 472. [Google Scholar] [CrossRef] [Green Version]
- Guo, W.; Liu, S.; Wei, J.; Bao, W. The 2008/09 surge of central Yulinchuan Glacier, northern Tibetan Plateau, as monitored by remote sensing. Ann. Glaciol. 2013, 54, 299–310. [Google Scholar] [CrossRef]
- Huintjes, E.; Neckel, N.; Hochschild, V.; Schneider, C. Surface energy and mass balance at Purogangri Ice Cap, central Tibetan Plateau, 2001–2011. J. Glaciol. 2015, 61, 1048–1060. [Google Scholar] [CrossRef] [Green Version]
- Ke, L.; Song, C.; Yong, B.; Lei, Y.; Ding, X. Which heterogeneous glacier melting patterns can be robustly observed from space? A multi-scale assessment in southeastern Tibetan Plateau. Remote Sens. Environ. 2020, 242, 111777. [Google Scholar] [CrossRef]
- Zhang, Z.; Jiang, L.; Liu, L.; Sun, Y.; Wang, H. Annual glacier-wide mass balance (2000–2016) of the interior Tibetan Plateau reconstructed from MODIS albedo products. Remote Sens. 2018, 10, 1031. [Google Scholar] [CrossRef] [Green Version]
- Shi, Y. Characteristics of late Quaternary monsoonal glaciation on the Tibetan Plateau and in East Asia. Quat. Int. 2002, 97, 79–91. [Google Scholar] [CrossRef]
- Chen, F.; Chen, J.; Holmes, J.; Boomer, I.; Austin, P.; Gates, J.B.; Wang, N.; Brooks, S.J.; Zhang, J. Moisture changes over the last millennium in arid central Asia: A review, synthesis and comparison with monsoon region. Quat. Sci. Rev. 2010, 29, 1055–1068. [Google Scholar] [CrossRef]
- Johnson, K.R.; Ingram, B.L. Spatial and temporal variability in the stable isotope systematics of modern precipitation in China: Implications for paleoclimate reconstructions. Earth Planet. Sci. Lett. 2004, 220, 365–377. [Google Scholar] [CrossRef] [Green Version]
- Bookhagen, B.; Burbank, D.W. Toward a complete Himalayan hydrological budget: Spatiotemporal distribution of snowmelt and rainfall and their impact on river discharge. J. Geophys. Res. 2010, 115, F03019. [Google Scholar] [CrossRef] [Green Version]
- Mölg, T.; Maussion, F.; Scherer, D. Mid-latitude westerlies as a driver of glacier variability in monsoonal high Asia. Nat. Clim. Chang. 2014, 4, 68–73. [Google Scholar] [CrossRef]
- Yang, M.; Yao, T.; Wang, H.; Tian, L.; Gou, X. Estimating the criterion for determining water vapour sources of summer precipitation on the northern Tibetan Plateau. Hydrol. Process. 2006, 20, 505–513. [Google Scholar] [CrossRef]
- Curio, J.; Maussion, F.; Scherer, D. A 12-year high-resolution climatology of atmospheric water transport over the Tibetan Plateau. Earth Syst. Dyn. 2015, 6, 109–124. [Google Scholar] [CrossRef] [Green Version]


| Name of Study Site | No. of Study Site in Figure 1 | DEM in 2000 | TanDEM InSAR Data (Pair) |
|---|---|---|---|
| Western Kunlun Mts. | 1 | SRTM-C DEM | 1 |
| Tozekangri Mount | 2 | SRTM-C DEM | 1 |
| Songzhi Peak | 3 | SRTM-X DEM | 1 |
| Muztagh Peak | 4 | SRTM-X DEM | 1 |
| Jinyanggangri Mount | 5 | SRTM-C DEM | 1 |
| Malan Mount | 6 | SRTM-C DEM | 2 |
| Bukadaban Peak | 7 | SRTM-C DEM | 1 |
| Unnamed-1 Mts. | 8 | SRTM-C DEM | 1 |
| Unnamed-2 Mts. | 9 | SRTM-C DEM | 1 |
| Buruogangri Mount | 10 | SRTM-X DEM | 6 |
| Zangsegangri Mount | 11 | SRTM-C DEM | 1 |
| Puruogangri Ice Field | 12 | SRTM-C DEM | 2 |
| Geladandong Mts. | 13 | SRTM-C DEM | 1 |
| Dongkemadi Mts. | 14 | SRTM-X DEM | 1 |
| NganglongKangri Mount | 15 | SRTM-X DEM | 2 |
| Unnamed-3 Mts. | 16 | SRTM-X DEM | 3 |
| Unnamed-4 Mts. | 17 | SRTM-C DEM | 1 |
| Gangdisi Mts. | 18 | SRTM-C DEM | 3 |
| Unnamed-5 Mts. | 19 | SRTM-C DEM | 1 |
| Unnamed-6 Mts. | 20 | SRTM-C DEM | 1 |
| Unnamed-7 Mts. | 21 | SRTM-C DEM | 1 |
| Nainqentanglha Mts. | 22 | SRTM-C DEM | 1 |
| No. | Study Site | Mean Elevation Change (m) | Penetration Correction (m) | Seasonal Correction (m w.e.) | Mass Balance (m w.e. yr−1) |
|---|---|---|---|---|---|
| A1 | Western Kunlun Mts. | 4.11 ± 0.37 | 2.67 ± 0.46 | 0.15 ± 0.15 | 0.116 ± 0.050 |
| A2 | Unnamed-1 Mts. | 2.83 ± 0.20 | 1.83 ± 0.53 | −0.04 ± 0.04 | 0.058 ± 0.037 |
| A3 | Tozekangri Mount | 4.96 ± 0.37 | 2.35 ± 1.12 | 0.00 ± 0.10 | 0.237 ± 0.078 |
| A4 | Unnamed-2 Mts. | 4.50 ± 0.28 | 2.35 ± 0.56 | −0.12 ± 0.12 | 0.131 ± 0.048 |
| A5 | Songzhi Peak | 2.70 ± 0.56 | N/A | N/A | 0.191 ± 0.042 |
| A6 | Muztagh Peak | 1.03 ± 0.27 | N/A | 0.00 ± 0.10 | 0.063 ± 0.019 |
| B1 | NganglongKangri Mount | −1.49 ± 0.30 | N/A | 0.00 ± 0.10 | −0.106 ± 0.024 |
| B2 | Unnamed-4 Mts. | 1.13 ± 0.18 | 1.39 ± 0.51 | N/A | −0.016 ± 0.032 |
| B3 | Unnamed-3 Mts. | 0.46 ± 0.15 | N/A | −0.03 ± 0.03 | 0.033 ± 0.012 |
| B4 | Buruogangri Mount | 0.78 ± 0.22 | N/A | N/A | 0.055 ± 0.016 |
| B5 | Zangsegangri Mount | 2.27 ± 0.21 | 2.79 ± 0.46 | −0.03 ± 0.03 | −0.036 ± 0.037 |
| B6 | Jinyanggangri Mount | 3.13 ± 0.28 | 2.05 ± 0.68 | 0.00 ± 0.10 | 0.077 ± 0.056 |
| B7 | Malan Mount | −0.65 ± 0.10 | 2.05 ± 1.36 | −0.03 ± 0.03 | −0.194 ± 0.097 |
| B8 | Bukadaban Peak | 0.76 ± 0.13 | 2.05 ± 1.36 | −0.30 ± 0.30 | −0.116 ± 0.101 |
| C1 | Gangdisi Mts. | −0.60 ± 0.16 | 1.39 ± 1.02 | N/A | −0.121 ± 0.063 |
| C2 | Unnamed-5 Mts. | 0.72 ± 0.18 | 1.39 ± 1.02 | N/A | −0.041 ± 0.063 |
| C3 | Unnamed-6 Mts. | 1.70 ± 0.26 | 2.23 ± 0.66 | N/A | −0.032 ± 0.045 |
| C4 | Unnamed-7 Mts. | 0.12 ± 0.27 | 1.58 ± 0.82 | N/A | −0.089 ± 0.053 |
| C5 | Nainqentanglha Mts. | −0.44 ± 0.32 | 1.58 ± 0.41 | 0.00 ± 0.10 | −0.135 ± 0.033 |
| C6 | Puruogangri Ice Field | 1.95 ± 0.20 | 2.23 ± 0.33 | N/A | −0.020 ± 0.031 |
| C7 | Geladandong Mts. | 0.43 ± 0.13 | 2.23 ± 0.66 | 0.00 ± 0.10 | −0.128 ± 0.050 |
| C8 | Dongkemadi Mts. | −4.79 ± 0.46 | N/A | N/A | −0.339 ± 0.040 |
Publisher’s Note: MDPI stays neutral with regard to jurisdictional claims in published maps and institutional affiliations. |
© 2022 by the authors. Licensee MDPI, Basel, Switzerland. This article is an open access article distributed under the terms and conditions of the Creative Commons Attribution (CC BY) license (https://creativecommons.org/licenses/by/4.0/).
Share and Cite
Liu, L.; Jiang, L.; Wang, H.; Sun, Y. Existence of Glacier Anomaly in the Interior and Northern Tibetan Plateau between 2000 and 2012. Remote Sens. 2022, 14, 2962. https://doi.org/10.3390/rs14132962
Liu L, Jiang L, Wang H, Sun Y. Existence of Glacier Anomaly in the Interior and Northern Tibetan Plateau between 2000 and 2012. Remote Sensing. 2022; 14(13):2962. https://doi.org/10.3390/rs14132962
Chicago/Turabian StyleLiu, Lin, Liming Jiang, Hansheng Wang, and Yafei Sun. 2022. "Existence of Glacier Anomaly in the Interior and Northern Tibetan Plateau between 2000 and 2012" Remote Sensing 14, no. 13: 2962. https://doi.org/10.3390/rs14132962
APA StyleLiu, L., Jiang, L., Wang, H., & Sun, Y. (2022). Existence of Glacier Anomaly in the Interior and Northern Tibetan Plateau between 2000 and 2012. Remote Sensing, 14(13), 2962. https://doi.org/10.3390/rs14132962