Article

Satellite-Based Estimation of the Influence of Land Use and Cover Change on the Surface Shortwave Radiation Budget in a Humid Basin

1
School of Geosciences and Info-Physics, Central South University, Changsha 410083, China
2
Key Laboratory of Metallogenic Prediction of Nonferrous Metals and Geological Environment Monitoring of Chinese Ministry of Education, Changsha 410083, China
3
Key Laboratory of Agro-Ecological Processen Subtropical Region, Institute of Subtropical Agriculture, Chinese Academy of Sciences, Changsha 410125, China
4
Dongting Lake Station for Wetland Ecosystem Research, Institute of Subtropical Agriculture, Chinese Academy of Sciences, Changsha 410125, China
5
Yellow River Institute of Hydraulic Research, Yellow River Conservancy Commission, MWR Key Laboratory of Soil and Water Loss Process and Control in the Loess Plateau, Zhengzhou 450003, China
*
Author to whom correspondence should be addressed.
Remote Sens. 2021, 13(8), 1447; https://doi.org/10.3390/rs13081447
Submission received: 8 March 2021 / Revised: 2 April 2021 / Accepted: 6 April 2021 / Published: 8 April 2021
(This article belongs to the Special Issue Advanced Phenology, and Land Cover and Land Use Change Studies)

Abstract

:
The surface shortwave radiation budget (Rsn) is one of the main drivers of Earth’s ecosystems and varies with atmospheric and surface conditions. Land use and cover change (LUCC) alters radiation through biogeophysical effects. However, due to the complex interactions between atmospheric and surface factors, it is very challenging to quantify the sole impacts of LUCC. Based on satellite data from the Global Land Surface Satellite (GLASS) Product and Moderate Resolution Imaging Spectroradiometer (MODIS) instruments, this study introduces an observation-based approach for detecting LUCC influences on the Rsn by examining a humid basin over the Dongting Lake Basin, China from 2001 to 2015. Our results showed that the Rsn of the study area presented a decreasing trend due to the combined effects of LUCC and climate change. Generally, LUCC contributed −0.45 W/m2 to Rsn at the basin scale, which accounted for 2.53% of the total Rsn change. Furthermore, the LUCC contributions reached −0.69 W/m2, 0.21 W/m2, and −0.41 W/m2 in regions with land transitions of forest→grass, grass→forest, and grass→farmland, which accounted for 5.38%, −4.68%, and 2.40% of the total Rsn change, respectively. Physically, LUCC affected surface radiation by altering the surface properties. Specifically, LUCC induced albedo changes of +0.0039 at the basin scale and +0.0061, −0.0020, and +0.0036 in regions with land transitions of forest→grass, grass→forest, and grass→farmland, respectively. Our findings revealed the impact and process of LUCC on the surface radiation budget, which could support the understanding of the physical mechanisms of LUCC’s impact on ecosystems.

1. Introduction

Land use and cover change (LUCC) mainly refers to surface modification activities carried out by humans to satisfy their needs [1]. With the rapid development of social and population expansion [2], more than 70% of ice-free land globally has been modified [3], which exerts significant impacts on global and regional ecosystems by modifying land surface properties [4,5]. One of the most important effects is the impact on the surface shortwave radiation budget (Rsn), which strongly influences hydrological cycles [6,7,8], atmospheric circulation [9,10], vegetation production [11,12], and carbon sinks [13] by affecting the key parameters of evapotranspiration, surface–air differences, and leaf photosynthesis. The quantification of the influence of LUCC on radiation has resulted in significant interest from researchers [14,15,16].
As the main source of energy for the ecosystem, the surface shortwave radiation budget (Rsn) is influenced by surface and atmospheric factors [16]. Specifically, LUCC can directly affect upward shortwave radiation by altering the surface albedo [15]. Atmospheric components, including clouds and aerosols, can reduce radiation reaching the surface by reflecting, absorbing, and scatting solar radiation [17,18]. Moreover, LUCC can disturb atmospheric constituents through biogeophysical processes [19,20,21,22], so that LUCC can influence cloud formation by transpiration regulation and disturb the concentrations of aerosols through air pollution emissions [23] and, subsequently, downward radiation [24,25,26]. Due to the complexity of Earth’s system, however, the Rsn is affected by nonlinear interactions between the surface and atmospheric factors, and a single factor cannot explain the full variations in radiation [27]. These complex interactions lead to difficulties in isolating the influence of a single factor on the Rsn, and the separation of the influences on LUCC remains a great challenge.
Several works have been conducted to evaluate the LUCC influences on the Rsn by using climate models [20]. However, the models contain unavoidable uncertainties, which originate from the initial conditions, model errors, and prediction scenarios [28], resulting in various LUCC influences that range from −0.20 W/m2 to −0.05 W/m2 in different models [29,30]. Moreover, the degree of LUCC impact on the Rsn, which was the ratio of influence of LUCC to the combined effect of LUCC and climate on the Rsn, was unknown, limiting the understanding of the influence of LUCC on ecosystems [31]. Recently, satellite observations have provided a potential way to directly evaluate the effects of LUCC on ecosystems [32]. An example can be found in Feng’s latest research [16], which evaluated the contribution of vegetation changes to the surface radiation budget on a global scale. However, research on a regional scale is still rare due to coarsely gridded models or low-resolution satellite data [22,33,34].
The Dongting Lake Basin, located at the middle and lower reaches of the Yangtze River, is characterized by a subtropical monsoon climate and has undergone violent anthropogenic land cover changes, such as the “reclamation of land from the forest” and “returning farmland to the forest”, exerting a significant influence on the local ecosystems [35]. Previous works focusing on the Dongting Lake Basin mostly concentrated on hydrological processes [36,37,38]. The spatial–temporal patterns of the surface radiation budget and its driving factors remain unclear, which leaves a gap for understanding the mechanisms of the effects of anthropogenic land cover changes on ecosystems at a humid basin scale.
As discussed above, the individual contributions and relative contribution of LUCC to the surface radiation budget remain unclear due to the complex interactions between land and climate conditions. This study intends to clarify the impact of specific LUCCs on the radiation budget in a humid basin through satellite observations with an examination of the Dongting Lake Basin from 2001 to 2015. The structure of this study consists of four parts. Section 2 describes the study materials and methods. Section 3 presents the spatiotemporal variations in LUCC and the Rsn and discusses the impact of LUCC on the Rsn. Section 4 shows the discussion and conclusions. This study provides a more precise contribution estimation for LUCC on radiation and explains the process of LUCC’s effect on radiation, which helps us to understand the physical mechanisms of the surface radiation budget evolution.

2. Data and Methods

2.1. Study Area

The study area, the Dongting Lake Basin (24°38′–30°24′ N, 107°16′–114°15′ E) with an area of 23.98 × 10⁴ km2, is located in the middle and lower reaches of the Yangtze River in China and contains China’s second-largest freshwater lake (Figure 1). It plays a paramount ecological and hydrological role for the whole Yangtze River [39,40]. Its elevation is high on the east, south, and west sides and is low in the north, forming a horseshoe-shaped topography [38]. A complicated river system is present in this basin, which includes Lishui, Yuanjiang, Zishui, and Xiangjiang. The average annual temperature and precipitation are approximately 17 °C and 1400 mm, respectively. Due to very strong anthropogenic activities, the basin has experienced a significant reduction in forest and farmland expansion, which has dramatically influenced the regional ecosystems [37].

2.2. Data and Preprocessing

Several satellite datasets were adopted to quantify the influence of LUCC on radiation, which are described as follows:
(1)
Radiation data. The downward shortwave radiation products are available from the Global Land Surface Satellite (GLASS), which have a spatial resolution of 5 km and a temporal resolution of 1 day [41]. The data can be obtained from the National Earth System Science Data Center (http://www.geodata.cn/thematicView/GLASS.html, China (accessed on 8 April 2021)) or the University of Maryland (http://www.glass.umd.edu/Download.html, America (accessed on 8 April 2021)). GLASS data were generated from the Moderate Resolution Imaging Spectroradiometer (MODIS) top-of-atmosphere spectral reflectance product through a direct estimation method. They were examined with 525 ground observation stations, including 94 stations in China (overall R2 value of 0.93, an overall bias of 3.72 W/m2, and root mean square error of 32.84 W/m2 on a daily scale) [42].
(2)
LUCC data. The land use and cover change data are MODIS land cover-type product (MCD12Q1) data from 2001 to 2015, which use a Hidden Markov Model to reduce the interannual variability and provide five legacy classification schemes with a 500-m spatial resolution [43]. To capture the key features of LUCC at the basin scale, the International Geosphere-Biosphere Programme (IGBP) classification scheme with an overall accuracy of 67% was selected and reclassified into five land cover types (e.g., forest, grass, urban, farmland, and water) [44]. To reduce the effects of classification errors on the results, this study selected the area that experienced land surface transformation only once during the study period based on the LUCC trajectories. The method of how to calculate trajectories is presented in Section 2.3.
(3)
Auxiliary data. Surface and atmospheric datasets are also adopted to explore the physical mechanisms of LUCC impacts. Specifically, the albedo (Alb) data were obtained from the MODIS MCD43A3 Version 6 Albedo Model dataset with 500-m resolution and 1-day temporal resolution, which provided both black-sky and white-sky albedos. The actual albedo is defined as the sum of black-sky and white-sky albedos based on the ratio of diffuse illumination to direct illumination. In this study, we assumed that this ratio was a constant, and we expected the biases from this assumption to have an inappreciable effect on this application [13]. Moreover, aerosol optical depths (AODs) and clouds are selected to investigate the relationship between the downward shortwave radiation (Rsd) and atmospheric factors. Cloud data were acquired from clouds and the Earth’s Radiant Energy System (CERES) (https://ceres.larc.nasa.gov/ (accessed on 8 April 2021)), and the AOD was MODIS MCD19A2. The elevation was the Shuttle Radar Topography Mission (STRM) digital elevation dataset (https://srtm.csi.cgiar.org/ (accessed on 8 April 2021)).

2.3. Methods

As mentioned above, the surface shortwave radiation budget (Rsn) is affected by surface evaluations and atmospheric factors. To quantify the effect of LUCC on radiation, a stable climatology was introduced in which climate conditions, excluding surface factors, were assumed to be stationary over the study period. Then, the radiation differences between the actual and baseline scenarios were adopted to measure the LUCC impacts [29,45]. The process is as follows.
First, the Rsn was estimated through the following budget formulation:
R s n = R s d R s u = R s d ( 1 A l b )
where the Rsd and Rsu are the downward and upward shortwave radiation, respectively. Alb is the ratio of Rsu to Rsd [46].
Physically, Rsn is determined by Rsd and Alb; Alb is affected by the land cover, and Rsd depends on the atmospheric components. Therefore, the combined effect of LUCC and the atmospheric component ( Δ R F c o m , t x , y ) from time t0 to t are calculated from the following formulation:
Δ R F c o m , t x , y = R s d t x , y 1 A l b t x , y R s d t 0 x , y 1 A l b t 0 x , y
where R s d t x , y and R s d t 0 x , y are the downward solar radiation at times t and t0, respectively, and are located at (x,y), and A l b t x , y and A l b t 0 x , y are the albedos at times t and t0, respectively, and are both located at (x,y).
Under the assumption of a stable climatology, the climate factors, which represent the atmospheric components influencing the Rsd, such as clouds and aerosols, are stable. Then, the Rsd is invariable during the study period. Therefore, the Rsn is determined only by the Rsu changes induced by LUCC. Finally, the contribution of LUCC to the Rsn can be calculated from the baseline scenario with a fixed Rsd amount:
Δ R F l u c c , t x , y = R s d t 0 x , y 1 A l b t x , y R s d t 0 x , y 1 A l b t 0 x , y = R s d t 0 x , y A l b t 0 x , y A l b t x , y
where Δ R F l u c c , t x , y represents the contribution of LUCC to the Rsn at (x,y) from time t0 to t.
Next, to reveal the degree of LUCC impacts, the relative contribution of LUCC ( C l u c c , t x , y ), the ratio of the effects of LUCC on the Rsn to the combined effects of LUCC and climate, is estimated based on a comparison with the combined effect:
C l u c c , t x , y = Δ R F l u c c , t x , y Δ R F c o m , t x , y × 100 %
Moreover, to reduce the influence of classification errors on the results, this study extracts the regions of land cover transformation in which one land cover type would not occur after its transformation into other types through the trajectory-based method. The trajectory is obtained through the following equation [31]:
T r a c = i = 2001 2015 C l i × 10 2015 i
where Cli is the classified land cover for the year i. In this study, the numbers 1, 2, 3, 4, and 5 represent forest, grass, urban, farmland, and water, respectively.
Through Equation (5), we can obtain a trajectory code with fifty numbers, such as “111222222222222”, which means a transformation from forest to grass in the fourth year. This conversion can be described as forest→forest→forest→grass→grass→grass→grass→grass→grass→grass→grass→grass→grass→grass→grass. Moreover, the trajectory of “1112222222211”, which refers to a forest occurring after it transforms into grass, was removed. To further reduce uncertainty in the classification, trajectories with a proportion greater than 0.10% were adopted.
Considering the efficiency of processing data, the LUCC data were reprojected to 5 km, and all the data were aggregated on an annual scale.

3. Results

3.1. Spatial and Temporal Variations of LUCC and Rsn

3.1.1. Spatial–Temporal Patterns of LUCC

Table 1 and Figure 2 show the temporal and spatial patterns of different land cover types based on the LUCC trajectories through Equation (5). As a result, the land use cover types were mainly dominated by forest (55.35%), followed by grass (approximately 18.34%) and farmland (approximately 10.76%). The water and urban types covered less than 5% of the study area. Spatially, the forest was mainly located in the west, while grass and farmland were in the central area (Figure 2a). Temporally, the conversion of forest to grass occupied 3.49% of the study area, mainly located to the west and east of the basin (Figure 2b). The transformation from grass to forest was relatively small (1.37% of the study area) and presented a heterogeneous pattern. Moreover, the transformation of grass into farmland occupied 2.90% and was mainly located in the middle-eastern region. Based on the main types of land transformations, this study focused on the changes in forest, farmland, and grass.

3.1.2. Spatial–Temporal Pattern of the Shortwave Radiation Budget (Rsn)

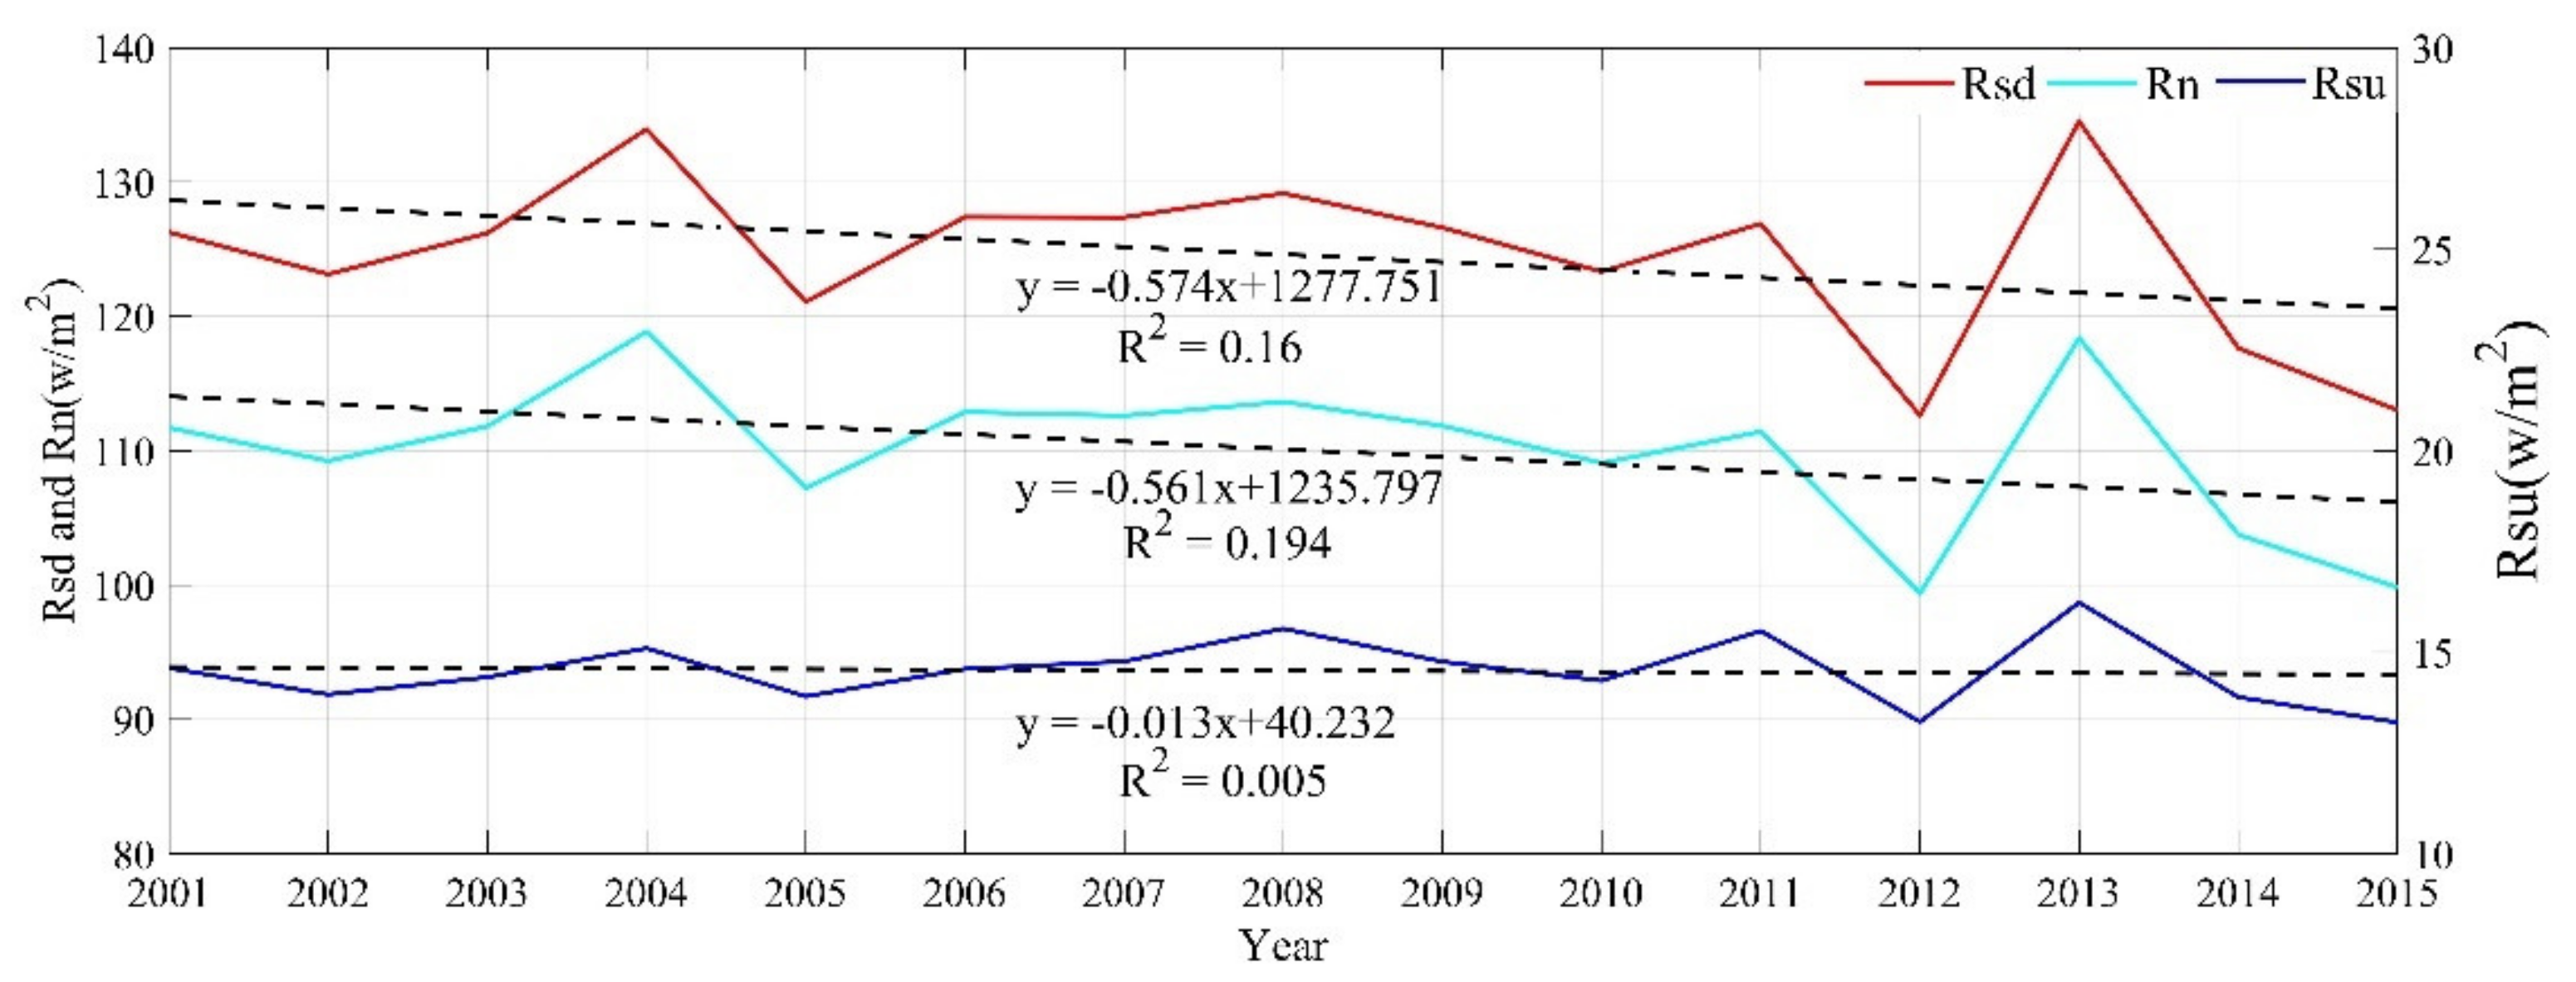
Radiation also exhibits spatial–temporal variability under the background of LUCC and the changing climate. Figure 3 shows the temporal radiation trends in the Dongting Lake Basin from 2001 to 2015. Generally, the multiyear mean values of the downward shortwave solar radiation (Rsd) and upward shortwave radiation (Rsu) were 124.61 W/m2 and 14.54 W/m2, respectively, which resulted in a positive budget (110.12 W/m2) of the surface shortwave radiation budget (Rsn). Temporally, the Rsd exhibited decreasing trends, which can be described by y = −0.57x + 1277.75 (R2 = 0.16, p = 0.14, where x and y refer to the time and Rsd, respectively). Meanwhile, the Rsu also showed a weak decreasing trend (y = −0.013x + 40.23, R2 = 0.005, p = 0.81). With the combination of the Rsd and Rsu, the Rsn showed decreasing trends (y = −0.56x + 1235.79, R2 = 0.194, p = 0.10), which was similar to the Rsd, suggesting that the variations in the Rsd may be the predominant factor in the surface shortwave radiation budget.
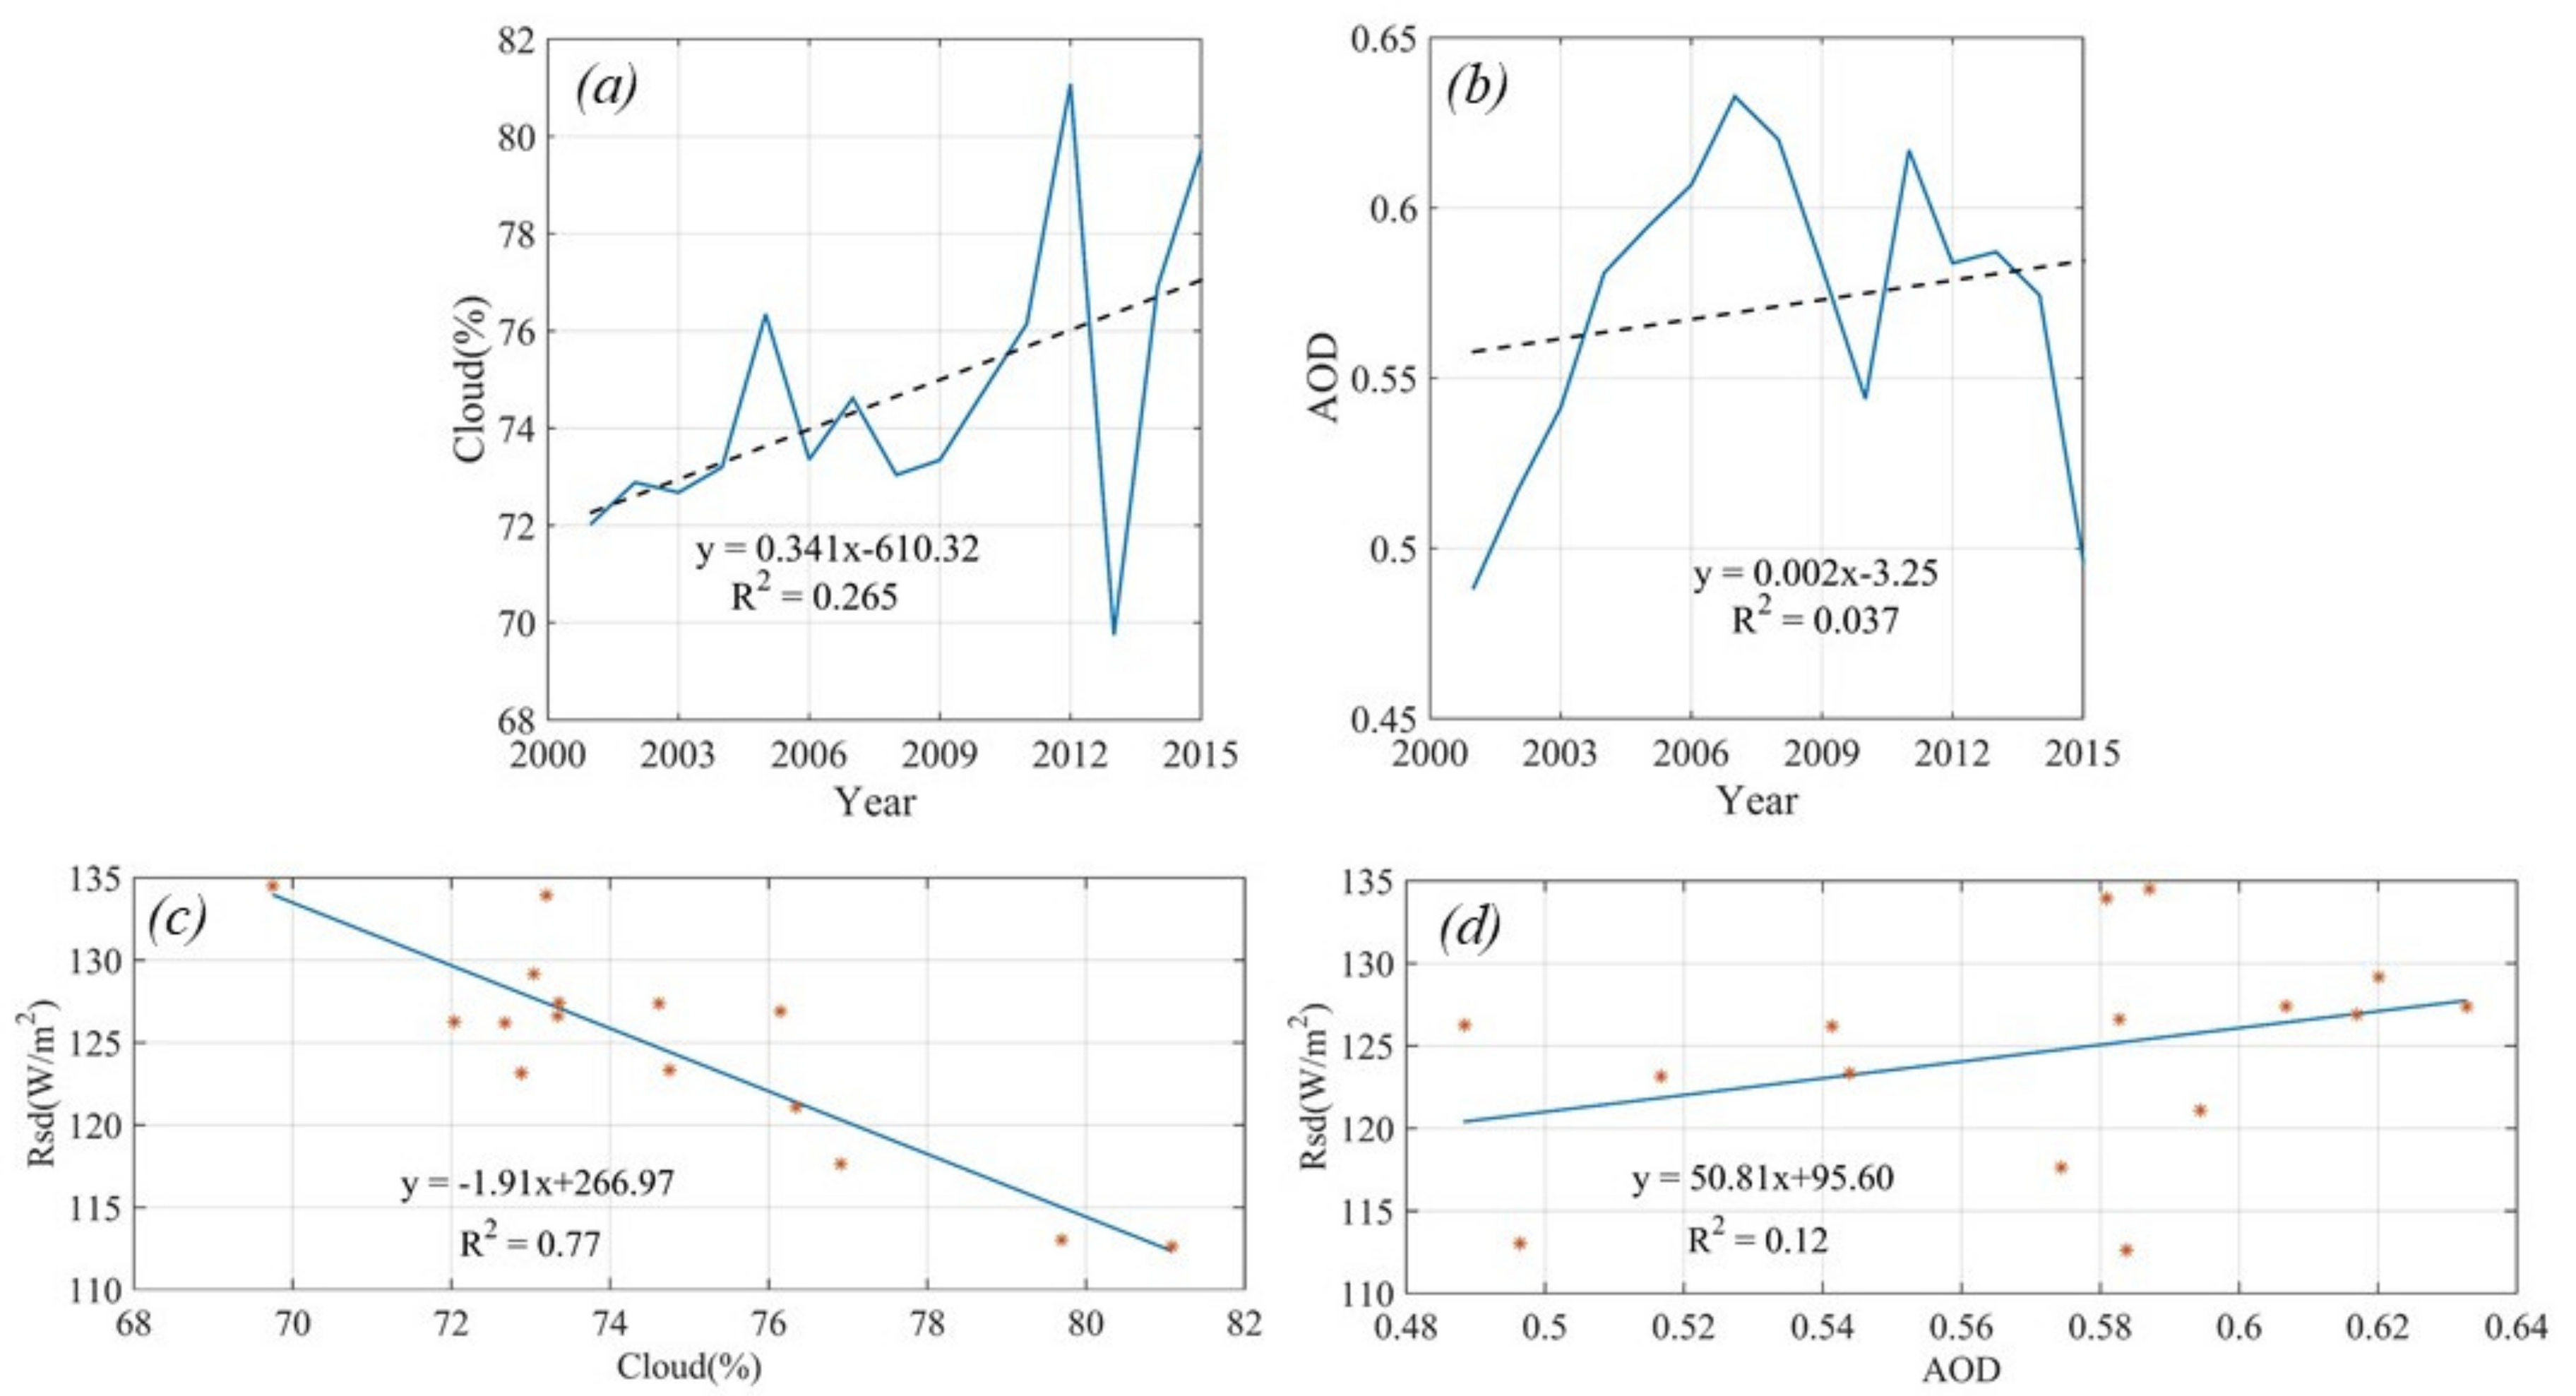
As mentioned in the Introduction, the Rsd was easily affected by the atmospheric factors. Figure 4 shows the relationship between the atmospheric factors and radiation. Generally, clouds and AOD all present an increasing trend, resulting in a decrease in the Rsd. In particular, there were several sharp changes in clouds during 2004 to 2005, 2012 to 2013, and 2013 to 2014, as presented in Figure 4a, while the Rsd showed the opposite changes at the same time (Figure 3). Moreover, there is a strong correlation between clouds and the Rsd, which can be written as y = −0.91x + 266.97 (R2 = 0.77, p < 0.01). Therefore, clouds may be the main controlling factor for the Rsd changes in the Dongting Lake Basin.
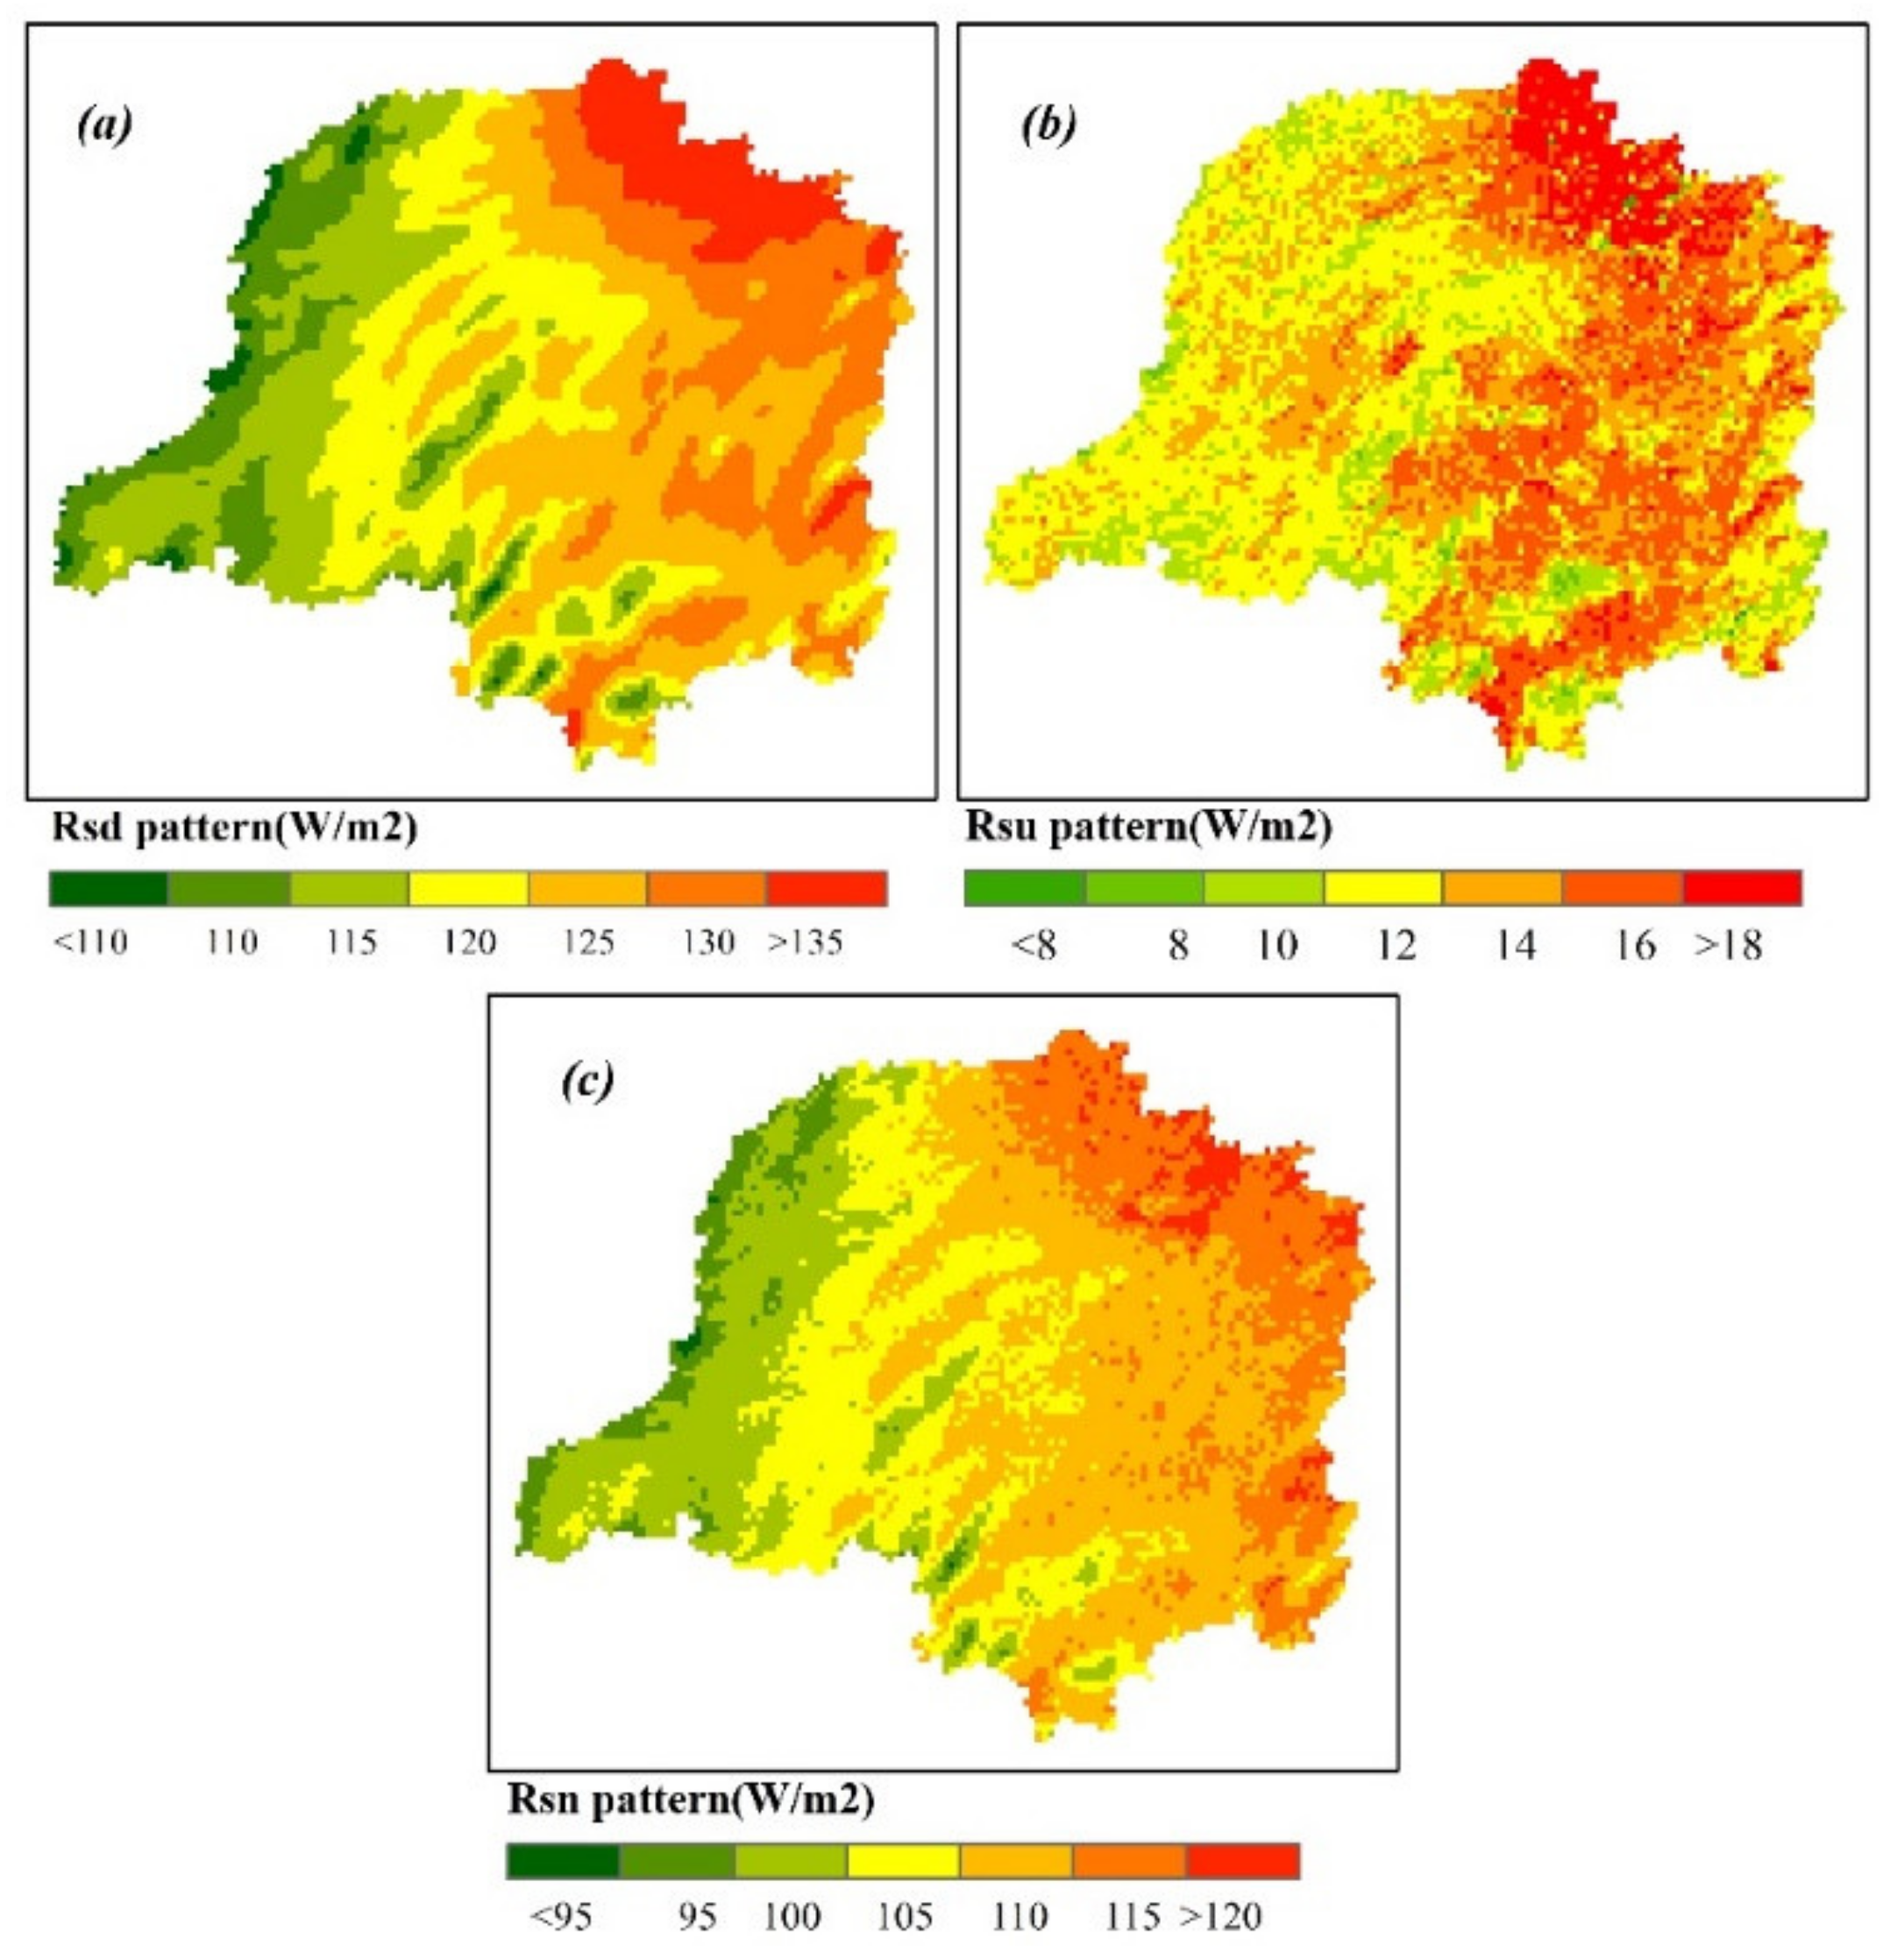
Figure 5 details the spatial patterns of the multiyear means of the radiation budget in the study area, which present spatial heterogeneity. Generally, the radiation types increased from northwest to northeast for the variables Rsd and Rsn. Moreover, the Rsu was low in the west and high in the east. The spatial characterization of the Rsu could be the result of the land cover pattern in which the forest was located in the western part of the study area (see Figure 2a) and where the albedos may be relatively low and less radiation would be reflected. As a consequence, the spatial distribution of the Rsn gradually increased from northwest to northeast, which was highly consistent with the Rsd and suggested that the Rsn may mainly be determined by the Rsd.

3.2. The Contribution of LUCC to the Rsn

3.2.1. The Combined Effect of LUCC and Climate

Figure 6 shows the combined effects of the LUCC and climate over the regions with land use changes. Temporally, the LUCC and climate resulted in a decreasing trend of −10.84 w/m2 in the Rsn from 2001 to 2015. Spatially, the absolute value of the combined effect was smaller in the northeast and larger in the southeast. Specifically, the combined effect magnitudes were −11.03 w/m2, −9.82 w/m2, and −11.10 w/m2 over the regions with land transformations of forest→grass, grass→forest, and grass→farmland, respectively. It is worth noting that the absolute values of the combined effect were larger in forest→grass areas and were smallest in grass→forest areas. There are two reasons for these results. First, the conversion of forest to grass could increase the albedo and reduce the Rsn [46,47]. Second, the grass-to-forest conversion mechanism exhibited opposite effects, which could decrease the albedo and prevent the Rsn from decreasing.

3.2.2. Isolation of LUCC Contributions from the Combined Influences

As described in the literature and our results above, the Rsn changed in the LUCC and climate, but the individual contributions were not clear. To isolate the influence of LUCC on the Rsn, this study introduced an observation-based approach that assumes the Rsd determined by atmospheric factors was stable, and the Rsn was only affected by LUCC-induced albedo changes during the study period, the results of which are presented in Figure 7. In general, LUCC contributed −0.45 W/m2 to the Rsn at the basin scale, which was characterized by a decreasing gradient from northwest to southeast, as shown in Figure 7a. To reveal the degree of LUCC impacts, the relative contribution of LUCC to the Rsn, which is the ratio of the effect of LUCC on the Rsn to the combined effect of the LUCC and climate on the Rsn, were further calculated in this study and are presented in Figure 7b. These results show that the influence of LUCC accounted for 2.53% of the total Rsn changes. The value of the relative contribution for the whole basin was small, which may be because the effects of different land cover changes are likely to cancel each other out and not be evident at the basin scale. Therefore, an analysis of the influence of different land types on radiation is needed.
Specifically, the conversion of forest to grass contributed −0.69 W/m2 to the Rsn, which accounted for 5.37% of the total Rsn change, and its magnitude was high in the east and low in the western part of the basin. These results mean that this conversion tended to enhance the decreasing trend of the Rsn, which was closely related to the albedo changes induced by the corresponding alterations of the surface properties. On the other hand, the conversion of grass to forest, which is located in the northwest and the center of the basin, prevented the Rsn from decreasing and contributed 0.21 W/m2 to the Rsn and accounted for −4.68% of the total change. In addition, the conversion of grass to farmland, which is located in the east-central basin, promoted a decrease in the Rsn and contributed −0.41 W/m2 to the Rsn and accounted for 2.40% of the total change. From these results, the magnitudes of the contributions are characterized by significant spatial variability at the basin scale, the reasons for which need deep investigation.

3.3. Mechanism of LUCC Impact on the Rsn

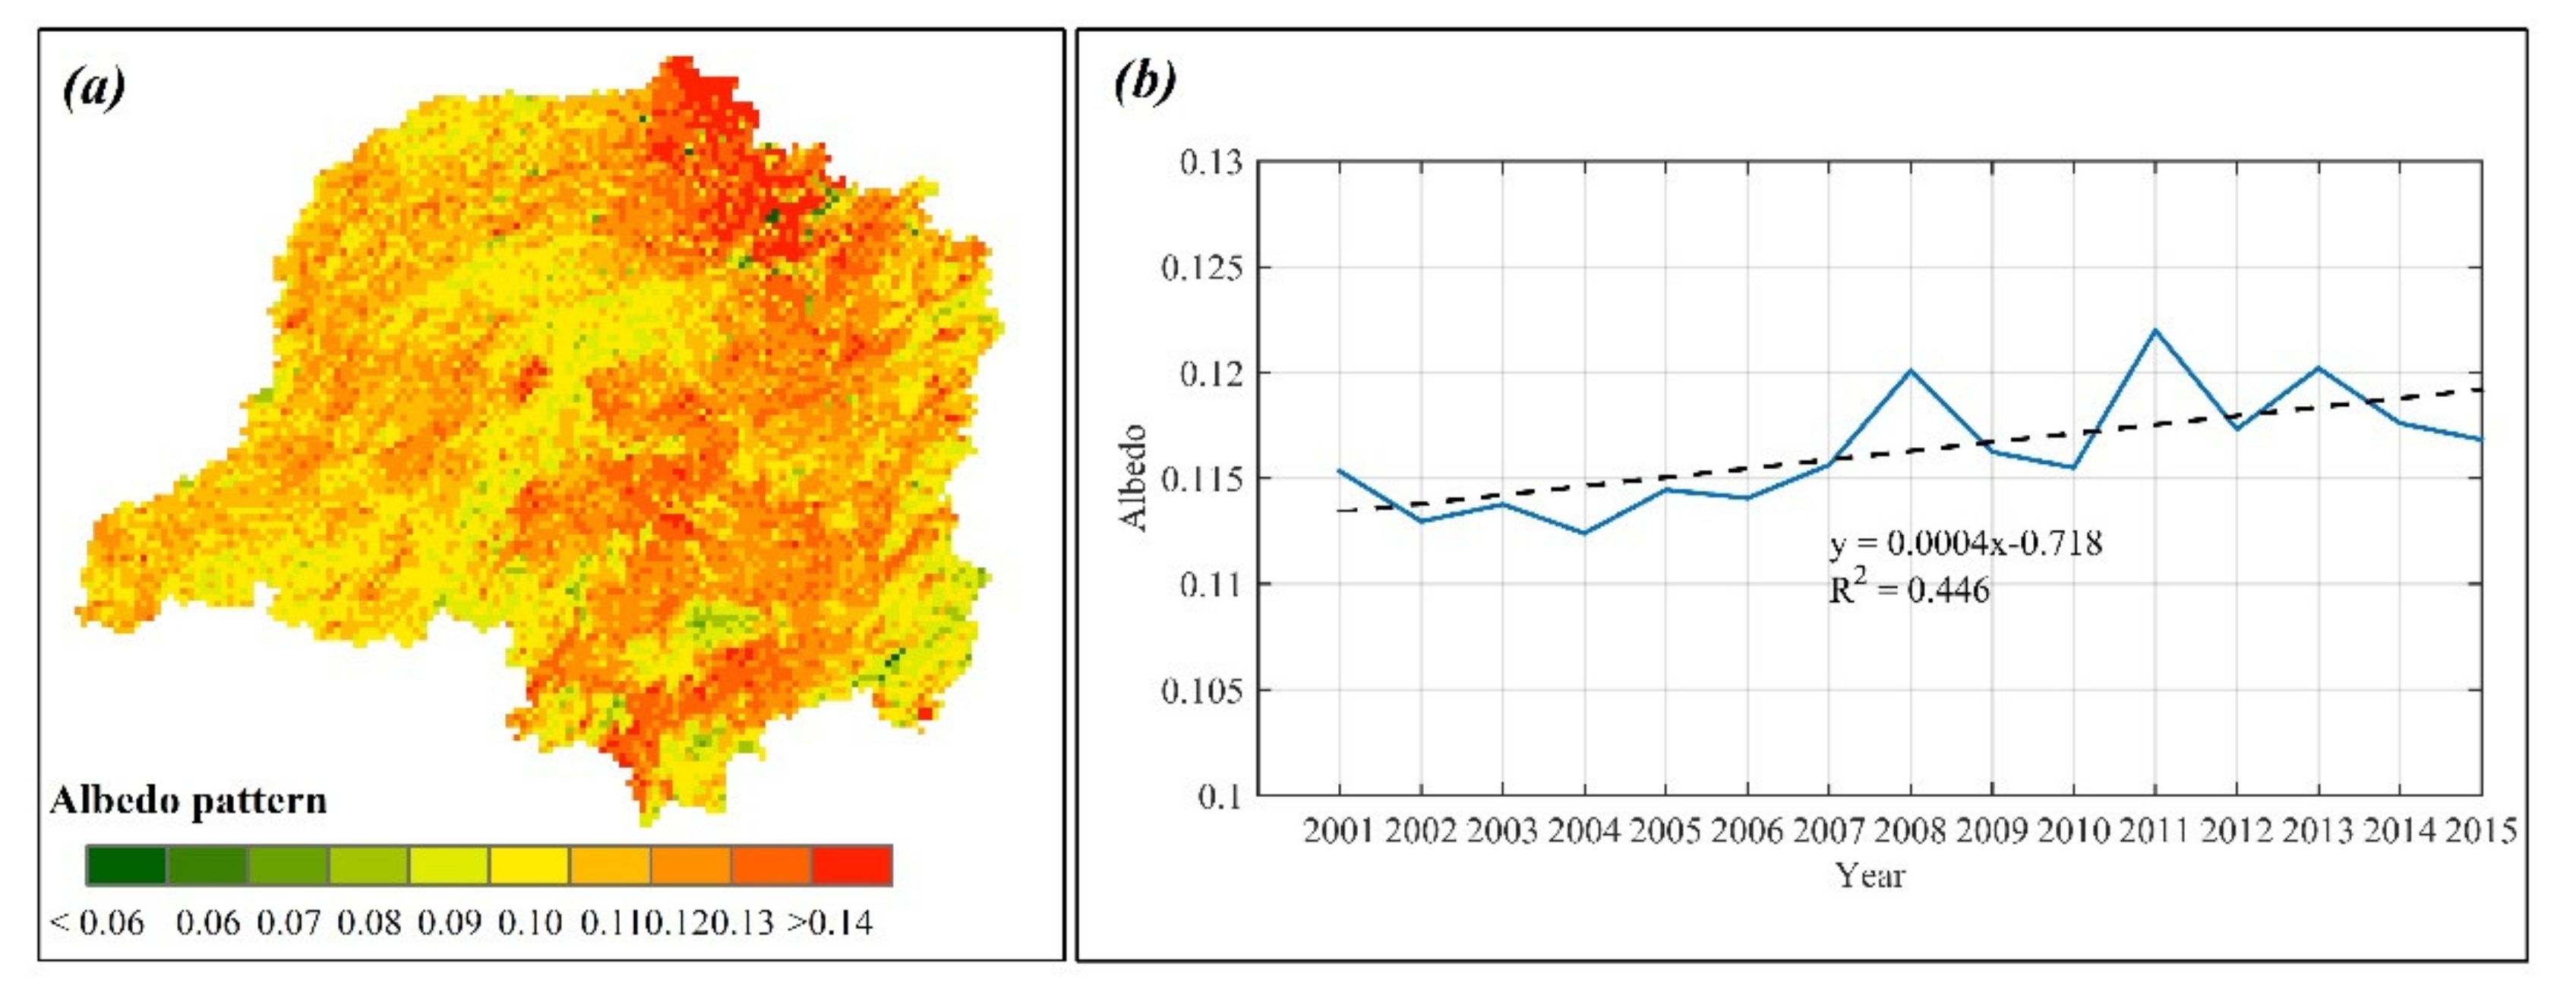
According to Equation (1), the Rsn is determined by the factors Rsd and albedo. The former factor depends on the atmospheric parameters (i.e., clouds and aerosols), while the latter is mainly controlled by the land type. Therefore, the relationship between land use types and albedo is helpful to capture the physical mechanisms of the LUCC impacts. Spatially, the albedo is high in the central regions and low around the study area (Figure 8a), which strongly correlates to the spatial properties of the land types (Figure 2a) with the low albedo in the forests and high albedo in the grass and farmlands. Temporally, albedo presented a significant increasing trend over the study period (y = 0.0004x−0.718, R2 = 0.446, p = 0.006) (Figure 8b), which meant that more radiation would be reflected and promoted the decrease in the Rsn.
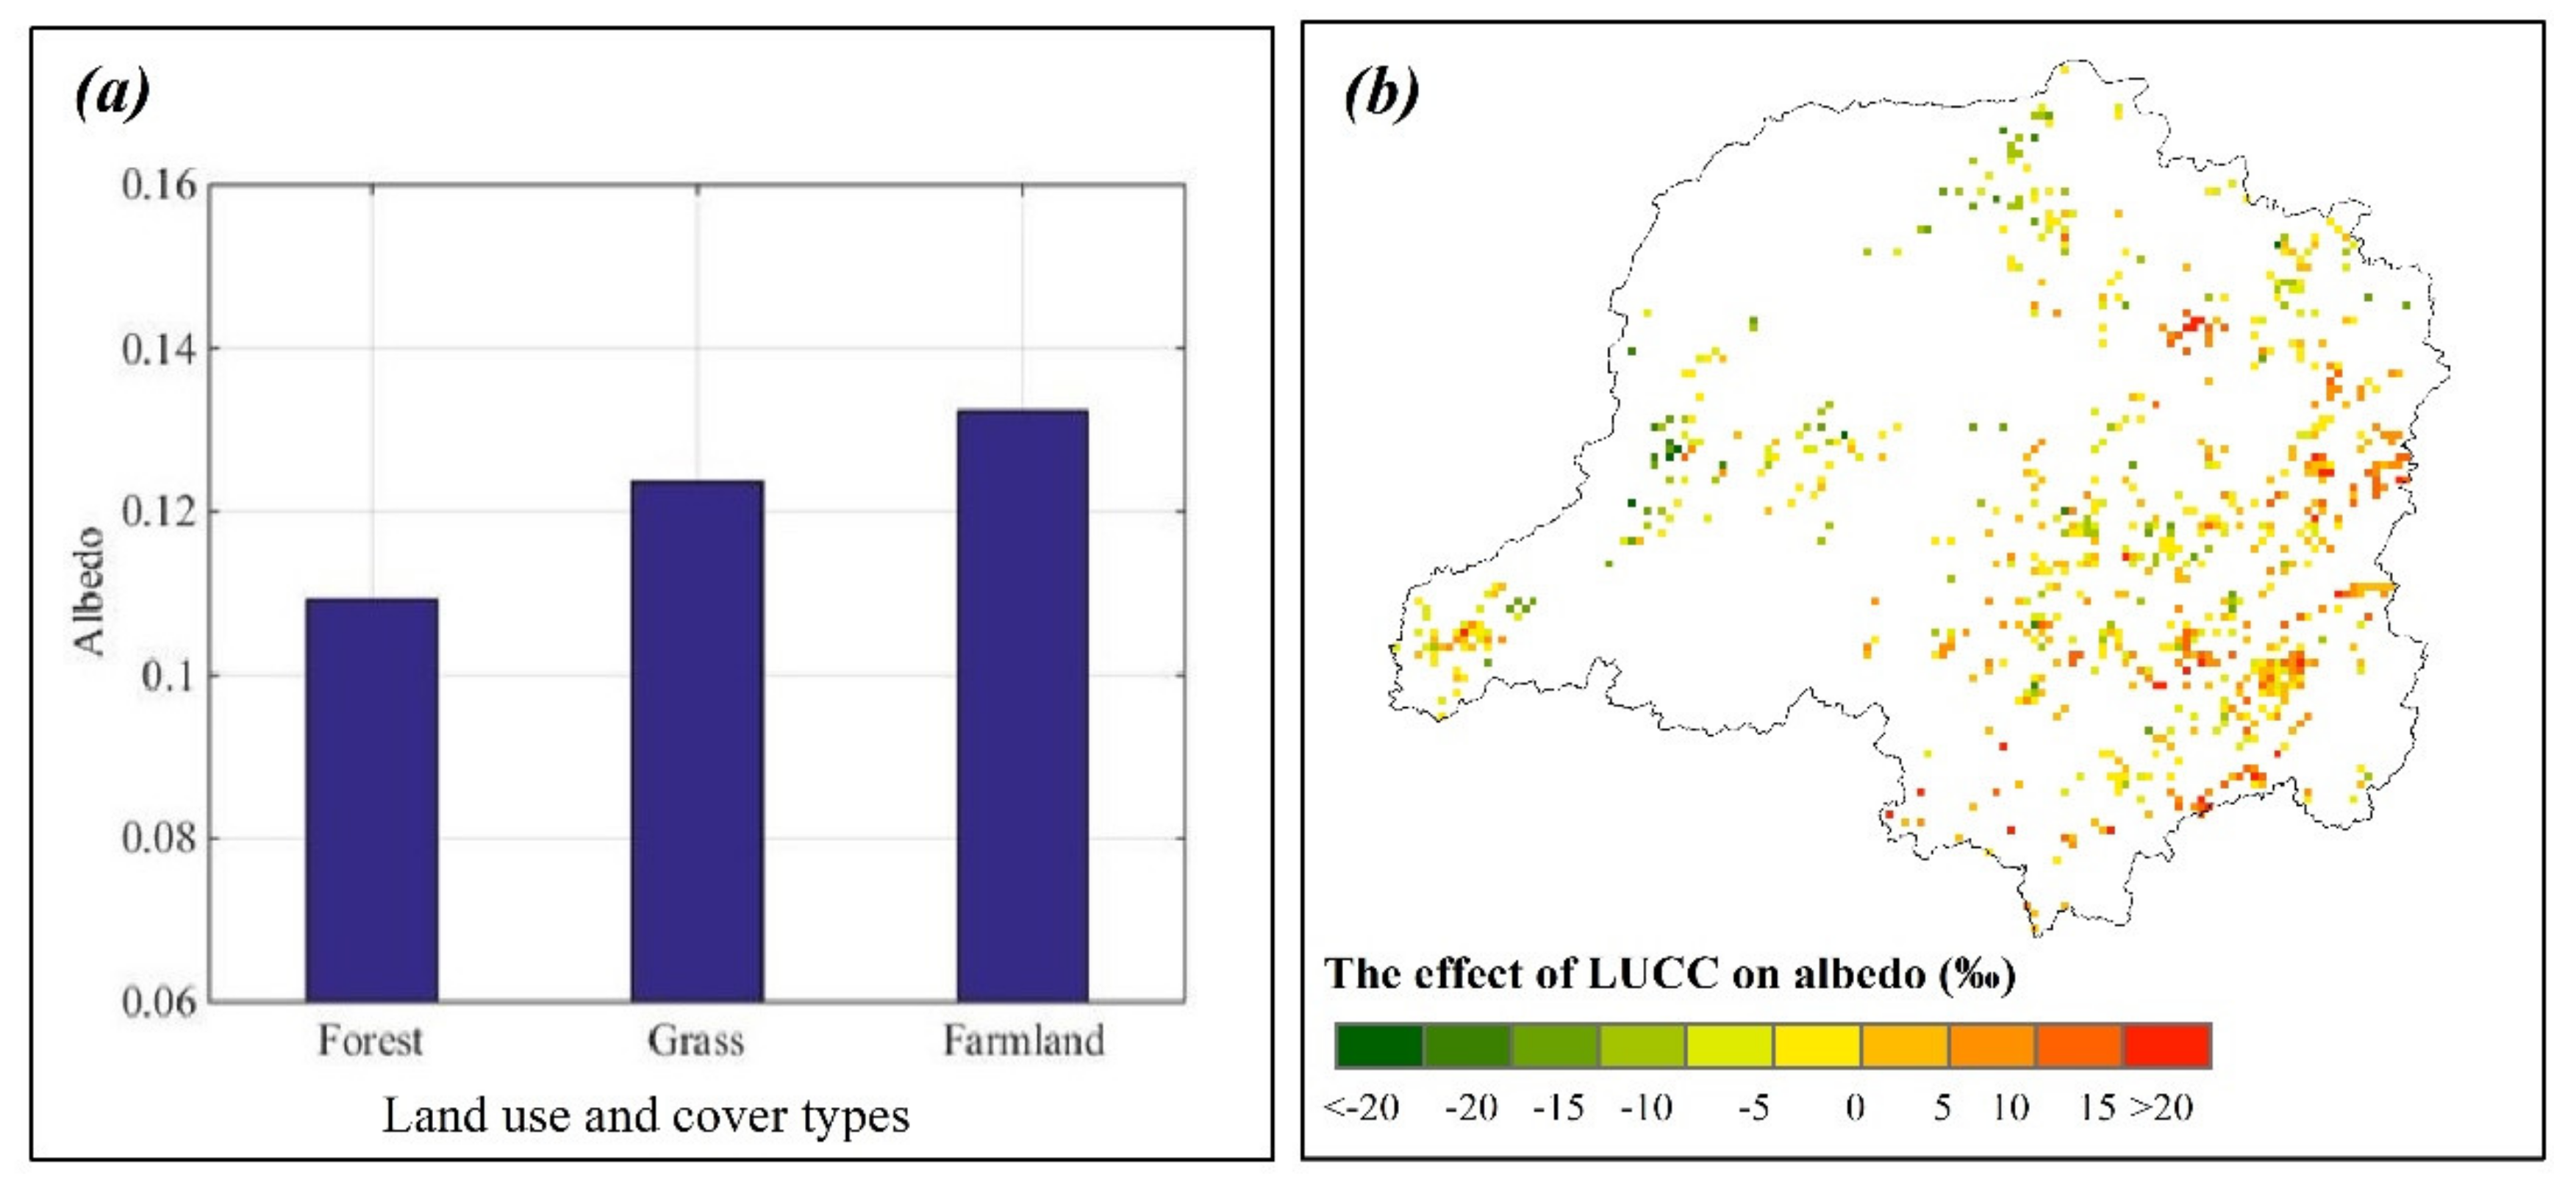
The influence of LUCC on albedo was further evaluated. Figure 9a shows the multiyear mean albedo in the permanent forest (0.1093), grass (0.1236), and farmland (0.1323) in the Dongting Lake Basin, indicating that deforestation enhances the reflection of solar radiation, which was consistent with previous research [48]. Figure 9b presents the spatial pattern of the LUCC effect on the albedo. In general, the LUCC-induced albedo change reached +0.0039 at the basin scale, characterized by an increase from northwest to southeast. Specifically, the albedo change levels from forest→grass, grass→forest, and grass→farmland were +0.0061, −0.0020, and +0.0036, respectively. Deforestation contributed the greatest increase in albedo, suggesting that the historic anthropogenic activities of “conversion to farmland from forest” disturbed the regional radiation. Therefore, it is crucial to manage “returning farmland to forest” to maintain the sustainable development of regional ecosystems.

4. Discussion

In this study, the influence of LUCC on the Rsn was isolated based on a stable climatology assuming that atmospheric factors influencing Rsd are stable and Rsn is only disturbed by albedo change induced by LUCC [29,45]. Moreover, to reduce the influence of classification error on result, we select land cover change area that land cover would not occur after its convert to other types through LUCC trajectories [31]. Under these approaches, we successfully quantify the effect of LUCC on Rsn, which can provide a methodological reference for investigating LUCC impacts on ecosystem.
Moreover, our results showed that the LUCC influence contributed −0.45 W/m2 to the total decrease in surface net radiation, which was significantly greater than the global LUCC impacts (−0.05 to −0.25 W/m2) [29,30,46]. Meanwhile, LUCC influence only accounting for 2.53% of the total Rsn change, meaning that atmospheric may be the main factor for Rsn change. We also found that the magnitude of albedo force from deforestation (−0.69 W/m2) was significantly greater than that from reforestation (0.21 W/m2), suggesting that the effect of LUCC on Rsn were imbalanced. The corresponding effect on the Earth’s system might be irreversible. Therefore, it is necessary to evaluate the impact of LUCC on the ecological management at the local scale.

5. Conclusions

In this study, the influence of LUCC on the Rsn was isolated based on satellite observations, and the ratio of the LUCC effect to the combined effect of LUCC and climate on the Rsn was revealed. Several conclusions can be drawn:
Our results showed that the Dongting Lake Basin has experienced LUCC processes in the past decade, mainly characterized by the land transformations of forest→grass, grass→forest, and grass→farmland. Under these conditions, the study area showed a decrease in the Rsn (−10.84 w/m2). The LUCC influence contributed −0.45 W/m2 to the total decrease in surface net radiation. Specifically, the conversion of forest to grass contributed −0.69 W/m2 to the Rsn and accounted for 5.37% of the total Rsn change. Afforestation from grass contributed 0.21 W/m2 to the Rsn and accounted for −4.67%. Meanwhile, the conversion of grass to farmland contributed −0.41 W/m2 to the Rsn and accounted for 2.40%. Both the signs and magnitudes of different land cover change impacts on radiation were heterogeneous and were mainly related to the variations in surface parameters induced by LUCC.
Physically, the effects of LUCC on radiation are derived from alterations in the albedo. In general, at the basin scale, the albedo forcing from LUCC was +0.0039, which led to a decrease in Rsn. Specifically, the levels of albedo force from the conversion of forest to grass, grass to forest, and grass to farmland were 0.0061, −0.0020, and 0.0036, respectively.
We clarified the direct impacts of LUCC on the surface radiation budget in this study. In addition to directly affecting the surface properties, the LUCC could also indirectly affect radiation by altering the regional climate, which needs full investigation in our subsequent research.

Author Contributions

Conceptualization, S.Y. and H.F.; data curation, S.Y.; funding acquisition, S.Y., H.F., F.L. and G.D.; investigation, S.Y. and Y.D.; methodology, S.Y. and H.F.; project administration, S.Y. and H.F.; resources, H.F. and B.Z.; supervision, H.F.; writing—original draft, S.Y.; writing—review & editing, S.Y., H.F., B.Z., Y.D., S.Z., F.L. and G.D. All authors have read and agreed to the published version of the manuscript.

Funding

This work was supported in part by the National Natural Science Foundation of China (Grant No. 42071378 and 51909099), the Nature Science Foundation of Hunan Province (No. 2020JJ3045), the Independent exploration and innovation project for graduate students in Hunan Province (No. CX20200239), and the Joint Fund for Regional Innovation and Development of NSFC (U19A2051).

Institutional Review Board Statement

Not applicable.

Informed Consent Statement

Not applicable.

Data Availability Statement

The Global Land Surface Satellite downward shortwave radiation (GLASS) were obtained from the National Earth System Science Data Center (http://www.geodata.cn/thematicView/GLASS.html, China (accessed on 8 April 2021)). Land cover, AOD and albedo data were download from LAAS DAAC (https://ladsweb.modaps.eosdis.nasa.gov/ (accessed on 8 April 2021)). Cloud were obtained from clouds and the Earth’s Radiant Energy System (CERES) (https://ceres.larc.nasa.gov/ (accessed on 8 April 2021)). The elevation was download from the Shuttle Radar Topography Mission (STRM) digital elevation dataset (https://srtm.csi.cgiar.org/ (accessed on 8 April 2021)).

Conflicts of Interest

The authors declare no conflict of interest.

References

  1. Foley, J.A.; DeFries, R.; Asner, G.P.; Barford, C.; Bonan, G.; Carpenter, S.R.; Chapin, F.S.; Coe, M.T.; Daily, G.C.; Gibbs, H.K.; et al. Global Consequences of Land Use. Science 2005, 309, 570–574. [Google Scholar] [CrossRef] [Green Version]
  2. Goldewijk, K.K.; Beusen, A.; Doelman, J.; Stehfest, E. Anthropogenic land use estimates for the Holocene-HYDE 3.2. Earth Syst. Sci. Data 2017, 9, 927–953. [Google Scholar] [CrossRef] [Green Version]
  3. Intergovernmental Panel On Climate Change. Climate Change and Land: An IPCC Special Report on Cliamte Change, Desertificatin, Land Degradation, Sustainable Land Management, Food Secruity, and Greenhouse Gas Fluxes in Terrestrial Ecosystems; Cambridge University Press: New York, NY, USA, 2019. [Google Scholar]
  4. Song, X.P.; Hansen, M.C.; Stehman, S.V.; Potapov, P.V.; Tyukavina, A.; Vermote, E.F.; Townshend, J.R. Global land change from 1982 to 2016. Nature 2018, 560, 639–643. [Google Scholar] [CrossRef]
  5. Zhang, X.L.; Xiong, Z.; Zhang, X.Z.; Shi, Y.; Liu, J.Y.; Shao, Q.Q.; Yan, X.D. Simulation of the climatic effects of land use/land cover changes in eastern China using multi-model ensembles. Glob. Planet. Chang. 2017, 154, 1–9. [Google Scholar] [CrossRef]
  6. Kisi, O.; Alizamir, M. Modelling reference evapotranspiration using a new wavelet conjunction heuristic method: Wavelet extreme learning machine vs. wavelet neural networks. Agric. For. Meteorol. 2018, 263, 41–48. [Google Scholar] [CrossRef]
  7. DeAngelis, A.M.; Qu, X.; Zelinka, M.D.; Hall, A. An observational radiative constraint on hydrologic cycle intensification. Nature 2015, 528, 249. [Google Scholar] [CrossRef]
  8. Ramanathan, V.; Crutzen, P.J.; Kiehl, J.T.; Rosenfeld, D. Atmosphere-Aerosols, climate, and the hydrological cycle. Science 2001, 294, 2119–2124. [Google Scholar] [CrossRef] [Green Version]
  9. Lean, J.; Rind, D. Climate Forcing by Changing Solar Radiation. J. Clim. 1998, 11, 3069–3094. [Google Scholar] [CrossRef]
  10. Ramanathan, V. The role of earth radiation budget studies in climate and general circulation research. J. Geophys. Res. Atmos. 1987, 92, 4075–4095. [Google Scholar] [CrossRef]
  11. Monteith, J.L. Solar Radiation and Productivity in Tropical Ecosystems. J. Appl. Ecol. 1972, 9, 747–766. [Google Scholar] [CrossRef] [Green Version]
  12. Muchow, R.C.; Sinclair, T.R.; Bennett, J.M. Temperature and Solar Radiation Effects on Potential Maize Yield across Locations. Agron. J. 1990, 82, 338–343. [Google Scholar] [CrossRef]
  13. Mercado, L.M.; Bellouin, N.; Sitch, S.; Boucher, O.; Huntingford, C.; Wild, M.; Cox, P.M. Impact of changes in diffuse radiation on the global land carbon sink. Nature 2009, 458, U1014–U1087. [Google Scholar] [CrossRef] [Green Version]
  14. Laliberte, E.; Wells, J.A.; DeClerck, F.; Metcalfe, D.J.; Catterall, C.P.; Queiroz, C.; Aubin, I.; Bonser, S.P.; Ding, Y.; Fraterrigo, J.M.; et al. Land-use intensification reduces functional redundancy and response diversity in plant communities. Ecol. Lett. 2010, 13, 76–86. [Google Scholar] [CrossRef] [PubMed]
  15. Matthews, H.D.; Weaver, A.J.; Eby, M.; Meissner, K.J. Radiative forcing of climate by historical land cover change. Geophys. Res. Lett. 2003, 30. [Google Scholar] [CrossRef] [Green Version]
  16. Feng, H.; Ye, S.; Zou, B. Contribution of vegetation change to the surface radiation budget: A satellite perspective. Glob. Planet. Chang. 2020, 192, 103225. [Google Scholar] [CrossRef]
  17. Kim, D.; Ramanathan, V. Solar radiation budget and radiative forcing due to aerosols and clouds. J. Geophys. Res. Atmos. 2008, 113. [Google Scholar] [CrossRef] [Green Version]
  18. Dong, B.; Wilcox, L.J.; Highwood, E.J.; Sutton, R.T. Impacts of recent decadal changes in Asian aerosols on the East Asian summer monsoon: Roles of aerosol–radiation and aerosol–cloud interactions. Clim. Dyn. 2019, 53, 3235–3256. [Google Scholar] [CrossRef] [Green Version]
  19. Alpert, P.; Kishcha, P. Quantification of the effect of urbanization on solar dimming. Geophys. Res. Lett. 2008, 35. [Google Scholar] [CrossRef] [Green Version]
  20. Brovkin, V.; Claussen, M.; Driesschaert, E.; Fichefet, T.; Kicklighter, D.; Loutre, M.F.; Matthews, H.D.; Ramankutty, N.; Schaeffer, M.; Sokolov, A. Biogeophysical effects of historical land cover changes simulated by six Earth system models of intermediate complexity. Clim. Dyn. 2006, 26, 587–600. [Google Scholar] [CrossRef]
  21. Qian, C. Impact of land use/land cover change on changes in surface solar radiation in eastern China since the reform and opening up. Theor. Appl. Climatol. 2016, 123, 131–139. [Google Scholar] [CrossRef] [Green Version]
  22. Pongratz, J.; Raddatz, T.; Reick, C.H.; Esch, M.; Claussen, M. Radiative forcing from anthropogenic land cover change since A.D. 800. Geophys. Res. Lett. 2009, 36. [Google Scholar] [CrossRef] [Green Version]
  23. Heald, C.L.; Spracklen, D.V. Land Use Change Impacts on Air Quality and Climate. Chem. Rev. 2015, 115, 4476–4496. [Google Scholar] [CrossRef] [Green Version]
  24. Feng, H.; Zou, B. A greening world enhances the surface-air temperature difference. Sci. Total Env. 2019, 658, 385–394. [Google Scholar] [CrossRef]
  25. Lobell, D.B.; Bala, G.; Duffy, P.B. Biogeophysical impacts of cropland management changes on climate. Geophys. Res. Lett. 2006, 33. [Google Scholar] [CrossRef]
  26. Piao, S.; Wang, X.; Park, T.; Chen, C.; Lian, X.; He, Y.; Bjerke, J.W.; Chen, A.; Ciais, P.; Tømmervik, H.; et al. Characteristics, drivers and feedbacks of global greening. Nat. Rev. Earth Environ. 2020, 1, 14–27. [Google Scholar] [CrossRef]
  27. Dumka, U.C.; Satheesh, S.K.; Pant, P.; Hegde, P.; Moorthy, K.K. Surface changes in solar irradiance due to aerosols over central Himalayas. Geophys. Res. Lett. 2006, 33, 4. [Google Scholar] [CrossRef]
  28. Bonan, G.B.; Doney, S.C. Climate, ecosystems, and planetary futures: The challenge to predict life in Earth system models. Science 2018, 359, 533. [Google Scholar] [CrossRef] [Green Version]
  29. Ghimire, B.; Williams, C.A.; Masek, J.; Feng, G.; Tao, H. Global albedo change and radiative cooling from anthropogenic land-cover change, 1700 to 2005 based on MODIS, land-use harmonization, radiative kernels and reanalysis. Geophys. Res. Lett. 2014, 41, 9087–9096. [Google Scholar] [CrossRef]
  30. Myhre, G.; Myhre, A. Uncertainties in radiative forcing due to surface albedo changes caused by land-use changes. J. Clim. 2003, 16, 1511–1524. [Google Scholar] [CrossRef]
  31. Feng, H.; Zhao, X.; Chen, F.; Wu, L. Using land use change trajectories to quantify the effects of urbanization on urban heat island. Adv. Space Res. 2014, 53, 463–473. [Google Scholar] [CrossRef]
  32. Myhre, G.; Kvalevag, M.M.; Schaaf, C.B. Radiative forcing due to anthropogenic vegetation change based on MODIS surface albedo data. Geophys. Res. Lett. 2005, 32. [Google Scholar] [CrossRef] [Green Version]
  33. Bala, G.; Caldeira, K.; Wickett, M.; Phillips, T.J.; Lobell, D.B.; Delire, C.; Mirin, A. Combined climate and carbon-cycle effects of large-scale deforestation. Proc. Natl. Acad. Sci. USA 2007, 104, 6550–6555. [Google Scholar] [CrossRef] [PubMed] [Green Version]
  34. Betts, R.A.; Falloon, P.D.; Goldewijk, K.K.; Ramankutty, N. Biogeophysical effects of land use on climate: Model simulations of radiative forcing and large-scale temperature change. Agric. For. Meteorol. 2007, 142, 216–233. [Google Scholar] [CrossRef]
  35. Zhang, H.; Zhu, X. Study on the Dynamic Monitoring and Succession Analysis of Wetland Types in Dongting Lake Area. In Proceedings of the 2009 2nd IEEE International Conference on Computer Science and Information Technology; IEEE: Piscataway, NJ, USA, 2009; pp. 223–227. [Google Scholar]
  36. Qin, H.Y.; Xie, Y.H.; Zou, D.S. Changes of Runoff and Sediment Discharge into Dongting Lake from the Four Rivers in Hunan Province. Sci. Geogr. Sin. 2012, 32, 609–615. [Google Scholar]
  37. Lotz, T.; Opp, C.; He, X. Factors of runoff generation in the Dongting Lake basin based on a SWAT model and implications of recent land cover change. Quat. Int. 2018, 475, 54–62. [Google Scholar] [CrossRef]
  38. Wu, Y.-b.; Xue, L.-q.; Liu, Y.-h. Local and regional flood frequency analysis based on hierarchical Bayesian model in Dongting Lake Basin, China. Water Sci. Eng. 2019, 12, 253–262. [Google Scholar] [CrossRef]
  39. Lu, C.; Jia, Y.; Jing, L.; Zeng, Q.; Lei, J.; Zhang, S.; Lei, G.; Wen, L. Shifts in river-floodplain relationship reveal the impacts of river regulation: A case study of Dongting Lake in China. J. Hydrol. 2018, 559, 932–941. [Google Scholar] [CrossRef]
  40. Wu, G.; Liu, Y. Mapping Dynamics of Inundation Patterns of Two Largest River-Connected Lakes in China: A Comparative Study. Remote Sens. 2016, 8, 560. [Google Scholar] [CrossRef] [Green Version]
  41. Liang, S.; Zhao, X.; Liu, S.; Yuan, W.; Cheng, X.; Xiao, Z.; Zhang, X.; Liu, Q.; Cheng, J.; Tang, H.; et al. A long-term Global LAnd Surface Satellite (GLASS) data-set for environmental studies. Int. J. Digit. Earth 2013, 6, 5–33. [Google Scholar] [CrossRef]
  42. Zhang, X.; Wang, D.; Liu, Q.; Yao, Y.; Liang, S. An Operational Approach for Generating the Global Land Surface Downward Shortwave Radiation Product From MODIS Data. IEEE Trans. Geosci. Remote Sens. 2019, 57, 4636–4650. [Google Scholar] [CrossRef]
  43. Abercrombie, S.P.; Friedl, M.A. Improving the Consistency of Multitemporal Land Cover Maps Using a Hidden Markov Model. IEEE Trans. Geosci. Remote Sens. 2016, 54, 703–713. [Google Scholar] [CrossRef]
  44. Sulla-Menashe, D.; Gray, J.M.; Abercrombie, S.P.; Friedl, M.A. Hierarchical mapping of annual global land cover 2001 to present: The MODIS Collection 6 Land Cover product. Remote Sens. Environ. 2019, 222, 183–194. [Google Scholar] [CrossRef]
  45. Jiao, T.; Williams, C.A.; Ghimire, B.; Masek, J.; Gao, F.; Schaaf, C. Global climate forcing from albedo change caused by large-scale deforestation and reforestation: Quantification and attribution of geographic variation. Clim. Chang. 2017, 142, 463–476. [Google Scholar] [CrossRef]
  46. He, T.; Liang, S.; Song, D.X. Analysis of global land surface albedo climatology and spatial-temporal variation during 1981–2010 from multiple satellite products. J. Geophys. Res. Atmos. 2014, 119, 10281–10298. [Google Scholar] [CrossRef]
  47. Davin, E.L.; de Noblet-Ducoudre, N. Climatic Impact of Global-Scale Deforestation: Radiative versus Nonradiative Processes. J. Clim. 2010, 23, 97–112. [Google Scholar] [CrossRef]
  48. Zhang, X.; Liang, S.; Wang, K.; Li, L.; Gui, S. Analysis of Global Land Surface Shortwave Broadband Albedo From Multiple Data Sources. IEEE J. Sel. Top. Appl. Earth Obs. Remote Sens. 2010, 3, 296–305. [Google Scholar] [CrossRef]
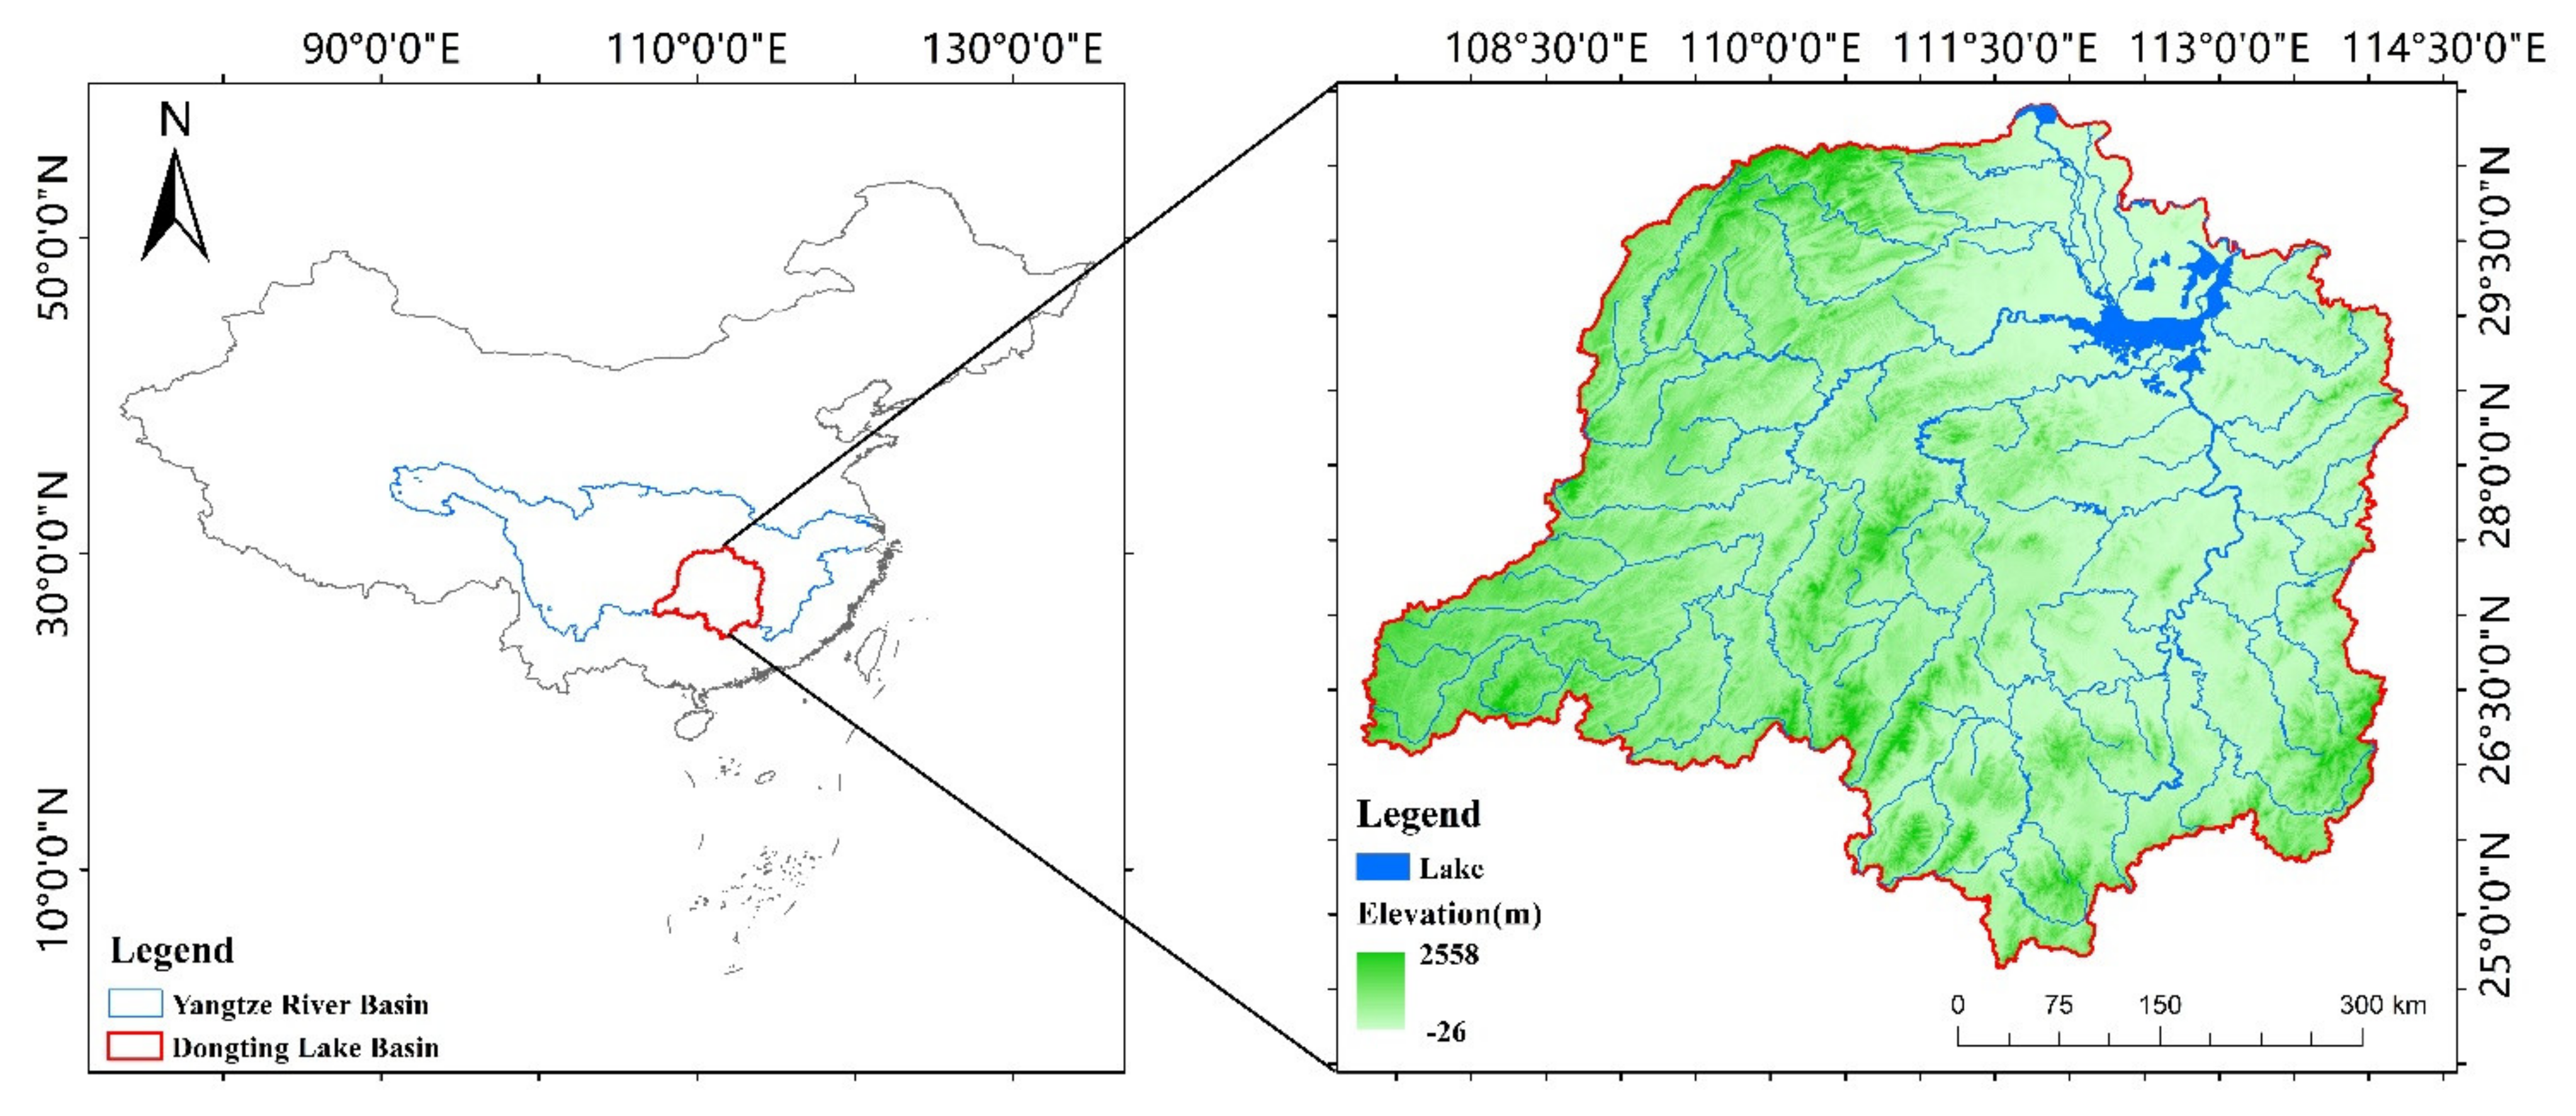
Figure 1. The study area of the Dongting Lake Basin, China.
Remotesensing 13 01447 g001
Figure 2. Spatial patterns of the (a) land types and (b) land use and cover change (LUCC) trajectories from 2001 to 2015.
Remotesensing 13 01447 g002
Figure 3. Multiyear mean trends of the radiation budgets.
Remotesensing 13 01447 g003
Figure 4. Temporal trend of (a) clouds and (b) aerosol optical depth (AOD) and correlations of the Rsd with (c) clouds and (d) AOD.
Remotesensing 13 01447 g004
Figure 5. Spatial patterns of the multiyear means of the (a) Rsd, (b) Rsu, and (c) Rsn.
Remotesensing 13 01447 g005
Figure 6. The combined effect of the LUCC and climate on the Rsn (only regions with land transformation areas presented in Figure 2b are shown).
Remotesensing 13 01447 g006
Figure 7. Spatial patterns of the contribution of LUCC. (a,b) the contribution of LUCC and the relative contribution compared with the combined effect of the LUCC and climate, respectively (only regions with the land transformation areas presented in Figure 2b are shown).
Remotesensing 13 01447 g007
Figure 8. Spatial pattern (a) and temporal trend (b) of the multiyear mean albedo.
Remotesensing 13 01447 g008
Figure 9. Multiyear means of albedo over permanently different land covers (a) and the effect of LUCC on albedo (b) (only regions with the land transformation areas presented in Figure 2b are shown).
Remotesensing 13 01447 g009
Table 1. Land use change trajectories from 2001 to 2015.
“Forest→Grass” Trajectories“Grass→Forest” Trajectories“Grass→Forest” Trajectories
ID aArea(%)IDArea(%)IDArea(%)
11111111111111155.35%22222222222222218.3444444444444444410.76%
1111112222222220.55%2222222211111110.19%2244444444444440.53%
1111111222222220.42%2211111111111110.18%2444444444444440.50%
1111111122222220.31%2222211111111110.17%2224444444444440.37%
1111222222222220.31%2222222222222210.16%2222222222244440.32%
1111122222222220.29%2111111111111110.15%2222222222224440.25%
1112222222222220.25%2221111111111110.15%2222444444444440.21%
1111111112222220.22%2222222221111110.15%2222222222444440.20%
1111111111112220.21%2222222222222110.14%2222222244444440.14%
1111111111222220.21%2222222222211110.11%2222244444444440.14%
1222222222222220.19% 2222222222222440.12%
1111111111111220.15% 2222222444444440.12%
1111111111122220.15%
1122222222222220.14%
1111111111111120.10%
a 1: forest, 2: grassland, 3: urban, 4: farmland, and 5: water.
Publisher’s Note: MDPI stays neutral with regard to jurisdictional claims in published maps and institutional affiliations.