Abstract
This work aims at enhancing the current methodologies used for generating as-built CAD models suitable for advanced numerical simulations. To this end, this paper proposes the use of a wearable mobile mapping system that allows one to improve the digitalization stage in terms of flexibility and time required. The noise showed by the resulting point cloud, based on the simultaneous location and mapping (SLAM) solution, demands a post-processing stage that introduces the use of a parameter-free noise reduction filter. This filter improves the quality of the point cloud, allowing for the adjustment of surfaces by means of parametric and non-parametric shapes. These shapes are created by using reverse engineering procedures. The results showed during this investigation highlight a novel application of this sensor: the creation of as-built CAD models for advanced numerical simulations. The results of this investigation are complemented by a valuable contribution with respect to the use of an advanced restoration solution, by means of textile reinforced mortar. To this end, the CAD model is used as the geometrical base for several numerical simulations by means of the finite element method. All this procedure is applied in a construction with structural problems.
1. Introduction
The modern concept of the restoration and conservation of historical constructions demands the use of multidisciplinary and scientifically proved approaches able to study the building from different points of view. Inside this context, the analysis of the structural stability of the building plays an essential role in the design of a proper restoration action or conservation plan. Nowadays, there are plenty of applications able to simulate the structural stability of historical constructions, from classical approaches based on the limit analysis theory to modern computational strategies that use the discrete or the finite element method (FEM) [1]. FEM could be considered as one of the most powerful and versatile strategies, able to simulate different scenarios such as material losses, construction stages, seismic events or settlements among others [2,3,4]. Within this context, there are several investigations that highlight the necessity of having rigorous structural mapping and the consequent numerical implementation, especially against seismic events on which the construction could suffer redundant structural damages [5,6,7,8]. According to this, a proper survey and building mapping is required for an adequate numerical simulation, demanding the proper integration of different approaches coming from the geoinformatics. This discipline is able to provide a set of remote sensing approaches, such as static terrestrial laser scanning or photogrammetry (especially by means of the structure from motion approach), that can create as-built CAD models [2,3,9,10,11]. These methods allow one to digitalize historical structures in form of point clouds. Then, these point clouds are post-processed to adapt it to further numerical evaluations. One of the most recent methods to pass from the point cloud to the numerical model is the Cloud2FEM method developed by Castellazzi et al. [12]. This method transforms the point cloud into a solid model by means of voxel elements. Another recent method is the approach proposed by Gonizzi et al. [13]. This approach is based on the use of a retopologization of the mesh, allowing to create as-built CAE models. Both strategies require a point cloud with the absence of holes, not controlling the level of detail introduced in the numerical simulation as well as requiring further post-processing in the case of introducing different types of materials or even construction joints. In contrast to this, it is possible to find alternatives in the literature based on the use of the latest advances in reverse engineering procedures [3,14]. This approach is able to manage the level of detail of the final model as well as to represent the construction imperfections [14] or even complex deformation by means of non-uniform rational basis splines (NURBS) surfaces with great accuracy [3], making it possible to manage incomplete point clouds. These types of surfaces are mathematical models based on the use of basis splines (B-splines) curves that allow one to model complex non-parametric surfaces with great accuracy. To this end, the NURBS surface uses a set of control points with different weights, as well as a set of B-splines on orthogonal directions which can be defined by a bi-variable local coordinate system made up by U and V axes. Large values of control points along its local direction (U or V) imply higher computational costs but more accurate results in this direction [15]. In all the cases previously showed, the digitalization of the structure is required by means of remote sensing strategies.
Since its early development in 1980, hybrid solutions such as the mobile mapping system (MMSs) have emerged as a potential alternative to structure from motion (SfM) and static laser scanning approaches [16]. These devices combine the spatial referencing provided by a position unit with the geometrical data captured by a mapping sensor (laser scanner head or a digital camera) [16] through the use of the so-called simultaneous location and mapping approach (SLAM) [17]. This combination places this approach as the most effective digitalization strategy, especially in complex scenarios on which a large number of scan stations, or even a complex photogrammetric network are required [16,18]. The studies carried out by Fillipo et al. [19]; Barba at al. [20] or Sánchez-Aparicio et al. [21] highlights its efficiency, making it possible to minimize in around 10 times the effort required for digitalizing this scenario by means of a static laser scanner. Inside the different MMSs available nowadays, the wearable mobile mapping solutions (WMMS) are one of the most used. Basically, these devices are adapted to be easily carried by a person, making it possible to digitalize a scenario simply by walking. Its flexibility allows one to digitalize a wide variety of Cultural Heritage (CH) scenarios, which are commonly characterized by the presence of complex and narrow spaces [20,21,22,23], or even large surfaces [18,19]. Barba et al. [20] present a work on which a WMMS is used in the inner part of the Chapel of the Holy Shroud with the presence of narrow spaces. Nocerino et al. [22] use this solution to digitalize an underground Word War fortress. It is worth mentioning that the main application of the point cloud obtained by this type of sensor is mainly focused on the extraction of basic cartographic products, such as plants or sections [19,21], as well as for the dissemination and valorisation of CH scenarios [22]. Its use within the diagnosis of historical constructions, i.e., for the creation of advanced numerical simulations, is an open issue nowadays without research works focused on this. In this sense, Sánchez-Aparicio et al. [21] make a comparison, from the structural point of view, between a WMMS and a high precision static laser scanner. To this end, two different 2D finite element simulations were created and simulated. One was based on the data captured by a WMMS and another one based on the terrestrial laser scanner (TLS) point cloud. The results obtained highlights the potentialities of this approach in contrast with the traditional ones, obtaining a discrepancy of about 3% in terms of safety factor and showing the same collapse mechanism [21].
Another relevant issue for the restoration of historical constructions concerns the use of suitable retrofitting techniques. These types of interventions demand the development of extensive experimental campaigns, monitoring tasks as well as numerical analysis that allows one to have a complete knowledge of the construction and its history [24]. Nowadays there are plenty of applications that allow one to restore historical constructions depending on the symptoms showed. Within this complex context, the use of textile reinforced mortars (TRMs) has gained remarkable attention over the last few years [25]. This type of solution is a composite material made up by fibre roving embedded in an inorganic matrix, improving the mechanical behaviour of masonry structures against axial loads, in-plane shear/flexure and out-of-plane flexure. Several studies can be found in the most recent literature highlighting its suitability and efficiency in historic masonry structures, especially in the case of strengthening against seismic actions [26,27,28], demanding the use of experimental campaign as well as the development of proper numerical models able to simulate its particular mechanical behaviour against different events [26].
Under the basis previously exposed, this work aims at improving the current methodologies for generating as-built CAD models for advanced 3D numerical simulations. To this end, the proposed approach investigates the use of a WMMS solution with the aim of minimizing the time invested for creating 3D CAD models by means of reverse engineering approaches. Additionally, this paper evaluates the use of a parameter-free noise reduction filter. These types of filters are not commonly used due to the robustness of the static approaches [3,10]. However, investigations carried out by Nocerino et al. [16], Fillipo et al. [19] and Barba et al. [20] highlight the presence of a certain noise in the MMS’s point clouds that could hinder the creation of surfaces required for reverse engineering. With respect to the previous work carried out by the authors [21], this work proposes a methodology for using the WMMS point cloud as a geometrical base for 3D CAD models. This methodology includes the use of several automatic segmentation approaches based on the random sample consensus (RANSAC) method, the use of NURBS approaches as well as the use of an anisotropic filter in order to enhance the quality of the 3D point cloud obtained by the WMMS.
Apart from contributing to the improvement of creating as-built CAD models, this work advances in the knowledge of the structural behaviour of novel constructive solutions, more specifically TRM retrofitting techniques. To this end, a retrofitted masonry construction was analysed: the Romanesque church of San Pedro in Becerril del Carpio (Palencia, Spain), allowing one to obtain conclusions about the efficiency of this type of solution against vertical and horizontal loads.
After the Introduction, Section 2 describes the study case used as well as its current conservation status. Section 3 presents the methodology used for generating an advanced numerical simulation using a WMMS. Section 4 shows the numerical simulations carried out, confronting the structural performance of the church with and without TRM layers on the extrados of its vaults. In Section 5, the discussions and conclusions are drawn.
2. The Romanesque Church of San Pedro (Becerril del Carpio, Palencia, Spain)
2.1. Description of the Structure
The Catholic church of San Pedro is located at the municipality of Becerril del Carpio in the province of Palencia (Castilla y León, Spain) (Figure 1). The construction of the church started in 1262, showing some elements, such as the apse, in the Late-Gothic style.
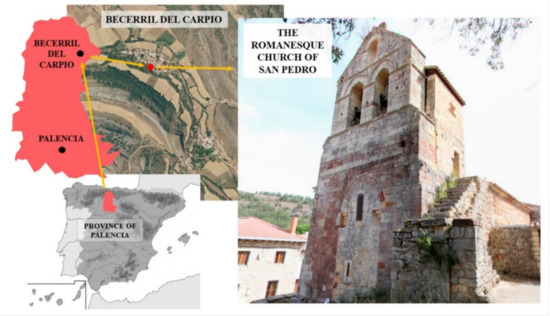
Figure 1.
Location of the Romanesque church of San Pedro (Becerril del Carpio, Spain).
The church has a unique nave with a length of 23.71 m and a width of about 8.78 m. This nave shows a Late-Romanesque barrel vault with around 0.31 m thickness and an eight ribbed vault in the apse and a tower at its beginning [21] (Figure 2). Between the barrel and the ribbed vault, is possible to observe a triumphal arch supported by two columns with Gothic capitals. Both constructive elements were built with a regular sandstone masonry. The vertical walls that support the vaults respond to a typical three leaf masonry wall made up by two faces of regular sandstone and an infill core. The north-east wall has an average width of 0.87 m with a total of four buttresses made up with regular sandstone. On the other hand, the south-east wall has an average width of 1.43 m without the presence of buttresses (Figure 2b). The tower was built with a regular limestone masonry, showing in the east part of it a space made up by regular sandstone and brick masonry. The body annexed to the main nave serves nowadays as sacristy and is covered by an eight-side ribbed vault (Figure 2c).
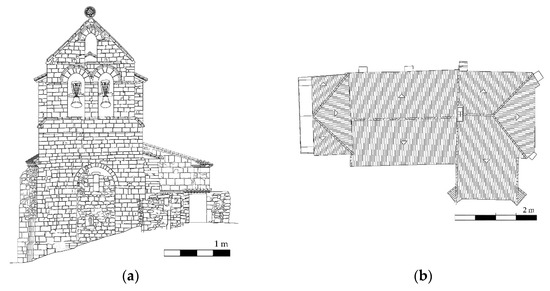
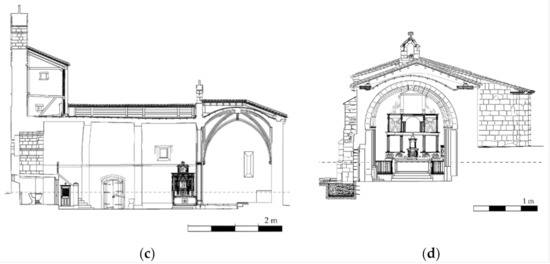
Figure 2.
Planimetry of the church: (a) main elevation; (b) top view; (c) longitudinal section and (d) transversal section.
2.2. Intervention Works Carried Out during 2011
In 2007, the conservation status of the church was considered deficient. This status was promoted by the lack of conservation actions, such as the presence of biological colonies, moistures as well as garbage. All these elements were accelerating the degradation of the different assets placed within the church. Additionally, a modification of the soil properties promoted the presence of a settlement on the north part of the church. In response of this soil modification, the main nave of the church suffered a large movement to adapt its shape to the new boundary conditions. Several cracks appeared along the tower and the annexed body as well as out-of-plane movement in the north part of the main nave within the presence of several plastic hinges along the vaults (Figure 3).
Figure 3.
Conservation status before the intervention: (a) structural movement of the tower; (b) large deformation in the main nave; (c) cracks, moisture and detachment on the ribbed vault and (d) presence of moisture, erosions, detachment and garbage at the entrance of the annexed body.
According to this condition, a diagnosis work was carried out with the aim of investigating the origin of the different damages observed. In line with the result obtained during the diagnosis phase, a restoration project was carried out in 2011 acting in different parts of the church: (i) the assets and (ii) the structure. The latter was retrofitted by adding an armoured concrete solution made up by a concrete HA-25 (equivalent to a C25/30 in the Eurocode 2) as well as a steel B-500S (equivalent to a S500 in the Eurocode 2) (Figure 4a) [29]. Complementary to this action, the extrados of the vaults was retrofitted with a TRM solution. This composite solution was made up by a lime matrix with carbon fibres, adding a total of three layers, each one with an average thickness of 10 mm (Figure 4b,c). The original roof of the church, made up by an infill layer until the tiles, was replaced by a timber solution with cross-laminated beams supported at both side of the nave and covered by a waterproof solution and ceramic tiles (Figure 2c,d) (Figure 4d).
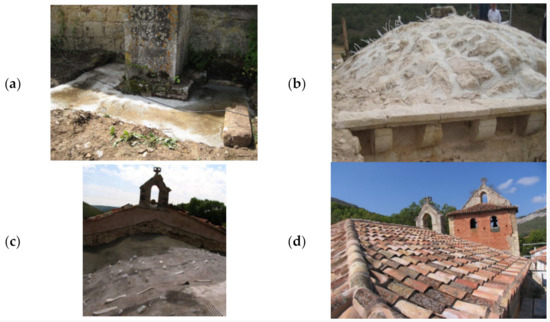
Figure 4.
Restoration works at structural level: (a) addition of armoured concrete to one of the buttresses of the main nave; (b) preparation of the extrados surface of the ribbed vault for the application of the textile reinforced mortar (TRM) layers; (c) application of the TRM solution and (d) final appearance of the roof.
3. From the Point Cloud to the As-Built CAD Model
As it was stated in Section 2, the structure of the church has suffered large deformations as a result of a soil settlement. This situation has promoted the presence of complex out-of-plane deformations at the south part of the nave, the tower, as well as the ribbed vaults of the main nave (Figure 3). All of this demands the use of remote sensing methodologies able to create, in an efficient way, an as-built CAD model for further numerical simulations. According to this, a three-fold workflow was proposed as follows: (i) 3D digitalization of the heritage site by using a WMMS system equipped in a small backpack; (ii) point cloud post-processing by applying noise reduction filters and (iii) CAD modelling through the use of parametric and NURBS surfaces. All these stages are described in detail in the following sections.
3.1. Wearable Mobile Mapping System (WMMS)
The WMMS used for the present work was the ZEB-REVO mobile mapping system [30]. This device is commercialized by the company GeoSLAM [31] and it is made up by a 2D rotating laser scanner head, Hokuyo UTM-30LX-F (Hokuyo Automatic Co., Ltd. Osaka, Japan) rigidly coupled to an Inertial Measurement Unit (IMU) on a rotary engine. The data captured by both sensors is stored in a processing unit located in a small backpack (Figure 5). All these devices are carried by an operator, whose movement provides the third dimension required to generate the 3D point cloud. The 3D point cloud is generated by combining the information coming from the scanning head and the IMU sensor, using to this end the full SLAM approach of the robotic operative system (ROS) library [32]. It must be taken into consideration that the previous process is an incremental procedure, in which each segment is aligned with respect to the previous one. The error accumulation derived from the incremental procedure is minimized by a global registration on the basis that the starting and ending points are the same (closed-loop solution).
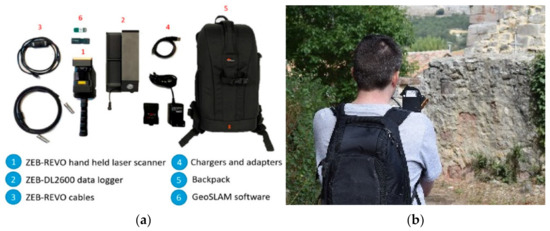
Figure 5.
Wearable mobile mapping system used: (a) main components and (b) photo taken during the data acquisition.
This sensor has a default range of 0.60–30 m for indoors environments and 0.60 to 15 m for outdoors, capturing 40,000 points per second. This device is also equipped with a GoPro camera that allows one to record a video while the laser is capturing the scene. The manufacturer ensures an accuracy of 1–3 cm for a 10-min scan, with the closing of a single loop [30]. Table 1 shows further technical specifications.

Table 1.
Technical specifications of the wearable mobile mapping solution (WMMS) used.
3.2. Digitalization of the Structure
The WMMS device previously described was used for digitalizing the church. Prior to the data acquisition with the WMMS device, an on-site inspection was carried out with the aim of designing the most appropriate data acquisition protocol, taking into account the suggestions proposed by di-Filippo et al. [19], with the following statements standing out: (i) ensuring the accessibility to all the areas; (ii) removing obstacles along the way and, (iii) planning a closed-loop in order to compensate for the error accumulation. During the data acquisition, a closed-loop path was followed with the aim of compensating the drift of the system (Figure 6). In order to ensure a homogenous density of the point cloud, the walking speed was constant, paying a special attention to transition areas such as corners or entrances.
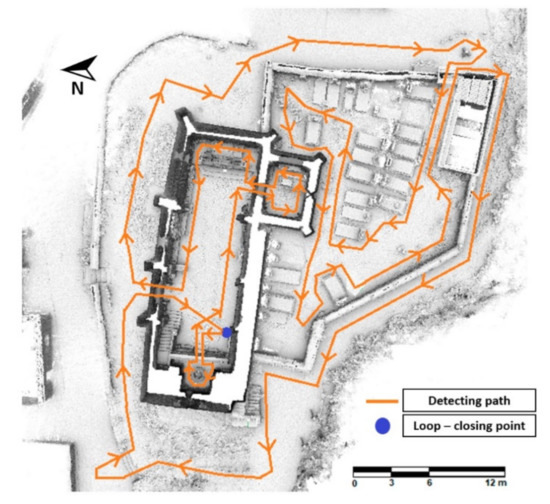
Figure 6.
Path followed during the data acquisition.
According to these considerations, a unique loop was necessary to digitalize the outdoors as well as the indoors of the church, investing a total of 16 min. Then, a full SLAM approach was applied, allowing one to fuse the data captured by the IMU and the line scanner. To this end, the ROS library was used [32] by applying the parameters suggested by di Filippo et al. [19]. This stage required a total of 18 min to be completed, allowing one to obtain a complete digitalization of the church made up by 27 million points (Figure 7). The absolute error of this 3D point cloud in comparison with a TLS one was of 0.007 m [21].
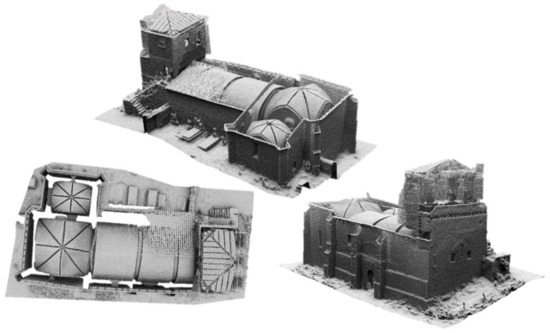
Figure 7.
General view of the point cloud obtained.
3.3. Point Cloud Post-Processing
Considering the product derived from the previous stage, a noise filtering stage was performed with the aim of improving the quality of the point cloud for the subsequent stages. In the case of the WMMS point cloud, the noise is dependent on the laser scanner as well as of the drift that appears during the pose estimation carried out by the SLAM algorithm. In this case, it was decided to split the whole point cloud of the church in nine different test areas, considering that in each area the SLAM drift could be neglected (Figure 8). Each of these test areas were aligned with respect to its homologous TLS point cloud. The TLS point cloud used was the point cloud captured during the experimental works carried out by Sánchez-Aparicio et al. [21]. After the proper alignment, a segmentation phase was carried out with the aim of deleting the non-overlapped areas between the WMMS and the TLS point cloud.
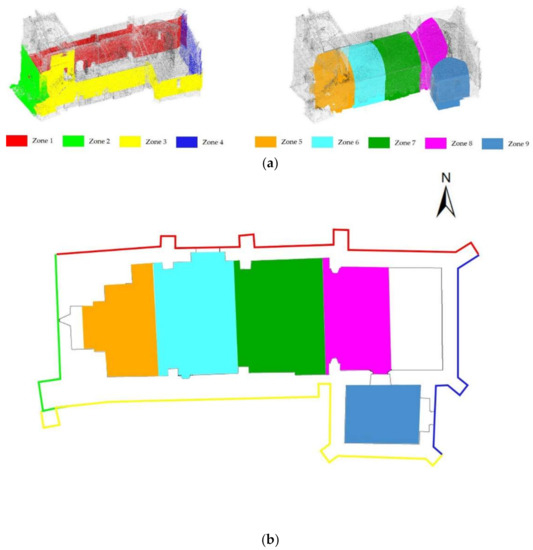
Figure 8.
Test zones considered for evaluating the performance of the noise reduction filter: (a) 3D view and (b) plant view.
Nowadays, there are plenty of filters that attempt to reduce the noise of point clouds. An example of this variety of filters is the fast cluster statistical outlier removal (FCSOR) [33]. This filter improves the traditional statistical outlier removal (SOR) filter by getting a homogeneous point cloud and performing the statistical analysis over different voxelized parts at the same time. The process is faster, obtaining better results than the traditional SOR filter. Within the emerging field of deep learning there are some filters such as PCPNET [34] and PointCleanNet [35] which estimate local shape properties from noisy and outlier-ridden point sets. Both methods, based on PointNet library [36], compare the noisy point clouds with the clean point cloud in order to train a convolutional neural network that allows one to reduce the noise. For this work, it was decided to use the algorithm proposed by Xu and Foi [37]. This denoising strategy is based on aggregation of multiple polynomial surfaces computed on directional neighbourhoods. These neighbourhoods are locally adapted in accordance with the shape of the point cloud by using the local polynomial approximation-intersection of confidence intervals strategy over each point of the point cloud. Finally, a dense aggregation of moving least squares is applied to denoise the point cloud. As suggested by Xu and Foi [37], this algorithm is able to reduce the noise while preserving fine features as well as sharp edges. It is worth mentioning that the TLS point cloud obtained by Sánchez-Aparicio et al. [21] in this church was considered with the aim of evaluating the performance of this algorithm. Thus, the discrepancies of the WMMS point cloud and the TLS point cloud could be considered a valid metric for evaluating the quality of the denoised WMMS point cloud. These discrepancies, before and after the application of the filter, were obtained by using the cloud-to-cloud comparison available in the open-source software CloudCompare® [38]. Before applying the filter (Figure 9a) the maximum discrepancies between clouds is 3 cm and 78% of the points have an error below 1 cm. After applying the filter (Figure 9b), the maximum discrepancies are 2 cm and 95% of the points have less than 1 cm of difference.
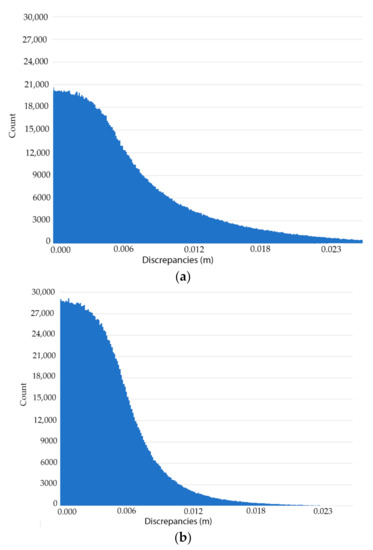
Figure 9.
Histograms of the relative discrepancies between the terrestrial laser scanner (TLS) and the WMMS in the test zone 3: (a) before applying the filter, the maximum error is 3 cm and around 80% of the data are below 1 cm of error and (b) after the application of the noise reduction filter, the maximum error is 2 cm and 95% of the data are below 1 cm of difference.
As highlighted by Rodriguez-González et al. [39]; the use of Gaussian estimators (i.e., mean and standard deviation) would be not appropriate to evaluate the discrepancies between two point clouds. According to this, the normality of the samples was evaluated by means of the QQ-plot. The results obtained by the application of the QQ-plots showed that the discrepancies do not follow a normal distribution (Figure 10), requiring to use non-parametric indexes such as the median (m) and the NMAD values (Equations (1) and (2)).
NMAD = 1.4826 · MAD,
MAD = m·(|xi-mx|),
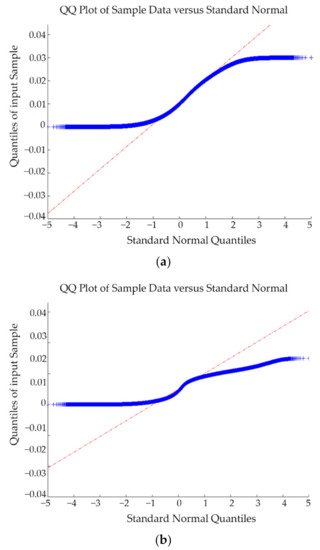
Figure 10.
QQ-plots of the relative discrepancies between the TLS and the WMMS in the test zone 3: (a) before and (b) after the application of the noise reduction filter. In blue, the deviation of the quantiles position of the sample in comparison with expected quantiles for a normal distribution. In red, the trend line for a perfect Gaussian population.
Table 2 shows the statistical results obtained in the different test areas. As it was expected, the median value obtained was low due to the decision to evaluate small areas which were registered by means of the ICP algorithm. The NMAD values before noise reduction were in accordance with the expected errors of the WMMS point cloud. Both estimators, median and NMAD, improve with the application of the anisotropic filter. This improvement is also visible from a qualitative point of view (Figure 11).
Table 2.
Statistical results over different zones of the point clouds. On the left, it is shown the results before applying the anisotropic filter and on the right, the results after the filter has been applied.
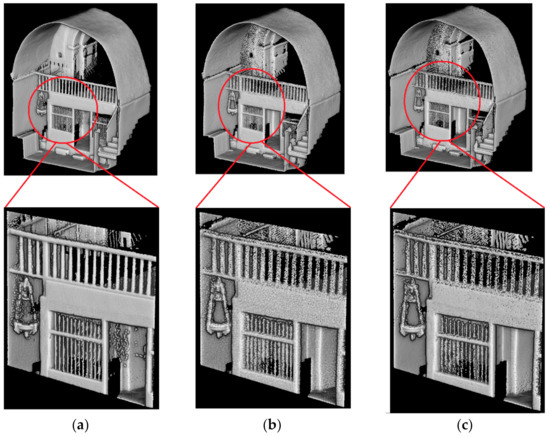
Figure 11.
Noise reduction stage within the test zone 5: (a) reference point cloud coming from the TLS campaign; (b) original WMMS point cloud and (c) filtered WMMS point cloud.
3.4. Reverse Engineering
The current section shows the semi-automatic reverse engineering procedure used to obtain the as-built CAD model from the WMMS point cloud (Figure 12).
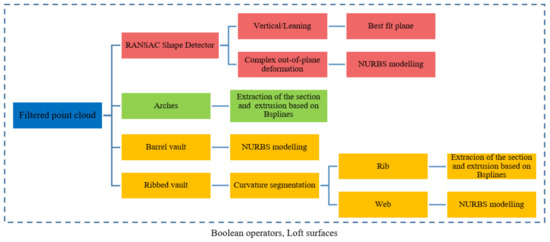
Figure 12.
Graphical workflow proposed for creating the as-built CAD model. The red rectangles are those stages used for modelling the masonry wall. The green and orange rectangles include the strategies for modelling the arches and the vaults, respectively. RANSAC: random sample consensus.
In a first stage, the procedure defined by Sánchez-Aparicio et al. [40] for extracting and evaluating the deformation of vertical walls was applied. The results allow us to classify the walls into two groups (Figure 13): (i) vertical/leaning walls and (ii) walls with complex out-of-plane deformations. The vertical/leaning walls were modelled by adjusting its points to the best-fit plane. The parameters of this plane are those obtained by the random sample consensus (RANSAC) shape detector algorithm [41]. On the other hand, the walls with complex out-of-plane deformations were modelled by using the surface deformation approach suggested by Barrazzetti et al. [15]. This approach allows one to model complex surfaces, i.e., organic shapes, vaults or deformed constructive elements, by a progressive modification of a seed surface, transforming it into a NURBS surface that follows the point cloud closely. The modification of this surface is carried out by varying the weights, control points and knot vectors of the NURBS surface until the adjustment is reached. To this end, a planar seed surface with a total of 32 subdivisions along the U and V axis was considered. These parameters allow one to model the north walls with great accuracy (Figure 13).
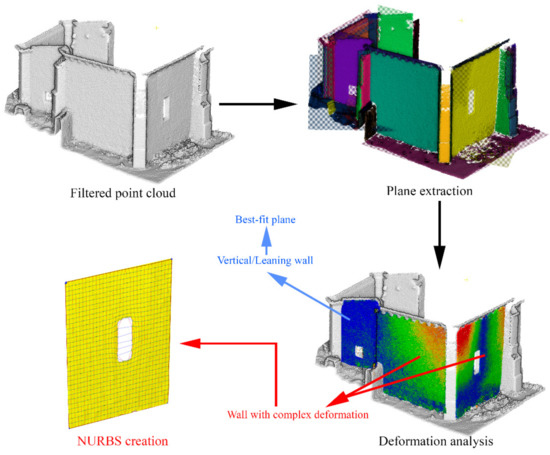
Figure 13.
Workflow used for modelling walls.
The different arches of the main nave were modelled as follows: (i) the extraction and vectorization of a transversal and longitudinal section at the middle of the arch by using b-splines and (ii) the extrusion of the transversal section along the longitudinal one. On the contrary, the vaults were modelled by using the surface deformation approach previously defined. On the one hand the barrel vault was modelled directly, meanwhile the ribbed vaults were modelled by using a three-fold approach. Firstly, a segmentation based on curvature was applied, allowing one to split the ribs from the webs. Then, the ribs were modelled in a similar way to the arches, simplifying its original shape to a rectangular one with the same inertial values. Finally, the different webs of the vault were modelled using the surface deformation approach. Both approaches allow to one obtain an accurate CAD representation able to represent the different irregularities of the vaults. As Figure 14 shows, around 75% of the points could by represented with a total agreement in comparison with the original point cloud. The major discrepancies are about 1 cm, appearing on areas with strong curvature variation. These discrepancies are in line with other research works [15] and could be improved by using a higher number of subdivisions. It is worth mentioning that the extrados of the vaults, which were not captured by the WMMS, were modelled by applying the offset operator proposed by Barattezzi et al. [15], using to this end the values extracted in Sánchez-Aparicio et al. [21]. The infill of the vaults was modelled manually by assuming the criteria adopted in the previous work [21].
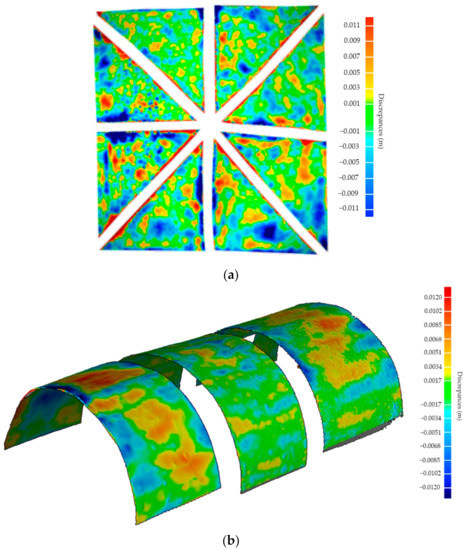
Figure 14.
Discrepancies between the point cloud and the as-built CAD model: (a) barrel vault and (b) ribbed vault.
All the constructive elements and materials were integrated in a unique CAD model by using different Boolean operators as well as different Loft surfaces. As a result, it was possible to create an as-built CAD model able to capture the complex deformations of the church for further numerical simulations (Figure 15).
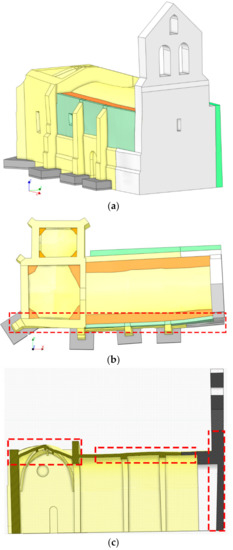
Figure 15.
As-built CAD model: (a) general view; (b) plant view and (c) transversal section. In red it is highlighted some areas of the church with complex deformations properly modelled by the proposed approach. In yellow, grey and green the different masonries identified, in orange the infill of the vaults.
4. Structural Analysis
This section outlines the different considerations and results obtained during the structural analysis of the church. In this case, it was decided to use the FEM strategy for evaluating the influence of the TRM solution from a static and a dynamic point of view. Firstly, a numerical mesh was generated by using the as-built CAD model previously generated. Then, the different materials were considered by defining specific constitutive models. Finally, several numerical analyses were carried out with the aim of evaluating the structural performance of the church against vertical and horizontal loading. All these stages were performed in the commercial FEM package TNO Diana® [42].
4.1. Numerical Mesh
Due to the complexity of the model, it was decided to create a fine mesh based on linear elements according with the recommendations exposed by Lourenço and Pereira [43]. Taking this into consideration, the average size of the element was about 0.15 m, ensuring at least three elements along the thickness of the vertical walls. Concerning the vaults, and taking into consideration the non-linear areas that will appear during the different numerical simulations, the average size of the element was reduced to 0.10 m. In both cases, solid tetrahedral elements were used. The TRM layers were modelled by using a set of curved shell elements for defining the matrix in which the textile is embedded as an equivalent grid without the possibility of slippage [26]. This modelling strategy was also used for defining the armoured concrete placed at the foundation level. As a result of these considerations, the numerical model was made up by a total of 507,595 elements (Figure 16): (i) 17,028 shell elements for simulating the TRM layers and (ii) 490,567 solid elements for simulating the masonry, concrete and infill layers of the church. On the one hand, the shell elements chosen were three-node triangular isoperimetric curved shell elements with a total of five integration points along its thickness. This assumption is in line with the suggestions made by Oliveira et al. [26]. Regarding the solid elements, it was decided to use four-node, three-side isoparametric solid pyramid elements with linear interpolation and numerical integration as suggested by Lourenço and Pereira [43]. This combination of elements, shell and solid, is common when real-scale historical structures are simulated [44,45]. Finally, a set of control nodes were chosen with the aim of evaluating the displacements suffered on key parts of the church (Figure 16).
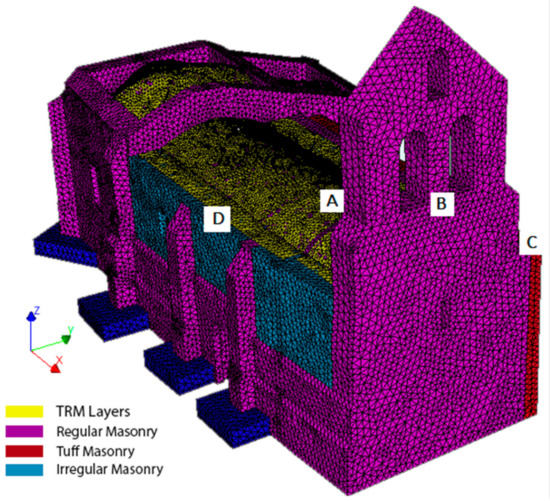
Figure 16.
General view of the numerical mesh. The point A refers to the control node placed at the intrados of the barrel vault. Point B refers to the control node used for the pushover analysis in the +X direction. The control node placed at the same height but at the intrados of the tower was used for the analysis in the –X direction. Points C, D refer to the nodes used for the pushover analysis in the direction +Y and –Y, respectively.
4.2. Constitutive Models and Material Properties
The mechanical behaviour of the masonry elements was defined by using a macromodelling approach. More specifically, the total strain crack model implemented was used in the non-linear FEM package TNO Diana®. In this case, a post-peak exponential softening law was used for the tensile regime. Meanwhile, the compressive behaviour was simulated by using a post-peak parabolic and exponential softening. The Young modulus, density and compressive strength of the masonries were determined in accordance with Table C8A.2.2 of the Italian standard NTC 2008 [46]. Due to the absence of specific mechanical tests, a knowledge level of LC1 was assumed. Thus, the compressive strength of the masonry was reduced by 1.35. The Poisson ratio for all the masonries was established as 0.2, meanwhile the non-linear properties of these elements were obtained from the following considerations [47]: (i) a ductility index of 1.6 mm and (ii) a tensile strength comprised between 0.2 and 0.1 N/mm2 with a mode I fracture energy of 0.05 N/mm. The infill of the vaults was modelled by assuming the properties of the irregular masonry showed within Table C8A.2.2. Table 3 shows the numerical values of the properties considered.
Table 3.
Mechanical properties of the different materials used during the numerical simulation.
The concrete was simulated by following the total strain crack model, using to this end the properties suggested by the Eurocode for a concrete type C-25/30 and a steel S500 [29]. On the other hand, the TRM layers were simulated by using a macromodelling strategy, as suggested by Oliveira et al. [23]. The mechanical properties of each part of this composite solution, matrix and fibre were obtained from the manufacturer (Table 4) as well as the experimental results obtained in similar works [48]. For the mortar, a total strain crack model with a plateau and parabolic function was assumed for the tensile and compressive regime, respectively. On the contrary, the fibre was simulated as a perfect brittle material.
Table 4.
Mechanical properties of the matrix and fibre materials used in the TRM layers.
4.3. Structural Impact of the TRM Layers
This section has the aim of evaluating the impact of the retrofitted solution in the response of the structure. To this end, several non-linear analyses were carried out, namely: (i) gravitational analysis for evaluating the performance of the TRM layers against vertical loading and (ii) seismic analysis for checking the contribution of these layers to the horizontal capacity of the church. The regular Newton–Rapson method in combination with the arc-length control and the line-search technique were used as algorithms for solving the non-linear problem. The convergence criteria established was based on energy, using a threshold of 0.001. It is worth mentioning that the roof of the church was represented by means of a superficial load, assuming the load used in Sánchez-Aparicio et al. [21].
4.3.1. Results Obtained from the Static Non-Linear Analysis
This section is devoted to showing the numerical results obtained during the non-linear static analysis. In this case, two different numerical simulations were carried out with the aim of evaluating the contribution of the TRM layers to the vertical capacity of the church: (i) a simulation considering only the armoured concrete and (ii) an analysis considering the armoured concrete as well as the TRM layers. In both cases, the load increases until the collapse of the structure.
To evaluate the structural performance of the church against vertical loading, a non-linear static analysis increasing gravitational loading until failure was carried out. The control node selected for displacement monitoring corresponds to point A indicated in Figure 16, which is located at the intrados of the barrel vault. As a result of these analyses, it was possible to estimate the safety factor of the structure in terms of a load factor with respect to the self-weight considering both scenarios, without strengthening and with the retrofitting based on the TRM composite solution.
Figure 17, Figure 18 and Figure 19 shows the results of these analysis. As it was expected, the church can stand a large gravitational load before collapsing, suggesting that in the absence of a soil problem the structure is safe (including or not the TRM layers). In the absence of the TRM layers, the church has a safety factor of 8.86. Meanwhile, the presence of this composite solution slightly increases the safety factor to 9.03, also incrementing the stiffness of the structure (Figure 17). The collapse in both cases is similar, appearing with the inclination of the north wall as well as the formation of plastic hinges in tensile and compressive regimes at the vault of the main nave (Figure 18) (Figure 19). In the case of considering the TRM layer, the cracks at the extrados appears at the beginning of the vault, more specifically in the frontier between the vault retrofitted and the vault without TRM (Figure 19).
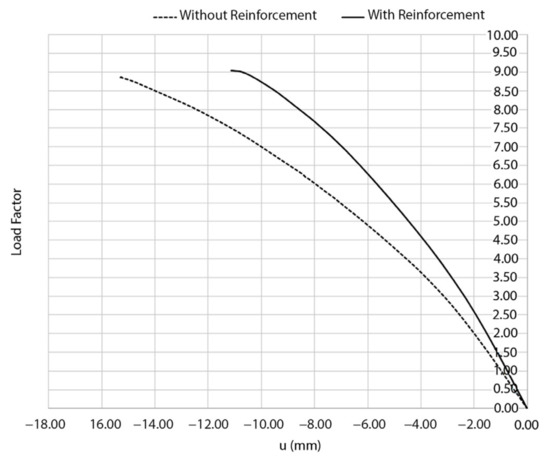
Figure 17.
Load–displacement curves obtained during the static non-linear analysis. The dash line represents the structure with the TRM layers.
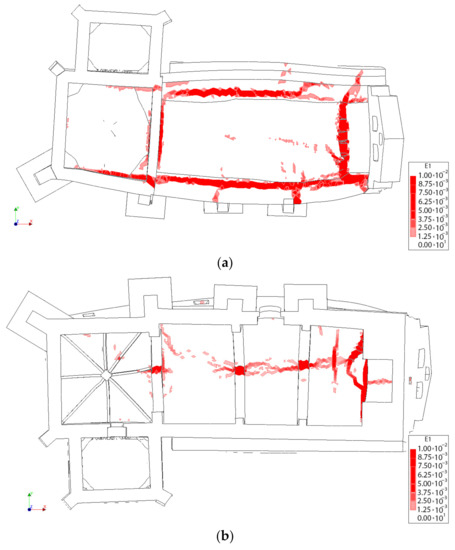
Figure 18.
First principal strains at the moment of collapse in absence of TRM layers: (a) view from the extrados of the vault and (b) view from the intrados of the vault.
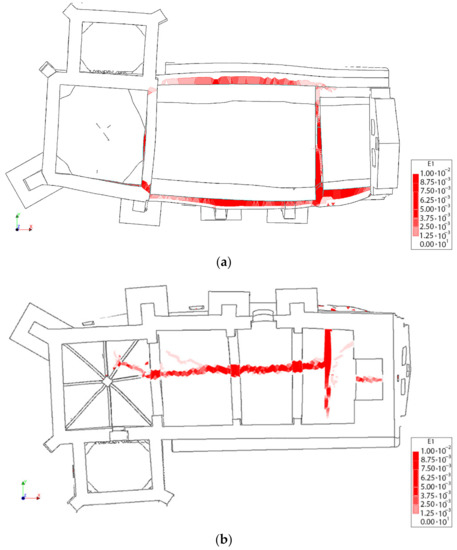
Figure 19.
First principal strains at the moment of collapse in presence of TRM layers: (a) view from the extrados of the vault and (b) view from the intrados of the vault.
4.3.2. Results Obtained from the Seismic Analysis
As several authors have highlighted [26,27,28], the use of TRM layers have a large impact on the seismic performance of historical constructions. According to this, further numerical evaluations were carried out with the aim of evaluating the contribution of the TRM layers of the church, as well as to know the maximum allowable acceleration. From the different non-linear numerical strategies able to simulate the seismic performance of masonry constructions, the current work uses the pushover analysis.
The non-linear static (pushover) analysis is a numerical method proposed by many standards such as Eurocode 8 for estimating the seismic performance of a structure. This method is well documented in the existing literature [43,49]. During this stage, the structure is subjected to gravity loading as well as a monotonic lateral loading pattern that represents the inertial forces acting on the structure during a seismic event. In this work, a total of four analyses using transversal lateral forces proportional to the mass were carried out to evaluate the seismic performance of the church in the longitudinal (+X, −X) and transversal directions (+Y, −Y) (Figure 16). The results of these analyses are given in terms of the so-called capacity curves, describing the displacement at some predefined control nodes (Figure 16) against the base shear factor, i.e., the ratio between the horizontal forces acting at the base of the structure and its total self-weight. It is worth mentioning that the control points considered during this analysis were placed on critical areas (Figure 16): (i) at the top of the tower for the pushover at the direction X and (ii) a point at the top of the walls placed at the middle of the nave for the pushover analysis carried out at the direction Y.
As in the previous section, the regular Newton–Raphson method, combined with the arc-length control and the line-search technique, was adopted to obtain the solution of the arising non-linear equations system. This method allows one to predict the deformations and damage as well as the weak areas of the church. It is worth mentioning that the equilibrium of the equation system is guaranteed by using the same criterions as those exposed in the previous section.
The result of the pushover analysis highlights the influence of the TRM layer in the seismic performance of the structure, especially in the lateral direction (+Y, −Y). In this situation, the maximum load factor of the church increases from a value of 0.55 and 0.52 to 0.64 and 0.59 (Figure 20). The asymmetric values obtained from the different evaluations are in line with the asymmetric arrangement of the structure (Figure 20, Figure 21, Figure 22, Figure 23 and Figure 24). In both cases, the presence of TRM layers allows one to prevent the creation of diagonal cracks along the main barrel vault. In this situation, the damage is focused on the vicinities of the main nave (Figure 22 and Figure 24).
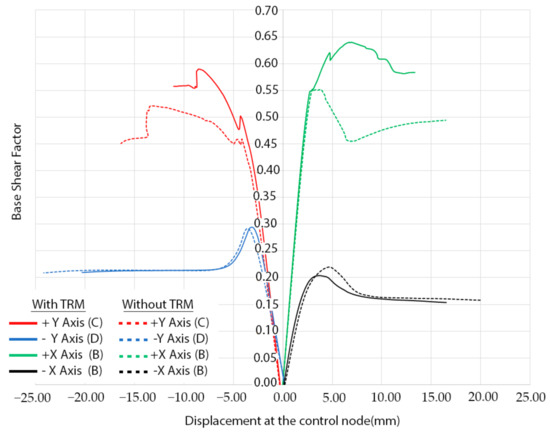
Figure 20.
Mass-proportional pushover capacity curves in the four main directions (red colour for the +Y, green colour for +X, blue for the −Y and black for the −X). Dash lines represent the behaviour of the structure without the TRM layer. The control points used for each curve has been placed between markers.
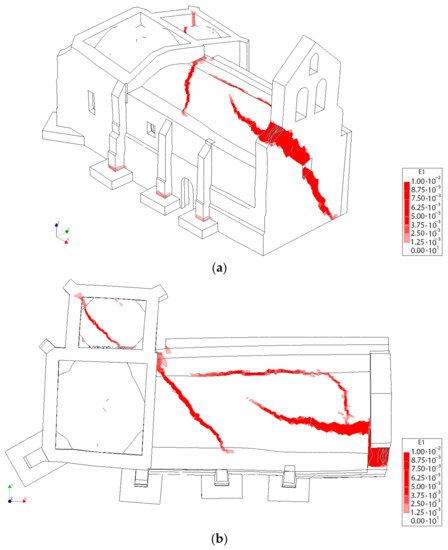
Figure 21.
Distribution of the first principal strains at the collapse point in the transversal direction +Y without considering the TRM layers: (a) 3D view and (b) plant view.
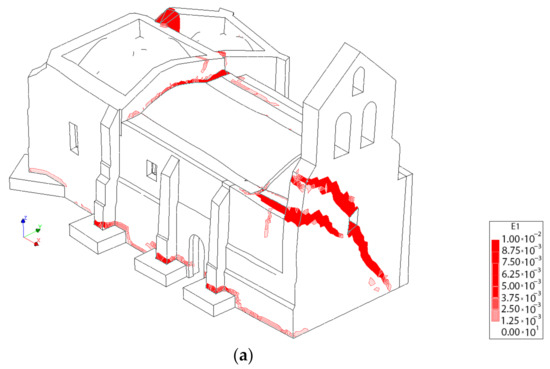
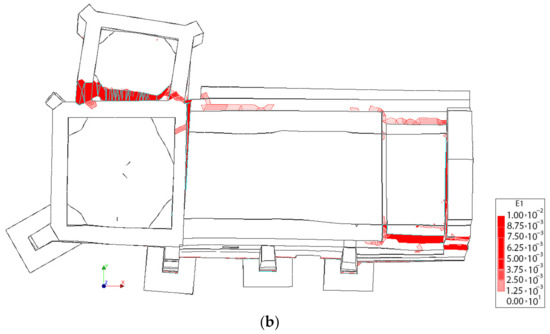
Figure 22.
Distribution of the first principal strains at the collapse point in the transversal direction +Y, considering the TRM layers: (a) 3D view and (b) plant view.
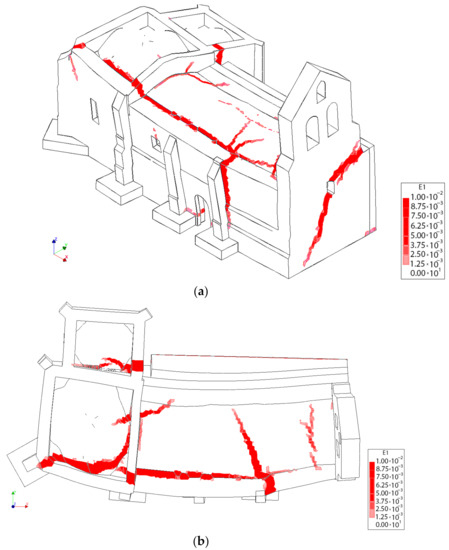
Figure 23.
Distribution of the first principal strains at the collapse point in the transversal direction −Y without considering the TRM layers: (a) 3D view and (b) plant view.
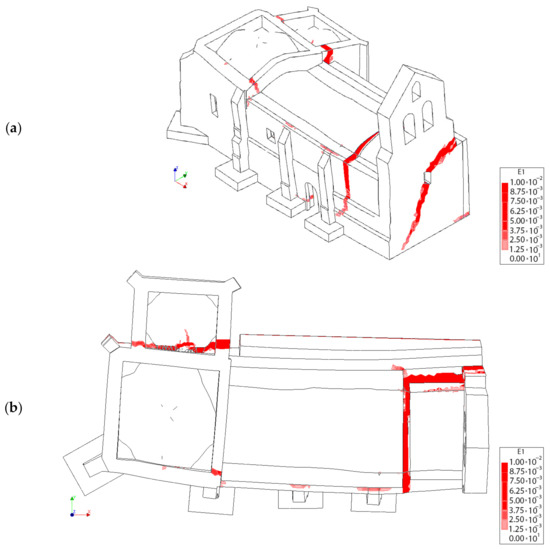
Figure 24.
Distribution of the first principal strains at the collapse point in the transversal direction −Y, considering the TRM layers: (a) 3D view and (b) plant view.
With regard to the longitudinal direction, it is possible to observe that the TRM layers do not have a considerable influence on the seismic performance of the church. In both cases, the collapse is produced by the overturning of the main façade of the tower (Figure 25), which is a local failure mode. This point clearly reflects that pushover analysis, although being a very useful and powerful tool for seismic performance assessment, sometimes might present some limitations, especially with respect to a more comprehensive non-linear time history analysis. This direction represents the most vulnerable direction of the church with a maximum capacity of 0.29 (Figure 20).
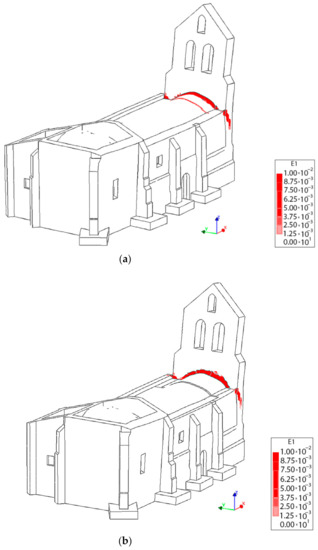
Figure 25.
3D view at the moment of the collapse: (a) without TRM layers and (b) with TRM layers.
The verification of the structural safety for the seismic action was carried out following the Spanish seismic code [50]. In particular, the assigned peak ground acceleration value for this area is lower than 0.04 g. Adopting a force-based seismic assessment criterion [43], it can be concluded that the church meets the requirements in all the situations, being the minimum capacity obtained for the positive X direction (0.20 g). Thus, pushover analysis, besides bringing invaluable results regarding the seismic safety level of the structure, was also used in this study to judge the effectiveness of the TRM-based retrofitting strategy as well as to evaluate the overall mechanical performance in terms of damage progression and the identification of potential vulnerabilities or weak areas.
5. Conclusions
From this study, it was possible to extract different conclusions with respect to the WMMS sensor as well as the use of composite solution for retrofitting masonry structures. On the one hand, the use of WMMS devices show several advantages, such as the great performance or the flexibility of it. Regarding the first one, the time invested for digitalizing the church was reduced by about 7.5 times in comparison with traditional techniques. With respect to the second one, the great portability makes it possible to digitalize complex and narrow spaces. However, the data provided shows noise which hinders the creation of a CAD model and requires the use of noise reduction filters. Regarding this, we propose the use of a parameter-free noise reduction filter that increases the quality of the point cloud, minimizing its discrepancies with respect to a TLS point cloud by about 37%, with some areas in which the decrease is about 60% (Table 2). This improvement is lower in the inner zones due to the presence of ornamental parts. Additionally, it is possible to observe an increase in the quality from a visual point of view, that makes the reverse engineering stage easier (Figure 11). The time required for this stage could be considered acceptable, investing a total of 50 min for filtering a point cloud of 27 million points. This stage was carried out in a PC Mountain Studio3D i5 Ivy with Intel Core i5-3570K processor and 32 Gb RAM with operating system Windows 10 64 bits. The use of this filter, which is parameter-free, allows one to improve the application of reverse engineering procedures by any person who is not an expert in the field.
Regarding the reverse engineering strategy, the use of RANSAC approaches with curvature segmentation strategies and NURBS-based approaches allows one to properly model the deformations of a structure, increasing the automation of the process. However, the presence of shadows in the original point cloud as well as the necessity of splitting the different materials requires the intervention of the user in order to obtain a reliable CAD model for further numerical evaluations.
Finally, from this work it is possible to conclude that the use of TRM solutions, which are invasive solutions, increase the lateral capacity of the structure evaluated by about 115% in contrast with an increment of 102% for the vertical loading. This system seems to be efficient in seismic areas.
Future works will be focused on the use of complementary modelling strategies such as the retopologization of the mesh. This approach will allow one to reduce the amount of user intervention during the CAD modelling stage which contains several steps that are performed in a manual way, requiring the investment of large amount of time. Additionally, an extensive experimental campaign will be planned, devoted to obtaining more data about the mechanical behaviour of the masonries by means of sonic testing or even the use of operational modal analysis for updating the numerical model. This data will be complemented by additional structural analysis (e.g., 3D limit analysis) in order to double-check the results obtained. Finally, it is planned to develop a 3D numerical model with the TLS data. This model will be used to compare the numerical results obtained with a 3D FEM model generated with the WMMS and the TLS point cloud.
Author Contributions
Conceptualization, L.J.S.-A., B.C., M.Á.M.-G., R.M. and M.S.-A.; methodology, L.J.S.-A., B.C., R.M.; formal analysis, L.J.S.-A., M.Á.M.-G. and D.G.-A.; writing—original draft preparation, L.J.S.-A., M.Á.M.-G., R.M., M.S.-A. and D.G.-A.; writing—review and editing, L.J.S.-A., B.C., M.Á.M.-G., R.M., M.S.-A. and D.G.-A. All authors have read and agreed to the published version of the manuscript.
Funding
This research was partially funded by ERDF funds through the V SUDOE INTERREG program within the framework of the HeritageCARE project, Ref. SOE1/P5/P0258 and the research project Patrimonio 5.0 funded by Junta of Castilla y León, Ref. SA075P17.
Data Availability Statement
Not applicable.
Acknowledgments
The authors would like to thank Santa Maria la Real Foundation for providing part of the data necessary for this study. Special thanks to the architects Juan Carlos Prieto Vielba and Jesús Castillo Oli. These architects designed the restoration action carried out on the church whose project title was “Proyecto básico y de ejecución de restauración. Iglesia de San Pedro. Becerril del Carpio. Palencia”. The authors also want to thank the Junta de Castilla y León and the Fondo Social Europeo for the financial support given through programs for human resources (EDU/1100/2017) to the corresponding author of this paper (R.M.), and to the European Union for providing a post-doctoral Grant to another of the authors within the actions Marie Skłodowska-Curie Individual Fellowships, H2020-MSCA-IF-2019 (Grant agreement ID: 679 894785; AVATAR project) (M.A.M.G.).
Conflicts of Interest
The authors declare no conflict of interest.
References
- Roca, P.; Cervera, M.; Gariup, G.; Pela’, L. Structural analysis of masonry historical constructions. Classical and advanced approaches. Arch. Comput. Methods Eng. 2010, 17, 299–325. [Google Scholar] [CrossRef]
- Aguilar, R.; Noel, M.F.; Ramos, L.F. Integration of reverse engineering and non-linear numerical analysis for the seismic assessment of historical adobe buildings. Autom. Constr. 2019, 98, 1–15. [Google Scholar] [CrossRef]
- Sánchez-Aparicio, L.J.; Bautista-De Castro, Á.; Conde, B.; Carrasco, P.; Ramos, L.F. Non-destructive means and methods for structural diagnosis of masonry arch bridges. Autom. Constr. 2019, 104, 360–382. [Google Scholar] [CrossRef]
- Masciotta, M.G.; Pellegrini, D.; Brigante, D.; Barontini, A.; Lourenço, P.B.; Girandi, M.; Padovani, C.; Fabbrocino, G. Dynamic characterization of progressively damaged segmental masonry arches with one settled support: Experimental and numerical analyses. Frat. Integrità Strutt. 2019, 14, 423–441. [Google Scholar] [CrossRef]
- Lagomarsino, S. Damage assessment of churches after L’Aquila earthquake (2009). Bull. Earthq. Eng. 2012, 10, 73–92. [Google Scholar] [CrossRef]
- Fuentes, D.D.; Baquedano Julià, P.A.; D’Amato, M.; Laterza, M. Preliminary seismic damage assessment of mexican churches after september 2017 earthquakes. Int. J. Archit. Herit. 2019. [Google Scholar] [CrossRef]
- Clementi, F. Failure analysis of apennine masonry churches severely damaged during the 2016 central Italy seismic sequence. Buildings 2021, 11, 58. [Google Scholar] [CrossRef]
- Yurdakul, M.; Yılmaz, F.; Artar, M.; Can, Ö.; Öner, E.; Daloğlu, A.T. Investigation of time-history response of a historical masonry minaret under seismic loads. Structures 2021, 30, 265–276. [Google Scholar] [CrossRef]
- Kassotakis, N.; Sarhosis, V.; Riveiro, B.; Conde, B.; D’Altri, A.M.; Mills, J.; Milani, G.; de Miranda, S.; Castellazzi, G. Three-dimensional discrete element modelling of rubble masonry structures from dense point clouds. Autom. Constr. 2020, 119, 103365. [Google Scholar] [CrossRef]
- Pepe, M.; Costantino, D.; Restuccia Garofalo, A. An Efficient pipeline to obtain 3D model for HBIM and structural analysis purposes from 3D point clouds. Appl. Sci. 2020, 10, 1235. [Google Scholar] [CrossRef]
- Bassoli, E.; Vincenzi, L.; D’Altri, A.M.; de Miranda, S.; Forghieri, M.; Castellazzi, G. Ambient vibration-based finite element model updating of an earthquake-damaged masonry tower. Struct. Control Health Monit. 2018, 25, e2150. [Google Scholar] [CrossRef]
- Castellazzi, G.; D’Altri, A.M.; de Miranda, S.; Ubertini, F. An innovative numerical modeling strategy for the structural analysis of historical monumental buildings. Eng. Struct. 2017, 132, 229–248. [Google Scholar] [CrossRef]
- Gonizzi, S.; Politecnico, B.; Milano, D.; Guidi, G.; Di Milano, P.; Gonizzi Barsanti, S.; Guidi, G. A geometric processing workflow for transforming reality-based 3D models in volumetric meshes suitable for FEA. Int. Arch. Photogramm. Remote Sens. Spat. Inf. Sci. 2017, XLII-2/W3, 331–338. [Google Scholar] [CrossRef]
- Bautista-De Castro, Á.; Sánchez-Aparicio, L.J.; Ramos, L.F.; Sena-Cruz, J.; González-Aguilera, D. Integrating geomatic approaches, Operational Modal Analysis, advanced numerical and updating methods to evaluate the current safety conditions of the historical Bôco Bridge. Constr. Build. Mater. 2018, 158, 961–984. [Google Scholar] [CrossRef]
- Barazzetti, L.; Banfi, F.; Brumana, R.; Previtali, M. Creation of parametric BIM objects from point clouds using nurbs. Photogramm. Rec. 2015, 30, 339–362. [Google Scholar] [CrossRef]
- Nocerino, E.; Pablo, R.-G.; Menna, F. Introduction to Mobile Mapping with Portable Systems; CRC Press: Boca Raton, FL, USA, 2019; ISBN 9781351018869. [Google Scholar]
- Durrant-Whyte, H.; Bailey, T. Simultaneous localization and mapping: Part I. IEEE Robot. Autom. Mag. 2006, 13, 99–108. [Google Scholar] [CrossRef]
- Nocerino, E.; Menna, F.; Kessler, F.B.; Fondazione, F.R.; Kessler, B.; Remondino, F.; Toschi, I.; Rodríguez-Gonzálvez, P. Investigation of indoor and outdoor performance of two portable mobile mapping systems. SPIE Opt. Metrol. 2017. [Google Scholar] [CrossRef]
- di Filippo, A.; Sánchez-Aparicio, L.J.; Barba, S.; Martín-Jiménez, J.A.; Mora, R.; Aguilera, D.G. Use of a wearable mobile laser system in seamless indoor 3D mapping of a complex historical site. Remote Sens. 2018, 10, 1897. [Google Scholar] [CrossRef]
- Barba, S.; di Filippo, A.; Limongiello, M.; Messina, B. Integration of active sensors for geometric analysis of the Chapel of the Holy Shroud. In Proceedings of the 27th CIPA International Symposium “Documenting the Past for a Better Future”, Ávila, Spain, 1–5 September 2019; Volume XLII-2/W15, pp. 149–156. [Google Scholar]
- Sánchez-Aparicio, L.; Conde, B.; Maté-González, M.A.; Mora, R.; Sánchez-Aparicio, M.; García-Álvarez, J.; González-Aguilera, D. A comparative study between WMMS and TLS for the stability analysis of the San Pedro Church Barrel vault by means of the finite element method. In Proceedings of the 27th CIPA International Symposium “Documenting the Past for a Better Future”, Ávila, Spain, 1–5 September 2019; Volume XLII-2/W15; pp. 1047–1054. [Google Scholar]
- Nocerino, E.; Menna, F.; Toschi, I.; Morabito, D.; Remondino, F.; Rodríguez-Gonzálvez, P. Valorisation of history and landscape for promoting the memory of WWI. J. Cult. Herit. 2018, 29, 113–122. [Google Scholar] [CrossRef]
- Maté-González, M.Á.; Sánchez-Aparicio, L.J.; Sáez Blázquez, C.; Carrasco García, P.; Álvarez-Alonso, D.; de Andrés-Herrero, M.; García-Davalillo, J.C.; González-Aguilera, D.; Hernández Ruiz, M.; Jordá Bordehore, L.; et al. On the combination of remote sensing and geophysical methods for the digitalization of the san lázaro middle paleolithic rock shelter (Segovia, Central Iberia, Spain). Remote Sens. 2019, 11, 2035. [Google Scholar] [CrossRef]
- Roca, P.; Lourenço, P.B.; Gaetani, A. Historic Construction and Conservation. Materials, Systems and Damage; Routledge: London, UK, 2019; ISBN 978-0-429-05276-7. [Google Scholar]
- Kouris, L.A.S.; Triantafillou, T.C. State-of-the-art on strengthening of masonry structures with textile reinforced mortar (TRM). Constr. Build. Mater. 2018, 188, 1221–1233. [Google Scholar] [CrossRef]
- Oliveira, D.V.; Ghiassi, B.; Allahvirdizadeh, R.; Wang, X.; Mininno, G.; Silva, R.A. Macromodeling approach for pushover analysis of textile-reinforced mortar-strengthened masonry. In Numerical Modeling of Masonry and Historical Structures: From Theory to Application; Elsevier: Amsterdam, The Netherlands, 2019; pp. 745–778. ISBN 9780081024393. [Google Scholar]
- Gunes, B.; Cosgun, T.; Sayin, B.; Ceylan, O. Structural rehabilitation of a Middle Byzantine ruin and the masonry building constructed above the ruin. Part I: The ruin. Eng. Fail. Anal. 2019, 105, 503–517. [Google Scholar] [CrossRef]
- Bru, D.; Ivorra, S.; Baeza, F.J. Seismic behavior of a masonry chimney retrofitted with composite materials: A preliminary aproach. Int. J. Saf. Secur. Eng. 2017, 7, 486–497. [Google Scholar] [CrossRef]
- Europan Committee for Standardization. Eurocode 2: Design of Concrete Strucures; European Committee for Standardization: Brussels, Belgium, 1992. [Google Scholar]
- GeoSLAM A Survey REVOlution. Introducing the ZEB-REVO Mobile Indoor Mapping System. Available online: https://gpserv.com/wp-content/uploads/2017/01/ZEB-REVO-Brochure-v1.0.3.pdf (accessed on 15 December 2020).
- GeoSLAM ZEB Go—GeoSLAM. Available online: https://geoslam.com/solutions/zeb-go/ (accessed on 1 September 2020).
- Quigley, M.; Gerkey, B.; Conley, K.; Faust, J.; Foote, T.; Leibs, J.; Berger, E.; Wheeler, R.; Ng, A. ROS: An open-source robot operating system. ICRA Work. Open Source Softw. 2009, 3, 5. [Google Scholar]
- Balta, H.; Velagic, J.; Bosschaerts, W.; De Cubber, G.; Siciliano, B. Fast statistical outlier removal based method for large 3D Point clouds of outdoor environments. IFAC-PapersOnLine 2018, 51, 348–353. [Google Scholar] [CrossRef]
- Guerrero, P.; Kleiman, Y.; Ovsjanikov, M.; Mitra, N.J. PCPNet learning local shape properties from raw point clouds. Comput. Graph. Forum 2018, 37, 75–85. [Google Scholar] [CrossRef]
- Rakotosaona, M.; La Barbera, V.; Guerrero, P.; Mitra, N.J.; Ovsjanikov, M. PointCleanNet: Learning to denoise and remove outliers from dense point clouds. Comput. Graph. Forum 2020, 39, 185–203. [Google Scholar] [CrossRef]
- Qi, C.R.; Su, H.; Mo, K.; Guibas, L.J. PointNet: Deep learning on point sets for 3D classification and segmentation. In Proceedings of the IEEE Conference on Computer Vision and Pattern Recognition (CVPR), Honolulu, HI, USA, 21–26 July 2017; pp. 652–660. [Google Scholar]
- Xu, Z.; Foi, A. Anisotropic denoising of 3D point clouds by aggregation of multiple surface-adaptive estimates. IEEE Trans. Vis. Comput. Graph. 2019. [Google Scholar] [CrossRef] [PubMed]
- CloudCompare: 3D point cloud and mesh processing software Open Source Project. Available online: http://www.cloudcompare.org/ (accessed on 15 December 2020).
- Rodríguez-Gonzálvez, P.; Jiménez Fernández-Palacios, B.; Muñoz-Nieto, Á.; Arias-Sanchez, P.; Gonzalez-Aguilera, D. Mobile LiDAR system: New possibilities for the documentation and dissemination of large cultural heritage sites. Remote Sens. 2017, 9, 189. [Google Scholar] [CrossRef]
- Sánchez-Aparicio, L.J.; Del Pozo, S.; Ramos, L.F.; Arce, A.; Fernandes, F.M. Heritage site preservation with combined radiometric and geometric analysis of TLS data. Autom. Constr. 2018, 85, 24–39. [Google Scholar] [CrossRef]
- Schnabel, R.; Wahl, R.; Klein, R. Efficient RANSAC for point-cloud shape detection. Comput. Graph. Forum 2007, 26, 214–226. [Google Scholar] [CrossRef]
- TNO DIANA BV DIANA—Finite Element Analysis. User’s Manual. Available online: https://dianafea.com/diana-manuals (accessed on 10 November 2020).
- Lourenço, P.B.; Greco, F.; Barontini, A.; Pia Ciocci, M.; Karanikoloudis, G. Seismic Retrofitting Project: Modeling of Prototype Buildings; The Getty Conservation Institute: Los Angeles, CA, USA, 2019. [Google Scholar]
- Ciocci, M.P.; Sharma, S.; Lourenço, P.B. Engineering simulations of a super-complex cultural heritage building: Ica Cathedral in Peru. Meccanica 2018, 53, 1931–1958. [Google Scholar] [CrossRef]
- Illampas, R.; Ioannou, I.; Lourenço, P.B. Seismic appraisal of heritage ruins: The case study of the St. mary of carmel church in cyprus. Eng. Struct. 2020, 224, 111209. [Google Scholar] [CrossRef]
- Norme Tecniche per le Costruzioni (NTC-08). Available online: http://www.ingegneriasoft.com/pdf/Norme_Tecniche_Costruzioni_2008_cap1-12.pdf (accessed on 10 November 2020).
- Lourenço, P.B. Structural Masonry Analysis: Recent Developments and Prospects. In Proceedings of the 14th International Brick and Block Masonry Conference, Sydney, Australia, 17–20 February 2008. [Google Scholar]
- Kariou, F.A.; Triantafyllou, S.P.; Bournas, D.A.; Koutas, L.N. Out-of-plane behaviour of TRM strengthened masonry walls. In Proceedings of the SMAR 2017-Fourth Conference on Smart Monitoring Assessment and Rehabilitation of Civil Structures, Zurich, Switzerland, 13–15 September 2017. [Google Scholar]
- O’Hearne, N.; Mendes, N.; Lourenço, P.B. Seismic analysis of the San Sebastian Basilica (Philippines). In Proceedings of the 40th IABSE Symposium: Tomorrow’s Megastructures, Nantes, France, 19–21 September 2018. [Google Scholar]
- Seismic Standards Standing Committee Seismic construction standard: General and building (NCSE-02). Available online: https://www.mitma.gob.es/recursos_mfom/0820200.pdf (accessed on 10 November 2020).


Publisher’s Note: MDPI stays neutral with regard to jurisdictional claims in published maps and institutional affiliations. |
© 2021 by the authors. Licensee MDPI, Basel, Switzerland. This article is an open access article distributed under the terms and conditions of the Creative Commons Attribution (CC BY) license (http://creativecommons.org/licenses/by/4.0/).