Abstract
The Yellow River Delta in China is the most active one for sea–land changes over all deltas worldwide, and its coastline evolution is critical to urban planning and environmental sustainability in coastal areas. Existing studies rarely used yearly temporal resolution, and lack more detailed and quantitative analysis of coastline evolution characteristics. This paper used visual interpretation to extract the coastline of the Yellow River Delta in year interval Landsat images for 45 years from 1976 to 2020, and analyzed the spatiotemporal characteristics of the coastline evolution through statistical methods such as calculating change values and change rate. The main results are as follows: (1) overall, the coastline of the Yellow River Delta presented a spatial pattern involving northern landward retreat and southern seaward expansion. Since 1990, the Yellow River Delta has entered a period of decline. In addition, the length of the artificial coastline increased by about 55 km; (2) in the Qingshuigou region, the land area and the coastline length increased first and then stabilized. The southeastern part of the Qingshuigou was in a state of erosion, while the northeastern part was expanding toward the sea along the north direction; (3) in the Diaokou region, the land area has been decreasing, but the reduction rate has gradually slowed down. The main conclusions are as follows: (1) through the research on the evolution model and mechanism of the coastline of the Yellow River Delta, it was found that human factors and natural factors were the two major driving factors that affect the evolution of the coastline; (2) a river branch appeared in the northern part of the Qingshuigou region in 2014 and became a major branch in 2020, which would affect the development of the coastal region of Chengdao. This study is important for better understanding the evolution pattern of the Yellow River Delta coastline and will help to provide guidance for coastline management and resource exploitation.
1. Introduction
As an important geographic feature marking land–sea boundaries, coastlines possess unique geographic, morphological and dynamic characteristics [1,2,3]. Coastal zones are the most active and concentrated areas of human activities [4,5,6,7], and under the influence of the economic development, the Chinese coastline has changed significantly [8,9,10,11,12]. As a world-famous, terrestrial sediment-dominated, weak tidal delta, the Yellow River Delta is the most rapidly growing delta in the world [13]. In the past 50 years, the coastline of the Yellow River Delta has changed extremely frequently, which directly affected the amount of beach resources available in the intertidal zones, the environment of the coastal zones, the survival and development of people in these regions [14,15,16]. Hence, accurately identifying the evolution patterns and driving factors of the Yellow River Delta coastline is critical for urban planning and sustainable environmental development of coastal regions [17,18,19].
Most existing studies on the coastline of the Yellow River Delta have focused on analyzing the influences of the landscape and morphological evolution on coastline changes [20,21] and the temporal and spatial characteristics of the coastline based on remote sensing imagery [22,23,24,25,26,27,28,29,30,31,32,33]. This paper belongs to the latter. By using remote-sensed imagery data, many research studies have been carried out on the coastline and area changes of the Yellow River Delta. They found that the coastline of the Yellow River Delta generally exhibited a gradual erosional trend, and the area presented an increased state [27,28,29]. In addition, there have been significant variations in the shape and length of the coastline from the 1970s [27], impacted by human activities, climate change and sea level rise [33]. The significant variations showed a deposition and erosion alternate phenomena. However, due to the data used with different intervals, many studies have different findings. For instance, by using six years of data from 1989 to 2009, Li et al. [26] showed that the overall area of the delta experienced two stages: growth stage during 1989–2006 and retreat stage during 2006–2009. By using three-year intervals data during 1986–2015, Niu et al. [27] identified three stages: a continuous erosion stage, an overall stabilization of the area after deposition stage and an erosion stage, while Kong et al. [29] indicated three stages: growth stage from 1983 to 2000, retreat stage from 2000 to 2003 and recovery stage from 2003 to 2011.
In addition, on the basis of studying the overall change of the Yellow River Delta, the change of some special region (such as Diaokou region and Qingshuigou region) in the Yellow River Delta attracted attention gradually [30,31,32]. Previous studies all found that the northern area in the Diaokou region mainly experienced landward erosion, whereas rapid seaward migration of river channels was noted in the Qingshuigou region [31,32]. Zhu et al. [33] selected 10 key years’ data from 1980 to 2020, and found that there are two significant accretion areas in the Qing 8 and Qingshuigou course.
However, there are still shortcomings in the study on the spatiotemporal evolution of the Yellow River Delta coastline: (1) most studies primarily focused on coastline changes in intervals of several years [26,27,33], and the recent research periods were not of yearly temporal resolution, resulting in deficiencies to capture the yearly coastline evolution patterns; (2) most researchers have emphasized the overall variations in the coastline, although some scholars have conducted studies on the Diaokou and Qingshuigou regions, they simply analyzed the changes in shape and failed to provide more detailed and quantitative analyses on their characteristics; (3) except for Zhu et al. [33], long-term studies involving the latest year are few.
Therefore, this paper investigated the long-term spatial and temporal evolution of the coastline by using yearly remote sensing imagery of the Yellow River Delta from 1976 to 2020. More detailed and quantitative analyses of the ever-changing estuary region were conducted through statistical methods such as calculating change values and change rate, and the associated mechanisms were explored and discussed. The findings can enhance the better understanding of the spatiotemporal variations of the Yellow River Delta coastline, provide data validation and technical support for future research on the coastline, and offer recommendations and guidance for coastline management and regional development of the Yellow River Delta.
2. Study Area and Data Sources
2.1. Study Area
The Yellow River Delta (117°30′–119°20′E, 36°53′–38°20′N) is located in the northern part of Shandong Province, China, and lies between Bohai Bay and the mouth of Laizhou Bay [34,35]. It is the second largest river delta in China [36] and the most rapidly evolving delta in the world [37]. The Yellow River Delta is a typical fan-shaped delta composed of a large amount of silt delivered by the Yellow River. Its elevation gradually decreases from southwest to northeast over a range of 1–13 m. Under the dual actions of both the river and the sea, the evolution speed and direction of the Yellow River Delta coastline are considerably different from those of other coastlines. According to different periods of time, the Yellow River Delta can be divided into the ancient Yellow River Delta, the recent Yellow River Delta and the modern Yellow River Delta [38]. This paper studies the modern delta (Figure 1). Its geographic range takes Yuwa, Kenli District as the apex, starting from the mouth of the Tiaohe River in the west, reaching the Songchunronggou River in the south, and is bounded by the coastline in the east [39]. The modern Yellow River Delta has two estuaries: one is the early estuary (January 1964–May 1976) located in the Diaokou region (Diaokou River), and the other is the current estuary (1976–now) located in the Qingshuigou region. Because of the frequent and significant coastline variations of the Qingshuigou and Diaokou estuary regions, this paper conducted a detailed quantitative analysis on the two regions. Moreover, the Diaokou region starts from the mouth of the Tiaohe River in the west, reaching the Gangdong First Road in the east, and is bounded by the coastline in the north. The Qingshuigou region starts from the mouth of the Songchunronggou River in the south, adjacent to Xuwangwuzi in the north, and is bounded by the coastline in the east. The Qingshuigou Region includes two subregions, the southeast region and the northeast region. The southeast region starts from location A (119°06’, 37°44’), extends east and south to the coastline, respectively, and is bounded by the coastline. The northeast region starts from location B (119°10′, 37°44′), extends east and north to the coastline, respectively, and is bounded by the coastline.
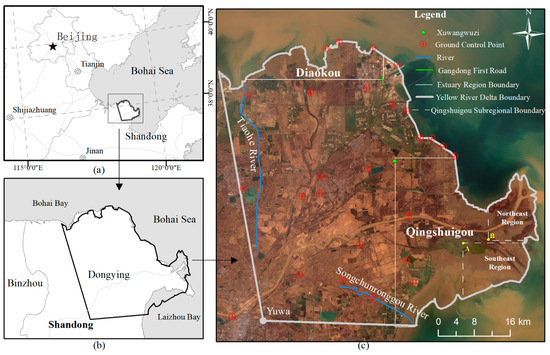
Figure 1.
The modern Yellow River Delta. (a) Location of the study area in China; (b) location of the study area in Dongying; (c) image of the Yellow River Delta in 2019.
2.2. Extraction of Coastlines
As an important way to obtain geographic information, remote sensing technology has the advantages of relatively low data acquisition cost for image users, wide coverage and high spatial resolution. Thus, it has been widely used in coastline extraction [40,41]. Considering the image quality and acquisition time, a total of 45 satellite images (Table 1), including Landsat MSS, Landsat TM, Landsat ETM+ and Landsat OLI, were obtained around the Yellow River Delta from 1976 to 2020 through the official website of the United States Geological Survey (https://earthexplorer.usgs.gov/ (accessed on 24 November 2021)). All images have been geometrically corrected. For the geometric correction processing of each image, 22 ground control points were selected by following the principles of prior contour points, uniform distribution, no change with time and easy identification. A first-order polynomial transform algorithm was used to ensure that each permanent feature was at exactly the same location in all the images [42,43]. The images were resampled to a 30 m pixel size using the nearest neighbor resampling method. In addition, to make the image clearer, this paper used linear stretching and sharpening methods to enhance the image. All involved image processing operations were conducted by ENVI 5.3 software, and the projected coordinate system used was WGS_84_UTM_zone_50N.

Table 1.
Satellite imagery data used in this study during 1976–2020.
As the locations of land–sea boundaries are relatively significantly influenced by factors such as tides and topography, a consistent standard for coastline definition is necessary for coastline extraction at different times. The general high tide line refers to the boundary submerged by the sea when the ocean has a non-extraordinary high tide. It is located between the high and middle tidal flat. Due to the different composition of tidal flats and the time of exposure to water, the high and middle tidal flat have different spectral characteristics in remote-sensed images [27]. Thus, the general high tide line can be easily identified. Because of its simplicity, ease and relative accuracy, the general high tide line has been used in many studies [27,31]. Hence, the general high tide line method is used to represent the coastline in this paper.
For coastline extraction, so far nothing can yield better results than a thorough human interpretation and manual digitization [33], and many studies [13,27,31,42] have also used this method. Thus, the Landsat images were visually interpreted to extract coastline of the Yellow River Delta from 1976 to 2020. The coastline of the Yellow River Delta is mainly divided into two types: artificial coastline and natural coastline. Artificial coastline refers to the coastline composed of coastal structures such as seawall, wharf, asphalt road, dock, revetment (concrete or riprap structure, etc.). In order to avoid the impact of bad weather from the ocean, wave dikes have been built on the offshore side of shrimp ponds and salt fields, which are also regarded as artificial coastlines. The geometry of the artificial coastline is relatively regular, so they can be easily obtained by visual interpretation. It should be noted that if the artificial structure is restored on the sea side, it would be identified as natural coastline. Natural coastline is the coastline formed by the interaction of sea and land. In order to avoid the interpretation difference caused by human subjectivity, all coastlines were extracted by the same person. The visual interpretation scale was 1:3000. Meanwhile, high-resolution images such as QuickBird (with the resolution of 4m in 1998, with the resolution of 2.8m in 2004) and SPOT-5 (with the resolution of 10m in 2010, and 2015) from Google Earth were used as references for visual interpretation to validate the interpretation results.
2.3. Assessment Method
The annual Yellow River Delta region surface was built using the annual coastline with ArcGIS 10.3 software (Environmental Systems Research Institute, Inc., Redlands, CA, USA). According to the Yellow River Delta region surface, the area of Yellow River Delta could be obtained directly through the area calculation function of ArcGIS. The remaining research regions were obtained by cutting the regional surface of the Yellow River Delta through the clip function of ArcGIS. The rectangular box was used during cutting. The inland boundary of the rectangular box was consistent with the corresponding region in Figure 1. While formulating the maritime boundary, the rectangular box shall extend to the sea as far as possible to ensure that the land extension to the sea in all years is included. After the surfaces of the four regions were obtained, the area could also be obtained directly through the area calculation function of ArcGIS.
In order to assess the spatiotemporal evolution of the Yellow River Delta coastline quantitatively, some statistical methods were employed in this study.
The change value refers to the difference between the ending and starting values for the period being analyzed. The variable in this study means the coastline length, the land area or the distance of coastline advancement. The change value can be calculated with Equation (1).
where Dij denotes the change value, Vi and Vj denote the values of the ith year and the jth year, respectively.
Dij = Vi − Vj
The change rate refers to the average change of a specific variable within a specific time period. The variable in this study means the coastline length, the land area or the distance of coastline advancement. The unit of time used in this work is year. The change rate can be calculated with Equation (2).
where ADij denotes the change rate, Dij denotes the change value between the ith year and the jth year. Dij is calculated with Equation (1).
ADij = Dij/(i − j)
The ratio of artificial coastline can be obtained by dividing the artificial coastline length by the total coastline length in the same year. It can be calculated with Equation (3).
where Ri denotes the ratio of artificial coastline in the year i, ALi denotes the artificial coastline length in the year i, and TLi denotes the total coastline length in the year i.
Ri = ALi/TLi
3. Results
3.1. Overall Spatiotemporal Evolution of the Yellow River Delta
3.1.1. Spatiotemporal Evolution of the Coastline
Figure 2 shows the spatial variations of the Yellow River Delta coastline during 1976–2020. The coastline evolution in the Diaokou region was remarkably different from that in Qingshuigou region. Specifically, the coastline of the Diaokou region has been retreating to land since 1976. The shape of the coastline in the Diaokou region experienced three stages: curved out toward the sea, gradually flattened and curved inward. In contrast, the coastline in Qingshuigou region has curved out toward the sea. The direction of the Qingshuigou region extending seaward was different during different periods. Before 1996, the southeast region of Qingshuigou extended into the sea. After 1996, the coastline in the southeast region started to retreat and the protruding part gradually shifted northward, forming the northeast region. In the northeast region, the coastline extended to the sea in three main directions, in order of time: the northeast direction, the east direction, and the north direction. The spatial distribution and formation of these three directions were discussed in Section 3.2.3.
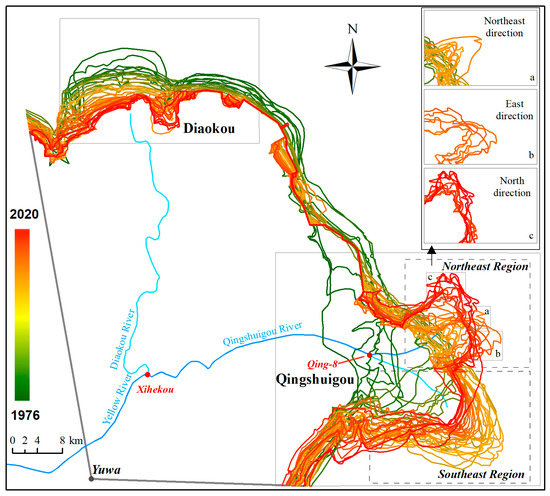
Figure 2.
Spatial distribution of the Yellow River Delta coastline.
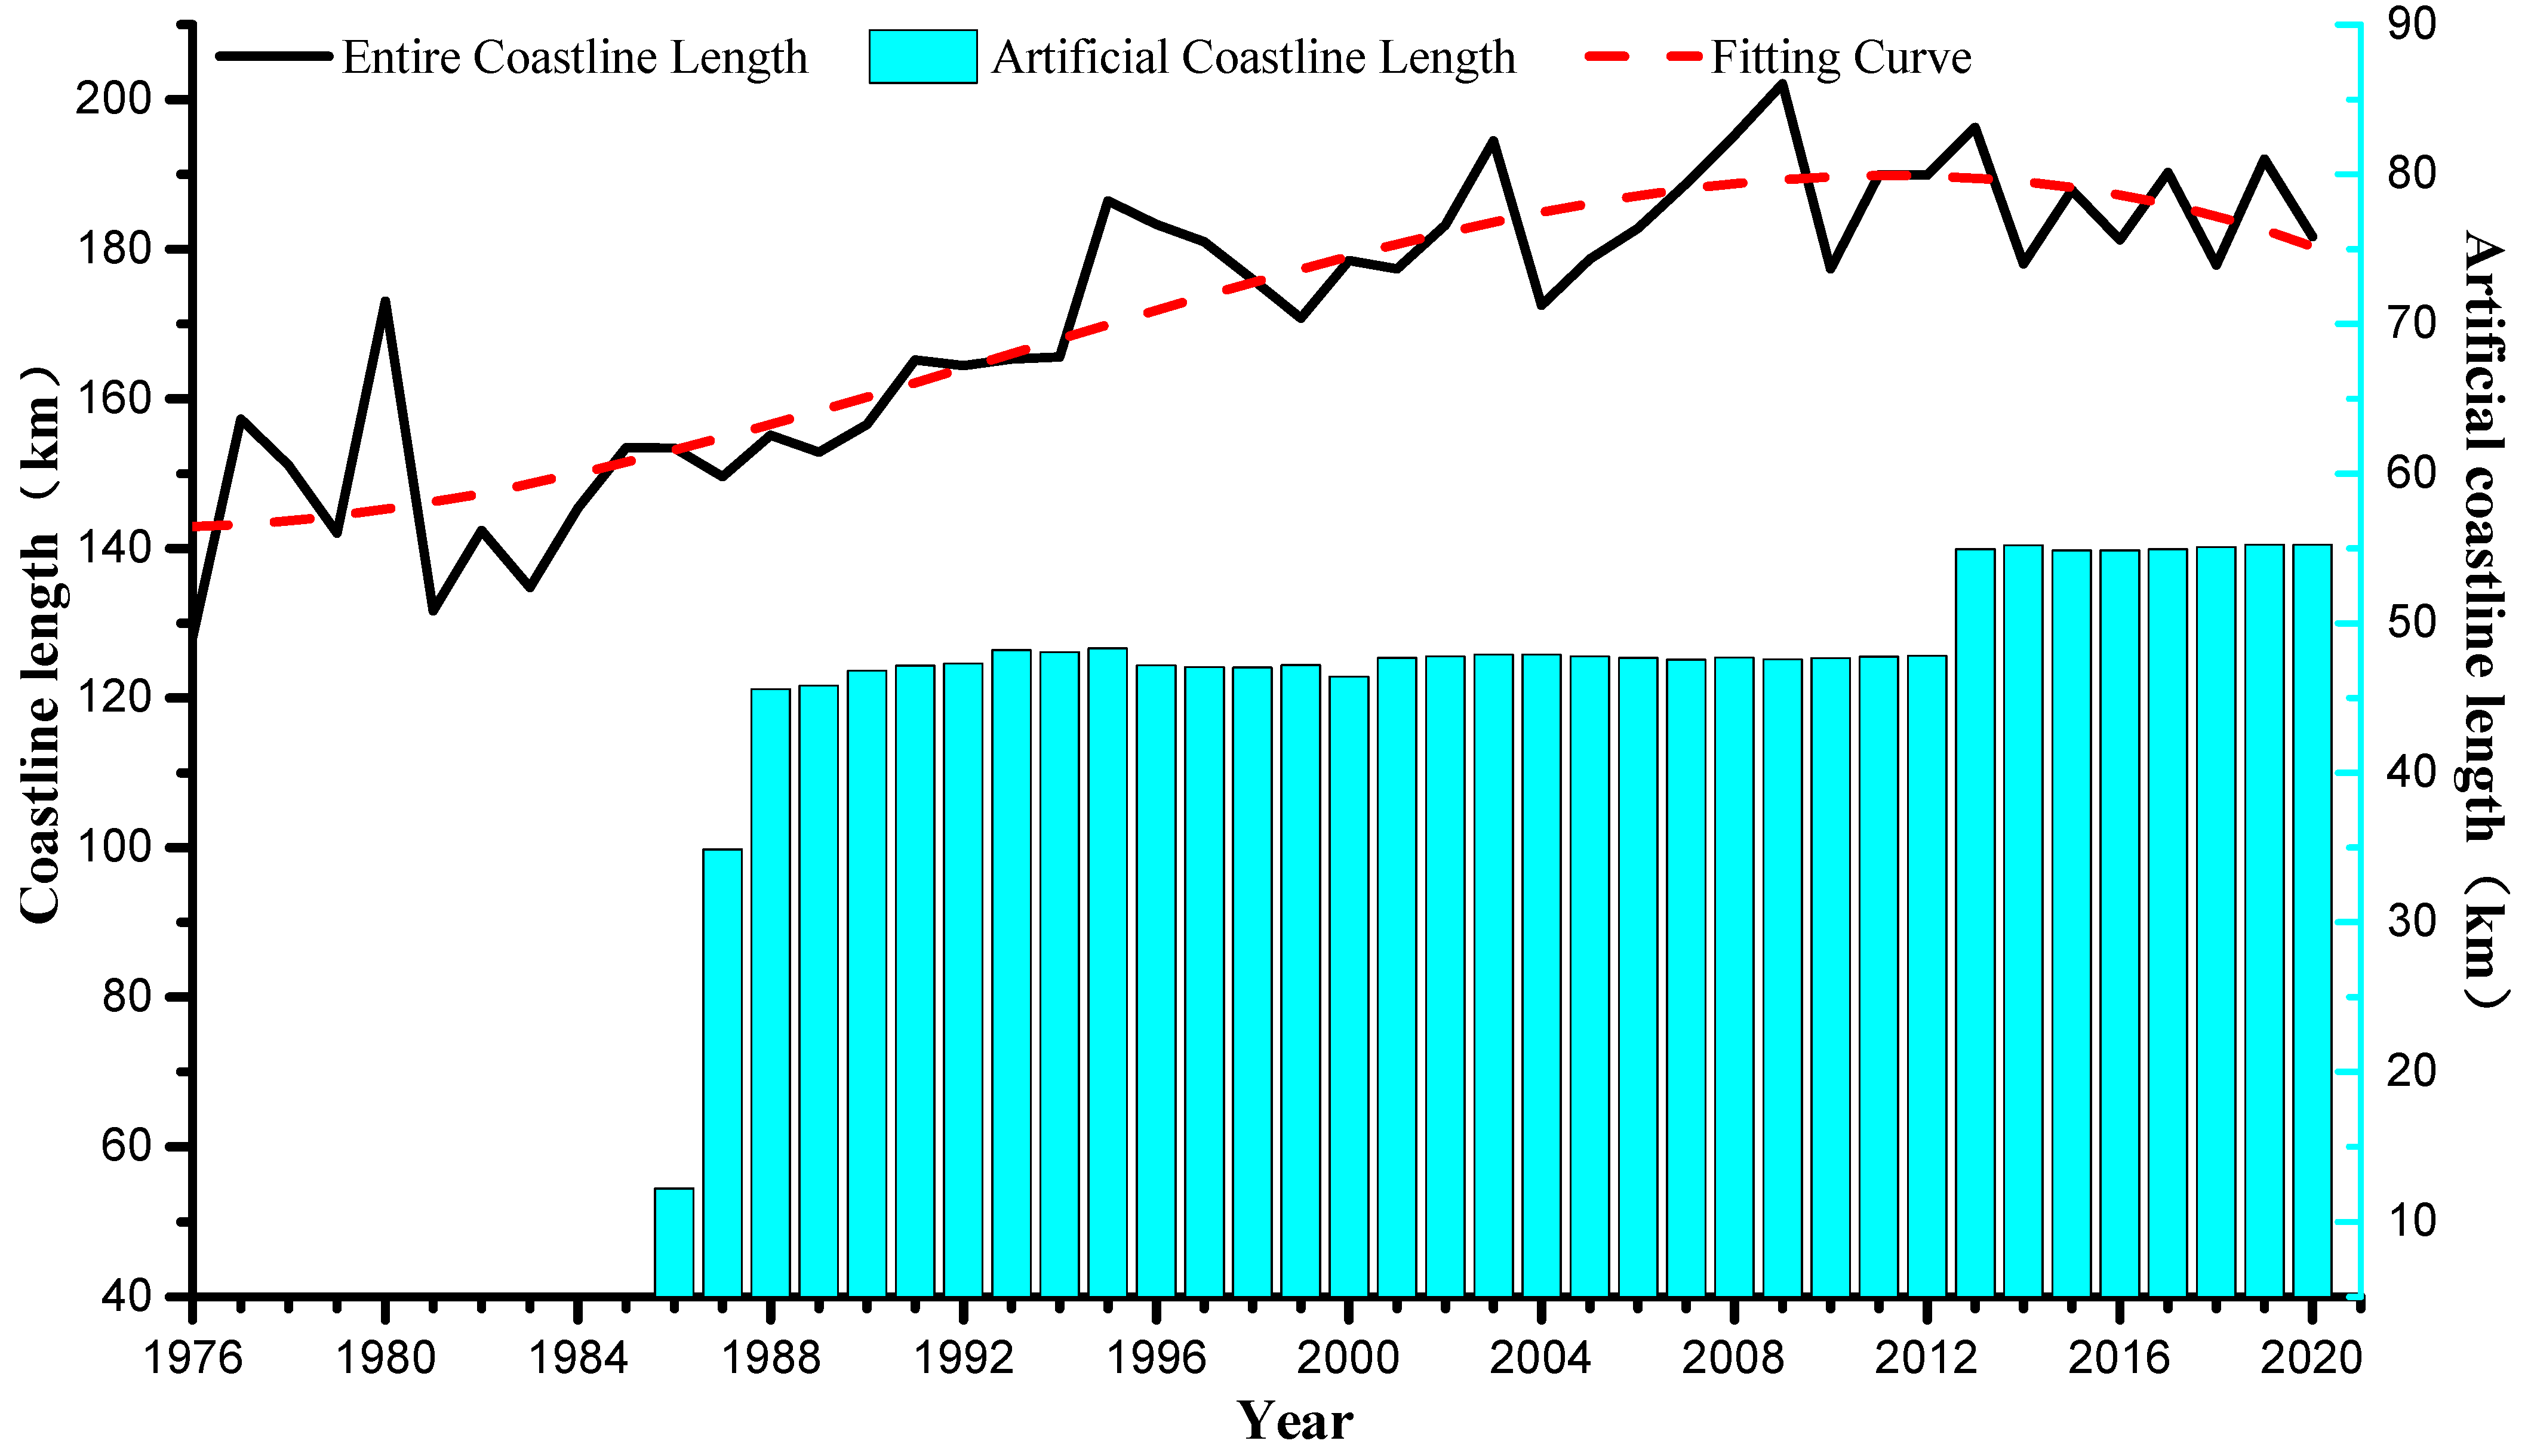
Figure 3 shows the coastline length variations of the Yellow River Delta during 1976–2020. The length of the coastline in 1976 was about 128.03 km, while that in 2020 was about 181.67 km. Over the past 45 years, the length of coastline fluctuated and increased by approximately 54 km. From 1976 to 1991, the growth rate of coastline length was the highest: about 2.48 km/year. From 1991 to 2009, the growth rate of coastline length was about 2.05 km/year, indicating that the growth rate has slowed down. After 2009, the coastline length tended to stable.
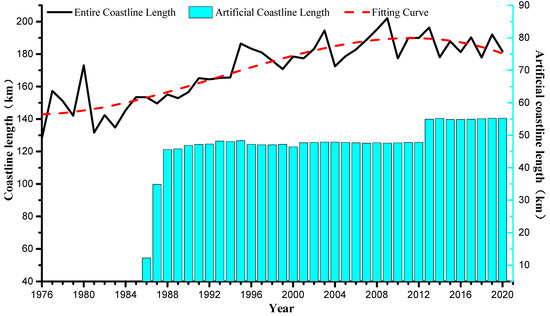
Figure 3.
Coastline length variations of the Yellow River Delta during 1976–2020.
As coastal zone development has become more intense, the impact of human activities on the natural coastline of the Yellow River Delta has gradually exceeded the impacts of natural forces. As shown in Figure 3, before 1986, there was almost no artificial coastline. In 2020, the artificial coastline length was 55.25 km, which accounted for up to one-third of the entire coastline. During 1976–2020, the artificial coastline length had two obvious growth periods. One is that from 1986 to 2020, the artificial coastline length increased by about 45.58 km. The other is that from 2012 to 2013, the artificial coastline length increased by about 7.14 km.
3.1.2. Evolution Characteristics of the Land Area
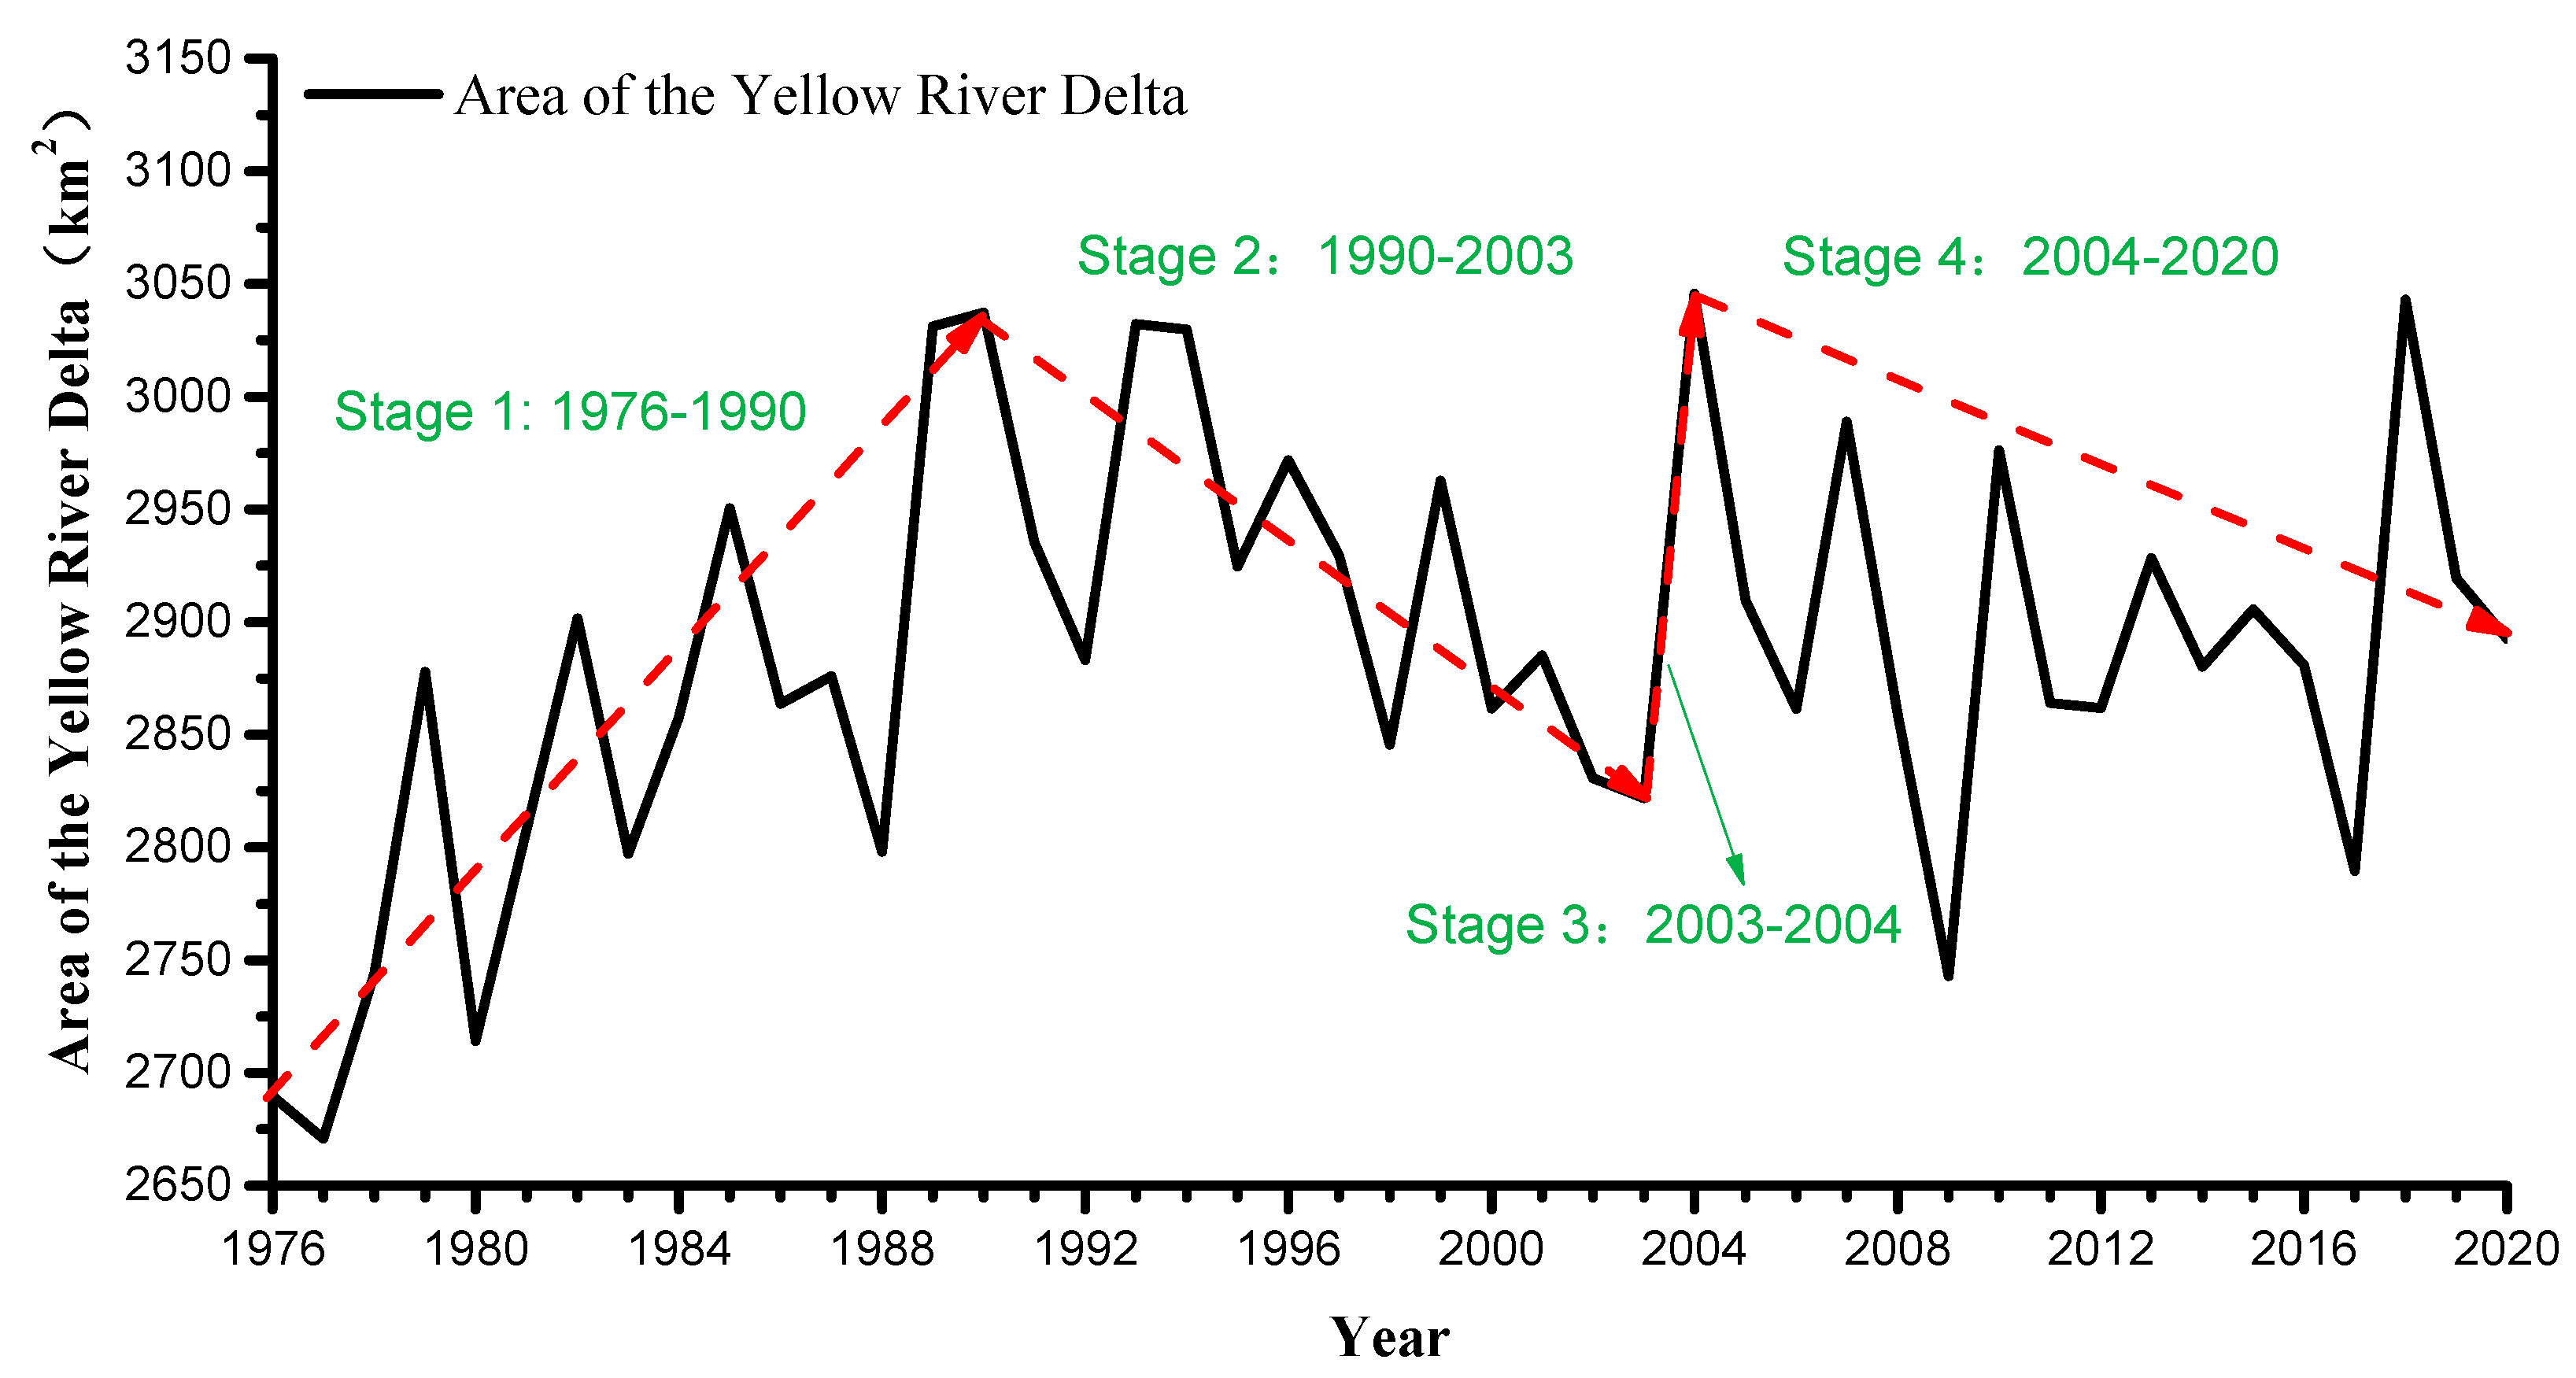
Figure 4 shows the areal variations in the Yellow River Delta from 1976 to 2020. The area in 1976 was about 2689.83 km2, while that in 2020 was about 2892.53 km2. Compared with 1976, the area of the Yellow River Delta in 2020 increased by approximately 203 km2, with an average growth rate of 4.6 km2/year. By 1990, the area of the Yellow River Delta reached its peak, about 3037.41 km2. After 1990, the area showed a fluctuating decline, with an average decline rate of 4.83 km2/year. The areal evolution of the Yellow River Delta can be subdivided into four stages: (1) from 1976 to 1990, the area showed a fluctuating growth, with an average growth rate of 24.8 km2/year; (2) the area gradually decreased during 1990–2003 at an average rate of 16.6 km2/year; (3) the area expanded briefly by about 224 km2 during 2003–2004; (4) the area decreased again during 2004–2020 with an average decline rate of 9.57 km2/year.
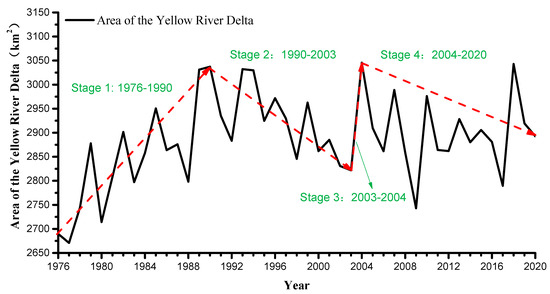
Figure 4.
Areal variations in the Yellow River Delta during 1976–2020.
3.2. Spatiotemporal Evolution of the Qingshuigou
As shown in Figure 2, over the past 45 years, the coastline in the Qingshuigou region has exhibited different spatial distributions, including expansion to the southeast and northeast. The following is a detailed analysis of the Qingshuigou region and its two subregions (Southeast Region and Northeast Region).
3.2.1. Overall Variation Characteristics of the Qingshuigou Region
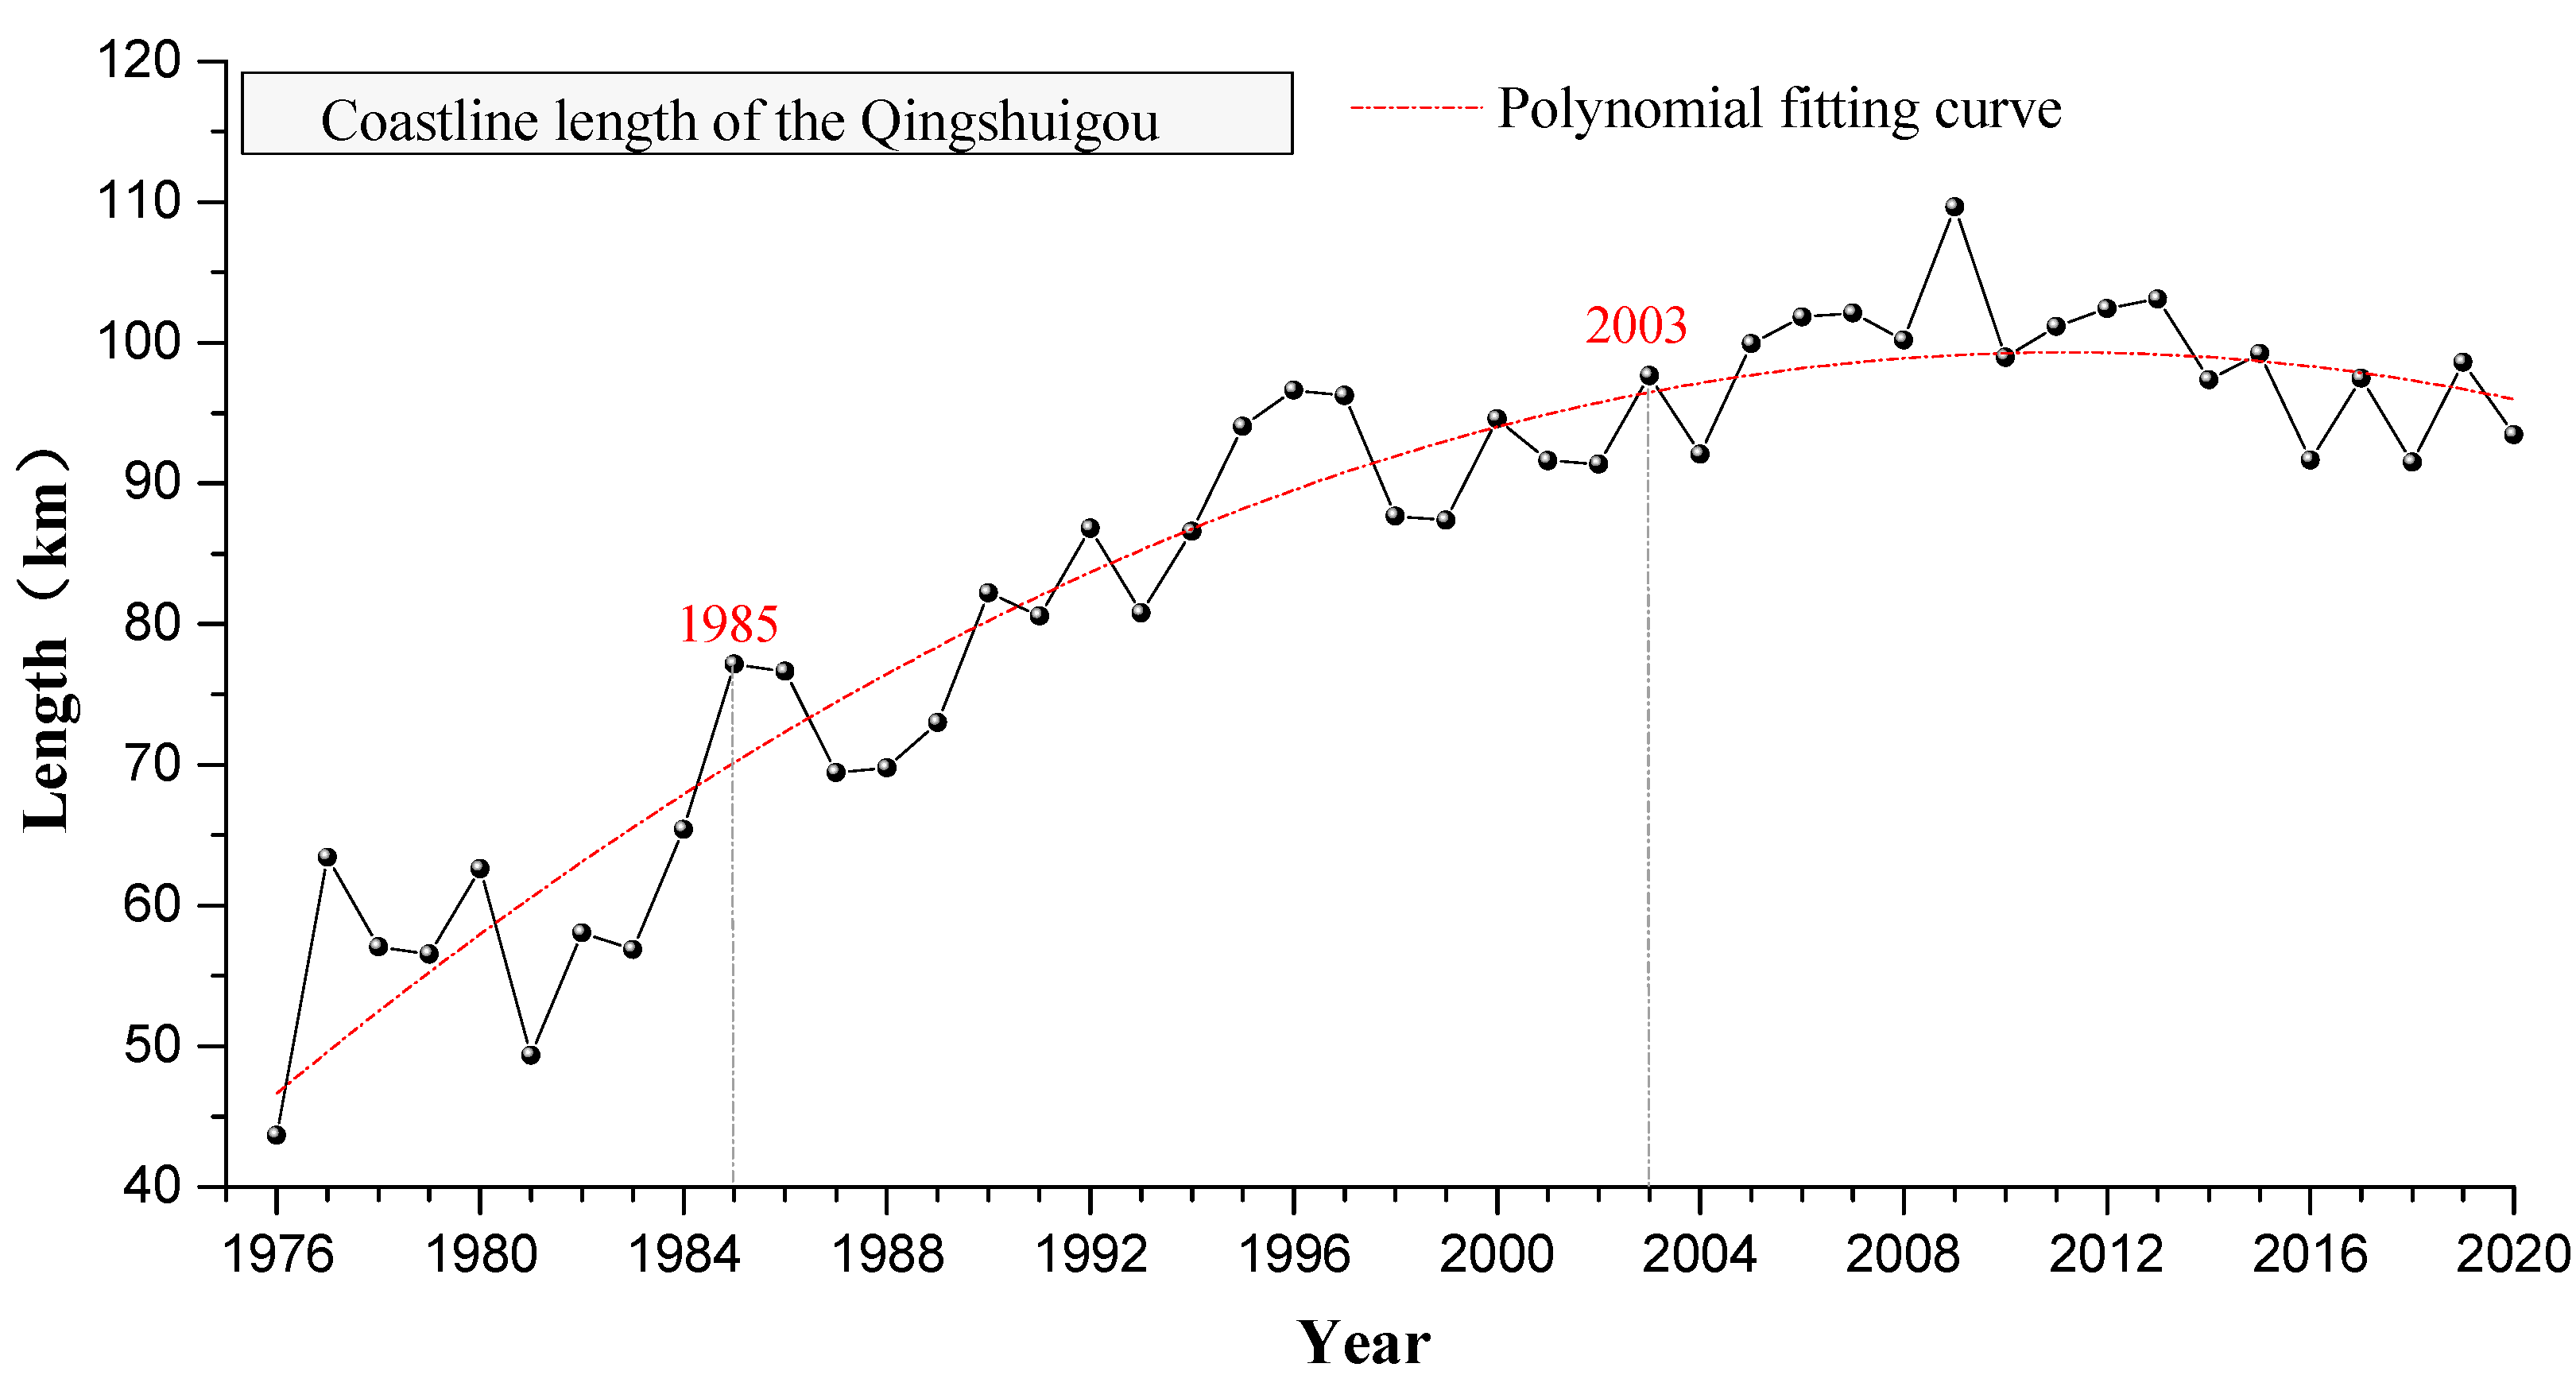
Figure 5 shows the coastline length variations in the Qingshuigou region from 1976 to 2020. The coastline length of the Qingshuigou region exhibited interannual fluctuations, and the overall trend first increased and then stabilized. During 1976–1985, the coastline length increased with a growth rate of 3.72 km/year. However, the growth rate slowed down during 1985–2003, to became about 1.14 km/year. The coastline length gradually stabilized during 2013–2020.
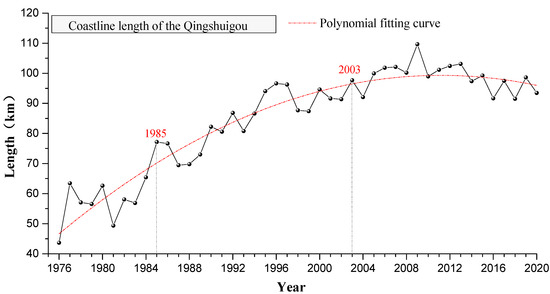
Figure 5.
Coastline length variations of the Qingshuigou region.
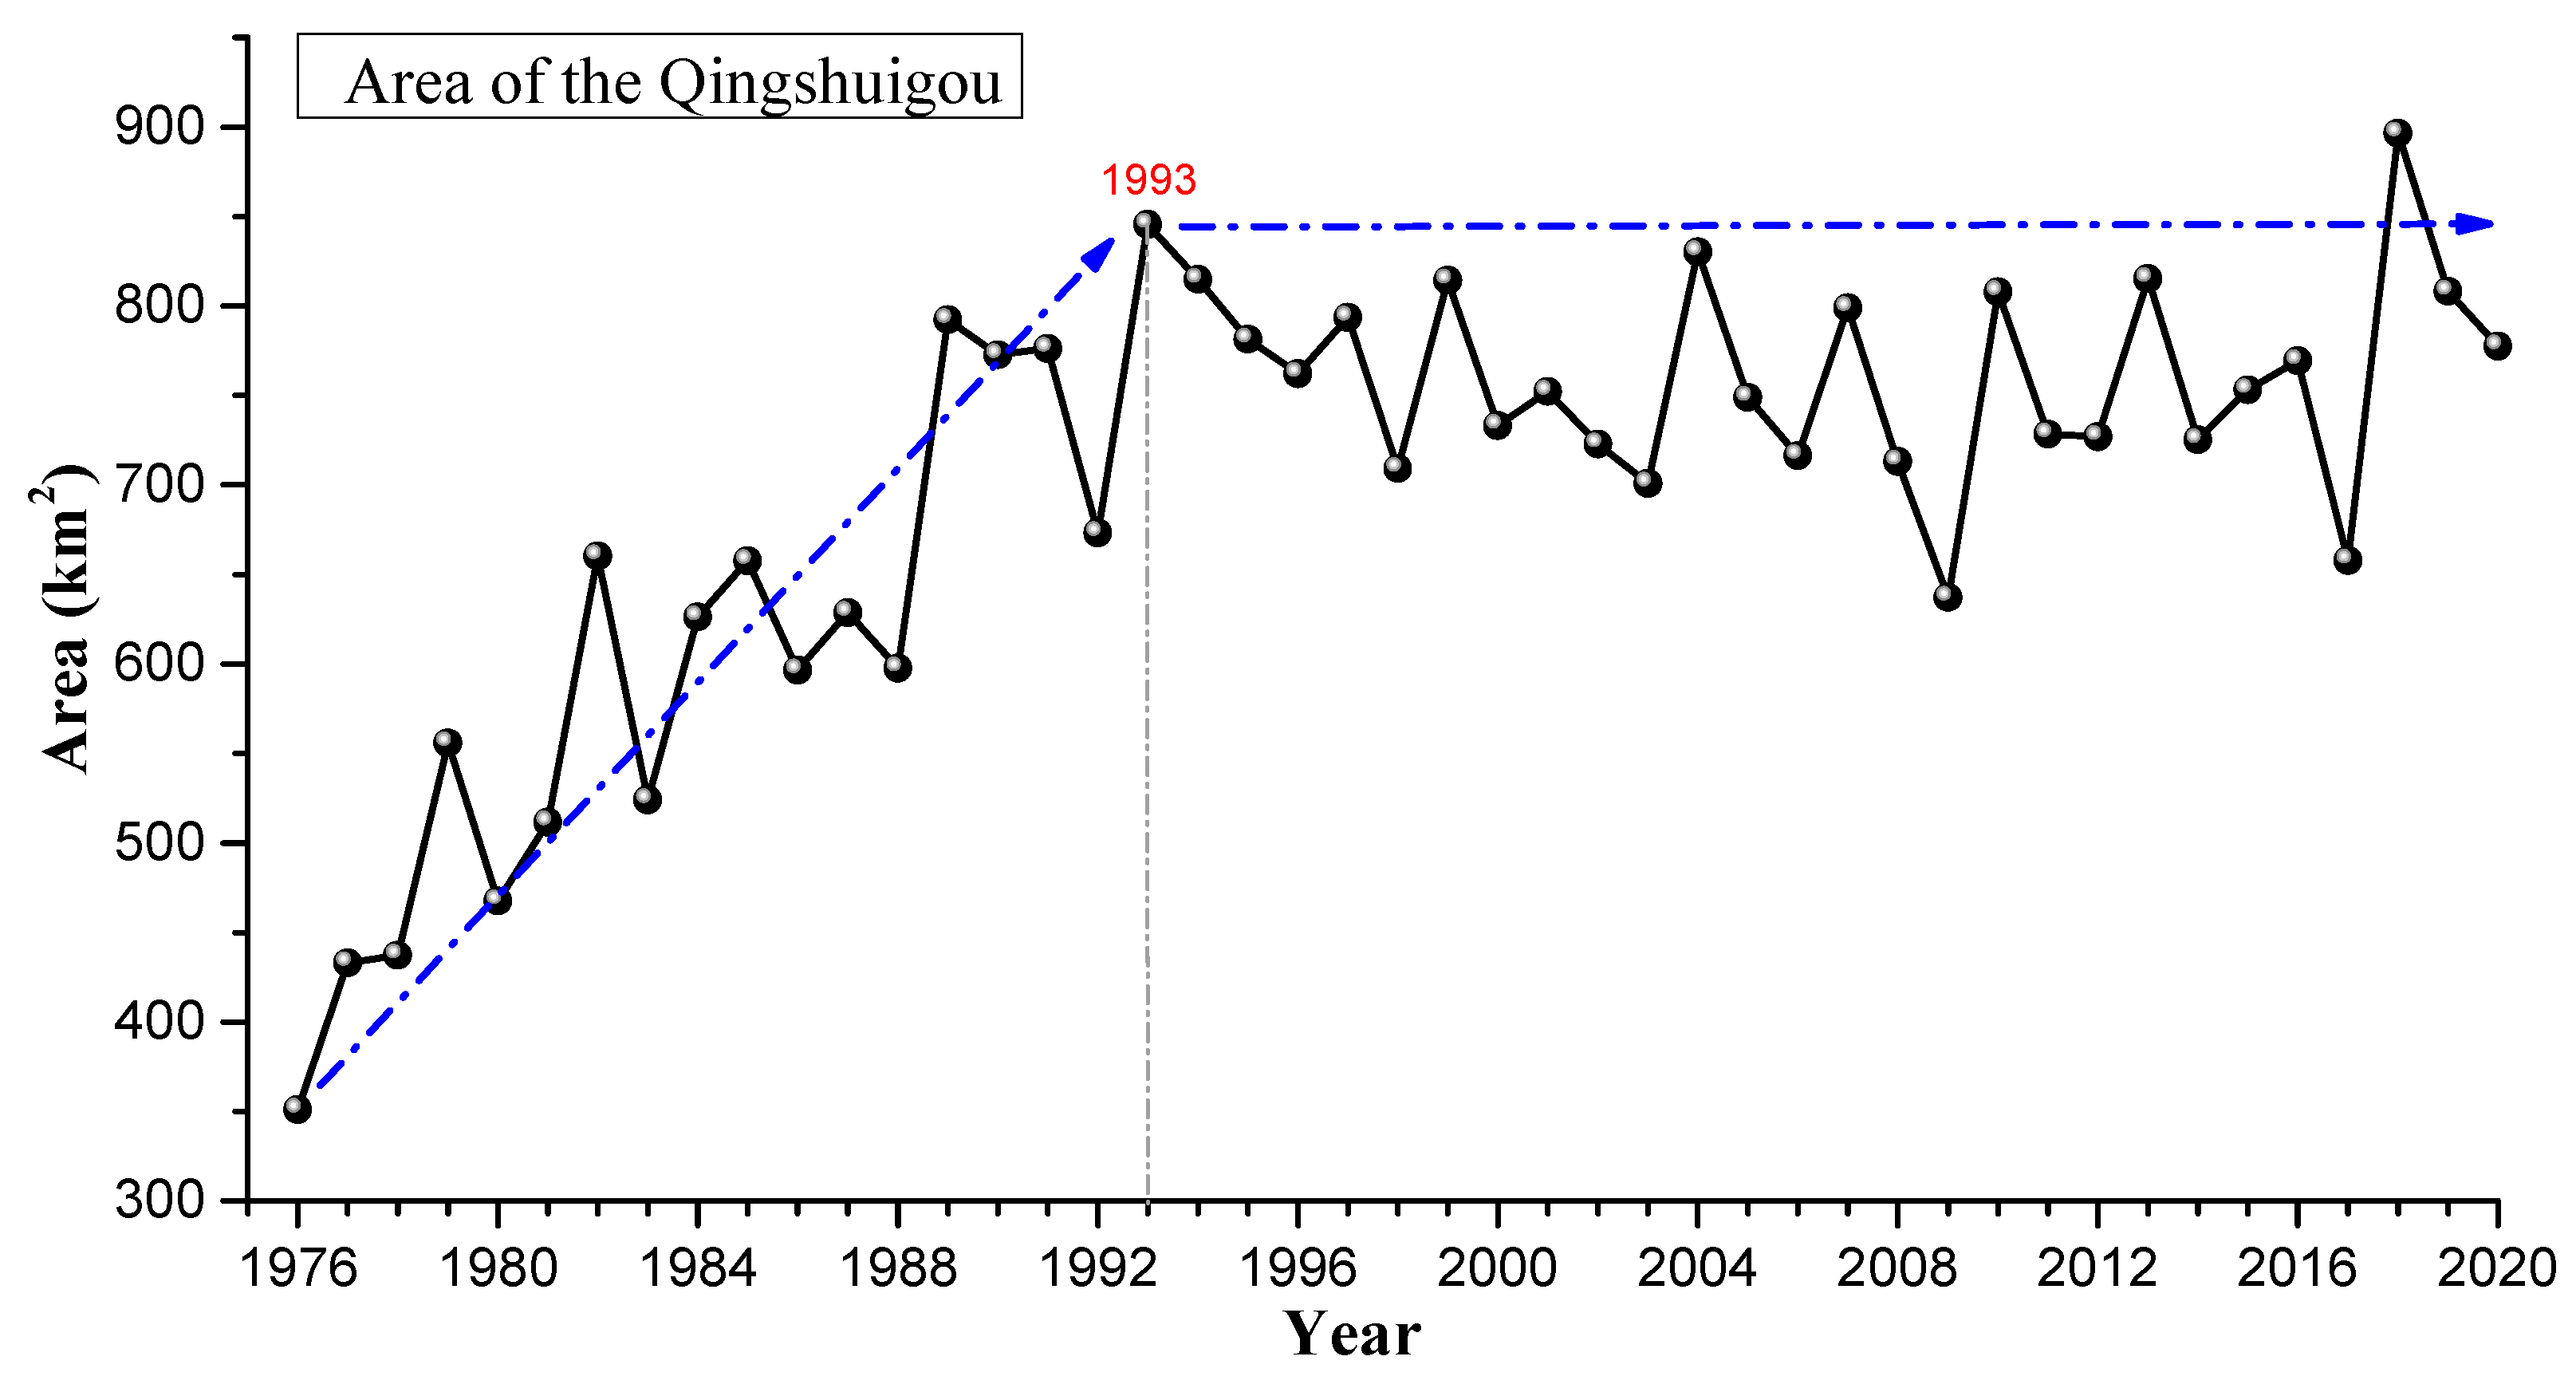
The areal variations in the Qingshuigou region are shown in Figure 6. The overall trend was increased first and then stabilized. The area of Qingshuigou region in 1976 was about 350.95 km2, while that in 2020 was about 777.62 km2. Over the past 45 years, the area of the Qingshuigou region has increased by about 426.67 km2. The areal evolution of the Qingshuigou region can be divided into two stages. (1) During 1976–1993, the area increased with an average growth rate of 29.1 km2/year; (2) during 1994–2020, the area gradually stabilized with some fluctuations.

Figure 6.
Areal variations in the Qingshuigou region during 1976–2020.
3.2.2. Evolution Characteristics of the Southeastern Part of the Qingshuigou
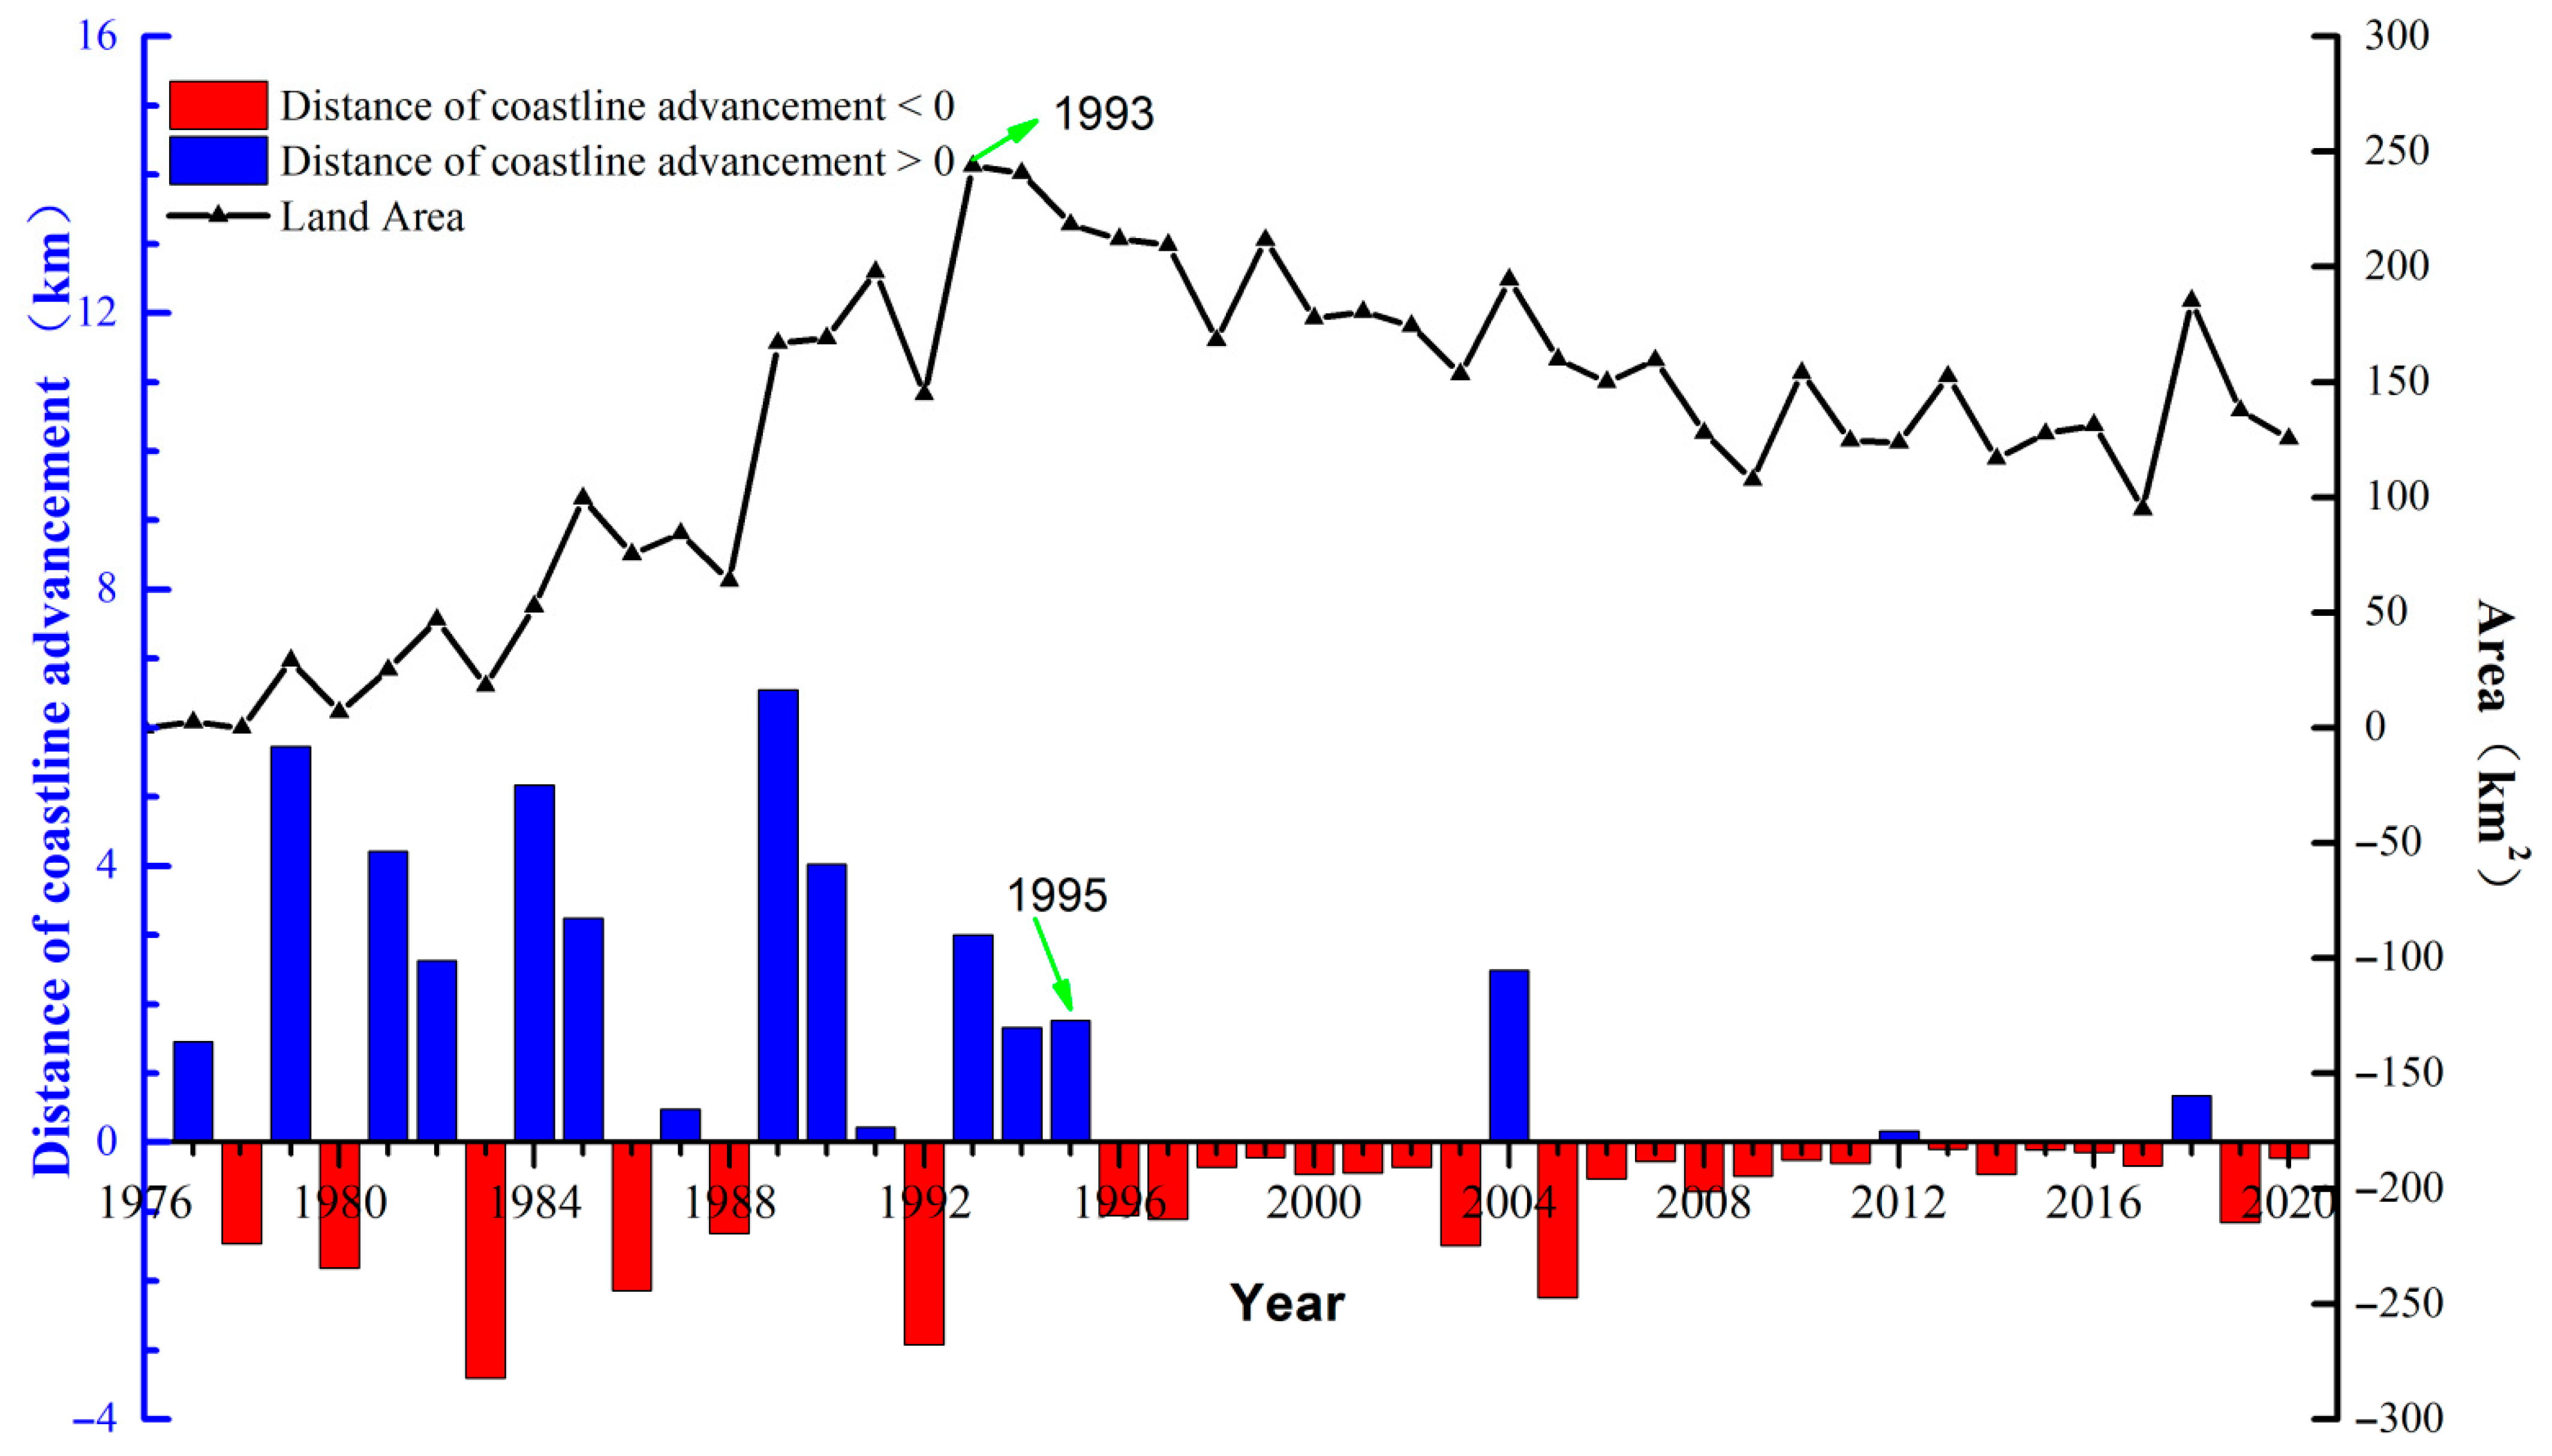
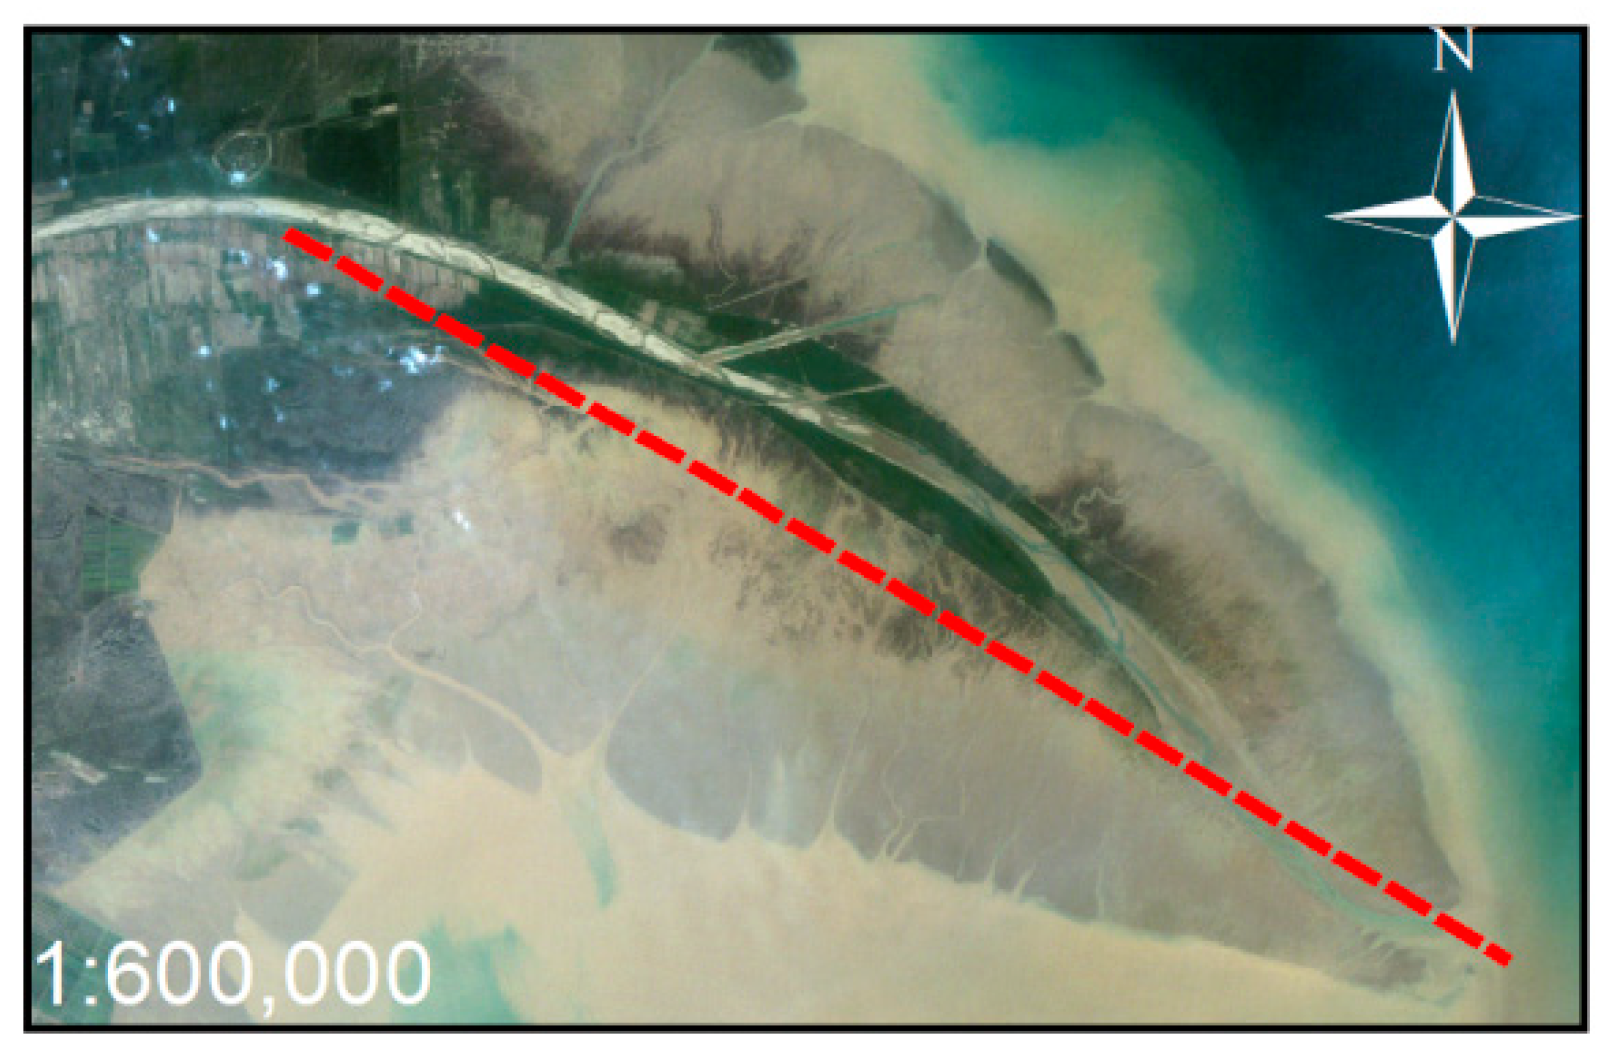
To clearly identify the evolution characteristics of the southeastern part of the Qingshuigou region, the study separately analyzed the land area and the distance of coastline advancement (Figure 7). The distance of coastline advancement in Figure 7 refers to the distance difference between coastlines in two consecutive years along the reference line. The reference line for the southeast region is shown in Figure 8.
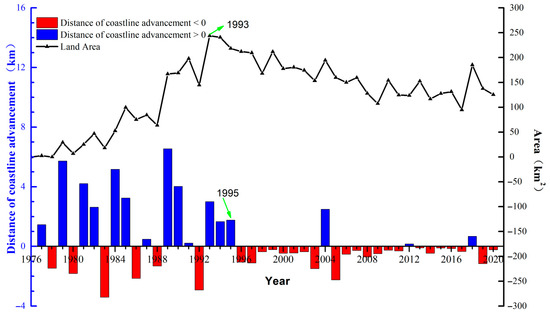
Figure 7.
Variations in land area and the distance of coastline advancement in the southeastern part of the Qingshuigou.
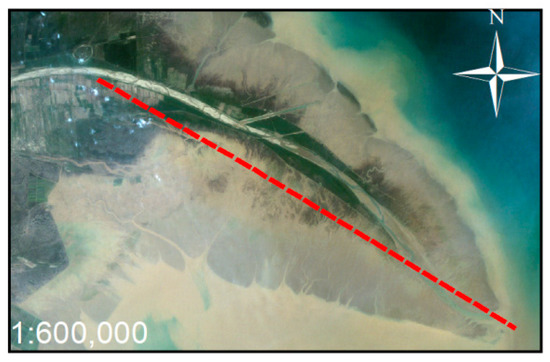
Figure 8.
Reference line (red dotted line) in the southeastern part of the Qingshuigou. The base map is the image of 1996.
As shown in Figure 7, the area in the southeastern part of the Qingshuigou region was about 0 km2 in 1976, while that in 2020 was about 125.42 km2. The overall trend was increased first and then decreased. From 1976 to 1993, the land area increased at an average rate of 14.34 km2/year. By 1993, the land area reached its maximum, about 243.76 km2. From 1993 to 2020, the area decreased at an average rate of 4.38 km2/year. For the distance of coastline advancement, before 1995, the region was mainly dominated by coastline advancement (blue columns), with an average annual advancing distance of 1.36 km. After 1995, it was dominated by erosion (red columns), with an average annual retreating distance of 0.30 km. These findings are consistent with those of Liu et al. [32].
However, it is worth noting that the year when the distance of coastline advancement started to be negative (1996) was different from the year with the greatest area of land formation (1993), which implies that the coastline was still advancing toward the sea, but the area was no longer increasing.
3.2.3. Evolution Characteristics of the Northeastern Part of the Qingshuigou Region
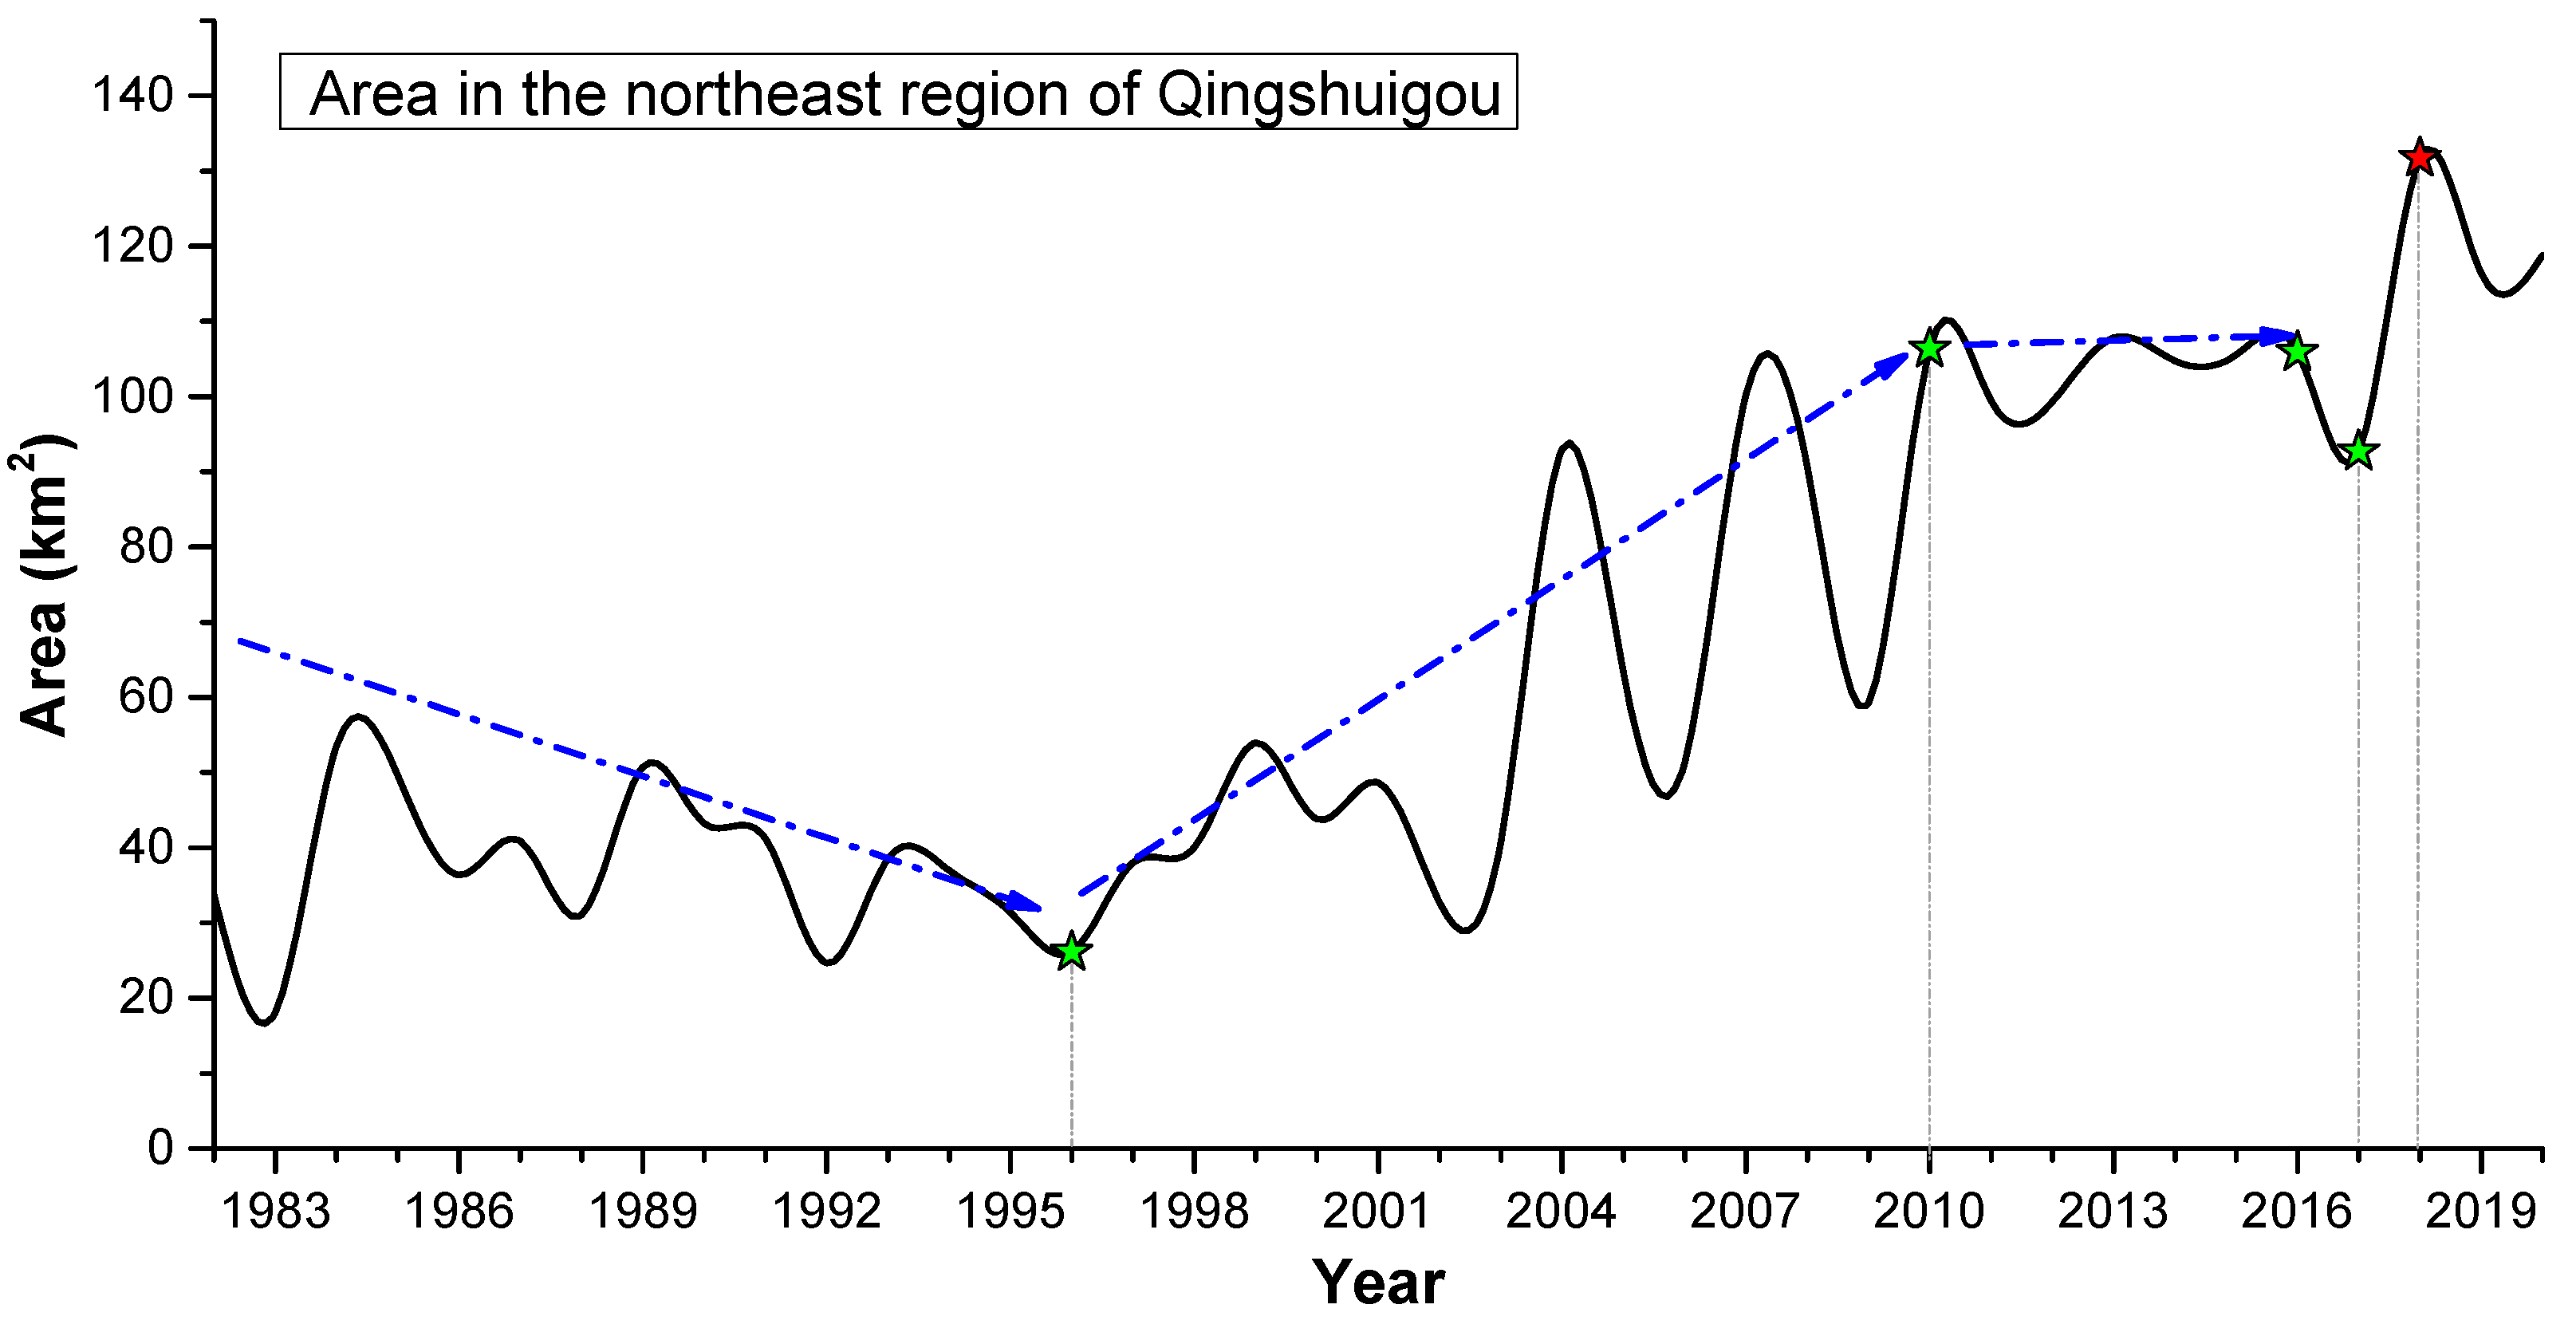
Figure 9 shows the area changes of the northeastern part of the Qingshuigou region. From 1984 to 1996, the area decreased at an average rate of 2.28 km2/year. However, during 1996–2010, the area increased continuously at an average rate of 5.73 km2/year. Furthermore, the area gradually leveled off from 2010 to 2016, which means that seawater erosion and sediment accretion offset each other. In 2017, the area dropped by about 36 km2, while in 2018, the area temporarily increased by about 90 km2. The area in 2020 was approximately 118.81 km2. During 1996–2020, the area increased by about 92.69 km2.
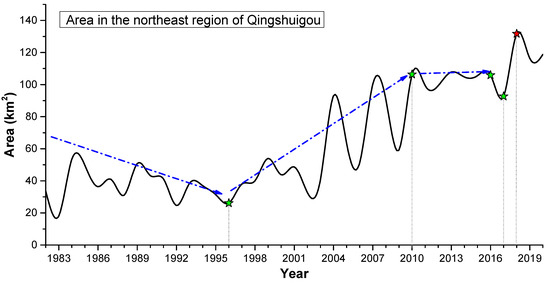
Figure 9.
Area changes in the northeastern part of Qingshuigou. The blue line denotes the trend line in different periods, the green stars mean the inflection points of the trend lines and the red star indicates the outstanding year.
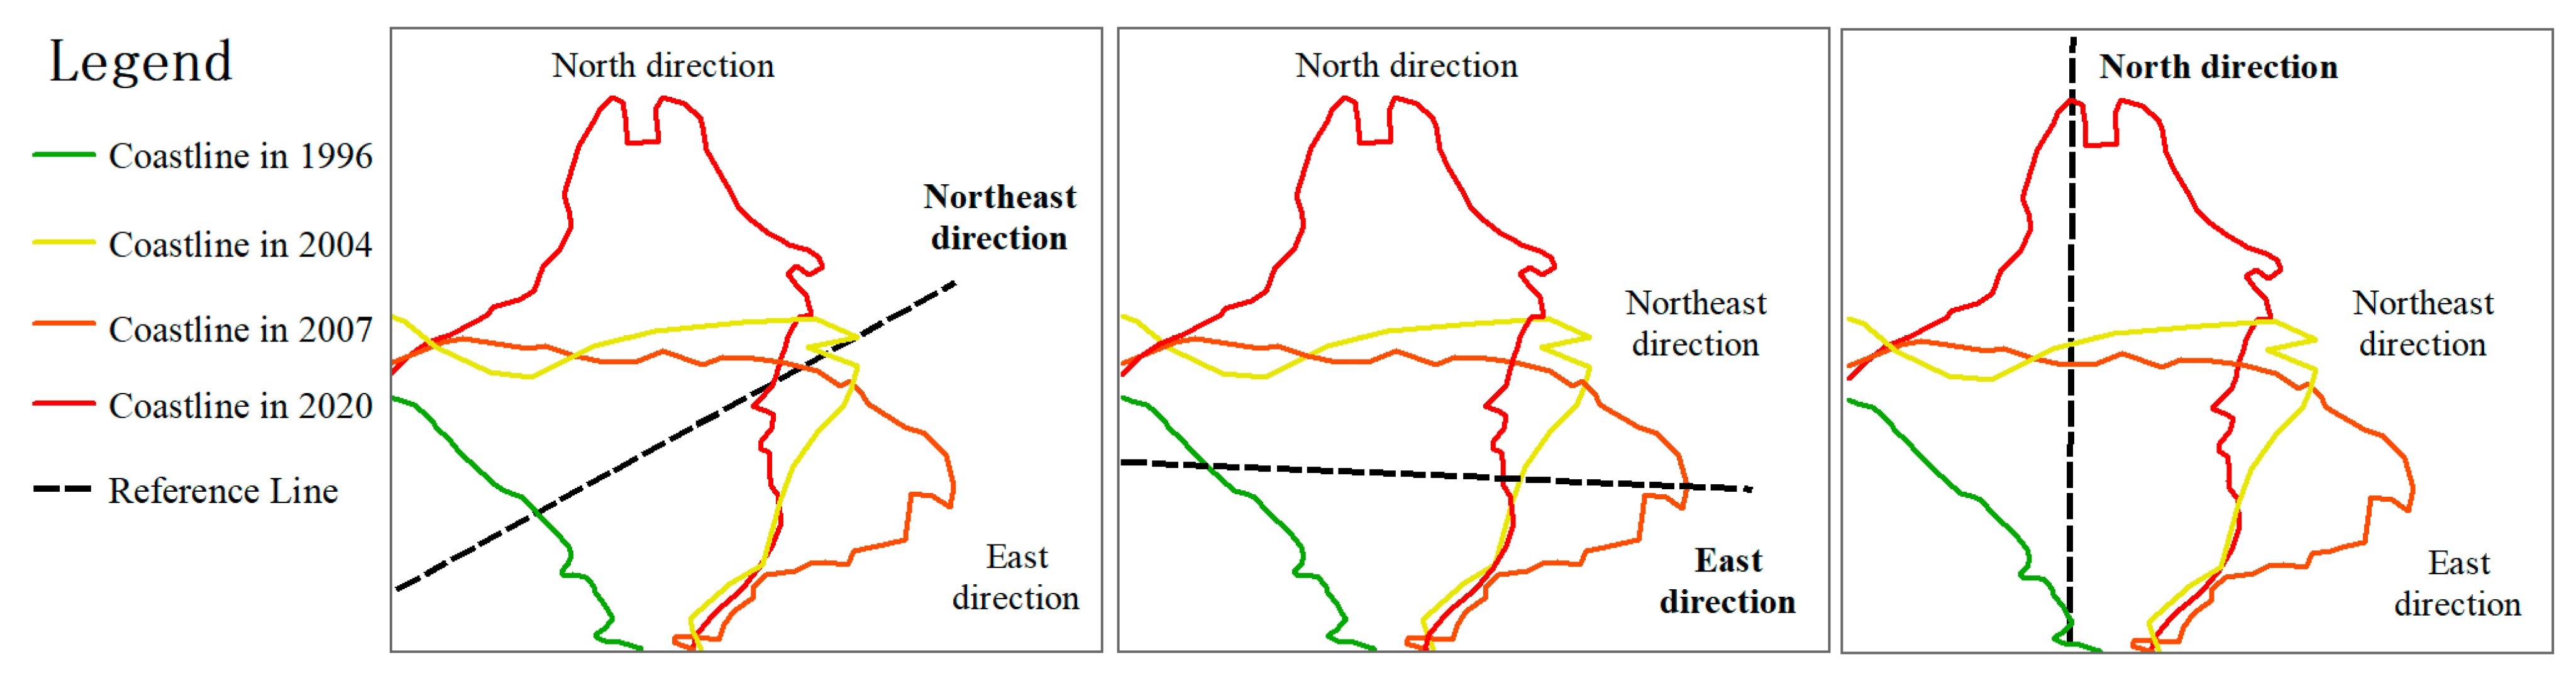
As revealed by Figure 2, the coastline of the northeastern part of the Qingshuigou region extended into the sea mainly in three directions: northeast, east and north. The reference lines in three directions are shown in Figure 10.

Figure 10.
Reference lines in the northeast, north and east directions in the northeastern part of the Qingshuigou.
The advancement distance is the seaward extension distance along the reference line based on 1982. The changes in advancement distances along three reference lines were analyzed, as indicated by Figure 11. Figure 11a shows the northeast direction, Figure 11b shows the east direction, while Figure 11c shows the north direction. As shown in Figure 11, before 1996, the coastline advancement distances for three directions fluctuated about 0 m. After 1996, they began to increase, especially in the northeast and east. For the advancement distance in the northeast direction (Figure 11a), the distance increased with an average annual advancing distance of 1.24 km. It reached its peak in 2004, and then declined. For the advancement distance in the east direction (Figure 11b), the distance was similar to that in the northeast direction before 2004. The difference is that it reached its maximum in 2007. The average annual advancing distance was about 1.19 km during 1996–2007. For the advancement distance in the north direction (Figure 11c), the distance increased with a rate of 1.55 km/year during 2009–2013. From 2013 to 2017, it became steady. However, after 2017, it increased again. By 2020, the northeast direction and the east direction tended to be stable, while the north direction continued to silt.
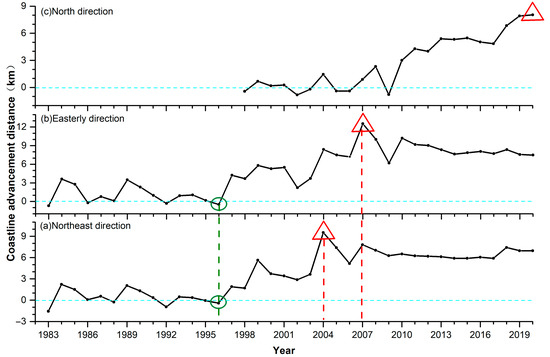
Figure 11.
Coastline advancement distance in the northeastern part of the Qingshuigou region (1982 as the base year). (a) Northeast direction; (b) easterly direction; (c) north direction. The green circles and red triangles mean the local minimum and maximum points in different directions, and the dotted lines describe the vertical lines correspond to the circles and triangles.
3.3. Spatiotemporal Evolution of the Diaokou Region
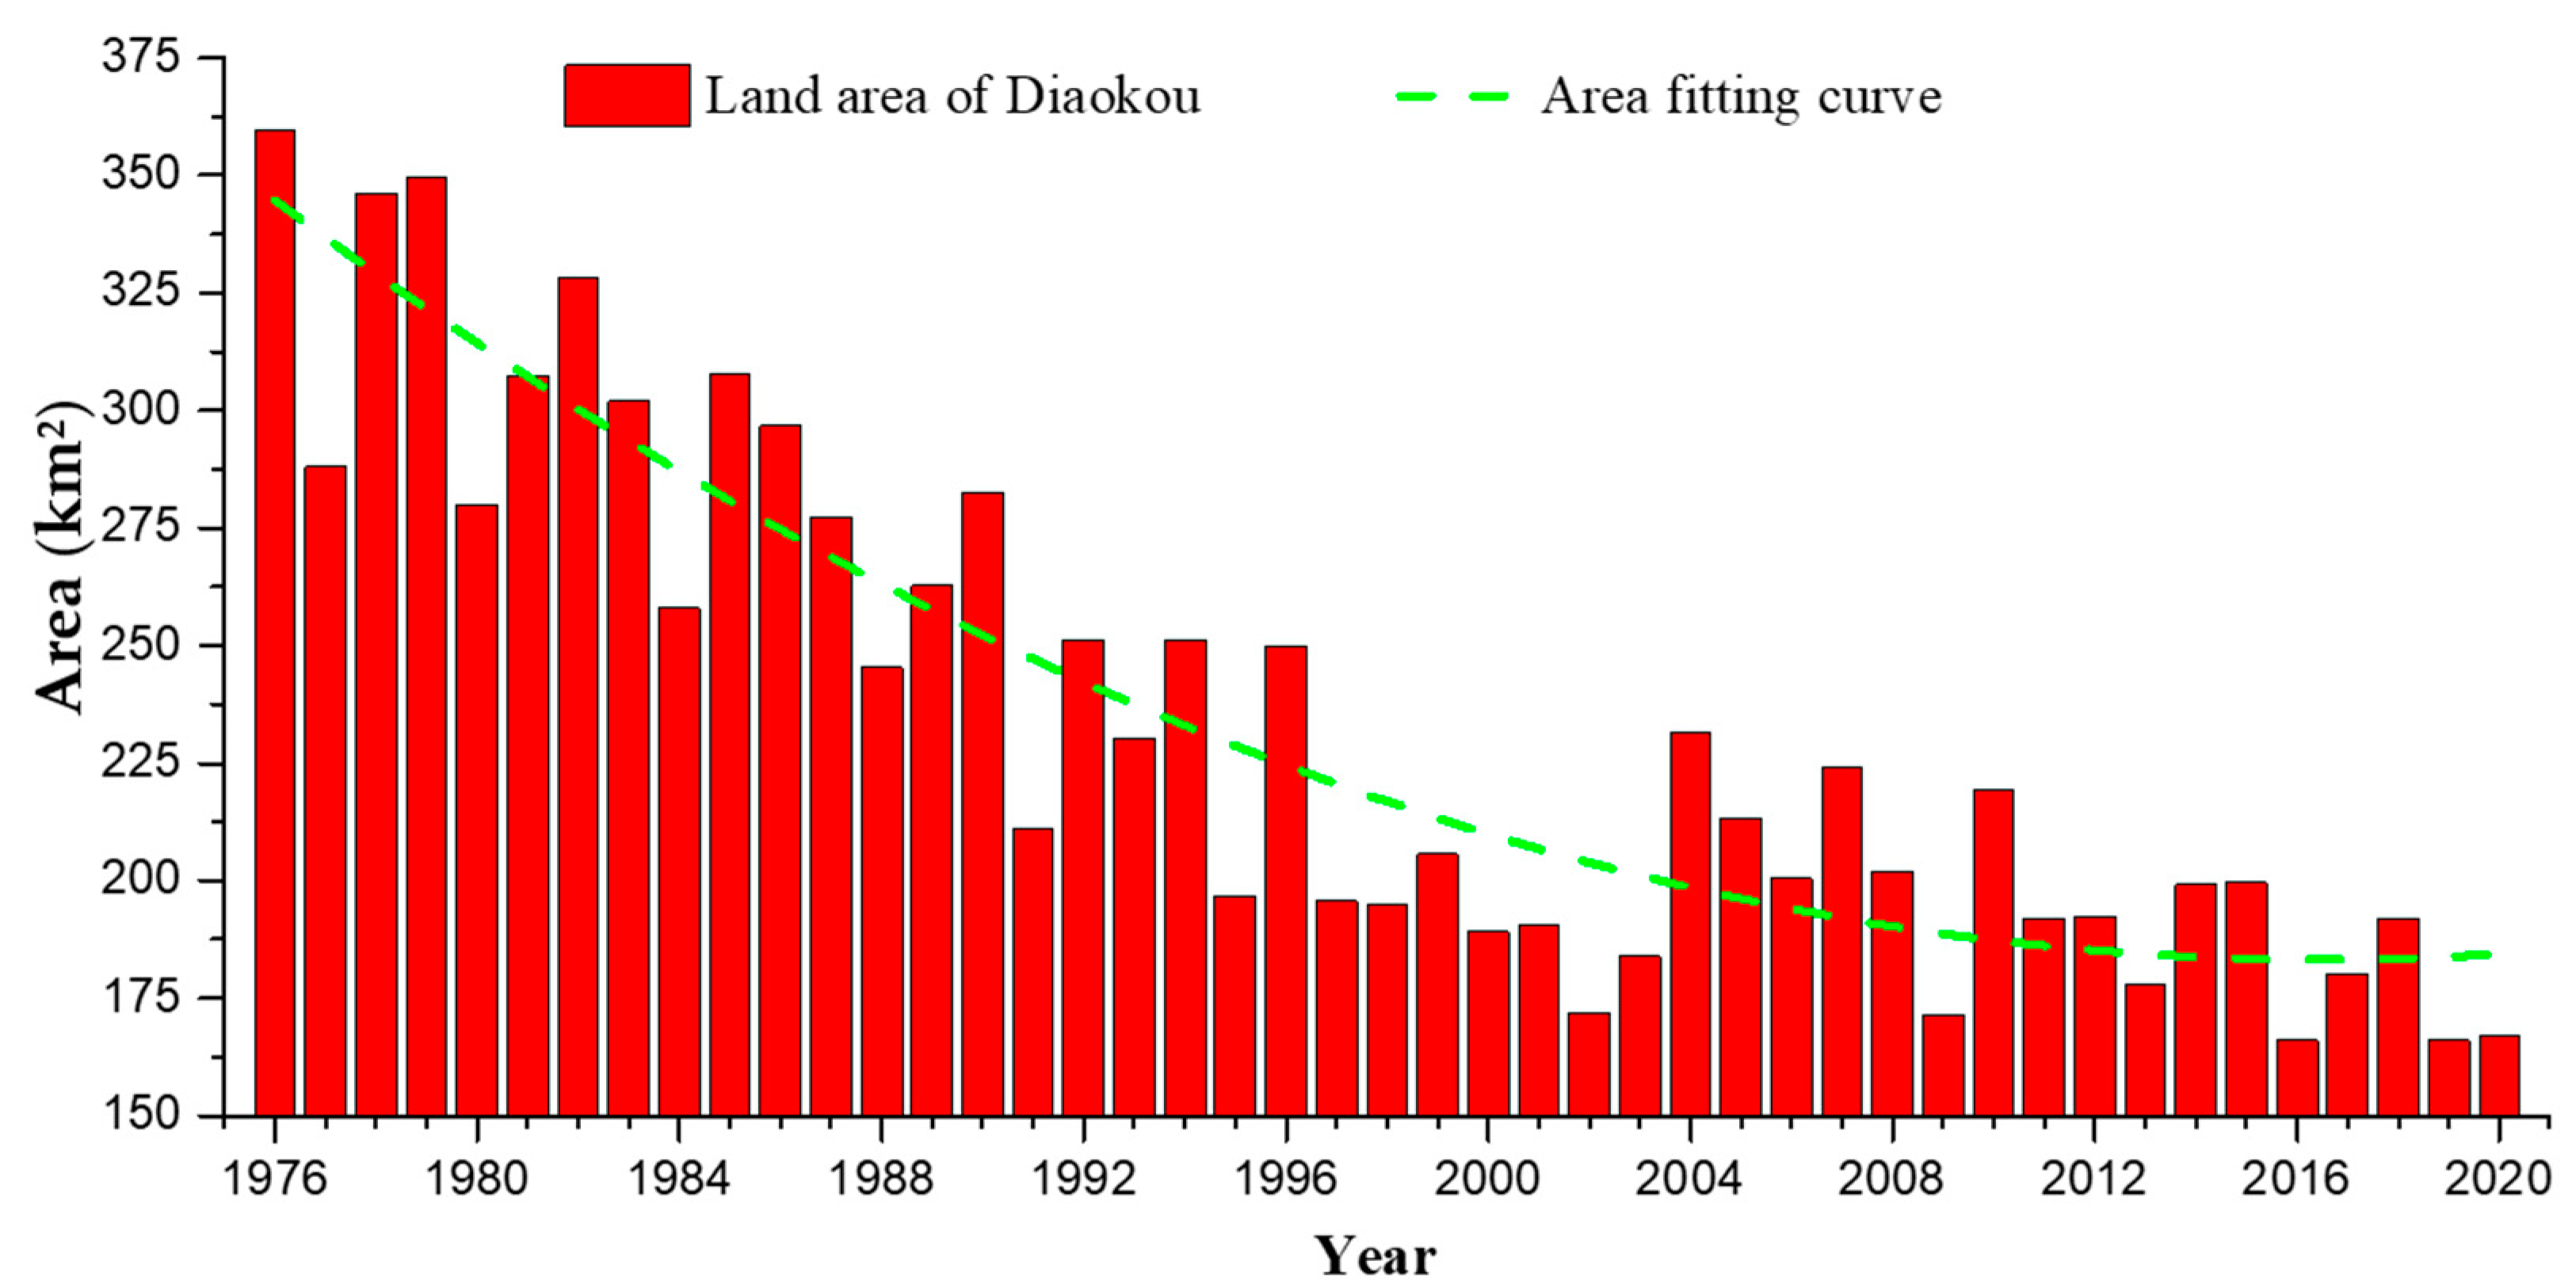
The Diaokou region was the estuary of the Yellow River from 1964 to 1976. After the artificial diversion of the Yellow River in 1976, the river channels of the Diaokou region became seasonal rivers. Figure 12 shows the evolution characteristics of the land area of the Diaokou region. Overall, the land area of the Diaokou region has been decreasing with an average rate of 4.4 km2/year. More specifically, from 1976 to 2002, the land area of Diaokou showed a rapid retrogradation trend with a retrogradation rate of 5.5 km2/year. From 2004 to 2013, the retrogradation rate became smaller: about 3.9 km2/year. From 2013 to 2020, it further slowed down: about 2.8 km2/year. Over the past 45 years, the area of the Diaokou region has decreased by about 192 km2.
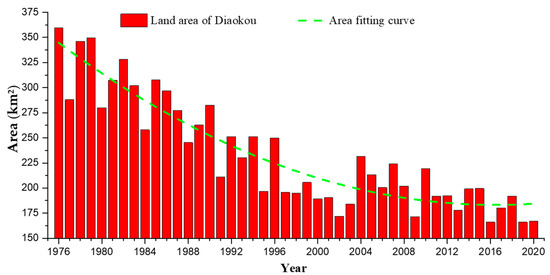
Figure 12.
Variations in the land area of the Diaokou region.
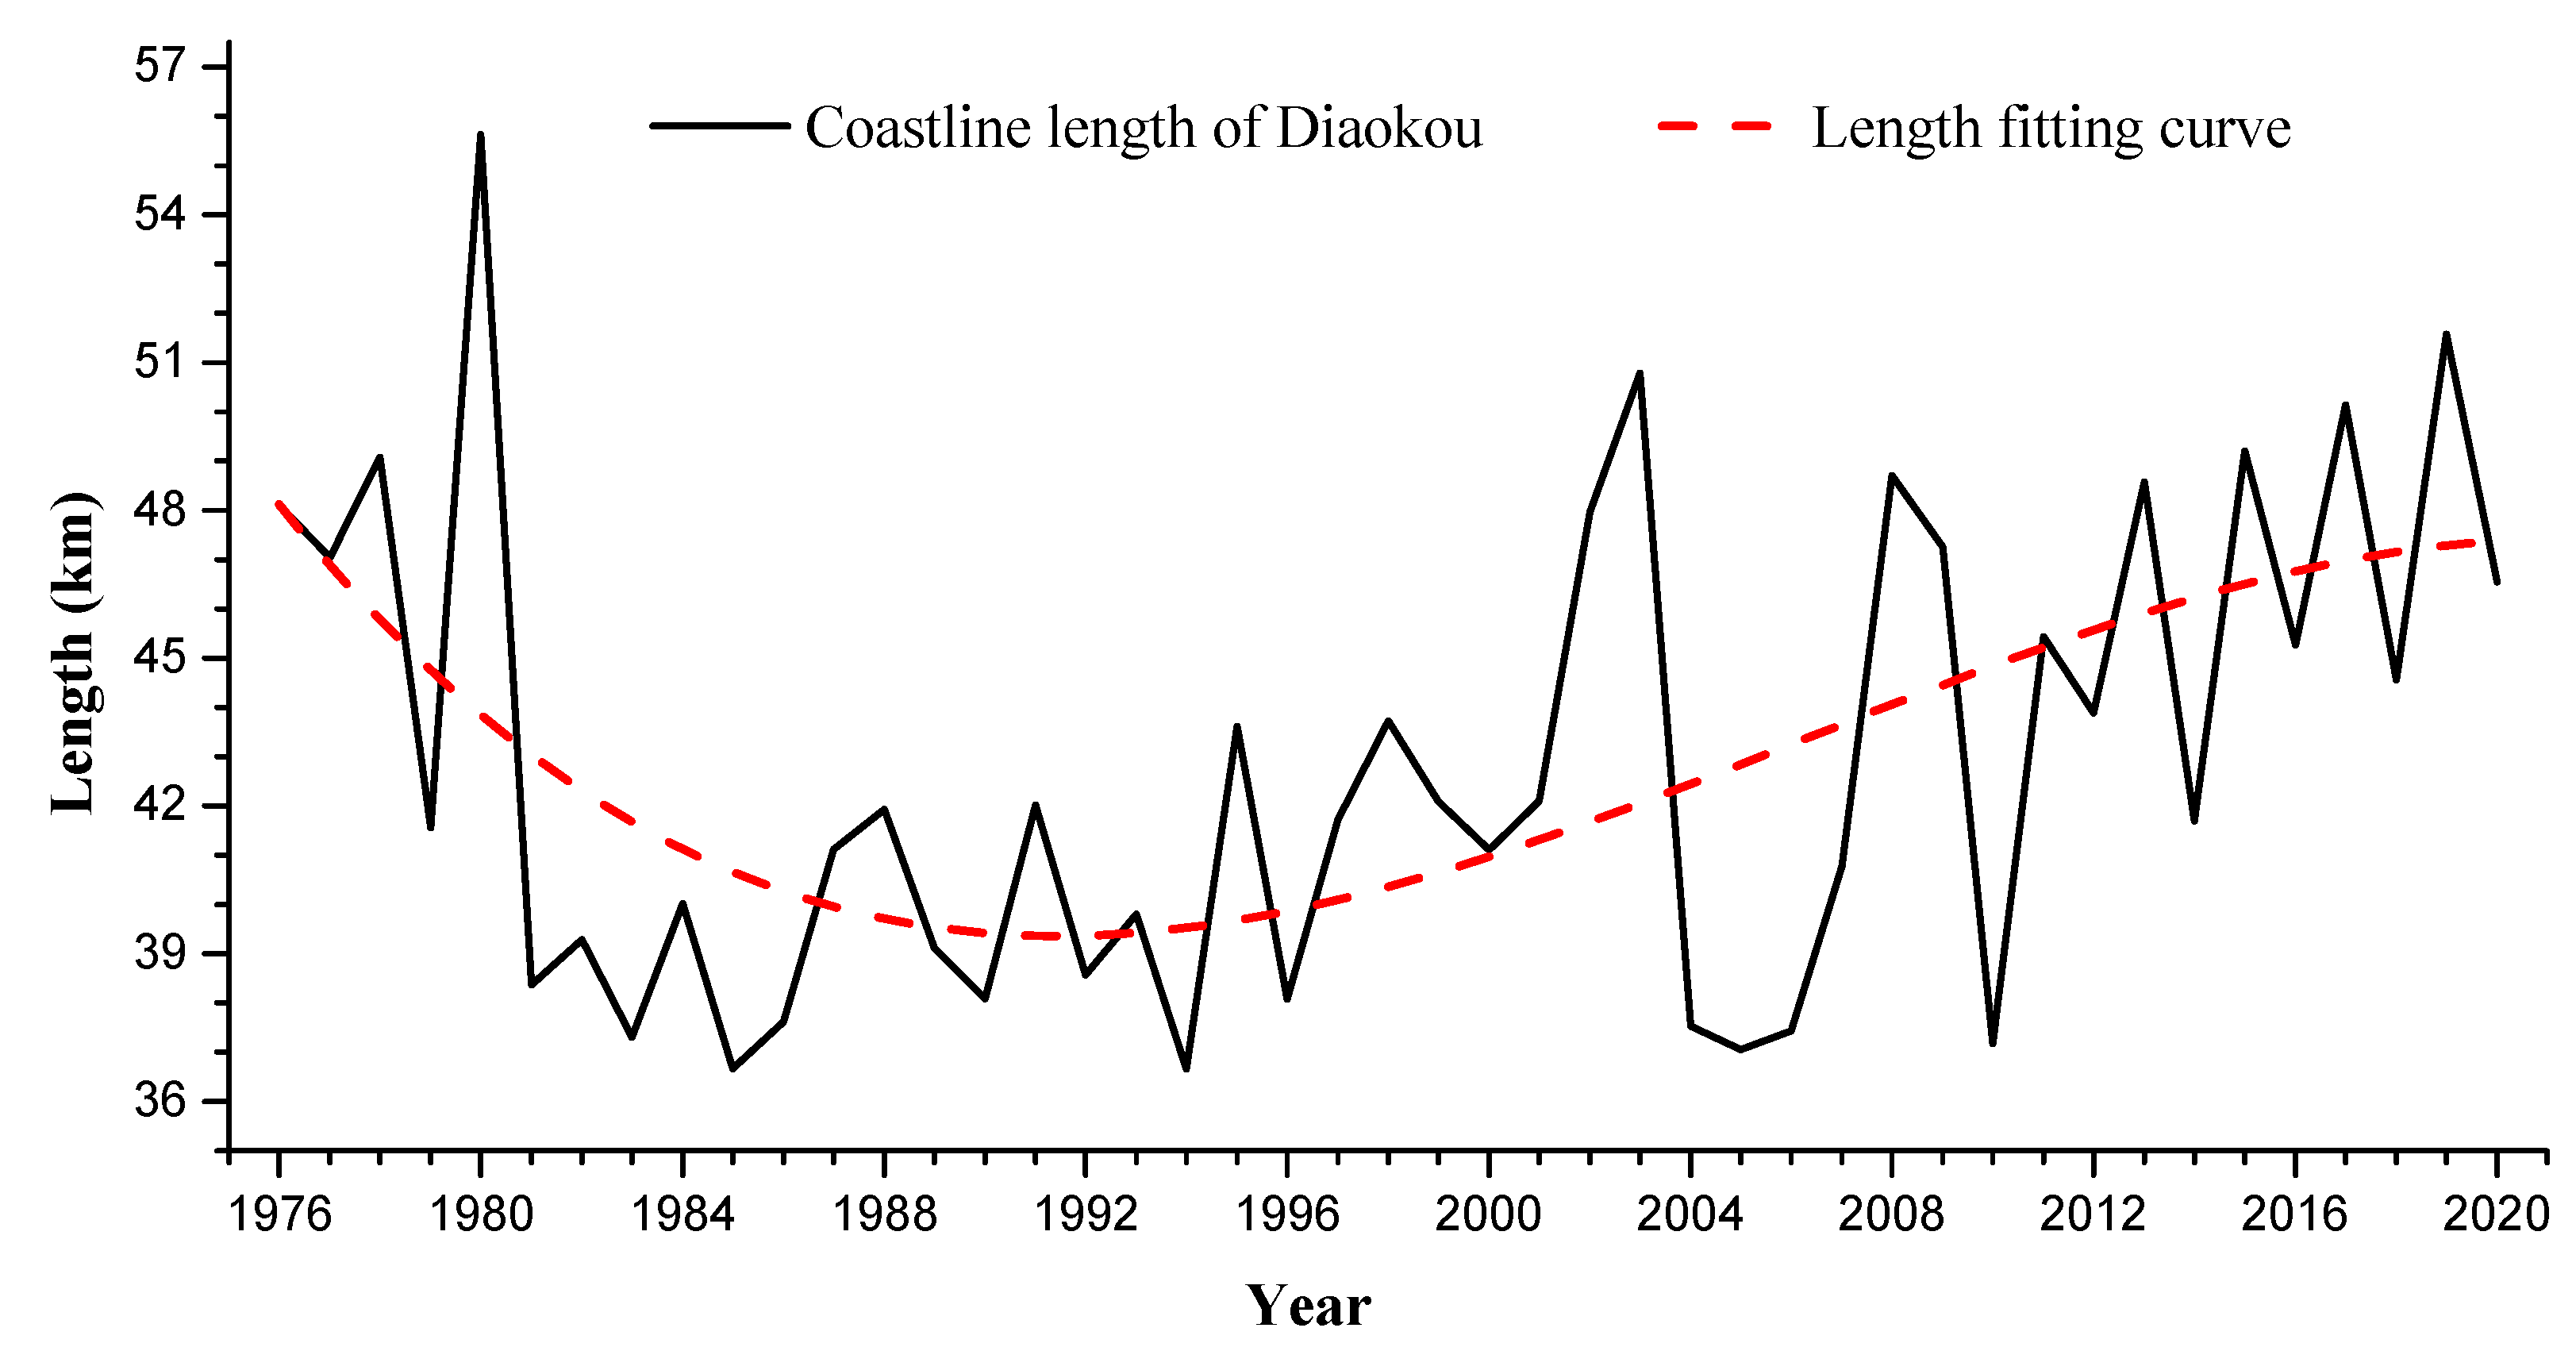
Figure 13 shows the evolution characteristics of the coastline length of the Diaokou region. The coastline length of the Diaokou region changed in a U-shape. From 1976 to 1994, it decreased at a rate of 0.64 km/year. After 1994, it slowly increased subsequently at a rate of 0.38 km/year.
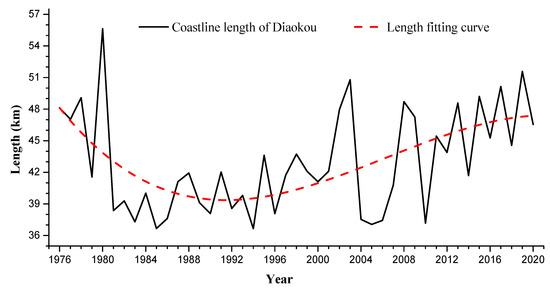
Figure 13.
Variations in the coastline length of the Diaokou region.
4. Discussions and Policy Implications
4.1. Analyzing Coastline Behavior
As the widest, most intact and youngest delta in China, the Yellow River Delta attracts considerable attention from scholars [26,27,28,29,30,31,32,33]. By using remote-sensed images, this paper showed that the overall land area of the Yellow River Delta has tended to decrease, which is similar to the results of Niu et al. [27] and Zhang et al. [30]. This may have been due to three reasons. One is that the water and soil conservation measures [13], such as the greening project of the Yellow River Shelterbelt, major gully improvement projects designed for water and soil conservation in the midstream stretches of the river and the conversion of farmland to forest, reduced the amount of silt carried by the Yellow River. The second reason is that after three water and sediment adjustment experiments [29], the amount of sediment deposited in the river has been reduced. The amount of river sediment washed by the water and sediment adjustment project implemented every year is limited. The third reason is that with the economic growth and increasing water diversion along the Yellow River, the water and sediment load of the river decreased, and sea erosion became dominant, leading to aggressive regional erosion and a decrease in area [44]. However, different from the findings of Wang et al. [28], this study reported that 1990 was the turning point in the land area from increasing to decreasing instead of 1998. The results showed in this work agreed well with the fact that frequent interruption of the river took place in the 1990s. Notably, the area of the Yellow River Delta expanded about 224 km2 during 2003–2004. This is mainly because three water and sediment adjustment experiments were implemented by the Ministry of Water Resources during 2002–2004. A large amount of sediment deposited in the river channel due to dry flow in the 1990s was washed into the sea in time, resulting in an increase in the land area.
Specifically, this study also explored the driving mechanisms of the changes in Diaokou and Qingshuigou. This work indicated that during 1976–2020, the land area of the Qingshuigou region increased, while the land area of the Diaokou region has been decreasing. The reason is mainly related to the river improvement projects conducted in the Xihekou (Figure 2) in May 1976, which changed the location of the Yellow River estuary from the Diaokou region to the Qingshuigou region.
4.1.1. Analyzing Coastline Behavior in Diaokou Region
The Diaokou region lost the supply of sediment from the Yellow River, and the sediment supplemented by seasonal rivers alone cannot compensate for that lost due to seawater, so the land area decreased. The progressive reduction in the retrogradation rate of the Diaokou region is probably associated with the environmental water conservation measures implemented by the Yellow River Water Resources Commission since 2010 [27]. Furthermore, as shown in Figure 13, the coastline length of the Diaokou region decreased first and then slowly increased. Analysis of the morphological changes in the region (Figure 2) revealed that the reasons for the coastline length changes are as follows. In 1976, the coastline in the Diaokou region curved out toward the sea, but as the estuary of the Yellow River was modified, the convex part was gradually eroded by the sea, leading to shortening of the coastline. However, with continuous sea erosion, the coastline became curved inward, resulting in lengthening of the coastline in Figure 13.
4.1.2. Analyzing Coastline Behavior in Qingshuigou Region
Impacted by the human activities, government policies and others, Qingshuigou region presented various changes. The land area first increased and then reached the sedimentation equilibrium state. In the early stage, the Yellow River carried a large amount of sediment [27,28], and land formation was dominant. In the later period, due to the gradual decrease in the amount of sediment carried by the Yellow River, the rate of land production gradually decreased and eventually tended to zero. Moreover, the interannual evolution of the land area of the Qingshuigou region was significant. Local minima were reached in 1980, 1992, 1998, 2009 and 2017, and these years corresponded to or close to the years with less sediment in the Yellow River [24,33]. Therefore, it is determined that the area of new land in the Qingshuigou region is closely related to the annual discharge and sediment load variations between alternating wet and dry periods and the amount of sediment from the Yellow River [45].
As illustrated by Figure 2, the Qingshuigou region formed two primary parts (the southeastern part and the northeastern part). From 1976, the sediment carried by the Yellow River was mainly transported to the southeastern part of the Qingshuigou region. This led to the expansion of the southeastern part to the sea. With the artificial diversion of the Yellow River along Qing-8 (Figure 2) in 1996 [46], the sediment was mainly transported to the northeastern part. The southeastern part lost its sediment supply, and seawater erosion gradually became dominant, leading to continuous erosion of the land area.
(1) The southeastern part of Qingshuigou region
After 1976, the coastline continued to extend to the sea until 1996, but the land area reached its maximum in 1993. Analysis found that frequent interruption of the Yellow River in the 1990s reduced the amount of sediment entering the sea, while most sediment carried by the Yellow River was transported to the position of the sand spit, allowing the sand spit to continue to extend forward. At the same time, the water depth and slope at the front of the Yellow River Delta also increased with the continued extension of the sand spit. This enhanced the hydrodynamic conditions, leading to severe erosion of the sides by seawater. The newly added land could not compensate for the eroded land, resulting in the gradual decrease in the land area after 1993.
(2) The northeastern part of Qingshuigou region
After 1996, the sediment carried by the Yellow River was mainly transported to the northeastern part of Qingshuigou region. This led to the expansion of the northeastern part to the sea. As indicated by Figure 9, two inflection points were noted, namely 2017 and 2018. In 2017, the land area suddenly dropped, which is related to the stop of the water and soil adjustment projects during 2016–2017. In 2018, the land area increased rapidly. This may be caused by two main factors. One is the substantial increase in the amount of sediment transported by the Yellow River (29.5 billion tons). The other is the restoration of soil and water conservation projects.
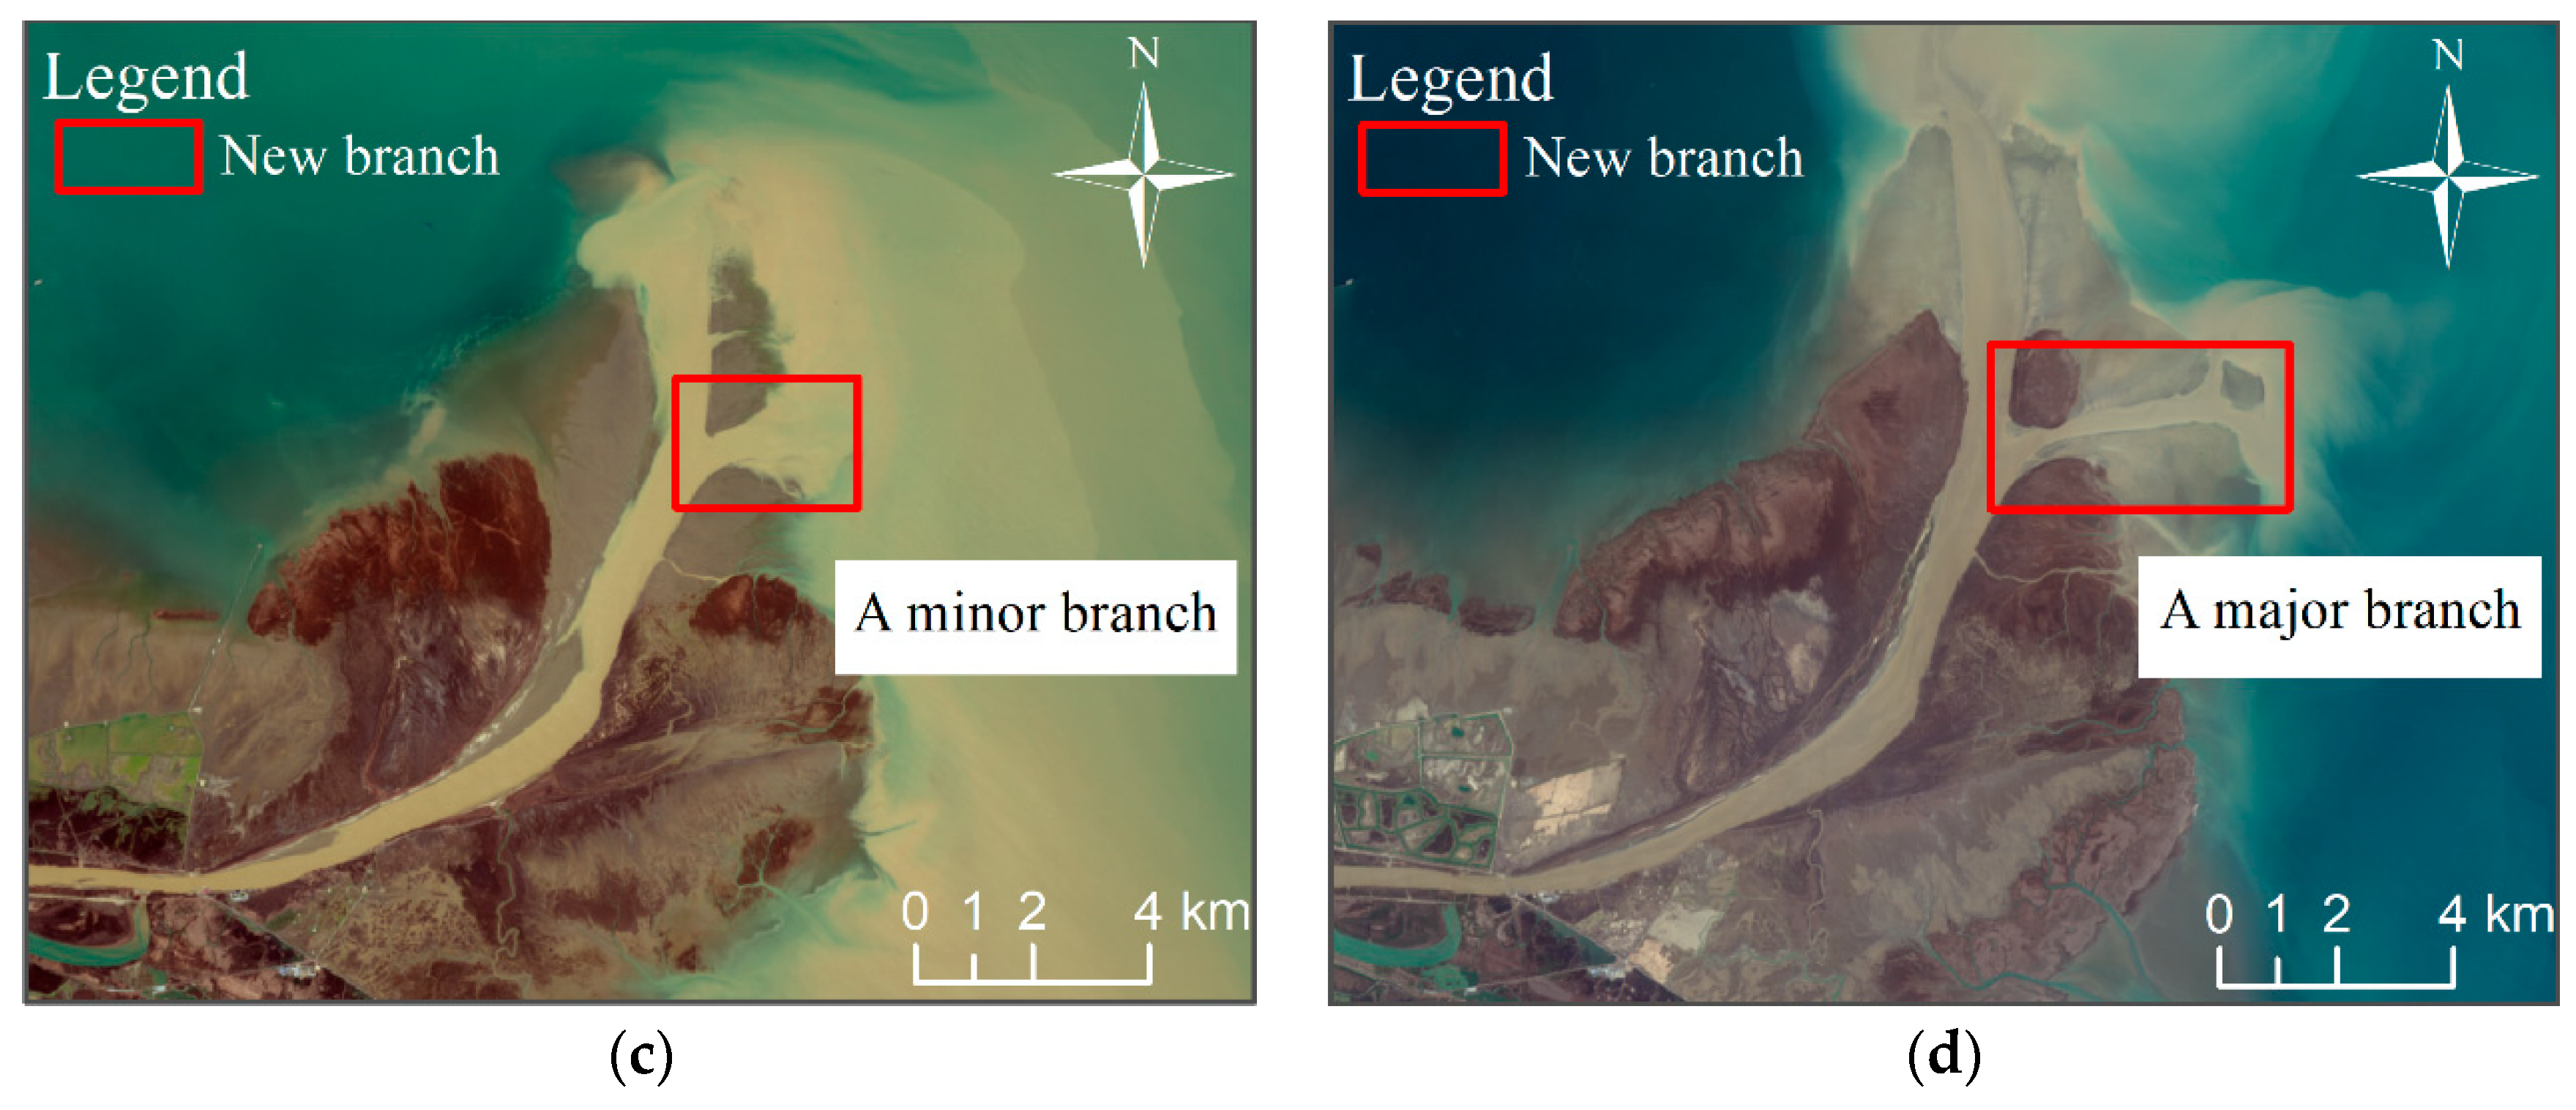
As illustrated by Figure 2, the coastline in the northeastern part of the Qingshuigou region changed in three directions: northeast, east and north. From Figure 11, the study found that after 2004, the coastline advancement distance declined in the northeast direction (Figure 11a), but still increased in the east direction (Figure 11b). The reason is that the Yellow River Water Resources Commission performed pilot dredging projects at the estuary in May 2004. This led to changes in the directions of the river channels near the estuary, reorienting the estuary to the east (Figure 14a,b). After 2007, the coastline advancement distance declined in the east direction, while that in the north direction (Figure 11c) increased gradually. It suggests that the river channels underwent changes again in 2007. At that time, the direction of the river was adjusted and turned toward the north, and a sufficient sediment supply enabled the coastline to expand northward quickly. From 2014 to 2017, the distance in the north direction has not changed. Exploration of the remote sensing images has demonstrated that this is because a branch (Figure 14c) appeared on the eastern side of the river in 2014. This branch carried away some sediment, leading to weak coastline advancement. In contrast, the advancement distance increased during 2018–2020. This indicates that the amount of sediment carried by the Yellow River from 2018 to 2020 has increased. Although the branch still exists (Figure 14d), enough sediment has been provided to advance toward the sea.
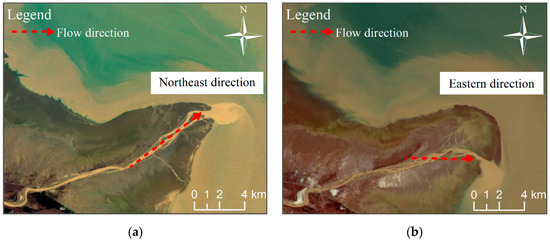

Figure 14.
Remote sensing images of the Qingshuigou northeast region in different years. (a) Image from 2004; (b) image from 2005; (c) image from 2014; (d) image from 2020.
4.2. The Advantages of the Yearly Analysis
By comparing with the existing studies, it is found that the use of yearly data or interval year data has little impact on the macro trend analysis, but the use of yearly data can capture more details. For instance, according to the yearly monitoring, the sand spit in the southeastern part of Qingshuigou, has been extending forward since 1976 until 1996. However, the land area reached the largest in 1993. In addition, according to the yearly monitoring, the northeastern part of Qingshuigou was divided into three directions in detail, namely the northeast direction from 1997 to 2004, the eastern direction from 2005 to 2007 and the northern direction from 2008 to 2020. Zhu et al. [33] also conducted this analysis. However, due to the use of data with interval years—specifically, 10 key years’ data were selected from 1980 to 2020—they did not distinguish the eastern direction and northern direction. These benefit from the yearly temporal resolution.
4.3. Target Suggestions for Government to Control Artificial Coastline
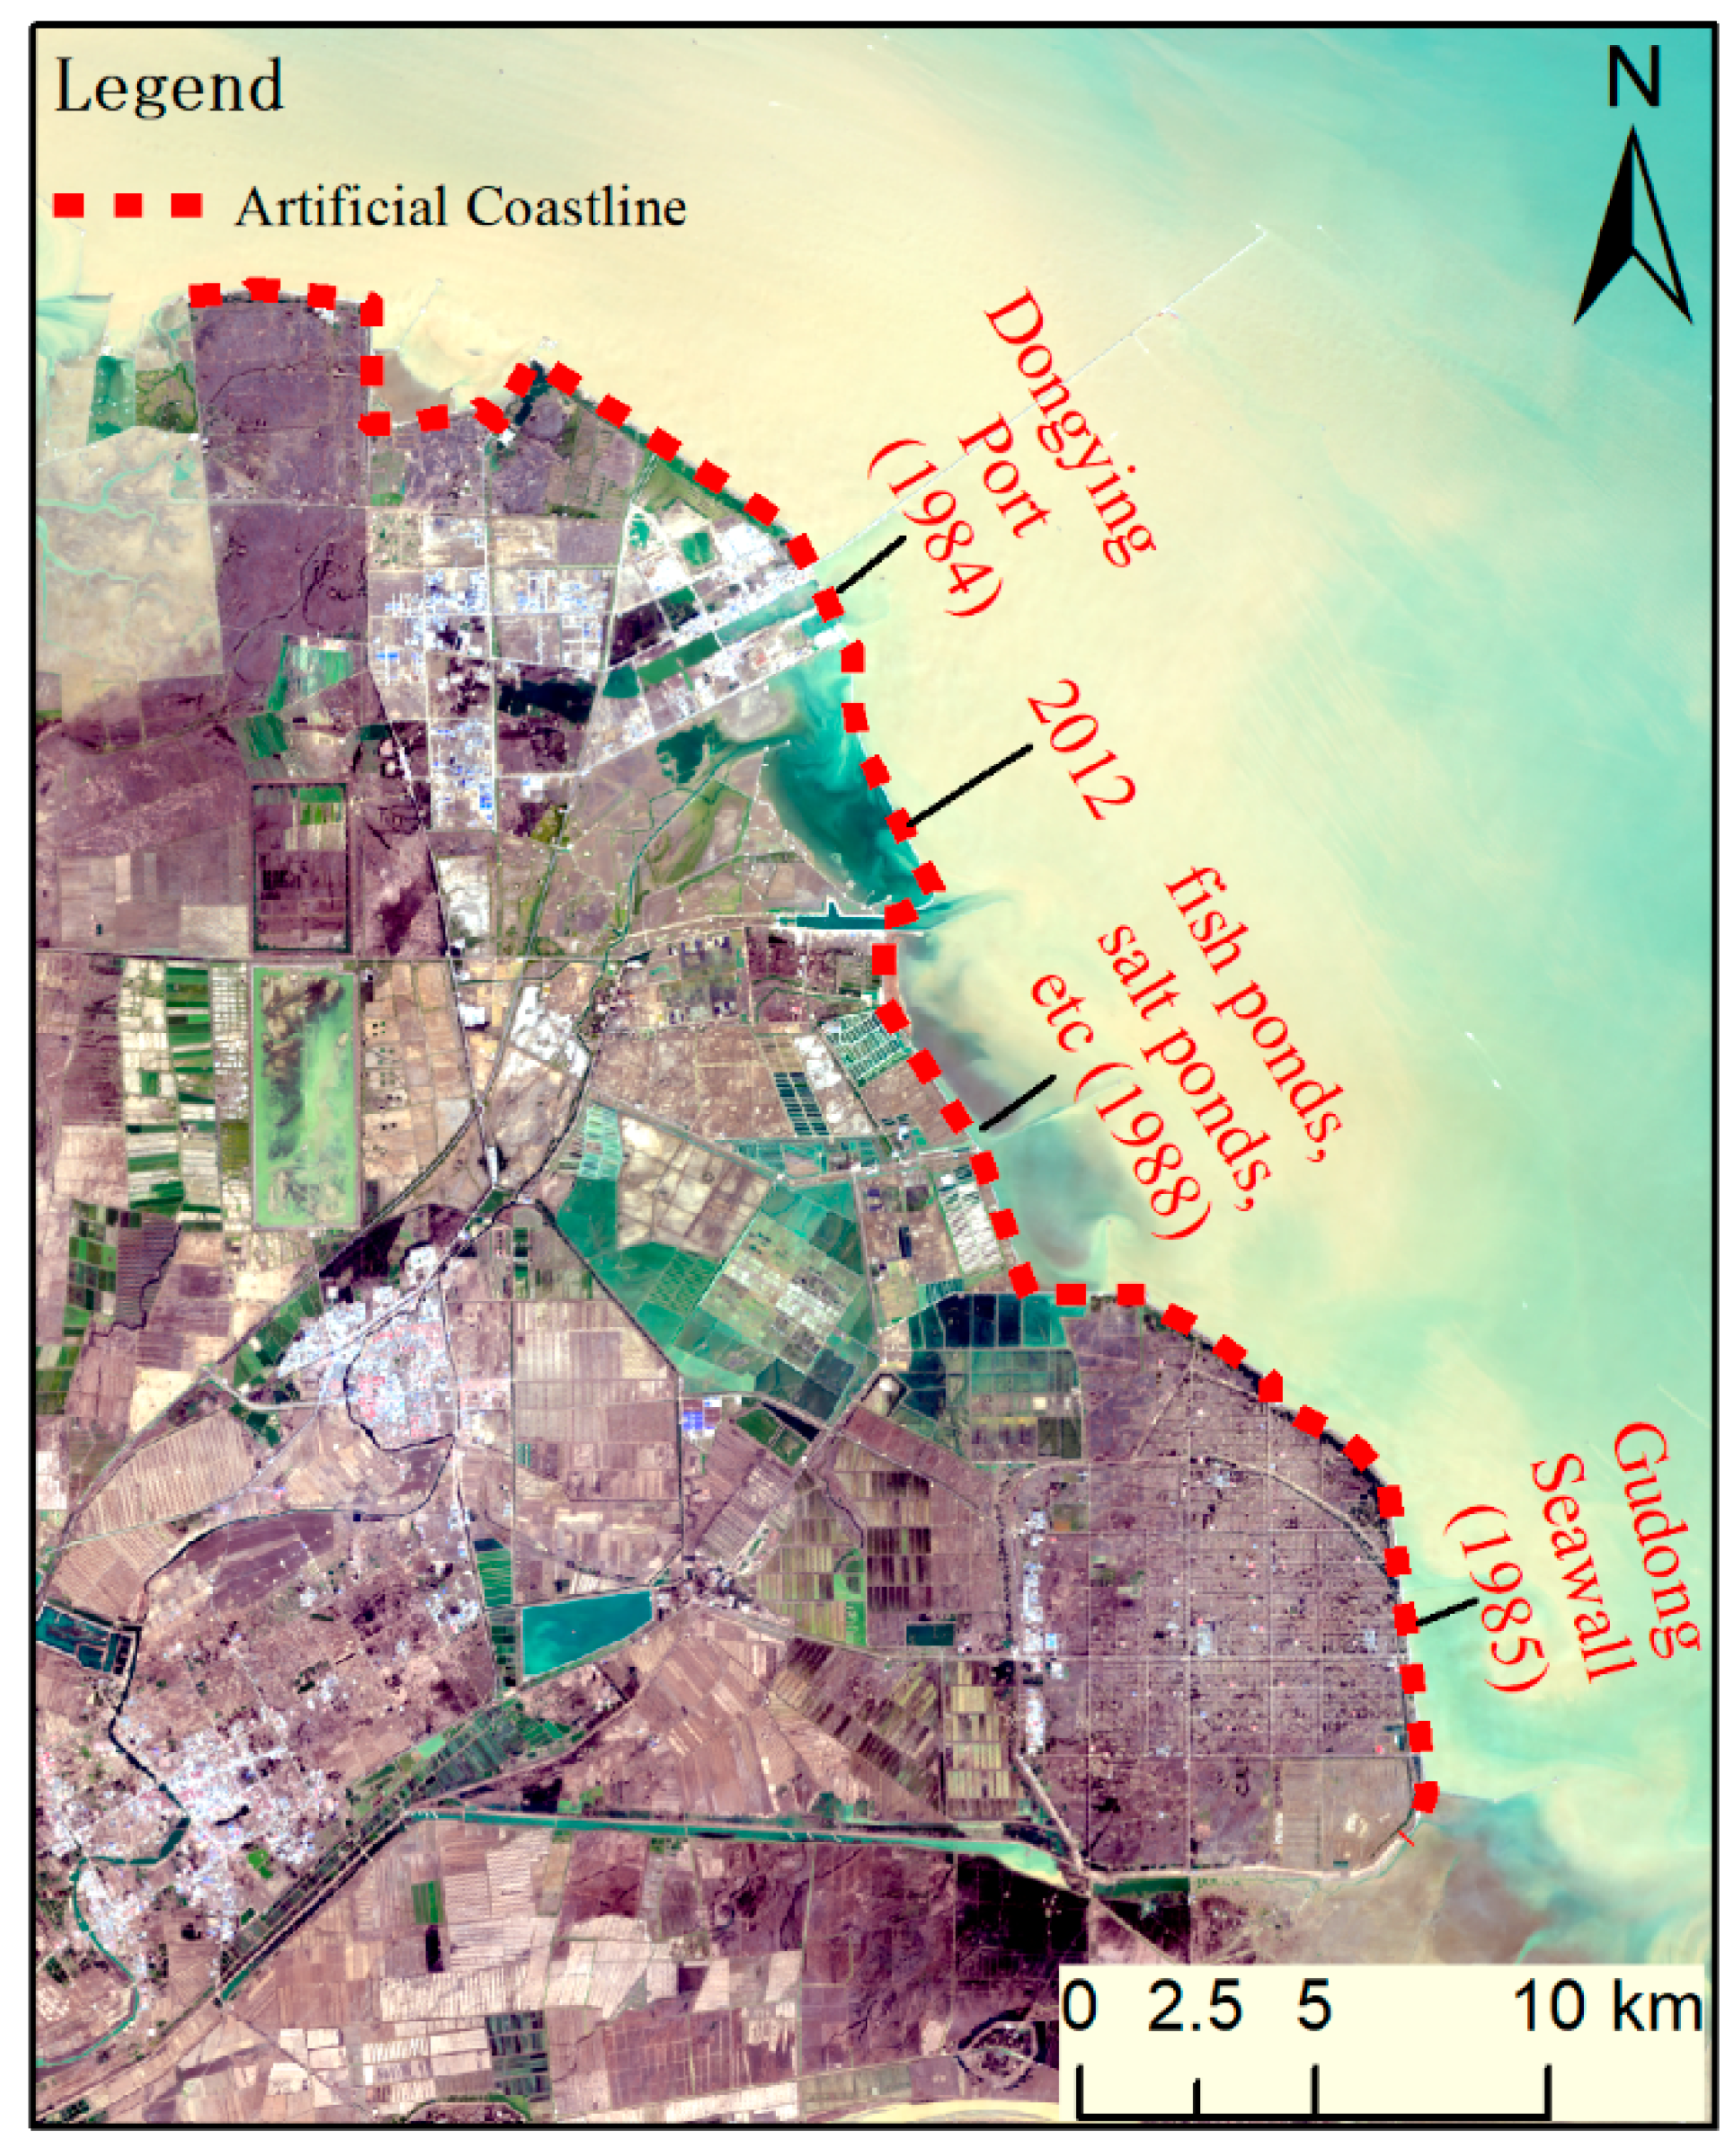
The Yellow River Delta is a highly concentrated area of human society and economy. This research revealed that during 1976–2020, the artificial coastline length of the delta grew about 55.25 km. The distribution of artificial coastline is shown in Figure 15. It increased by about 45.58 km during 1986–1988. There may be three reasons for this. One is that in 1986, seawall construction (Gudong Seawall, built in 1985) around Chengdao started to protect the stability of the coast in Chengdao and facilitate land-based extraction of oil and gas, resulting in an increase in the artificial coastline length. The second reason is that after seawater erosion in Dongying Port, which was built in 1984, seawater reached the main building structures and caused the main seaside area of Dongying Port to become an artificial coastline. The third reason is that salt pans, aquaculture ponds, reservoirs and ponds were constructed in 1988 [47]. The artificial coastline grew again in 2012–2013, increasing by about 7.14 km, because a pond was constructed in the south of the Dongying Port. By 2020, the coastline between the Diaokou and Qingshuigou regions has all turned into artificial coastline. The previous study [31] using the artificial coastline data of 1986, 2002 and 2014 showed a significant increase between 2002 and 2014, which is consistent with the results showed in this work. Excessive artificial coastline construction will significantly reduce the coastal conservation and disaster-prevention functions. It is recommended that the authorities limit the overexploitation of artificial coastlines and protect natural coastlines.
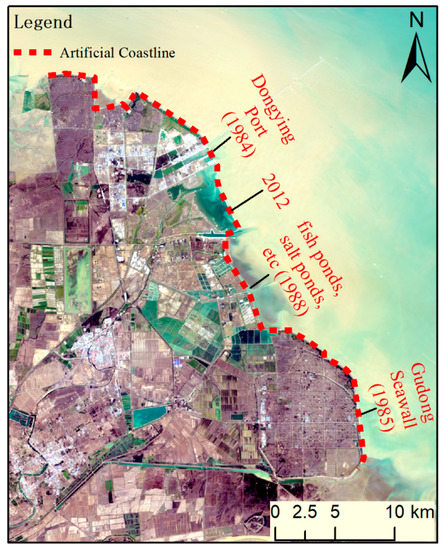
Figure 15.
Artificial coastline distribution.
In addition, as revealed by remote-sensed imagery analysis, a minor branch occurred in the east of the Yellow River Delta from 2014, and began to develop into a major branch in 2020. This branch took half of the sediment that should deposit to the north. According to the main paths for the outward transportation of the sediment of the Yellow River [33], it is predicted that the sediment transported by this branch will be mainly transported to the south. This will affect the development of Chengdao. Therefore, it is suggested that, in the future, the authorities should take necessary and timely actions, including manual interference, to control the expansion of this branch.
5. Conclusions
As the fastest growing delta in the world, the Yellow River Delta has experienced extremely rapid coastline evolution. Hence, accurately understanding its coastline change characteristics and the associated mechanisms is of great significance for regional management, planning and sustainable development. At present, existing studies have mostly focused on the analysis of overall coastline changes. However, the studies on the quantitative analysis of coastlines for regions with frequent changes are limited, and most of them have poor timeliness. Therefore, this paper investigated the long-term spatiotemporal evolution of the coastline by using yearly remote sensing imagery of the Yellow River Delta from 1976 to 2020. The following conclusions and recommendations were mainly driven and given.
(1) Overall, from 1976 to 2020, the Yellow River Delta was concave in Diaokou and convex in Qingshuigou. In the past 45 years, the coastline length first increased and then leveled off. Totally, it increased by approximately 54 km. It should be noted that the coastline between the Diaokou and Qingshuigou regions has all turned into artificial coastline. Excessive artificial coastline construction may reduce the coastal conservation and disaster prevention functions. It is recommended that the authorities limit the overexploitation of artificial coastlines and protect natural coastlines. Since 1990, the area of the delta showed a fluctuating decline, with an average decline rate of 4.83 km2/year, suggesting that actions such as conservation of water and soil and construction of reservoirs for the retention of sediment, have been fairly effective.
(2) In the Qingshuigou region, the coastline length first increased and then stabilized. Over the past 45 years, the land area increased by about 426.67 km2. The land area exhibited significant yearly variations, which may be closely related to the annual discharge and sediment load variations of the Yellow River between alternating wet and dry periods. The evolution of the southeastern and northeastern parts of the Qingshuigou region reflects that the human activities have a relatively great impact on the course of the tail channel and the morphological evolution of the delta. Notably, a minor branch that formed in 2014 slowly developed into a major branch in 2020. It is suggested that, in the future, manual interference should be taken in time to control the evolution of the Yellow River Delta.
(3) In the Diaokou region, the coastline has been retreating to land since 1976. The rate of retrogradation has been declining gradually, which is probably related to the environmental water conservation measures in 2010. Over the past 45 years, the land area has decreased by about 192 km2. According to the evolution characteristics of the Diaokou region, it is suggested that authorities should increase the times of ecological water compensation to conserve the current environment of the region.
(4) The investigation on the evolution patterns and mechanisms of the Yellow River Delta coastline reveals that anthropogenic factors and natural factors are the two major driving factors influencing the evolution patterns of the coastline. More specifically, among the anthropogenic factors, two major artificial diversions (1976, 1996), water and soil conservation projects, water and sediment adjustment projects (since 2002) and the increasing amount of water and sand used by human development, are the major factors that have affected the development of the delta. Among the natural factors, continuous low water levels and frequent flow interruptions caused by relatively low precipitation are the critical factors affecting sediment deposition in river channels and coastline retreat.
This study is of great significance for in-depth understanding of the temporal and spatial evolution of the coastline in the Yellow River Delta, and provides scientific support for coastline management and development. This paper only focused on the spatiotemporal variation analysis of the coastline and quantitative analysis of the associated mechanisms. The limitation is that other factors such as meteorological conditions, human activities and land uses are not considered simultaneously. In future research, more complex models will be introduced, and the above-mentioned factors will be integrated to quantitatively study the mechanisms leading to dynamic variations of the coastline.
Author Contributions
Conceptualization, C.L. and L.Z.; methodology, C.L., L.Z. and Z.D.; software, C.L., L.Z. and Z.W.; validation, C.L., L.Z. and Z.D.; formal analysis, C.L. and L.Z.; investigation, L.Z. and Z.W.; resources, L.Z., Z.W. and Z.D.; data curation, C.L., L.Z. and Z.W.; writing—original draft preparation, C.L., L.Z. and Z.D.; writing—review and editing, C.L., L.Z., Z.W. and Z.D.; visualization, C.L., L.Z. and Z.D.; supervision, L.Z., Z.W. and Z.D.; project administration, L.Z., Z.W. and Z.D.; funding acquisition, L.Z., Z.W. and Z.D. All authors have read and agreed to the published version of the manuscript.
Funding
This research was jointly funded by the National Natural Science Foundation of China (Grant No. 41907389), National Key Research and Development Program of China (Grant Nos. 2018YFB2100702, 2018YFB2100704), the Fundamental Research Funds for Chinese Academy of Surveying and Mapping (Grant Nos. AR2008, AR2120).
Institutional Review Board Statement
Not applicable.
Informed Consent Statement
Not applicable.
Data Availability Statement
All the Landsat data are available at no cost here: https://earthexplorer.usgs.gov/ (accessed on 22 November 2021).
Acknowledgments
We thank the United States Geological Survey for providing Landsat data freely.
Conflicts of Interest
The authors declare no conflict of interest.
References
- Uysal, M.; Polat, N.; Dereli, M. Coastline change of the Aksehir Lake (Southwestern Turkey) between 1984 and 2016. In Euro-Mediterranean Conference for Environmental Integration; Springer: Cham, Switzerland, 2017; pp. 1757–1758. [Google Scholar]
- Chang, Y.; Chu, K.; Laurence, Z. Sustainable coastal zone planning based on historical coastline changes: A model from case study in Tainan, Taiwan. Landsc. Urb. Plan. 2018, 174, 24–32. [Google Scholar] [CrossRef]
- Xu, N.; Gao, Z.; Ning, J. Analysis of the characteristics and causes of coastline variation in the Bohai Rim (1980–2010). Environ. Earth Sci. 2016, 75, 719. [Google Scholar] [CrossRef]
- Kuenzer, C.; Heimhuber, V.; Huth, J.; Dech, S. Remote Sensing for the Quantification of Land Surface Dynamics in Large River Delta Regions—A Review. Remote Sens. 2019, 11, 1985. [Google Scholar] [CrossRef] [Green Version]
- Petrişor, A.-I.; Hamma, W.; Nguyen, H.D.; Randazzo, G.; Muzirafuti, A.; Stan, M.-I.; Tran, V.T.; Aştefănoaiei, R.; Bui, Q.-T.; Vintilă, D.-F.; et al. Degradation of Coastlines under the Pressure of Urbanization and Tourism: Evidence on the Change of Land Systems from Europe, Asia and Africa. Land 2020, 9, 275. [Google Scholar] [CrossRef]
- He, Q.; Silliman, B.R. Climate Change, Human Impacts, and Coastal Ecosystems in the Anthropocene. Curr. Biol. 2019, 29, R1021–R1035. [Google Scholar] [CrossRef]
- Gamper, C.; Arbinolo, M. Adapting to a changing climate in the management of coastal zones. No. 24 Éditions. OCDE 2021. [Google Scholar] [CrossRef]
- Di, X.; Hou, X.; Wang, Y.; Wu, L. Spatial–temporal characteristics of land use intensity of coastal zone in China during 2000–2010. Chin. Geogr. Sci. 2015, 25, 51–61. [Google Scholar] [CrossRef]
- Xu, J.; Zhang, Z.; Zhao, X.; Wen, Q.; Zuo, L.; Wang, X.; Yi, L. Spatial and temporal variations of coastlines in northern China (2000–2012). J. Geogr. Sci. 2014, 24, 18–32. [Google Scholar] [CrossRef]
- Shi, L.; Liu, F.; Zhang, Z.; Zhao, X.; Liu, B.; Xu, J.; Wen, Q.; Yi, L.; Hu, S. Spatial differences of coastal urban expansion in China from 1970s to 2013. Chin. Geogr. Sci. 2015, 25, 389–403. [Google Scholar] [CrossRef]
- Zhou, Y.K.; Ning, L.X.; Bai, X.L. Spatial and temporal changes of human disturbances and their effects on landscape patterns in the Jiangsu coastal zone, China. Ecol. Indic. 2018, 93, 111–122. [Google Scholar] [CrossRef]
- Wang, X.G.; Yan, F.Q.; Su, F.Z. Changes in coastline and coastal reclamation in the three most developed areas of China, 1980–2018. Ocean Coast. Manag. 2021, 204, 105542. [Google Scholar] [CrossRef]
- Zhan, C.; Yu, J.; Wang, Q.; Li, Y.; Zhou, D.; Xing, Q.; Chu, X. Remote sensing retrieval of surface suspended sediment concentration in the Yellow River Estuary. Chin. Geogr. Sci. 2017, 27, 934–947. [Google Scholar] [CrossRef] [Green Version]
- Hou, X.; Wu, T.; Hou, W.; Chen, Q.; Wang, Y.; Yu, L. Characteristics of shoreline changes in mainland China since the early 1940s. Sci. China Earth Sci. 2016, 59, 1791–1802. [Google Scholar] [CrossRef]
- Wu, C.; Liu, G.; Huang, C.; Liu, Q.; Guan, X. Ecological Vulnerability Assessment Based on Fuzzy Analytical Method and Analytic Hierarchy Process in Yellow River Delta. Int. J. Env. Res. Public Health 2018, 15, 855. [Google Scholar] [CrossRef] [Green Version]
- Lu, J.; Wang, H.; Qin, S.; Cao, L.; Pu, R.; Li, G.; Sun, J. Estimation of aboveground biomass of Robinia pseudoacacia forest in the Yellow River Delta based on UAV and Backpack LiDAR point clouds. Int. J. Appl. Earth Obs. Geoinf. 2020, 86, 102014. [Google Scholar] [CrossRef]
- Sowman, M.; Raemaekers, S. Socio-ecological vulnerability assessment in coastal communities in the BCLME region. J. Mar. Syst. 2018, 188, 160–171. [Google Scholar] [CrossRef]
- Madeira, C.; Mendonca, V.; Leal, M.C.; Flores, A.A.V.; Cabral, H.N.; Diniz, M.S.; Vinagre, C. Environmental health assessment of warming coastal ecosystems in the tropics—Application of integrative physiological indices. Sci. Total Environ. 2018, 643, 28–39. [Google Scholar] [CrossRef] [PubMed]
- Cao, W.T.; Zhou, Y.Y.; Li, R.; Li, X.C. Mapping changes in coastlines and tidal flats in developing islands using the full time series of Landsat images. Remote Sens. Environ. 2020, 239, 111665. [Google Scholar] [CrossRef]
- Peng, J.; Ma, S.; Chen, H.; Li, Z. Temporal and spatial evolution of coastline and subaqueous geomorphology in muddy coast of the Yellow River Delta. J. Geogr. Sci. 2013, 23, 490–502. [Google Scholar] [CrossRef]
- Ren, C.; Wang, Z.; Zhang, B.; Li, L.; Chen, L.; Song, K.; Jia, M. Remote monitoring of expansion of aquaculture ponds along coastal region of the Yellow River Delta from 1983 to 2015. Chin. Geogr. Sci. 2018, 28, 430–442. [Google Scholar] [CrossRef] [Green Version]
- Liu, P.; Wang, Q.; Zhan, C.; Wang, X.; Du, G.; Li, X. Quantitative analysis of shoreline change in the Yellow River Delta from 1959 to 2002. Oceanol. Limnol. Sin. 2015, 46, 585–594. [Google Scholar]
- Choung, Y.; Jo, M. Shoreline change assessment for various types of coasts using multi-temporal Landsat imagery of the east coast of South Korea. Remote Sens. Lett. 2016, 7, 91–100. [Google Scholar] [CrossRef]
- Liu, Z.; Xu, N.; Wang, J. Satellite-Observed Evolution Dynamics of the Yellow River Delta in 1984–2018. IEEE J. Sel. Top. Appl. Earth Obs. Remote Sens. 2020, 13, 6044–6050. [Google Scholar] [CrossRef]
- Sun, Z.; Niu, X. Variation Tendency of Coastline under Natural and Anthropogenic Disturbance around the Abandoned Yellow River Delta in 1984–2019. Remote Sens. 2021, 13, 3391. [Google Scholar] [CrossRef]
- Li, Y.; Yu, J.; Han, G.; Wang, Y.; Zhang, Z. Coastline change detection of the Yellow River Delta by satellite remote sensing. Mar. Sci. 2012, 36, 99–106. [Google Scholar]
- Niu, M.; Wang, J. Spatiotemporal heterogeneity of Shoreline changes in Dongying section of the Yellow River Delta based on Landsat. Water Resour. Prot. 2020, 36, 26–33. [Google Scholar]
- Wang, Y. Analysis on the water and sediment variation in Yellow River and its influence on the change of Yellow River Delta. Master’s Thesis, University of Chinese Academy of Sciences, Beijing, China, 2016. [Google Scholar]
- Kong, D.; Miao, C.; Borthwick, A.G.L.; Duan, Q.; Liu, H.; Sun, Q.; Ye, A.; Di, Z.; Gong, W. Evolution of the Yellow River Delta and its relationship with runoff and sediment load from 1983 to 2011. J. Hydrol. 2015, 520, 157–167. [Google Scholar] [CrossRef] [Green Version]
- Zhang, X.; Yang, Z.; Zhang, Y.; Ji, Y.; Wang, H.; Lv, K.; Lu, Z. Spatial and temporal shoreline changes of the southern Yellow River (Huanghe) Delta in 1976–2016. Mar. Geol. 2018, 395, 188–197. [Google Scholar] [CrossRef]
- Wang, K. Evolution of Yellow River Delta Coastline Based on Remote Sensing from 1976 to 2014, China. Chin. Geogr. Sci. 2019, 29, 181–191. [Google Scholar] [CrossRef] [Green Version]
- Liu, Y.; Li, X.; Hou, X. Spatiotemporal Changes to the River Channel and Shoreline of the Yellow River Delta during a 40-Year Period (1976–2017). J. Coast. Res. 2020, 36, 128–138. [Google Scholar] [CrossRef]
- Zhu, Q.T.; Li, P.; Li, Z.H.; Pu, S.X.; Wu, X.; Bi, N.S.; Wang, H.J. Spatiotemporal Changes of Coastline over the Yellow River Delta in the Previous 40 Years with Optical and SAR Remote Sensing. Remote Sens. 2021, 13, 1940. [Google Scholar] [CrossRef]
- Feng, J.; Liang, J.; Li, Q.; Zhang, X.; Yue, Y.; Gao, J. Effect of Hydrological Connectivity on Soil Carbon Storage in the Yellow River Delta Wetlands of China. Chin. Geogr. Sci. 2021, 31, 197–208. [Google Scholar] [CrossRef]
- Yang, Z.; Liu, X.; Guo, L.; Cui, Y.; Su, X.; Ling, X. Soil Classification and Site Variability Analysis Based on CPT—A Case Study in the Yellow River Subaquatic Delta, China. J. Mar. Sci. Eng. 2021, 9, 431. [Google Scholar] [CrossRef]
- Peng, M.; Zhao, C.; Zhang, Q.; Lu, Z.; Bai, L.; Bai, W. Multi-Scale and Multi-Dimensional Time Series InSAR Characterizing of Surface Deformation over Shandong Peninsula, China. Appl. Sci. 2020, 10, 2294. [Google Scholar] [CrossRef] [Green Version]
- Liu, Y.; Liu, J.; Xia, X.; Bi, H.; Huang, H.; Ding, R.; Zhao, L. Land subsidence of the Yellow River Delta in China driven by river sediment compaction. Sci. Total Environ. 2021, 750, 142165. [Google Scholar] [CrossRef]
- Chen, J.; Wang, S.; Mao, Z. Monitoring wetland changes in Yellow River Delta by remote sensing during 1976–2008. Prog. Geogr. 2011, 30, 585–592. [Google Scholar]
- Zhao, M.; Luo, Q.; Jiang, L.; Wei, M. Stratigraphic sequence and deposition-affected compressibility of fine-grained sediments in the ancient Yellow River Delta during the late Pleistocene and Holocene. KSCE J. Civ. Eng. 2019, 23, 90–109. [Google Scholar] [CrossRef]
- Konlechner, T.M.; Kennedy, D.M.; O’Grady, J.J.; Leach, C.; Ranasinghe, R.; Carvalho, R.C.; Luijendijk, A.P.; McInnes, K.L.; Ierodiaconou, D. Mapping spatial variability in shoreline change hotspots from satellite data; a case study in southeast Australia. Estuar. Coast. Shelf Sci. 2020, 246, 107018. [Google Scholar] [CrossRef]
- Castelle, B.; Masselink, G.; Scott, T.; Stokes, C.; Konstantinou, A.; Marieu, V.; Bujan, S. Satellite-derived shoreline detection at a high-energy meso-macrotidal beach. Geomorphology 2021, 383, 107707. [Google Scholar] [CrossRef]
- Ghosh, M.; Kumar, L.; Roy, C. Monitoring the coastline change of Hatiya Island in Bangladesh using remote sensing techniques. ISPRS J. Photogramm. Remote Sens. 2015, 101, 137–144. [Google Scholar] [CrossRef]
- Deng, J.; Harff, J.; Giza, A.; Hartleib, J.; Dudzińska-Nowak, J.; Bobertz, B.; Furmańczyk, K.; Zölitz, R. Reconstruction of Coastline Changes by the Comparisons of Historical Maps at the Pomeranian Bay, Southern Baltic Sea. In Coastline Changes of the Baltic Sea from South to East; Springer International Publishing: Berlin/Heidelberg, Germany, 2017; pp. 271–287. [Google Scholar]
- Wu, X.; Bi, N.; Xu, J.; Nittrouer, J.A.; Yang, Z.; Saito, Y.; Wang, H. Stepwise morphological evolution of the active Yellow River (Huanghe) delta lobe (1976–2013): Dominant roles of riverine discharge and sediment grain size. Geomorphology 2017, 292, 115–127. [Google Scholar] [CrossRef]
- Fan, Y.; Chen, S.; Zhao, B.; Pan, S.; Jiang, C.; Jia, H. Shoreline dynamics of the active Yellow River delta since the implementation of Water-Sediment Regulation Scheme: A remote-sensing and statistics-based approach. Estuar. Coast. Shelf Sci. 2018, 200, 406–419. [Google Scholar] [CrossRef]
- Yu, X.; Zhang, Z.; Xue, Z.; Wu, H.; Zhang, H. Effects of Tidal Channels and Roads on Landscape Dynamic Distribution in the Yellow River Delta, China. Chin. Geogr. Sci. 2020, 30, 170–179. [Google Scholar] [CrossRef] [Green Version]
- Cong, P.; Chen, K.; Qu, L.; Han, J. Dynamic Changes in the Wetland Landscape Pattern of the Yellow River Delta from 1976 to 2016 Based on Satellite Data. Chin. Geogr. Sci. 2019, 29, 372–381. [Google Scholar] [CrossRef] [Green Version]


Publisher’s Note: MDPI stays neutral with regard to jurisdictional claims in published maps and institutional affiliations. |
© 2021 by the authors. Licensee MDPI, Basel, Switzerland. This article is an open access article distributed under the terms and conditions of the Creative Commons Attribution (CC BY) license (https://creativecommons.org/licenses/by/4.0/).