Abstract
In this study we present and discuss gravity and ground deformation variations, at different time scales, observed in a wide mesh absolute gravity and GNSS network set up in central Italy. The network was installed in the area affected by the 2009 (L’Aquila; Mw 6.1) and 2016 (Amatrice-Norcia; Mw 6.0 and 6.5) seismic activity, in order to verify if gravity and ground deformation variations could be related to seismic effects. The new network includes 5 stations distributed between the Lazio, Umbria, and Abruzzo regions. From 2018 to 2020 three campaigns were carried out using the transportable Micro-g LaCoste FG5#238 and the portable Micro-g LaCoste A10#39 absolute gravimeters and completed with two simultaneous GNSS measurements. Topographic instruments, measurement and analysis techniques enabling accurate measurements in the positioning of the stations and to control their variations over time were applied. The high reliability and accuracy of the absolute gravity data gathered, after being corrected for known effects, showed a negative short-term (2018–2020) pattern throughout the area, up to −30 µGal. Since some stations of the new network coincided with benchmarks already measured in the past, an analysis of long-term gravity changes was carried out and a fair degree of stability was observed in two stations, while positive large variations, of approximately 70 and 157 µGal, were recorded in the other two stations in the time intervals 1954–2020 and 2005–2010, respectively. On the other hand, variations highlighted by GNSS height measurements were all below 3 cm. Here, the first long-lasting gravity measurements carried out with absolute gravimeters in a seismic area in Italy are presented, providing meaningful geophysical information. The obtained results, in terms of availability of a combined absolute gravity and GNSS network, definition of data acquisition and analysis procedures, as well as creation of a high quality data archive, lay the foundations for a multidisciplinary approach towards improving the knowledge of this seismogenetic area of Italy.
1. Introduction
Knowledge of the gravity field has a wide range of applications in the geosciences. The measurement of time-variable gravity is a powerful approach for the detection of space/time variations in underground mass distributions, such as those related to seismic crustal deformations, volcanic dynamics/eruptions, and water transfer. Gravity changes associated with all these processes occur over a wide range of time scales, from minutes to years, and with different amplitudes.
Gravity and physical height are closely connected to the gravity potential of the Earth’s gravity field. Absolute gravimetry provides accurate starting values for gravity surveys, and GNSS allows estimation of precise point positioning on the Earth’s surface. Crustal deformation data, obtained through different geodetic methods, are often used in conjunction with gravity data, enabling the separation of different contributions from the same sources and thus providing more complete information of the phenomena (e.g., [1,2,3]).
The technical development of transportable absolute gravimeters has increased the accuracy of gravity measurements to the microGals level (1 µGal = 1 × 10⁻⁸ m/s2) [4], and the development of several permanent GNSS networks has significantly improved the determination of coordinates of points located on the Earth’s surface. Consequently, it is now possible to study the related geophysical processes (i.e., ongoing deformations and/or mass transfer of different origin acting over very different temporal scales) with finer accuracy, as well as their evolution over time.
In geodynamical active areas, the main contributions to gravity changes are induced by episodic events due to volcanoes and earthquakes that individually can affect the gravity field, generally within several to hundreds of microGals. However, since these events often recur over time, their effects can accumulate significantly.
In Italy, gravimetry is not widely applied in seismic areas, where the mobilization of fluids and fluid flow rates differ during different periods of the seismic cycle (inter-seismic, pre-seismic, co-seismic, and post-seismic), and in particular as a function of the tectonic style [5,6].
During an earthquake, the abrupt frictional sliding along a part of the fault zone causes co-seismic deformations and mass displacements. Consequently, the gravity field may change due to the compression/dilation of the rocks around the fault causing both density variation and vertical displacement of the observed points (positive and negative, following the tectonic style of the fault). It is probable that horizontal deformations could account for negligible effects on the gravity field, depending on eventual density variations. Therefore, in this paper, we consider the analysis of data to detect local horizontal deformations between the epochs of two surveys to be of little use, focusing our attention instead on the vertical component only which remains insensitive to plate motion.
The occurrence of the seismic events in L’Aquila (2009 Mw 6.1) and then in Amatrice-Norcia (2016 Mw 6.0 and 6.5) has highlighted the normal fault style related to the extensional tectonic environment of the central Apennines, where geological studies have identified several NW-SE trending normal fault systems [7,8]. It has been recognized that these kinds of earthquake occur in favor of gravity and therefore the deformation pattern can also be affected by additional gravitational collapse of the hanging wall [9].
Moreover, the study of medium-long-term gravity and ground deformation variations, related to post-seismic effects, observed through highly reliable and accurate data, could provide a more complete picture of the phenomena relating to seismic cycles in this critical area. This implies the need to implement joint gravimetric/GNSS networks [10] to begin studying such phenomena.
To this end, the Istituto Nazionale di Geofisica e Vulcanologia (INGV) funded two projects in 2018 and 2019 within the Calls “Ricerca Libera” entitled, respectively, “Feasibility of an absolute gravity network in central Italy: toward a multi-disciplinary approach to natural risk assessment”, and “Consolidation and development of an absolute gravity and GNSS network in central Italy to improve the multi-disciplinary approach to natural risks assessment”, aimed at studying and monitoring natural risks in central Italy. The projects sought to detect gravity variations and ground deformations, over different timescales, possibly associated with the post-seismic relaxation affecting the area where the seismic events of L’Aquila (2009) and Amatrice-Norcia (2016) took place. During the projects, a combined absolute gravity and GNSS network, including five stations, was installed and monitored, with the intention of expanding it over time. The main goal was to lay the foundation for the verification of short-medium-long-term gravity and ground deformation variations related to post-seismic relaxation as a result of the vertical deformation of the Earth’s surface and/or of the internal boundaries separating layers at depth with different densities.
This paper focuses on the results of three joint absolute gravity and GNSS field surveys, describing the procedures adopted to obtain the results. We are confident that this work, both in terms of obtained results and the availability of the field network, has the potential to become a benchmark for the scientific community working in the field of gravity applications and related sciences, for the study of this area of Italy. We are also confident that the information reported in this paper will be useful for enabling application of the same method to study areas with similar characteristics worldwide.
2. State-of-the-Art of Combined Gravity/GNSS Network in Central Italy
Absolute gravimetric measurements in Italy started in the 1970s when a transportable ballistic absolute gravimeter (IMGC) was developed by the Istituto di Metrologia “Gustavo Colonnetti” (IMGC) of CNR (presently, Istituto Nazionale di Ricerca Metrologica—INRiM, Turin) (e.g., [11]), which has undergone a series of upgrades to today. In 2005, this instrument was officially recognized as the “national primary standard” absolute gravimeter in Italy [12]. Several absolute gravity stations have been established to date for a number of purposes, including provision of:
- (a)
- a calibration line for relative gravimeters [13],
- (b)
- reference Italian gravity networks (e.g., [14,15,16,17]),
- (c)
- networks for monitoring active and quiescent volcanoes in Italy (in the Neapolitan and Sicilian areas, and Colli Albani (Rome) (e.g., [12,13,18,19,20,21,22,23]), and
- (d)
- networks to investigate gas storage fields and areas affected by subsidence phenomena [24].
In 2018 and 2019, under the auspices of the two highlighted projects, an absolute gravity and GNSS network (Figure 1) was established, including the following five stations [10,25,26]:
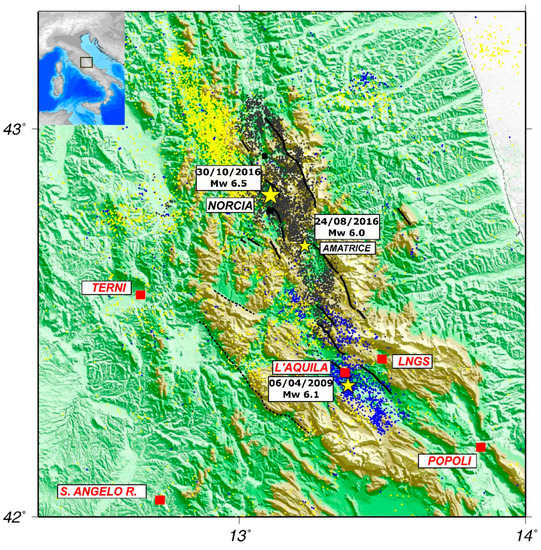
Figure 1.
Sketch map of central Italy showing the absolute gravity/GNSS network, including five stations (squares and labels in red), measured in 2018 (date of installation), 2019, and 2020. The epicenters of seismic events with Mw ≥ 6.0 (yellow stars) and the background seismicity from INGV databank (M ≥ 2.5, max depth 30 km), for the periods 1 January 1985–31 December 2008 (yellow dots), 1 January 2009–23 August 2016 (blue dots), and 24 August 2016–3 January 2019 (black dots), are also indicated.
- (1)
- Sant’Angelo Romano (Province of Rome—Lazio Region—SARO).
- (2)
- Popoli (Province of Pescara—Abruzzo Region—POPL).
- (3)
- L’Aquila (Province of L’Aquila—Abruzzo Region—AQUIg).
- (4)
- INFN Gran Sasso National Laboratory Offices Building (Province of L’Aquila—Abruzzo Region—LNGSEXT).
- (5)
- Terni (Province of Terni—Umbria Region—TERN).
These stations were selected based on the best geometry of the network in order to optimize the distribution over a large territory, enhancing the interpretation of the phenomena. An important constraint in the choice of sites was to identify closed and secure structures to house the absolute gravimeters and provide the main electricity source to power the instruments. In addition, particular attention was given to assessing their possible re-use, reliability, and low level of noise, to ensure measurements with high precision and accuracy. Two stations (Popoli and Terni) were also selected because they are old gravity stations that were monitored in 1954 during a gravity survey in Marche and Abruzzo [27]. They were later included as primary nodes in the 1955 fundamental Italian gravity network, known as the “RFI55-Cunietti and Inghilleri Network” [28], and in the 1977 first-order gravity net in Italy (FOGN77) [14]. The stations in Sant’Angelo Romano and LNGSEXT were chosen since they were pre-existing sites, set up in 2005 [20,29] and 2010 [19], respectively. This has enabled estimation of long-term gravity changes as all these stations have remained unchanged over time.
The aim of GNSS measurements is twofold: the first is to determine with centimetric accuracy the coordinates and the height of each gravimetric site; the second is to control for the occurrence of significant deformations between the epochs of gravimetric measurements.
The GNSS reference sites SARO, POPL, and TERN were set up outside the buildings hosting the absolute gravimeters. At L’Aquila, only topographic measurements, aimed at assessing the height of the gravimetric station, were carried out, since a permanent GNSS station (AQUI) is located on the roof-top terrace of the science faculty and positioned vertically with respect to the gravimetric station (AQUIg) which is located four floors below [30]. AQUI belongs to the EUREF GNSS network and its coordinates and velocity components were obtained after the processing of longtime series of daily observations [6]. An additional GNSS station located at LNGSEXT, managed by INFN, was also considered. This station operated for several years across the L’Aquila earthquake period, within the neutrino baseline project.
Each site has been mapped considering the geographic location of the site and of the station, as well as its exact position and orientation, and how the instruments were placed on the ground. All this information is reported as schematic monographs in [25].
To date, the joint absolute gravity and GNSS network installed in central Italy in 2018 is the only one that exists aimed at monitoring the dynamics of the main tectonic processes in the area affected by the recent seismic activity.
3. Absolute Gravity and GNSS/Topographic Instruments and Working Procedures
For both gravity and GNSS sites, no dedicated pillars were produced for the measurements; the instruments were positioned directly on the floor/ground, avoiding sources of noise and unstable conditions.
The absolute gravity measurements were performed with two absolute gravimeters available at INGV: the transportable Micro-g LaCoste FG5#238 (owned by Eni S.P.A., loan for use and managed by INGV-OE) and the portable Micro-g LaCoste A10#39 (owned and managed by INGV-OV). The first was designed for measurements in the laboratory or in indoor sites with laboratory-like conditions. The FG5 is, in general, not well-suited for portable use in the field, since it is large and heavy (the system weighs approximately 300 kg and requires about 3 m2 floor space), needs to be powered by AC, has a limited operating temperature range (10 to 30 °C), and requires facilities to house the instrumentation. Nevertheless, in several studies the FG5 instrument has been used outdoors, for example, it has been used on active volcanoes (e.g., [21,31,32,33], but in this case particular attention was paid to ensuring that the site was protected and safe, and that there was a suitable power supply. The A10 absolute gravimeter is purpose-designed for field measurements (indoor and outdoor) and fast field operations, while retaining the characteristics of a laboratory instrument. Both instruments work using a ballistic free-fall method. A test mass (retro-reflective corner cube) is dropped vertically by a mechanical device (drug-free cart) inside a vacuum dropping chamber; the vacuum is maintained by ion pumps that run continuously (one in FG5 and two in A10). The absolute g value is measured through the reconstructed trajectory of the dropping mass subjected to the gravity field. A laser interferometer generates optical interference fringes as the test mass falls. The fringes are counted and timed with an atomic clock to obtain precise time and distance pairs. These data are fitted to a parabolic trajectory to give a measured value of g [34]. Dedicated software undertakes the automatic data acquisition, the real time processing, and the automatic data storage. It also automatically corrects the measured g value for gravity changes due to solid-earth tides, ocean tide loadings, polar motion, and local air pressure changes. In addition, it enables the reprocessing of data and, if necessary, reduces the g values automatically from the measured heights at any convenient height from the ground, through the measured local value of the vertical gravity gradient.
The instrumental accuracy of the FG5 is about 1–2 µGal [34]; the precision is time-dependent and is given by the drop-drop scatter (single-drop scatter) divided by the square-root of the number of drops. A precision of 1 µGal or better can be achieved at most sites, if the FG5 is running continuously for several hours.
Regarding the A10 gravimeter, in laboratory conditions it can be used like an FG5; in field surveys, to obtain reliable values of g, it needs session lengths from 0.5 to 1.5 h. The precision is 10 μGal in 10 min and the repeatability is within 10 μGal. Although the accuracy and precision of the A10 is less than that of the FG5, there are some characteristics, such as portability and ease of operation in outdoor applications, which make it a desirable instrument in absolute gravimetric field surveys.
Due to the different instrumental design of the FG5 and the A10, their measured g-values refer to different heights from the ground. The FG5 refers to a measurable variable height of about 1.3 m; the A10 refers to a constant height of 0.72 m. Therefore, to compare the g values collected by the two instruments, we referred all the measurements to common heights (see next sections).
During the first campaign (June 2018), in addition to the absolute gravity measurements, the determination of the local vertical gradient of gravity at each absolute station was achieved using the LaCoste & Romberg model D s.n. 85 (LCR-D#85) relative gravimeter. Furthermore, in order to “transport” the absolute g values outside and close to the buildings hosting the absolute gravity stations, outdoor satellite gravimetric sites were also established using the same relative gravimeter. The presence of the satellite gravimetric sites is important in order to perform rapid links during any relative gravimetric field survey that need to be linked to the absolute gravity value.
The measure of the vertical gradient was carried out at four heights from the ground, along the vertical of the absolute point using two overlapping tripods, positioned on a specially constructed base consisting of three arms. Heights of measurement were the ground, at fixed 50 and 80 cm, and at a variable height of about 1.2–1.3 m. At each height at least three or four gravity measurements were taken in a random way or by means of a constrained most-appropriate sequential procedure to obtain high quality data (e.g., [35]). Each measurement derived from the average of at least three or four readings. The readings were corrected for the effects of solid-earth tides, air pressure and polar motion, and for the variation in height of the instrument with respect to the support every time it was moved from one point to another. The effect of the instrumental drift to which the gravimeter was subject, if present, was eliminated from the correct readings. This procedure was also followed for relative links between absolute and satellite stations.
Heights of the indoor absolute gravity points at SARO, POPL, and TERN were determined connecting the outdoor GNSS sites and the indoor points through a classic topographic survey using an optical level station (Leica). The GNSS measurements on these three non-permanent sites were carried out with a Leica GX1230 receiver and a LEIAX1202 antenna. For the lower required accuracy, we took as planimetric coordinates of the gravity points, the planimetric coordinates of the nearest GNSS site.
At L’Aquila, a total station (STONEX R2–2 plus) was used to measure the height difference between the permanent GNSS station (AQUI) on the roof-top terrace of the science faculty and the gravimetric station (AQUIg). The classic survey was carried out on 5 April 2019, in co-operation with the Dipartimento di Ingegneria Civile, Edile e Ambientale (DICEA) of the Sapienza University of Rome [30].
4. Results of the A10#39 and FG5#238 Inter-Comparison Versus IMGC Gravimeter
Both FG5#238 and A10#39 have been, directly or indirectly, compared with the absolute gravimeter IMGC-02, which is the Italian national primary standard [12].
The FG5#238 has been compared with IMGC-02 at the INRiM gravity laboratory in 2011, during several contemporary field surveys on Etna at two stations in 2009 and during several CIPM key comparisons [36,37,38,39]. The results indicated that there was no large discrepancy between the two instruments, since the measured differences were between −4.0 and +8.3 µGal [22], within the standard uncertainty. We can therefore state that the mutual conversion factor between FG5#238 and IMGC−02 is practically 1.0.
As regards the A10#39, it has been compared with the IMGC-02 directly at the INRiM laboratories in Turin. The comparison was carried out from 4 to 6 December 2018, and measurements were collected at the two main reference sites in the Dynamometric Building (i.e., INRiM1 at the Gravity Laboratory at −3 m below the ground level and INRiM2 at the Hydraulic Press Laboratory at ground level) on dedicated pillars. Measurements were also carried out at 3 additional points (“A”, “B”, and “C”) at the Force Laboratory (Bray Edifice), at different levels of the building (from ground level to approximately −9 m) directly on the concrete floor; only the point “A” was on the concrete floor covered with linoleum tiles. Moreover, an additional point “D” was set up in the Force Laboratory close to the point “B” on the upper level; it was never measured with the IMGC-02 instrument and therefore comparison is not possible at this point. At the same time, the measurements of the vertical gravity gradient were carried out at the two main sites and at one point in the Force Laboratory (point “A” at the ground level).
Unfortunately, it was not possible to carry out contemporary measurements with both instruments since IMGC-02 was not working at the time of measurements with A10#39. Therefore, the comparison was made using previous IMGC-02 measurements collected from 2005 to 2015 since coeval survey at all sites with IMGC-02 was not available.
With the A10#39, a long-field survey (1 h) was carried out at each point and 20 sets, including 120 drops, were collected. At the main point INRiM1, in the Gravity Laboratory, two 13-hours-long, laboratory-like measurements were carried out during the night; 28 sets (each pair of red and blue sets at an interval of 1 h) with 120 drops, were collected.
In general, the A10#39 showed values of g lower than that of IMGC-02, ranging from −29 (point INRiM2) to −35 (points INRM1, A and B) µGal, apart from at the site “C” in the Force Laboratory where the difference was positive (+17 µGal). The comparison was performed after the A10#39 value was reported to the IMGC-02 height of measure, using the value of the measured vertical gradient for each station. However, the value of A10#39 measured at the main point INRiM2 was very close (within the uncertainty; −9 µGal) to that measured at the same site with the GBT absolute gravimeter of the Ukraine National Scientific Center “Institute of Metrology” (NSC “IM”), carried out in December 2015 and reported to the IMGC-02 height.
Figure 2a shows the difference between IMGC-02 and A10#39 measurements at all the stations measured at the INRiM laboratories, while Figure 2b shows the difference between A10#39 and IMGC-02 at each station versus their heights with respect to the ground level; the results for the GBT instruments are also shown in both figures.
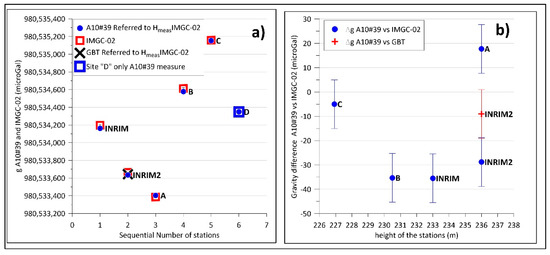
Figure 2.
(a) gravity difference between A10#39 and IMGC-02 gravimeters at the 5 stations at the INRiM Laboratories. The value at the new station “D” and that measured with the GBT gravimeter at the INRIM2 point are also shown. Error bars are within the symbols size; (b) gravity differences between A10#39 and IMGC-02 values, all referred to the same height of IMGC-02 measure, at the 5 stations. The difference A10#39 versus GBT is also shown.
In order to compute an admittance factor to convert the A10#39 into IMGC-02 data, a linear regression between the respective values was computed (Figure 3; left panel). It indicated that the conversion value for A10#39 to IMGC-02 was 1.0077 ± 0.02, with a correlation coefficient of 0.99, over a range of 2 mGal (2000 µGal).
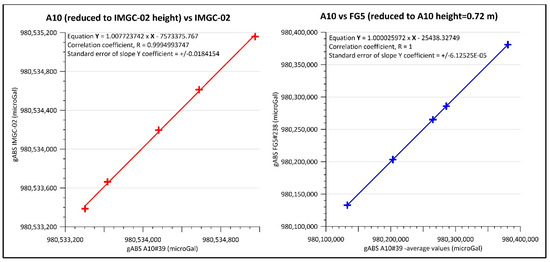
Figure 3.
(Left): Linear regression between A10#39 and IMGC02 gravity values at the 5 measured stations at the INRiM laboratories over a gravity excursion of approximately 2 mGal (2000 µGal). The comparison was performed reducing the average A10#39 values to the measurement heights of IMGC-02; (Right): Linear regression between A10#39 and FG5#238 gravity values at the 5 measured stations of central Italy network over a gravity excursion of approximately 250 mGal (250,000 µGal). Error bars are within the symbols size.
As for IMGC-02, to compare the A10#39 with the FG5#238, a linear regression between the values of g measured with both instruments in central Italy was computed (Figure 3; right panel). It indicated that the conversion value for A10#39 to FG5#238 was 1.000 ± 6 × 10⁻⁵, with a correlation coefficient of 1, over a range of 250 mGal (250,000 µGal). However, the large range could have distorted the conversion factor, the discrepancy being observed ranging from −7 to −40 µGal, namely the 1.6 × 10⁴ component of the gravity range. Therefore, we sought to compare A10#39 and FG#238 meters separately for each station considering only the microGal part of the absolute values (i.e., subtracting by the measured values the common part 980XXX000), and for A10#39 considering all the measurements. In this way, we computed a global general conversion factor, on a gravity range of only 800–850 μGal, with a result of 1.042 ± 0.008, with a correlation coefficient of 0.99 (Figure 4).
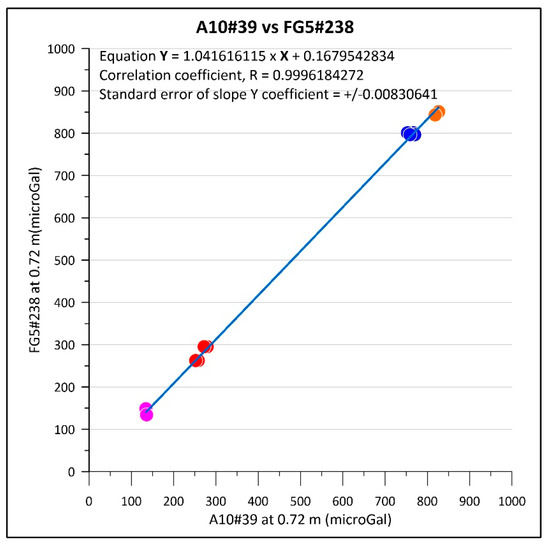
Figure 4.
Linear regression between A10#39 and FG5#238 gravity values at the 5 measured stations of central Italy network over a gravity excursion of approximately 0.850 mGal (850 µGal). The used values are only the microGal part, obtained after subtracting at each station and from each single measure the common part (i.e., 980XXX000 μGal—see details in the text). Error bars are within the symbols size.
Finally, a direct comparison between A10#39 and FG5#238 gravimeters was undertaken at the Vesuvius Observatory Old Building (OVOB) in October 2020, where the absolute value has been periodically measured since 1986. The OVOB station proved to be a very good location, highly suitable for absolute measurements, since the measurement point was positioned on a concrete and insulated pillar. In Table 1 the values at the measured height, reduced at the common height 0.72 m, and to the ground, for both instruments, are reported; in Table 1 the last measurements carried out in 2019 with A10#39 are also indicated. A discrepancy between the two instruments of −31 µGal was found, equivalent to those observed at the stations in central Italy (see next Sections).

Table 1.
Absolute gravity measurements collected at the station Osservatorio Vesuviano Old Building station (OVOB) from October 2019 to October 2020 by FG5#238 and A10#39 absolute ballistic gravimeters. The combined uncertainty δtot associated to the g values are also reported.
We can conclude that values measured by A10#39 were lower in all instances than those of FG5#238 and IMGC-02 by approximately 30 µGal; this discrepancy may be adjusted using the above calculated correlation factor.
5. Data Acquisition and Uncertainty Calculation
The combined gravity/GNSS network in central Italy was measured three times from 2018 to 2020.
During the first survey absolute gravity measurements were carried out using only the FG5#238 meter; all complementary relative measurements were performed as previously stated. In the following two campaigns, in October 2018, and at the end of September/beginning of October 2020, absolute gravity measurements were carried out using both FG5#238 and A10#39 gravimeters. The period selected to carry out the campaigns was chosen because this period has the most stable atmospheric conditions; during all the measurement sessions the environmental parameters were sufficiently stable at all the sites, allowing the acquisition of high-quality gravity data.
In all the surveys, FG5#238 operated during the late afternoon and the night, when the noise due to human activity was minimal. A total of 14 or 17 sets, each with 100 drops, were collected at each station. On the other hand, with the A10#39, capable of measuring in field conditions, the measurements were almost all performed during the day, choosing the long-field survey procedure (1 h long) with a total of 20 sets each with 120 drops. Measurements with A10#39 in the SARO and AQUIg stations were also collected following the long-laboratory procedure (14 h during the late afternoon and the night), with a total of 28 sets each with 120 drops. All the repeated measurements with A10#39, during the same survey, differ within the declared repeatability (±10 µGal).
In LNGSext, A10#39 was operated following the short-field procedure (half an hour with a total of 8 sets each with 120 drops). Details of measurements and sites are given in Tables 4–8. For both instruments, data were reduced for known effects (e.g., tides, atmosphere, oceanic loading, and polar motion), and referred to a given height using the measured local value of the vertical gradient of gravity. The effects of atmospheric mass variations at each station were corrected using the barometric admittance factor of −0.3 µGal/hPa and the difference between the measured and the nominal atmospheric pressure, depending on the elevation of the station [40]. During the acquisition, for every data set the standard deviation σ was calculated, rejecting any drop beyond the 3σ range.
The g values acquired with the two instruments, corrected for the above effects, have been associated with a combined uncertainty δtot calculated as follows:
where δstat is the statistical uncertainty given by the set scatter (standard deviation) divided by the square root of the number of sets:
and Σsys is the sum of the estimated uncertainties for many different components of the measurement: (i) modelling of geophysical processes (i.e., barometric, polar motion, earth tide, ocean loading); (ii) system (laser, clock, and system models); (iii) environmental (highly site dependent); (iv) set-up (depending on both the instrument and the operator), and gradient (if applied).
δtot = √(Σ2sys + δ2stat)
δstat = σset/√Nset
For both instruments, we considered 3.34 µGal as the best representative value of the sum of all these contributions. In this value, the estimated uncertainty for the gradient is not considered because this reduction is later applied in a non-automatic way, and the related uncertainty is calculated as a function of the error on the measured local vertical gravity gradient. This also provides freedom to reduce the measured g value at one or more convenient heights.
We compared the g values collected by the two instruments to common heights of 0.72 m, corresponding to the A10#39 measurement height and to the ground.
The combined uncertainty of g, when the value is transferred to a different height from the measurement, using the local value of the vertical gradient of gravity, is given by:
where:
Δh (m) is the height difference between the height where the measurement was made (measure height) and the height at which the g value must be reduced (e.g., ground, transferred height); is the error on the vertical gravity gradient measurement (µGal) and is the combined uncertainty (µGal) of the g value, estimated as stated before.
The two GNSS surveys on the non-permanent sites were carried out in June 2018 and in October 2020, recording continuously for approximately 45 h at 30 s sampling rate, one survey for each campaign. Due to limited satellite visibility, we repeated a measurement session of 49 h again at POPL in November 2020.
Data were processed in precise point positioning (PPP) modality, making use of the CSRS-PPP service of Natural Resources Canada (NRCan), an online application for GNSS data post-processing. This modality uses precise satellite orbit, clock, and bias corrections derived from a global network of receivers to determine accurate user positions anywhere on the globe. It is possible to submit observations in Receiver INdependent Exchange (RINEX) format or as compressed files and recover enhanced positioning precisions in the International Terrestrial Reference Frame, currently ITRF14 [41].
The GNSS observations of AQUI permanent station were included within the routine analysis performed at INGV to estimate the coordinates time series on the local tangent plane (Up, East, and North) of a large network in Italy, including more than 1000 continuous GNSS stations [6].
6. Results of Measurements
6.1. GNSS
Table 2 shows the coordinates, the geoidal undulations, the ellipsoidal heights with uncertainties at 95% confidence level, and the orthometric heights computed for the GNSS sites making use of the knowledge of the geoid model of the Italian area [42]. Note that the ellipsoidal height differences between the two surveys are well within the corresponding uncertainties, so that no significant vertical deformations are detected in the time interval between surveys.
Table 2.
GNSS sites: coordinates, geoidal undulations, measured ellipsoidal heights, with accuracies and orthometric heights of the 2018 and 2020 surveys.
Finally, the measured height differences (Δh) between gravity and GNSS sites and the computed orthometric heights of the indoor absolute, and the outdoor auxiliary gravity sites, at the time of gravity measurements, are shown in Table 3. The geoidal undulations were the same as for Table 2, due to the closeness of GNSS and gravimetric sites. The coordinates and the orthometric heights were useful to post-process the absolute gravity data and to refer all the gravity measurements presented in this work to the equipotential surface of the gravity field.
Table 3.
Coordinates, measured height differences between GNSS sites, and indoor (abs.) plus satellite (sat.) gravity sites in 2018 and 2020. The orthometric heights of the gravimetric sites are computed applying Δh to the orthometric height of GNSS sites (Table 2). The monograph of each point is available in [25].
6.2. Absolute Gravity Measurements
In the following sub-paragraph, for each station, we provide information about the gravity measurements. Measured gravity values at different heights and related necessary information are summarized in Table 4, Table 5, Table 6, Table 7 and Table 8, whose columns show, respectively:
Table 4.
Absolute gravity measurements collected at the Sant’Angelo Romano station (SARO) during June 2018–October 2018 and October 2020 period by FG5#238 and A10#39 absolute ballistic gravimeters. The combined uncertainties δtot associated to the g values are also reported.
Table 5.
Absolute gravity measurements collected at Popoli (POPL) station during June 2018–October 2018 and October 2020 period by FG5#238 and A10#39 absolute ballistic gravimeters. The combined uncertainties δtot associated with the g values are also reported.
Table 6.
Absolute gravity measurements collected at L’Aquila (AQUIg) station during June 2018–October 2018 and October 2020 period by FG5#238 and A10#39 absolute ballistic gravimeters. The combined uncertainties δtot associated with the g values are also reported.
Table 7.
Absolute gravity value collected at INFN Gran Sasso station (LNGSEXT) on 26 September 2018 and 6 October 2020 using the A10#39 absolute gravimeters. The combined uncertainties δtot associated to the g values are also reported.
Table 8.
Absolute gravity measurements collected at Terni station (TERN) during June 2018–October 2018 and October 2020 period by FG5#238 and A10#39 absolute ballistic gravimeters. The combined uncertainties δtot associated with the g values are also reported.
- (a)
- data, measurement time interval in UTC and measured local air pressure in hPA;
- (b)
- the instrument used and the measured height h (elevation above the ground to which g is measured);
- (c)
- the number of sets, drops per sets, and total number of drops for each session;
- (d)
- absolute gravity values at the measured height h with the combined standard uncertainty (see above);
- (e)
- absolute gravity values at the reference height of 0.72 m with the combined uncertainty (see above); and
- (f)
- absolute gravity values on the ground with the combined uncertainty.
In the bottom lines of the tables the value of the locally measured free-air vertical gradient γ and the measured Δg at the satellite gravity station/s with the uncertainties are also reported.
6.2.1. Absolute Gravity Station at Sant’Angelo Romano (SARO)
Sant’Angelo Romano absolute station (SARO) was installed and measured in 2005 and belongs to the gravimetric/deformation network of Colli Albani [20,29]. Measurements at this absolute station were repeated in 2007 and 2010 [19] using the IMGC-02 absolute gravimeter. The station was set up within the conference room of the Orsini-Cesi castle, in Piazza Borghese, located at the top of the village. The GNSS point (Table 3) was placed in front of the entrance of the castle [25].
The final g values collected in the period 2018–2020 at the measured heights, as well as the values reported at different heights, with the associated combined uncertainties, are reported in Table 4. Specifically, in order to compare the g values obtained with both instruments, measurements were referred to the same elevation equal to 0.72 m and to the ground. The comparison of measurements carried out in October 2018 and October 2020 showed a discrepancy of approximately −33 and −40 µGal between A10#39 average values and FG5#238 average values, respectively. The gravity changes collected during the time interval October 2018–October 2020 with both instruments were in good agreement, considering the measurement uncertainties.
Measurements collected with the FG5#238 in June and October 2018 displayed an appreciable gravity decrease of approximately 10 µGal, while only a small decrease of approximately −5 µGal was observed in October 2020, which slightly exceeded the measurement uncertainty.
The results of the measurements collected with the A10#39, when the instrument was used with a different set-up, showed a slight increase of 3.3 µGal, within the measurement uncertainties.
Furthermore, a local vertical gravity gradient of −398.9 ± 4.1 µGal/m and a gravity difference (Δg) of + 22 ± 4 µGal by connecting the indoor absolute station (SARO) and the outdoor satellite station were calculated.
6.2.2. Absolute Gravity Station at Popoli (POPL)
The absolute gravity station at Popoli (POPL) was positioned inside the “Antonio Verna” Day Cultural Center, in Via Guglielmo Marconi 35, in downtown Popoli. The instruments were installed on the concrete base of a room, used as a deposit; the GNSS point (Table 3) was placed in the garden of the building [25].
The final g values measured in the period 2018–2000 at the measured height, as well as at different heights (0.72 m and to the ground), and the associated combined uncertainties, are reported in Table 5.
By comparing the g values collected by the two meters, we found a discrepancy of −14 µGal in October 2018 between the value collected with the A10#39 with respect to the value recorded by the FG5#238, while no significant discrepancy was observed in 2020.
With respect to the gravity variations, measurements collected with the FG5#238 in June and October 2018 showed a small gravity decrease of approximately 2 µGal, within the measurement uncertainties, while a decrease of approximately −15 µGal was observed to October 2020. In contrast, no gravity changes were observed in A10#39 measurements from October 2018 to October 2020.
With respect to the relative measurements, the local vertical gravity gradient showed a value of −238.7 ± 1.7 µGal/m. A gravity difference (Δg) of −324 ± 3 µGal was measured between the indoor absolute station (POPL) and the outdoor satellite station.
Moreover, two additional points located at the Church of S. Francesco, in the Popoli main square, were linked to the absolute station, one of which corresponds to the 1954 old station. The following Δg were measured (Table 5):
IGMI monumented benchmark (at the base of the staircase, left side, leaning against the external wall of the adjoining building) Δg = −269 ± 4 µGal;
The 1954 relative gravity station (on the road, at the base of the sidewalk, in line with the entrance door of the church) Δg = −92 ± 4 µGal.
These sites were linked to the GNSS station by means of levelling measurements, including the IGMI benchmark at the left side of the entrance of the church. This was in order to check the occurrence of height changes over long time.
6.2.3. Absolute Gravity Station in L’Aquila (AQUIg)
The absolute gravity station in L’Aquila (AQUIg) was installed at the science faculty of the L’Aquila University, located in Coppito village, Via Vetoio n. 42 (Table 3). The station was set up on the floor of the geomagnetic laboratory of the physics department [25].
The final g values, at the measured heights and at the referred heights with the associated combined uncertainties, are reported in Table 6.
By comparing the absolute gravity values measured with both instruments over time and referring to the same elevation from the ground, we found a discrepancy of approximately −19.7 µGal between A10#39 and FG5#238 values in October 2018, while a discrepancy of only approximately −7 µGal between the two instruments in October 2020 was found, when three instead of two session measurements (two short-field and one long-laboratory procedures) were carried out with A10#39.
All the repeated values with A10#39 differ within the declared instrumental repeatability for this type of instrument (±10 µGal). Moreover, we encountered a small problem, but only toward the end of the long session of A10#39 measurements, due to the onset of strong wind during the night, which caused a drift in the distribution of the sets in the final phase and then unreliable values; therefore, data were recalculated eliminating the sets assumed to be unreliable.
Regarding gravity variation, the absolute gravity measurements carried out with the FG5#238 in June and October 2018 showed a gravity decrease of −2.7 µGal, within the measurement uncertainties, while a further decrease of approximately −33 µGal was observed to October 2020.
The results of the measurements collected with the A10#39 showed a gravity decrease of approximately—21 µGal from September 2018 to October 2020, or approximately −26 µGal, if the long-laboratory measurements in September 2018 are not considered. This is in good agreement with the gravity decrease measured with FG5#238 over the same time interval.
The AQUIg station was linked to an external satellite station and a gravity difference (Δg) of + 88 ± 3 µGal was found (see Table 3 for the coordinates of the satellite station). A local vertical gravity gradient of −269.6 ± 1.7 µGal/m was recorded.
As noted previously, no GNSS measurements were carried out because a permanent station was located in the same place and was linked to the gravity station.
6.2.4. Gravity Station at INFN Gran Sasso Laboratory (LNGSEXT)
The gravity station at the INFN Gran Sasso Laboratory (LNGSEXT), External Offices, coincided with a relative gravity point installed in 2010 [19] when, following the 2009 earthquake, an absolute gravity measurement was also carried out for the first time at the Town Hall of L’Aquila city. This latter was realized in order to replace a site in the INFN Underground Gran Sasso Laboratory (LNGSUND), planned to belong to the 1995 Zero Order Gravity Network [16], where in 1995 only the vertical gravity gradient was measured since there was no possibility to perform the absolute measurement. Unfortunately, in 2018 the station in the city was not reachable due to the closure of the area for reconstruction work in the zone; therefore, it was replaced with the site AQUIg in L’Aquila University.
In 2010 the LNGSEXT station was linked to the underground station (LNGSUND) and to the satellite gravity points of the Sant’Angelo Romano, Monte Porzio Catone, and Palestrina absolute gravity stations, belonging to the Colli Albani network [20,29], by means of relative measurements [19]. A link with the original 1995 station inside the LNGSUND, was attempted, but it was not accomplished because the site was temporarily not usable; therefore, a new LNGSUND point, just a few meters away from the original one and on a very flat concrete floor, was measured. No gravity changes (only +4 µGal), over the time interval 2010–2018, were detected at the LNGSEXT with respect to LNGSUND.
The new INFN absolute station (LNGSEXT) is located outside the laboratory, where measurements can only be performed with field gravimeters. With the A10#39, half hour measurement sessions were carried out. The final g values with the associated combined uncertainty are reported in Table 7. A gravity decrease of approximately −23 µGal was detected from 2018 to 2020; this is of the same amplitude as the gravity decrease detected at the AQUIg station by A10#39. No GNSS measurements were carried out at this site during the gravimetric survey.
6.2.5. Absolute Gravity Station at Terni (TERN)
The absolute gravity station in Terni (TERN) was placed within the Officina Motori n. 4 of the Istituto Omnicomprensivo IPSAI “Sandro Pertini”, Viale Benedetto Brin, 32 in the city of Terni. The GNSS point was placed in the area of the school; the height of the absolute gravity point inside the Officina Motori n. 4 was obtained by connecting the outdoor and indoor points (Table 3).
The final g values at measured heights and at 0.72 m and to the ground with the associated combined uncertainties are reported in Table 8.
By comparing the values obtained with both instruments, referring to the same elevation from the ground, we found a constant discrepancy of approximately −25 µGal between A10#39 and FG5#238 values in both October 2018 and October 2020.
The gravity data collected with the FG5#238 displayed a small gravity decrease of approximately −8 µGal, during both the time intervals June 2018–October 2018 and October 2018–October 2020; the variation observed during the second period was equivalent to that shown by A10#39 (−8.4 µGal) during the same time interval.
It should be emphasized that the site was influenced by local environmental disturbance, as can be seen from the uncertainty values reported for all the measurements in Table 8.
The TERN absolute station was connected with three satellite stations located in the area of the school; specifically, the points already measured in 1954 and in 1977, and two IGMI benchmarks placed laterally at the edges of the garden at the main entrance. The following Δgs were found:
Δg from abs station to 1954 satellite station “gate Viale Brin” = −10 ± 2 µGal
Δg from abs station to satellite station “IGMI benchmark” (right side, looking at the gate) = −48 ± 3 µGal
Δg from abs station to satellite station “IGMI benchmark” (left side, looking at the gate) = −158 ± 4 µGal.
The results of gravity measurements with both FG5#238 and A10#39 gravimeters reported in the Table 4, Table 5, Table 6, Table 7 and Table 8 at all stations in the period 2018–2020 are shown in Figure 5. The gravity variations observed with both instruments show a coherent decreasing pattern (with the exception of the POPL station), with a maximum variation observed at the AQUIg and LNGS stations. The figure also shows the bias between the values observed with the two instruments, similar to those observed during the comparison in October 2020 at the OVOB station (Figure 5; bottom right panel), as discussed in Section 5.
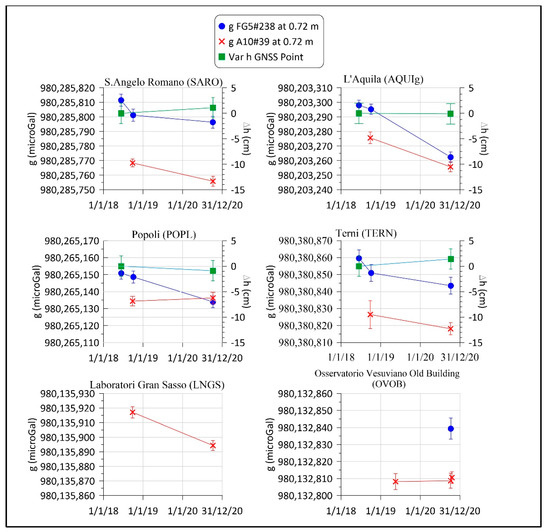
Figure 5.
Gravity changes at the five stations of the network detected through absolute gravity measurements using the FG5#238 and A10#39 gravimeters. The bottom right figure shows the absolute values measured at the historic Osservatorio Vesuviano Old Building (OVOB) in 2019 and 2020 with the A10#39 and in 2020 with the FG5#238; the latter measurements allowed for comparison of the two instruments (see the text for further details).
Figure 5 also shows the height variations detected through the GNSS measurements at the SARO, AQUIg, POPL, and TERN stations during the time interval June 2018–October 2020, indicating that no significant changes occurred throughout the considered period (the observed variations were within a centimeter, comparable with the measurement error).
7. Long-Term Gravity and Height Changes at Some Reoccupied Gravity Stations
Some absolute and/or relative gravity stations, as well as some levelling benchmarks forming the new networks, coincided with benchmarks already measured in the past. Hence, for these stations an attempt to evaluate long-time gravity/elevation change was made.
Firstly, we analysed the gravity changes at the absolute station in Sant’Angelo Romano (SARO; Table 9), set up in 2005 when the link with the external satellite station and the measurements of the local vertical gravity gradient were carried out. Here the absolute value of g was measured again in 2007 and 2010 using the IMGC-02 absolute gravimeter (Figure 6—full blue points).
Table 9.
Repeated absolute gravity measurements collected at S. Angelo Romano (SARO) station from 2005 to 2020.
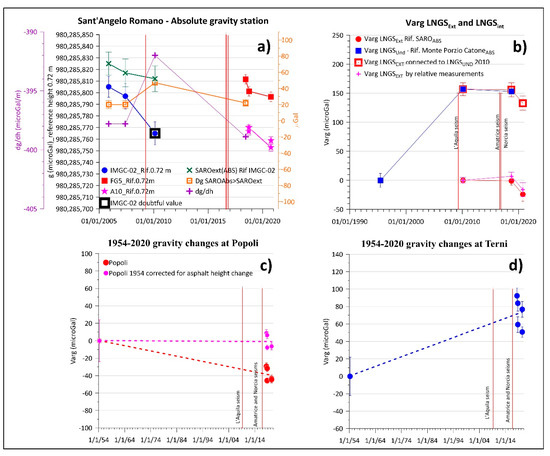
Figure 6.
(a) Long term gravity changes at the absolute station Sant’Angelo Romano (SARO) from 2005 to 2020 measured with the IMGC-02, FG5#238, and A10#39 absolute gravimeters. (b) Gravity changes over 1995–2010 and 2010–2020 at LNGSUND and LNGSEXT. (c,d) Long term gravity changes from 1954 to 2020 at the two 1954 satellite stations in Popoli and Terni, respectively; for Popoli the trend correcting the 1954 value of the elevation change due to the correction for the asphalt height change (pink symbols) is also shown (see text for details). The vertical red lines in each figure mark the time of occurrence of the L’Aquila, Amatrice, and Norcia seismic events with magnitude Mw ≥ 6.0.
The 2010 value at SARO was affected by a large error due to adverse weather conditions during the measurement period; both the value of the vertical gravity gradient and the Δg between the absolute and the satellite station showed a different value even when the final g value at the satellite station did not change (Figure 6a and Table 9). This suggests that the 2010 IMGC-02 value is very doubtful. However, the observation on the satellite station, as well as an additional check on the IMGC-02 original data, point to the goodness of the absolute value, and also imply that it was biased by a very local effect.
The FG5#238 and A10#39 measurements were comparable with that measured with the IMGC-02 in 2005 and 2007 (Figure 6a, taking into account the bias between the values observed with the two instruments discussed in Section 4). This result, together with what was observed at the satellite station, suggests long-term stability of the SARO station, and confirms that the 2010 IMGC-02 value was feasibly affected by an accidental local effect.
The trend of the gravity changes over the 2005–2020 period at SARO is shown in Figure 6a. Here the absolute value at the satellite station over the 2005–2010 period, the gravity differences from the absolute station to the satellite one, and the value of the measured local vertical gravity gradient from 2005 to 2018, are also shown (Figure 6a).
We also attempted to calculate the gravity changes at the LNGSext point, from 2010 to 2020, integrating relative and absolute measurements. As already mentioned, this station was established in 2010 and was linked to the satellite stations of the absolute gravity points belonging to the Colli Albani network.
The gravity variation was calculated considering the Δg measured in 2010 and 2018 through the absolute values collected with the IMGC-02 (recalculated at 0.72 m) and A10#39 at SARO and with A10#39 at LNGSEXT. The gravity variations for the period 2018–2020 were computed using data collected with A10#39 at LNGSEXT.
The analyses carried out indicated that no significant gravity changes occurred in the period 2010–2018 at LNGSEXT with respect to SARO, confirming the results obtained by relative measurements, while a decrease of −23 µGal occurred in the period 2018–2020, as discussed in Section 6.2.4 (Figure 6b). In the same interval 2010–2018 in the LNGSUND no significant gravity changes were observed. In contrast to the latter, a large gravity increase of +157 µGal, as recalculated by [19], was observed compared to 1995 considered with reference to the absolute station of Monte Porzio Catone, also belonging to the Colli Albani Network. This variation probably started before 2010, as suggested by the stability of the absolute value at SARO, and by relative measurements between SARO and Monte Porzio Catone from 2006 to 2010. However, it is worth noting that it is not possible to define the exact time of occurrence nor the real amplitude of the variation. Furthermore, the measured gravity increase could not be entirely linked to the 2009 earthquake at L’Aquila for certain but, at least in part, it plausibly reflects pre- and co-seismic effects.
We also sought to compute very long-term changes at the 1954 satellite stations in Popoli and Terni, whose original values were corrected in 1955 for the so-called “Potsdam error” (approximately −14 mGal) [15], in order to be included in the 1955 new Italian Reference Network [28] and subsequently in the FOGN77 Italian Reference Network [14]. For the comparison with the most recent measurements, we used the values corrected in 1955 for the Potsdam error. For Popoli, we noticed that the height of the asphalt of the road was higher than that of 1954 as reported in the old monographs, i.e., in 2018 the road level was the same as the 1954 sidewalk (unchanged until today). Therefore, in accordance with the Italian highway code (D.M. 05/11/2001 and D.M. 19/4/2006), for which the height of the sidewalk cannot be greater than 15 cm, the gravity value in Popoli was also corrected for this variation. The corresponding gravity effect was computed considering a plate of 1300 kg/m3 (mean density value of the asphalt) and a BCFAG gradient of −254.1 µGal/m. A correction of −38 µGal resulted and in this way the absolute 1954 value was reported to the actual height of the road.
In Figure 6c,d, the results obtained for Popoli and Ternisince 1954 are represented and compared with the FG5#238 and A10#39 measures. To detect long-term changes over the period 1954–2020, we also computed the linear trends, indicating a long-term gravity increase of approximately 70 µGal in Terni, while no gravity variations were observed in Popoli, after data had been corrected for the changed asphalt height. A gravity decrease of approximately −40 µGal, considering the uncorrected 1954 original value, was also reported, as shown in Figure 6c.
8. Discussion
This paper focuses on the results of the absolute gravity and GNSS measurements carried out on a wide mesh network installed in central Italy and measured during three field surveys in the period June 2018–October 2020.
After correcting for known effects, the absolute gravity measurements were referred to the equipotential surface derived at the epoch of gravity measurements, through GNSS measurements and using knowledge of the geoid undulations in the area.
A coherent pattern of small gravity variations over the investigated area was observed in the short-term 2018–2020 period [10,25]. Specifically, a global gravity decrease between −2 and −30 µGal, with very slight differences between the two instruments, was observed in the stations of the network. The repetition of the GNSS measures indicated that no significant elevation changes were detected during the time interval June 2018-October 2020 at each station of the network.
Since some stations of the new network coincided with points measured in the past, we also attempted to detect the gravity/elevation variations at SARO, TERN, LNGS, and POPL stations in order to characterize general behavior of the area over long and medium terms, since this could contain effects linked to pre- and post-seismic phenomena. Even though the measurements were discontinuous and carried out with different instruments, it appears that the POPL and SARO stations showed a fair degree of stability in the period 1954–2020 and 2005–2020, respectively. Furthermore, positive gravity variations, of approximately 70 μGal and 157 μGal, were observed at the TERN and LNGSUND stations in the period 1954–2020 and 1995–2010, respectively.
The global co-seismic impact on the local gravity field generated by the elevation changes due to the 2009 and 2016 earthquakes in central Italy has recently been modeled. The model shows that the area affected by gravity changes was approximately 140 km long and approximately 57 km wide, parallel to the Apennines, with a maximum positive gravity change of approximately +170 µGal [43]. Hence, the medium-long-term gravity and ground deformation variations related to pre- and post-seismic (i.e., compression/relaxation) were also expected in the stations of the network we measured. Furthermore, central Italy was affected by at least another 23 significant seismic events with M ≥ 5.0 during the time interval 1954–2009 [44] that could have generated cumulative gravity changes.
Nevertheless, the results of the long-term gravity (1995–2010) variation at LNGSUND do not appear to be in agreement with the model because, specifically in the area around the L’Aquila city, they show that the effect of the co-seismic elevation changes was a maximum of +40 µGal which rapidly decreased, such that at the LNGS it was only −1/−2 µGal [43].
We can therefore conclude that the gravity changes observed over the period 1995–2010 were not due to the co-seismic elevation changes, nor to the elevation changes at LNGS evaluated from historical data over the same period, as it was +3.8 cm [45], corresponding to a gravity change of approximately −10/−12 µGal. Since it is impossible to define the occurrence time of the gravity change, we can only assume that it resulted from a combination of several effects, including pre- and co-seismic effects, and represents the response to underground mass/density changes. A similar study [46] analysed the evolution pattern of regional gravity changes that occurred before and after the Wenchuan Ms 8.0 earthquake, finding that some of the most meaningful indicators of earthquake development were the positive gravity changes of up to 120 μGal recorded over many years in the area.
Based on the data so far available for central Italy, it is not possible to construct an interpretative model to explain the short and long-term observed variations. However, conceptually, we can consider that the gravity changes observed over the 2018–2020 time interval could reasonably be due to fluctuations of seasonal origin. In accordance with this hypothesis, ground water level changes in the aquifers were considered as the source of ground deformations both in the L’Aquila area and in karstic massifs, as observed by permanent GNSS measurements [47,48]. GNSS surveys carried out in the period 2018–2020 did not show significant changes. Since we have only two surveys and not an intermediate one, possible fluctuations of seasonal origin cannot be identified. Moreover, it is likely that we would not have observed these seasonal fluctuations due to the lower accuracy of our surveys with respect to permanent monitoring.
To be able to construct an interpretative model of the observed variations, we intend to perform several additional field surveys, integrating the absolute gravity measurements undertaken with the traditional ballistic gravimeters, the primary method for absolute measurements, with absolute discrete and continuous recording measures obtained with a quantum absolute gravimeter (AQG) by Muquans, available since the end of March 2021 at the INGV-OV. The repetition of absolute gravity and GNSS measurements over time could provide valuable information on the deep processes related to earthquakes, over a critical seismogenetic area, where catastrophic events have occurred in the last decades.
9. Conclusions
Large-scale gravity changes observed over long-medium terms, encompassing the 2009 and 2016 earthquakes in central Italy, contain information related to the earthquakes’ preparatory mechanisms, although understanding of the complex processes of energy accumulation is limited by such factors as the distribution of the measurement points and by the repetition interval.
Apart from the limitations discussed above, we are confident that this work is useful for defining data measurement strategies, data analysis, and correction procedures, but no less for understanding the performance of the gravimeters used. By comparing the absolute g values obtained with both FG5#238 and A10#39 absolute gravimeters, referred to common heights of 0.72 m and the ground, we found that the values collected with the A10#39 at all stations were lower than those collected with the FG5#238, with differences ranging between −7 and −40 µGal. The results of the comparisons between A10#039 and FG5#238 together with IMGC-02, the national standard instrument in Italy, enabled assessment of the discrepancy between the two instruments used in central Italy, even if a coeval comparison of the three gravimeters is still desirable, and is already planned, to better define the conversion factors.
The improved precision of the collected absolute gravity values will eventually also impact on relative gravity measurements (performed for other purposes, e.g., hydrogeology) that could be referred and tested to these new absolute gravity points. Geodetic applications will also benefit from the high precision of the absolute gravity data available in this area (e.g., proper definition of a modern height system in Italy, improvements in the estimate of the geoid that is nowadays fundamental in converting ellipsoidal heights into normal or orthometric heights). Finally, our results should also be considered as a starting point for a future project aimed at the realization of a new Italian gravimetric reference network (G0) which is already in the planning stage [17].
Author Contributions
F.G.: Organization of field survey; acquisition and analyses of absolute FG5#238 gravity data; manuscript drafting and interpretation of results. F.R.: Preliminary field inspection for network planning; organization of field surveys; acquisition and analyses of GNSS and topographic data; manuscript drafting and interpretation of results. G.B.: Preliminary field inspection for network planning; organization and carrying out of field surveys; acquisition and analyses of absolute A10#39 and relative gravity data; acquisition and analyses of old relative gravity data; graphical representation of results; manuscript drafting and interpretation of results. All authors have read and agreed to the published version of the manuscript.
Funding
The research has been developed within two projects, “Ricerca Libera” 2018 and 2019, funded by INGV, entitled, respectively, “Feasibility of an absolute gravity network in central Italy: toward a multi-disciplinary approach to natural risk assessment”, D.P. 453 8/11/2017 (Prot. N. 14830) (Proponents F.G., F.R. and G.B.; Principal responsible G.B.); and, “Consolidation and development of an absolute gravity and GNSS network in central Italy to improve the multi-disciplinary approach to natural risks assessment”, D.P. 53/2020 06/03/2020 (Prot. N. 3876) (Proponents F.G., F.R. and G.B.; Principal responsible F.G.).
Institutional Review Board Statement
Not applicable.
Informed Consent Statement
Not applicable.
Data Availability Statement
The data presented in this study are available on request from the corresponding author.
Acknowledgments
The authors are very grateful to: Alfio Amantia (absolute FG5#238 measurements), Angelo Massucci (GNSS measurements), and Giuseppe Ricciardi (relative and absolute A10#39 measurements), for their invaluable support in field surveys; P. Francia, A. Piancatelli, and V. Argentieri for making available the geomagnetism laboratory and the roof-top terrace for the gravity and classical topographic surveys; A. Massa from the municipality of Sant’Angelo Romano; B. Della Rocca from the municipality of Popoli and S. Cassarino, I. Chella, and G. Tenaglia from the “Antonio Verna” Day Cultural Center of Popoli; G. Laurenti from IPSIA; S. Pertini of Terni; G. De Luca from INGV-Sezione dell’Aquila; and M. Tobia from LNGS. Special thanks go to Mattia Crespi and his staff for their inestimable help and support for topographic measurement at AQUI station. Finally, we wish to acknowledge the National Resource Canada for the Canadian Spatial Reference System Precise Point Positioning (CSRS-PPP) service freely available online at https://webapp.geod.nrcan.gc.ca/geod/, accessed on 15 July 2021. We thank three anonymous reviewers for their constructive comments, which helped us improve the manuscript. We are grateful to Stephen Conway for the English editing of the manuscript.
Conflicts of Interest
The authors declare no conflict of interest.
References
- Berrino, G. Gravity changes induced by height-mass variations at the Campi Flegrei caldera. J. Volcanol. Geotherm. Res. 1994, 61, 293–309. [Google Scholar] [CrossRef]
- Bonforte, A.; Fanizza, G.; Greco, F.; Matera, A.; Sulpizio, R. Long-term dynamics across a volcanic rift: 21 years of microgravity and GPS observations on the southern flank of Mt. Etna volcano. J. Volcanol. Geotherm. Res. 2017, 344, 174–184. [Google Scholar] [CrossRef]
- Greco, F.; Currenti, G.; Palano, M.; Pepe, A.; Pepe, S. Evidence of a shallow persistent magmatic reservoir from joint inversion of gravity and ground deformation data: The 25–26 October 2013 Etna lava fountaining event. Geophys. Res. Lett. 2016, 43, 3246–3253. [Google Scholar] [CrossRef]
- Niebauer, T.M. Gravimetric Methods—Absolute Gravimeter: Instruments Concepts and Implementation; Elsevier: Oxford, UK, 2015; pp. 37–57. [Google Scholar]
- Doglioni, C.; Barba, S.; Carminati, E.; Riguzzi, F. Fault on–off versus coseismic fluids reaction. Geosci. Front. 2014, 5, 767–780. [Google Scholar] [CrossRef]
- Devoti, R.; D’Agostino, N.; Serpelloni, E.; Pietrantonio, G.; Riguzzi, F.; Avallone, A.; Cavaliere, A.; Cheloni, D.; Cecere, G.; D’Ambrosio, C.; et al. The Mediterranean Crustal Motion Map compiled at INGV. Ann. Geophys. 2017, 60, S0215. [Google Scholar] [CrossRef]
- Galli, P.; Galadini, F.; Pantosti, D. Twenty years of paleoseismology in Italy. Earth Sci. Rev. 2008, 88, 89–117. [Google Scholar] [CrossRef]
- Pizzi, A.; Galadini, F. Pre-existing cross-structures and active fault segmentation in the northern-central Apennines (Italy). Tectonophysics 2009, 476, 304–319. [Google Scholar] [CrossRef]
- Doglioni, C.; Carminati, E.; Petricca, P.; Riguzzi, F. Normal fault earthquakes or graviquakes. Sci. Rep. 2015, 5, 12110. [Google Scholar] [CrossRef]
- Berrino, G.; Greco, F.; Riguzzi, F.; Amantia, A.; Massucci, A.; Ricciardi, G. Indagini gravimetriche e GPS in Italia centrale per il controllo delle aree sismogenetiche. In Proceedings of the 37° GNGTS National Meeting, Bologna, Italy, 19–21 November 2018; Poster Section. Extended Abstract. pp. 170–172. Available online: http://hdl.handle.net/2122/12057 (accessed on 15 November 2021).
- Alasia, F.; Cannizzo, L.; Cerutti, G.; Marson, I. Absolute gravity acceleration measurements: Experiences with a transportable gravimeter. Metrologia 1982, 18, 221–229. [Google Scholar] [CrossRef]
- D’Agostino, G.; Desogus, S.; Germak, A.; Origlia, C.; Quagliotti, D.; Berrino, G.; Corrado, G.; d’Errico, V.; Ricciardi, G. The new IMGC-02 transportable absolute gravimeter: Measurements apparatus and applications in Geophysics and Volcanology. Ann. Geophys. 2008, 51, 39–49. [Google Scholar]
- Berrino, G. Absolute gravimetry and gradiometry on active volcanoes of Southern Italy. Boll. Geofis. Teor. Appl. 1995, XXXVII, 131–144. [Google Scholar]
- Marson, I.; Morelli, C. First order gravity net in Italy. In Proceedings of the International Gravity Commission Meeting, Paris, France, 12–16 September 1978; pp. 659–689. [Google Scholar]
- Cannizzo, L.; Cerutti, G.; Marson, I. Absolute gravity measurements in Europe. Il Nuovo Cimento. 1978, 1, 39–85. [Google Scholar] [CrossRef]
- Berrino, G.; Marson, I.; Orlando, L.; Balestri, L.; Balia, R.; Bonci, L.; Bozzo, E.; Carrozzo, M.T.; Cerutti, G.; Cesi, C.; et al. Rete gravimetrica Italiana di Ordine Zero. Stato di avanzamento. In Proceedings of the 14° Meeting GNGTS, Rome, Italy, 23–25 October 1995; pp. 453–460. [Google Scholar]
- Berrino, G. The state of the art of gravimetry in Italy. Rend. Lincei Sci. Fis. Nat. 2020, 31, 35–48. [Google Scholar] [CrossRef]
- Berrino, G. Combined gravimetry in the observation of volcanic processes in Southern Italy. J. Geodyn. 2000, 30, 371–388. [Google Scholar] [CrossRef]
- Berrino, G.; D’Errico, V.; Ricciardi, G. Misure Gravimetriche a L’Aquila nel 2010. Confronto con i Valori Rilevati nel 1995. Convegno “Osservazioni Elettromagnetiche e Gravimetriche Relative al Sisma del 6 Aprile 2009 a L’Aquila”. 2010, L’Aquila, 26–28 April 2010. Poster Session. Available online: http://www.iagaitalia.it/it/convegno-sisma.asp (accessed on 15 July 2021).
- Berrino, G.; Riguzzi, F.; d’Errico, V.; Ricciardi, G.; Toro, B.; Di Filippo, M.; Di Nezza, M.; Germak, A.; D’Agostino, G.; Origlia, C. Dynamics and structure of the Colli Albani volcanic district from gravity measurements. In Proceedings of the National Meeting MGMEESV Metodi Gravimetrico, Magnetico, Elettrico ed Elettromagnetico in Sismologia e Vulcanologia, INGV-Sezione di Catania, Catania Italiano, Italy, 27–29 September 2006. [Google Scholar]
- Greco, F.; Currenti, G.; D’Agostino, G.; Germak, A.; Napoli, R.; Pistorio, A.; Del Negro, C. Combining relative and absolute gravity measurements to enhance volcano monitoring at Mt Etna (Italy). Bull. Volcanol. 2012, 74, 1745–1756. [Google Scholar] [CrossRef]
- Greco, F.; Biolcati, E.; Pistorio, A.; D’Agostino, G.; Germak, A.; Origlia, C.; Del Negro, C. Absolute gravity measurements at three sites characterized by different environmental conditions using two portable ballistic gravimeters. Eur. Phys. J. Plus 2015, 130, 38. [Google Scholar] [CrossRef]
- Berrino, G.; Ricciardi, G. Repeated absolute gravity measurements on a dense network at Campi Flegrei–A reliable tool for volcano monitoring. Adv. Geosci. 2020, 52, 41–54. [Google Scholar] [CrossRef]
- Greco, F.; Pistorio, A.; Currenti, G.M.; Del Negro, C.; Napoli, R.D.; Scandura, D. 4D Hybrid Microgravity Measurements: Two Case Studies of Monitoring at the Mt. Etna Volcano and at a Gas Storage Reservoir in Northern Italy. Miscellanea INGV 2011, 12, 47–50. Available online: https://www.earth-prints.org/bitstream/2122/7458/1/Miscellanea%2012%202011.pdf (accessed on 15 July 2021).
- Greco, F.; Berrino, G.; Riguzzi, F.; Amantia, A.; Massucci, A.; Ricciardi, G. The first combined absolute gravity and GNSS network in Central Italy. Quad. Geofis. 2021, 167, 126. [Google Scholar] [CrossRef]
- Greco, F.; Berrino, G.; Riguzzi, F.; Amantia, A.; Massucci, A.; Ricciardi, G. Misure gravimetriche e GNSS in Italia Centrale per il monitoraggio di aree sismogenetiche. In Proceedings of the 39° GNGTS National Meeting, Online, 22–24 June 2021. Poster Session with Oral Presentation. [Google Scholar]
- Morelli, C. Gravità e tettonica nelle Marche e negli Abruzzi settentrionali. Ann. Geophys. 1955, 8, 475–513. [Google Scholar]
- Cunietti, M.; Inghilleri, G. La rete gravimetrica fondamentale italiana. Mem. Comm. Geod. Ital. 1955, 8, 130. [Google Scholar]
- Riguzzi, F.; The Working Group R.U.8 Project INGV-DPC V3_1 Colli Albani. Modeling deformation of the Colli Albani volcanic area by integration of different geodetic techniques. In Proceedings of the UGG 2007, Perugia, Italy, 2–13 July 2007; Session JGS003: Earthquake and Volcano geodesy, Poster Presentation. Available online: http://iugg.org/archive/iugg2007perugia/www.iugg2007perugia.it/index9fa5.html?option=com_content&view=article&id=4&Itemid=88 (accessed on 15 July 2021).
- Fortunato, M.; Mazzoni, A.; Berrino, G.; Greco, F.; Riguzzi, F.; Sonnessa, A. Indoor height determination of the new absolute gravimetric station of L’Aquila. Ann. Geophys. 2020, 63, 8. [Google Scholar] [CrossRef]
- Kazama, T.; Okubo, S. Hydrological modeling of groundwater disturbances to observed gravity: Theory and application to Asama Volcano, Central Japan. J. Geophys. Res. Space Phys. 2009, 114, B08402. [Google Scholar] [CrossRef]
- Kazama, T.; Okubo, S.; Sugano, T.; Matsumoto, S.; Sun, W.; Tanaka, Y.; Koyama, E. Absolute gravity change associated with magma mass movement in the conduit of Asama Volcano (Central Japan), revealed by physical modeling of hydrological gravity disturbances. J. Geophys. Res. Solid Earth 2015, 120, 1263–1287. [Google Scholar] [CrossRef]
- Carbone, D.; Poland, M.P.; Diament, M.; Greco, F. The added value of time-variable microgravimetry to the understanding of how volcanoes work. Earth-Science Rev. 2017, 169, 146–179. [Google Scholar] [CrossRef]
- Niebauer, T.; Sasagawa, G.; Faller, G.; Hilt, R.; Klopping, F. A new generation of absolute gravimeters. Metrologia 1995, 32, 159–180. [Google Scholar] [CrossRef]
- Berrino, G.; d’Errico, V.; Ricciardi, G. Thirty years of precise gravity measurements at Mt. Vesuvius: An approach to detect underground mass movements. Ann. Geophys. 2013, 56, S0436. [Google Scholar] [CrossRef]
- Jiang, Z.; Pálinkáš, V.; Arias, F.E.; Liard, J.; Merlet, S.; Wilmes, H.; Vitushkin, L.; Robertsson, L.; Tisserand, L.; dos Santos, F.P.; et al. The 8th International Comparison of Absolute Gravimeters 2009: The first Key Comparison (CCM.G-K1) in the field of absolute gravimetry. Metrologia 2012, 49, 666–684. [Google Scholar] [CrossRef]
- Newell, D.B.; Van Westrum, D.; Francis, O.; Kanney, J.; Liard, J.; Ramirez, A.E.; Lucero, B.; Ellis, B.; Greco, F.; Pistorio, A.; et al. Regional comparison of absolute gravimeters SIM.M.G-K1 key comparison. Metrologia 2017, 54, 07019. [Google Scholar] [CrossRef]
- Pálinkáš, V.; Francis, O.; Val’Ko, M.; Kostelecký, J.; Van Camp, M.; Castelein, S.; Bilker-Koivula, M.; Näränen, J.; Lothhammer, A.; Falk, R.; et al. Regional comparison of absolute gravimeters, EURAMET.M.G-K2 key comparison. Metrologia 2017, 54, 07012. [Google Scholar] [CrossRef]
- Falk, R.; Pálinkáš, V.; Wziontek, H.; Rülke, A.; Val’Ko, M.; Ullrich, C.; Butta, H.; Kostelecký, J.; Bilker-Koivula, M.; Näränen, J.; et al. Final report of EURAMET.M.G-K3 regional comparison of absolute gravimeters. Metrologia 2020, 57, 07019. [Google Scholar] [CrossRef]
- Merriam, J.B. Atmospheric pressure and gravity. Geophys. J. Int. 1992, 109, 488–500. [Google Scholar] [CrossRef]
- Altamimi, Z.; Collilieux, X.; Metivier, L. ITRF2008 plate motion model. J. Geophys. Res. 2012, 117. [Google Scholar] [CrossRef]
- Barzaghi, R.; Borghi, A.; Carrion, D.; Sona, G. Refining the estimate of the Italian quasi-geoid. Boll. Geod. Sci. Affini. 2007, 66, 145–159. [Google Scholar]
- Riguzzi, F.; Tan, H.; Shen, C. Surface volume and gravity changes due to significant earthquakes occurred in central Italy from 2009 to 2016. Acta Diabetol. 2019, 108, 2047–2056. [Google Scholar] [CrossRef]
- Rovida, A.; Locati, M.; Camassi, R.; Lolli, B.; Gasperini, P.; Antonucci, A. Italian Parametric Earthquake Catalogue (CPTI15), vs 3.0. Istituto Nazionale di Geofisica e Vulcanologia (INGV). 2021. Available online: https://emidius.mi.ingv.it/CPTI15-DBMI15/query_eq/ (accessed on 15 July 2021).
- Colosimo, G.; Crespi, M.; Mazzoni, A.; Jones, M.; Missiaen, D.; Riguzzi, F. Determination of the CNGS Global Geodesy, OPERA Public Note 132 v3; CERN: Geneva, Switzerland, 2012; Available online: https://hdl.handle.net/2122/7937 (accessed on 15 July 2021).
- Shen, C.; Li, H.; Sun, W.; Huang, J.; Sun, S.; Xuan, S.; Tan, H.; Liu, S. Dynamic changes of gravity fields before and after the 2008 Wenchuan earthquake (Ms8.0). Geodesy Geodyn. 2012, 3, 1–16. [Google Scholar] [CrossRef][Green Version]
- Devoti, R.; Riguzzi, F.; Cinti, F.; Ventura, G. Long-term strain oscillations related to the hydrological interaction between aquifers in intra-mountain basins: A case study from Apennines chain (Italy). Earth Planet. Sci. Lett. 2018, 501, 1–12. [Google Scholar] [CrossRef]
- Riguzzi, F.; Devoti, R.; Pientrantonio, G. GNSS data provide unexpected insights in hydrogeologic processes. Boll. Geofis. Teor. Appl. 2020, 14, 45. [Google Scholar] [CrossRef]


Publisher’s Note: MDPI stays neutral with regard to jurisdictional claims in published maps and institutional affiliations. |
© 2021 by the authors. Licensee MDPI, Basel, Switzerland. This article is an open access article distributed under the terms and conditions of the Creative Commons Attribution (CC BY) license (https://creativecommons.org/licenses/by/4.0/).