Abstract
The difficulty of obtaining funding often places the continuity of research projects at risk, forcing researchers to resort to low-cost methodologies. Such methodologies sometimes require a high degree of technical knowledge which, in many cases, poses an insurmountable obstacle to the development of a project. This article shows a low-cost, easy-way methodology for diachronically analysing terrain in search of archaeological evidence on different scales (micro and semi-micro) in both already known and new archaeological sites through the analysis of orthophotographs taken with UAVs, the DEMs generated from them, and public LiDAR data. It allows researchers with small budgets but with a basic knowledge of GIS and photogrammetry to undertake some aspects of their project without necessarily having to call on the assistance or support of specialists. Thanks to this methodology, the researcher will be able to continue until they are able to obtain the funding that will enable them to take their research further, with specialists. This article presents the first conclusions obtained after applying the proposed methodology at the Giribaile (Vilches, Spain) archaeological site—a site of interest in its territory which possibly functioned as an advance defensive post for the town, a hypothesis based on the towers and numerous internal structures that have been identified.
1. Introduction
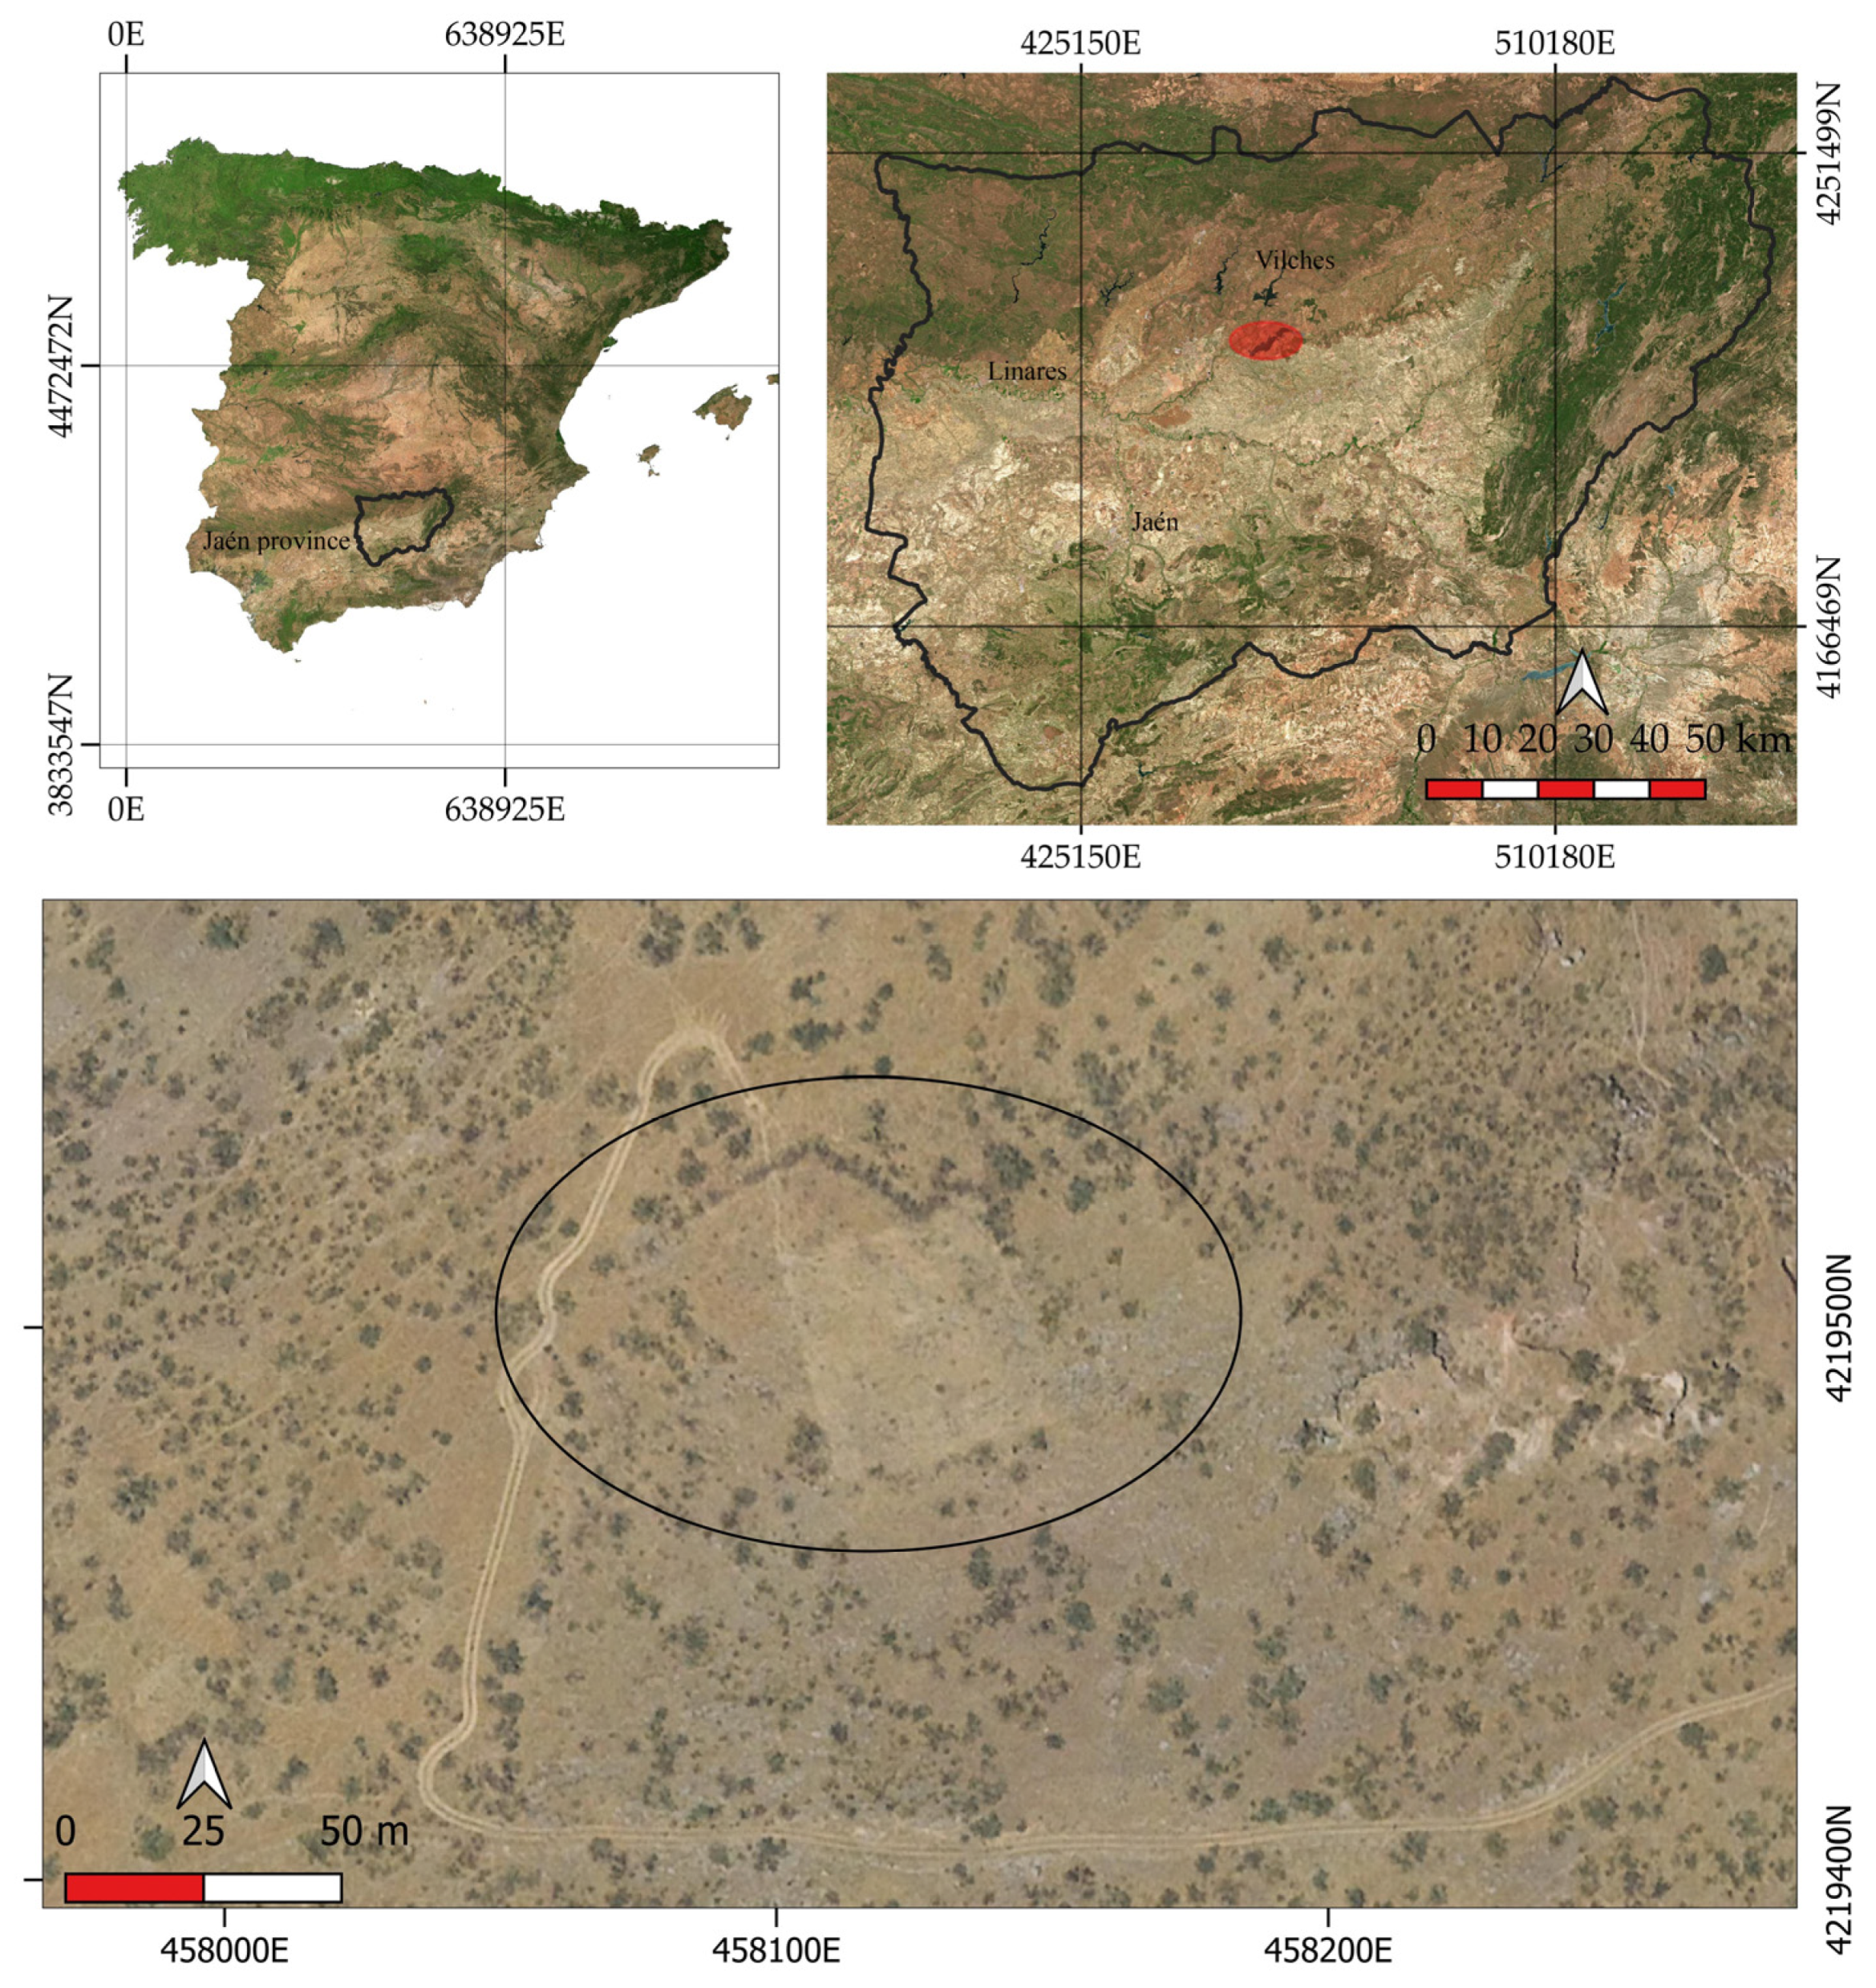
The area chosen to evaluate this methodology was the Giribaile archaeological site in the present-day region of Andalusia, in the south of the Iberian Peninsula, specifically in the municipality of Vilches [1] in the El Condado region of Jaén province. Located near the main communication routes (Figure 1), the archaeological site is on a plateau overlooking the Guadalén and Guadalimar river valleys at the foot of the Sierra Morena mountains. With more than 14 ha of fortified plateau, it is one of the most important archaeological areas in the Alto Guadalquivir region. During protohistory it was part of the political territory of Cástulo, which would have acted as its capital. The most recent research suggests that it may have been an ex novo foundation from the mid-fourth century BC, perhaps resulting from a political agreement with the local aristocracies in anticipation of the Punic presence in the Sierra Morena mining region. In this regard, it is necessary to take into account the proximity of Baecula [2], the scene of one of the main battles in the final stages of the Second Punic War, in which Iberians, Carthaginians, and Romans were involved.
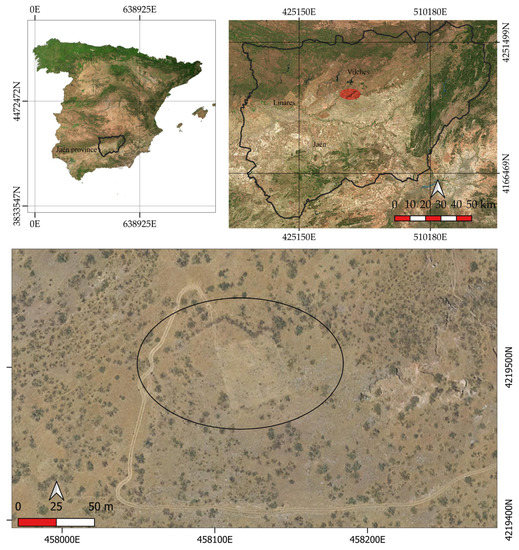
Figure 1.
Location. Referred coordinates at EPSG: 25,830—ETRS89/UTM Zone 30N.
This region is rich in argentiferous galena towards the Sierra Morena foothills. It has a fertile plain which has been systematically and successfully farmed since early Roman times [3]. Due to its eminently productive nature [4] and strategic importance in the territory, the region may have been settled by a colony of peoples from different ethnic—possibly native North African—origins, although this hypothesis awaits confirmation by material culture finds.
For the time being, the excavation campaigns carried out since 2014 as part of a systematic six-year research project have identified building materials and architectural designs hitherto unknown in the Iberian culture. This despite the fact that the University of Jaén has a long tradition of research in this field and is considered a leading institution for historical-archaeological studies of this period [5,6,7].
The recent excavation campaign carried out on the barrier-type monumental fortification [8] that encloses the site has identified a wall of at least 8 m high composed of a stone masonry foundation and a compacted earth elevation stabilised with lime and topped by a protective walkway built of adobe bricks. Of particular significance is the characterisation of a section of caissons joined at variable angles, which apparently fit the use of the 52-cm Punic cubit.
Since the early 1990s, Giribaile has been an archaeological research model linked to a working method centred around intensive archaeological surveying. This model has been applied over more than three decades at various archaeological sites scattered throughout the territory. There have been numerous publications during these years, many of them of an experimental nature [9]. They are linked to the updated working protocols of the International Mediterranean Survey [10] and attempt to involve an increasing number of researchers who share the same objectives and working methods.
Among other actions, it is worth highlighting the intensive surface surveying of the Giribaile plateau based on an organised and systematic stratified sampling system, in which 1% of the dispersed pottery assemblages were carefully inspected and quantified. This was a large-scale reproduction of the model that had already been tested in the characterization of the archaeological area of the heroic sanctuary of El Pajarillo [11] and the survey of the farmed area of the Giribaile economic territory affected by the construction of a dam in the early 1990s [12]. Finally, it is also worth mentioning the recent combined subsoil survey using electrical tomography and ground penetrating radar to document 1 ha of land on the main platform of the Giribaile plateau [13].
All these arguments show the topicality of the research being carried out at Giribaile and the importance of assessing the diversity of its material culture, considering that this archaeological site must be taken into account as an integral part of the Iberian culture of Jaén province as one of the recognized areas of research for the comprehensive interpretation of the indigenous protohistory of the Iberian Peninsula.
In recent times, archaeological surveying has undergone an important evolution thanks to the use of remote sensing from high points. These are techniques that use non-direct contact devices to observe targets of interest on the Earth’s (sub)surface, either from ground level or above [14].
Remote sensing in archaeology has increased exponentially since it was first applied in the early twentieth century, with cameras mounted on kites, balloons, etc., right up to the satellite technology we have today [14]. In addition, the “democratisation” of UAVs, thanks to their increasing presence on the market and the possibilities of mounting different kinds of sensors with various capabilities on them [15], has helped increase the use of remote sensing techniques by archaeologists specialising in the identification and investigation of archaeological remains over large areas, such as the Giribaile site, or in mapping archaeological areas in two or three dimensions [16,17]. This work has shown that the combined use of the techniques included in remote sensing is extremely useful for improving the identification and interpretation of archaeological sites.
The increasing use of remote sensing technology combined with GIS, which has enabled and advanced the study and interpretation of archaeological landscapes, even diachronically, constitutes a major change in the practice of archaeological and heritage studies [18]. Its use has also contributed to a progressive reduction in the cost of obtaining datasets, as well as in the acquisition of the necessary equipment (UAVs, cameras, etc.), and has democratised access to this type of information, as demonstrated in numerous studies, of which we cite some examples [19,20,21].
However, despite this ease of access and the possibilities it has opened up, there are still barriers to overcome before the full potential of this methodology can be taken advantage of. We refer, among other aspects, to its routine use at all levels of research, ranging from professional archaeology to the university, since, in most cases it represents a complex technical challenge. This is evidenced in numerous papers, such us [22,23,24], in which the results are excellent but difficult to achieve by a researcher with only a basic knowledge of the methodology. In many cases, researchers require specialised technical knowledge that is beyond their reach. This acts as a brake on the use and assimilation of these methods, as well as on numerous research projects, especially in those cases where sources of funding are limited.
Bearing this challenge in mind, and with the intention of facilitating exploitation of the aforementioned data, this article presents an example of a methodology based on the use of low-cost, “easy-way” instruments for the diachronic analysis of a terrain in search of archaeological evidence on different scales (micro and semi-micro), with promising results being obtained in the study of a checkpoint on the access road to the Iberian oppidum of Giribaile. For this we set two basic objectives:
- To propose an “easy-way” procedure for processing public LiDAR datasets and UAV orthophotography, which, in a simple and accessible way, allows researchers with a basic knowledge of topography and photogrammetry to obtain information that helps to facilitate their research without major financial outlays;
- To present the results obtained after applying the aforementioned process to the study of the Giribaile archaeological site.
2. Materials and Methods
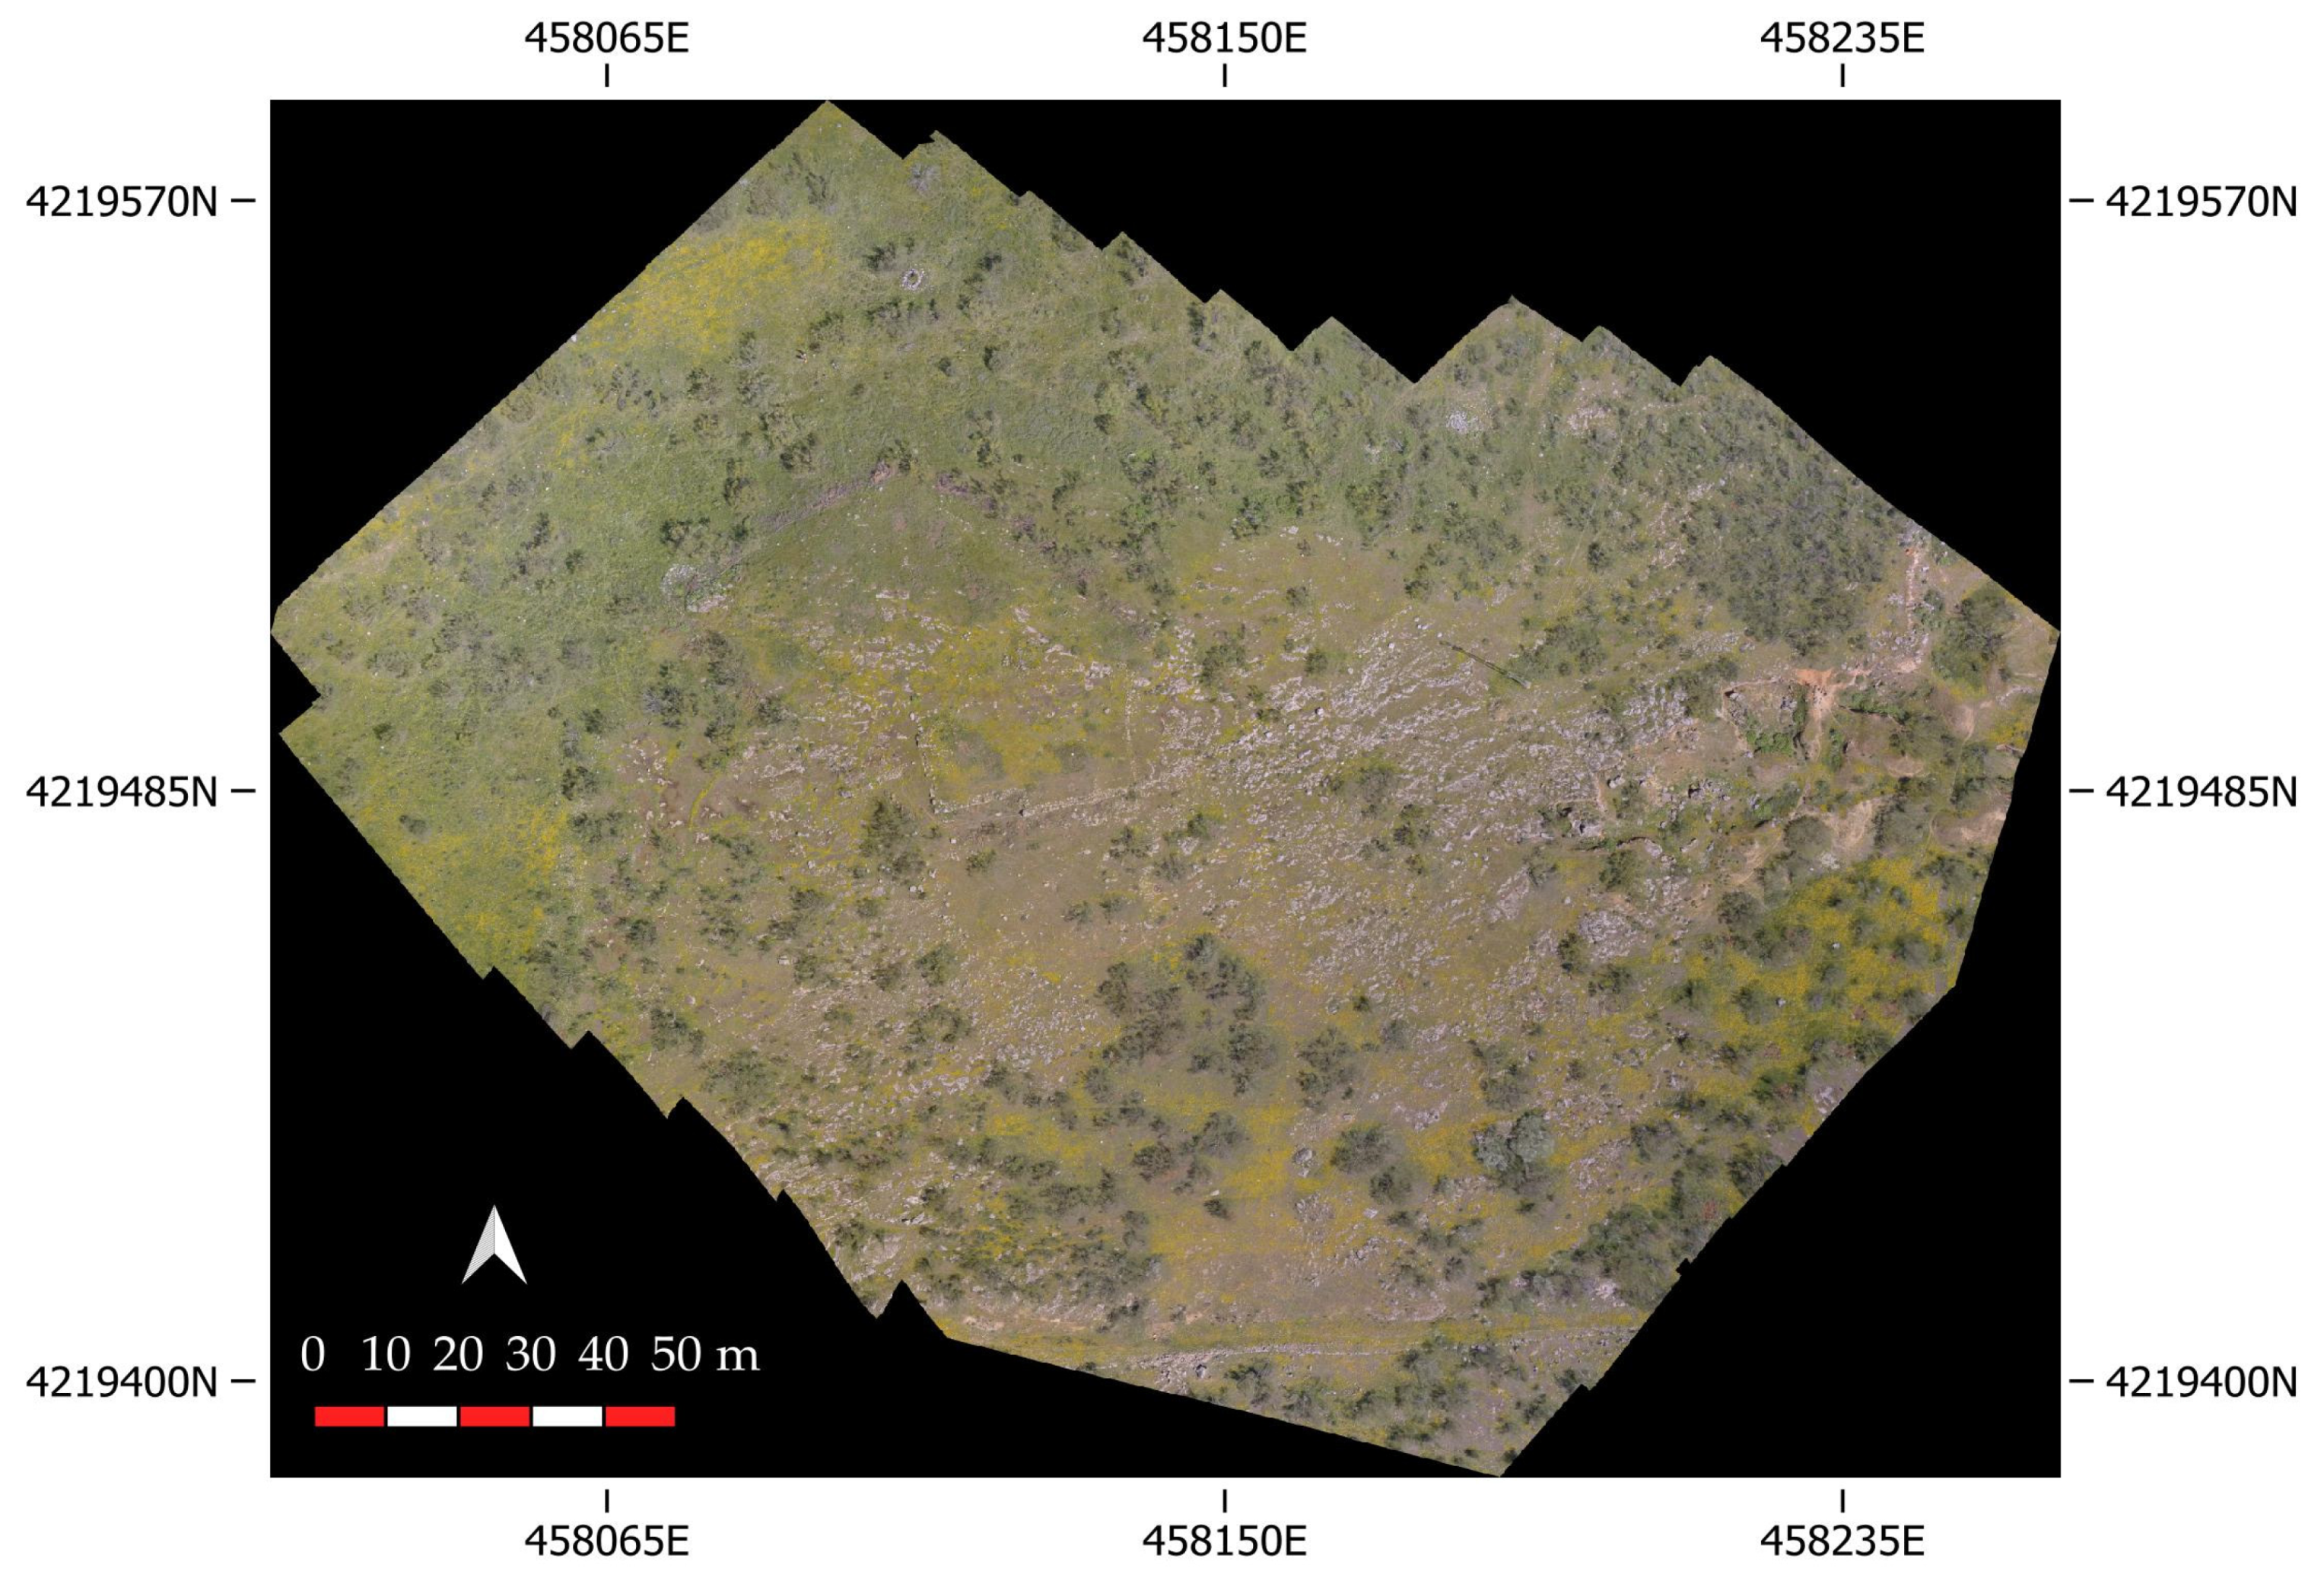
The land under study is a small hill located 500 m northwest of the Giribaile archaeological site. Its UTM ETRS89 central coordinates are 458,107.7, 421,509.2, and it presents a flat surface with an approximate area of 0.21 ha. The site was initially partially covered by medium-type vegetation, which can be seen in the rest of the orthophotography. Specifically, the species broom (Retama monosperma) was partially cleared from the surface under study prior to undertaking the photogrammetric flight. Its surface presents outcrops of the geological base, most of which is covered by low vegetation. These characteristics made this area conducive to putting our proposed methodology into practice (Figure 2).

Figure 2.
Orthophotography showing the area where the vegetation was removed. Coordinates refer to EPSG: 25,830—ETRS89/UTM Zone 30N.
2.1. Materials
The material used to conduct this study was divided into two groups according to its origin: on the one hand, data from public sources generated by external agents prior to our study; and, on the other, data we generated in the course of this research.
2.1.1. Public Data. LiDAR
Through the download centre [25] of the National Geographic Information Centre [13], the Spanish government provides free access to various cartographic products and services, including different digital elevation models (DEMs). Among the wide variety of data provided, in the case under study we worked with the LiDAR flight data for the first coverage conducted between 2008 and 2015. These data are organised in digital files with altimetric information from the LiDAR point cloud distributed in 2 × 2 km files. The point clouds were captured by LiDAR sensor flights with a density of 0.5 points/m2. All the files are coloured with infrared and RGB from orthophotos [26] and are referenced to SRC ETRS 89, as established by the current Spanish standards [27]. Since 2020, the work relating to the second coverage has been conducted in the region under study; it was due to be completed in the second half of 2021, although at the time of writing the results had yet to be made available. The specific file used for this study was PNOA_2014_AND-NE_456-4220_ORT-CLA-CIR.laz, which contained a total of 1,808,269 points, of which 955,033 were classified as ground (2 Ground) according to the American Society for Photogrammetry and Remote Sensing (ASPRS) (Table 1). After trimming the surface area under study to reduce the number of points processed, and therefore the processing time, the number classified as soil was reduced to 66,244 points.

Table 1.
Extract from the LiDAR file statistics in which the numbers of points and the percentages according to classification can be seen.
LiDAR data offer numerous advantages in archaeology over other means of surface representation and analysis. One of the main advantages is the ability to obtain information from below the vegetation cover [28,29,30], allowing for the realisation of a topographic representation of the surface or Digital Terrain Model (DTM) it obscures. There are numerous case studies that demonstrate this [31,32].
In this case, the point cloud that makes up the studied dataset was previously classified considering the ASPRS guidelines. This means that the processing to be performed by the end user is minimal, as they only have to select those points from the ground category (2 Ground). Thanks to this classification, the generation of a DTM is relatively simple, as we will see later.
In contrast, one of the major disadvantages that these specific data present for their use in archaeology is their low resolution (0.5 pts/m2), which makes it difficult to identify smaller archaeological elements (Table 2).
Table 2.
Comparison of the technical characteristics of the datasets used in this article.
2.1.2. Data Generated by the Research
Surface Survey
Due to the find of a hobnail from a legionnaire’s sandal, it was initially thought that the archaeological site this study focuses on was part of a Roman camp. However, pending an archaeological excavation campaign, and considering the small size of the construction, the current hypothesis is that it was possibly a territorial defence and control outpost. This interpretation takes into account the nearby location of the Giribaile acropolis, which was probably occupied by the palace of the local princes. Its location next to the road into the town is further confirmation of this hypothetical function. However, the considerable erosion of the land and the vegetation cover have only allowed us to identify a small assemblage of pottery sherds with a composition similar to that documented in the town that occupies the Giribaile plateau, thus confirming their contemporaneity [7,33].
Photogrammetric Flight
An aerial orthophotograph was obtained with the structure from motion (SfM) technique [34] using a DJI brand Phantom IV pro model multirotor quadcopter equipped with a camera with a 1/2.3 CMOS sensor and an electronic shutter that provides an effective resolution of 12.4 M (Table 3). To carry out this orthophotography, the survey was planned as a photogrammetric flight following parallel lines. An 80% overlap of images was planned, both front overlap and side overlap, with a maximum height of 100 m.a.s.l. Ninety-seven photographs were taken with this configuration and referenced at ground level by nine control points (GCPs) measured with a Polaris S100 RTK receiver that provides an accuracy of up to 7 mm on the horizontal and 14 mm on the vertical (Table 3). The end result was the generation of a point cloud made up of a total of 37,457,726 points, which served as the basis for undertaking both orthophotography with a resolution of 1.61 pixel/cm and a digital elevation model (DEM) with a resolution of 3.23 cm/pixel. The point cloud has a relatively high density and needs good processor performance, although the result is a point cloud similar to that created by a laser scanner, with a density of ~1500 points [35]. Therefore, the use of the most powerful PC possible is recommended (Table 3) and the accuracy of the point cloud generated in this way has proven to be very high, as can be seen in [36,37,38], among other studies.
Table 3.
Hardware and configuration used in this study.
The coordinate system used to georeference the images was that established by default for the aforementioned aircraft, specifically the WGS84 geodetic system with ellipsoidal heights.
2.2. Methodology
2.2.1. Fieldwork
Prior to the photogrammetric flight, part of the vegetation was removed in a selective and controlled manner, especially on the edges of the flight area (there being little vegetation in the centre), where the geological base reached the surface. The objective of this controlled clearing was to determine the boundaries of the study area as accurately as possible. In this task we had the assistance of the Vilches town council maintenance services and the corresponding authorisation from the Andalusian Regional Government Ministry of Agriculture, Livestock, Fisheries and Sustainable Development (Figure 2).
2.2.2. Office/Laboratory Work
The office/laboratory tasks were carried out in three phases: photogrammetric flight processing, georeferencing, and analysis and interpretation.
Photogrammetric Flight Processing
Obtaining and processing the images from both the orthophotography and the DEM was carried out with the Agisoft PhotoScan Professional software (now known as Metashape), specifically Version 1.4.5. Build 7354 (64 bit), This allows the reconstruction of a 3D model from the images by applying the SfM algorithms [35,39].
The validation procedure illustrated in this study suggests that this methodology—the UAV survey and SfM approach—can be used when a vertical accuracy of centimetres is required [35].
Once a new project had been created, the images were loaded, and the workflow indicated in Figure 3 was followed.
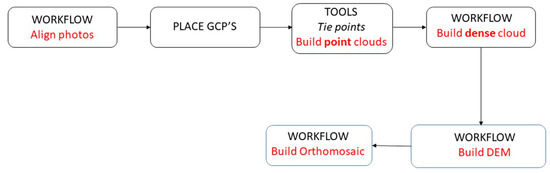
Figure 3.
Workflow followed for the processing of the UAV photos. The menu in which the tool used is located is in capital letters, the submenu is in italics and the name of the tool is in red. The blue rectangles indicate the steps followed to obtain the orthophotography.
The drawback of generating a DEM from an orthophoto is that it does not penetrate the vegetation in the same way as LiDAR and the model therefore also reflects the height of the existing vegetation. Due to the characteristics of the terrain and the clearing of the broom prior to the flight, it was possible to obtain a high-precision DEM of the area under study.
For the processing, the procedure shown in Figure 3 was followed [34].
Thanks to this process, we were able to obtain both the aforementioned orthophotography and the DEM, as well as to carry out the analysis described below.
LiDAR Data Processing
Due to the size of the downloaded file (2 × 2 km2), there was a large area we did not need to analyse in our case. We trimmed it down to the area under study, thus eliminating a large part of it. The dimensions of the extracted area were 960.83 × 614.88 m, representing an area of 59.63 ha. For the delimitation of this terrain, we took into account the UAV overflight area, the current limits of the Giribaile reservoir, and the indications of an access road to the aforementioned archaeological site, part of which had been identified both on the ground, thanks to surface prospecting, and in the orthophotograph obtained with the UAV flight, while another part could not be appreciated with the naked eye.
The processing was carried out using the free, open source software (FOSS) QGIS 3.18 Zürich with Grass 7.8.5 [40], specifically the LASTOOL module, which is an extension that implements reading and writing of LiDAR points from and to the ASPRS LAS format [41] (Figure 4).

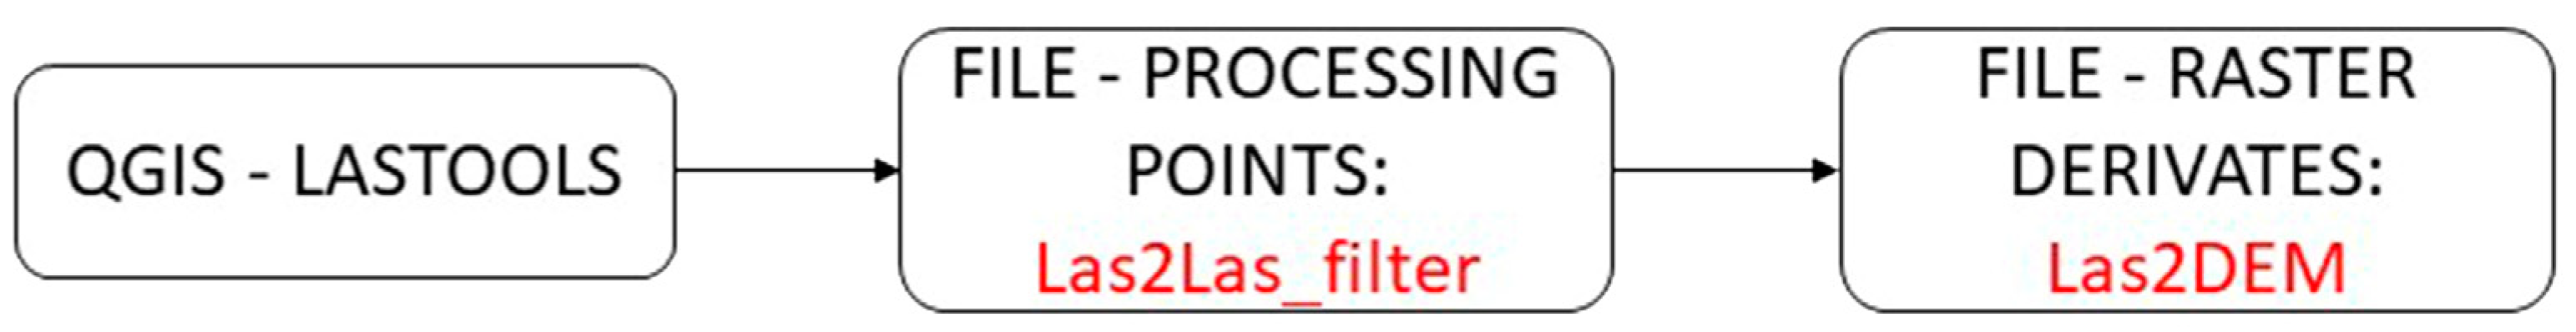
Figure 4.
Workflow followed to process the LiDAR data from the CNIG in QGIS using the LASTOOL plugin. The menu in which the tool used is located is in capital letters and the name of the tool is in red.
Initially, the LASTOOL plugin [41] was installed in Qgis, as it is not included by default. It was installed directly from the official QGIS plugin repository. Subsequently, the point cloud was filtered to extract the points classified with the 2 Ground code. The filtering was carried out using the Las2Las_filter tool, and a new point cloud composed exclusively of the terrain points was generated. Finally, the DTM was created using the Las2DEM tool (Figure 4).
Georeferencing and Point Cloud Alignment
Having carried out the aforementioned processes, we had two DTMs referenced to different coordinate systems, making it necessary to convert the datasets to the same system. We unified both datasets under the ETRS89 datum, as specified by the Spanish standard [25] and the European recommendations.
As previously stated, the data obtained from the UAV flight, as well as the GCPs, were referenced to the WGS 84 coordinate system. Thus, we initially converted the coordinates of the nine control points using the free SuMapa.com [42] online converter that allowed us to quickly and accurately transform the coordinates taken in WGS84 format to the ETRS89 datum.
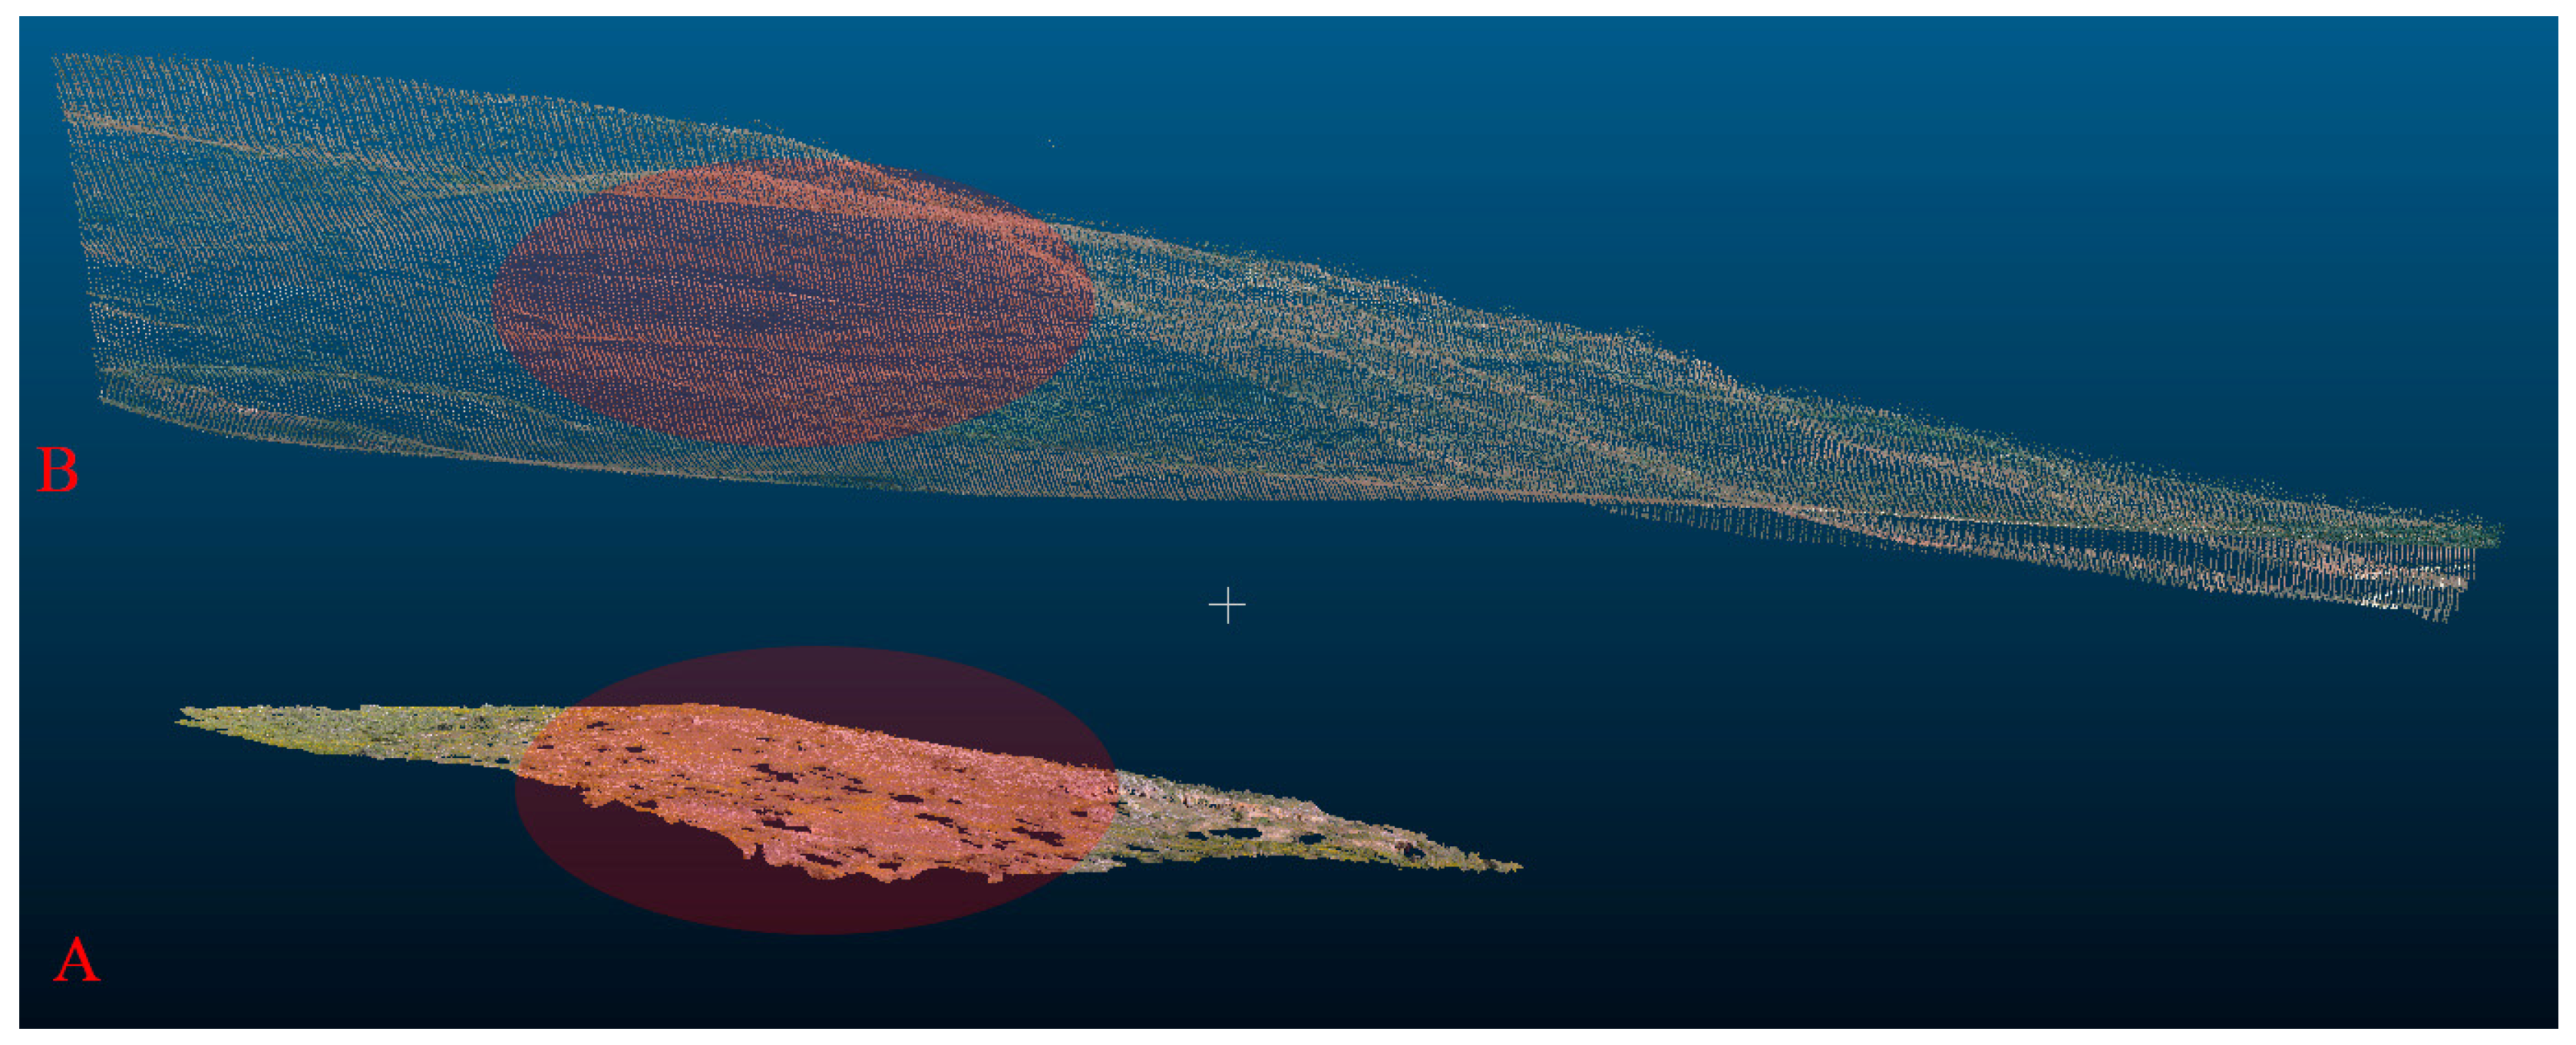
Although in the previous phase, the GCP coordinates had been transformed to the ETRS 89 reference system, and therefore the referencing of the point cloud had been converted to this system, there remained a fundamental disparity in the development of this study between the two point clouds. This was the difference in heights, as they had been measured with respect to different reference points (orthometric geoid height and ellipsoidal to the ellipsoid). Specifically, the mean separation between the two clouds was 105.74 m (Figure 5).

Figure 5.
Detail of the separation of both point clouds. (A) Point cloud derived from aerial photography. (B) Point cloud extracted from PNOA LiDAR. Red ellipses mark the target area of this study.
The process of converting geodetic heights to orthometric heights is more complex, as the REDNAP_08 geodetic correction file is needed. This would make the conversion process extremely difficult [43]. Hence, taking into account the target audience of this article, we propose an alternative and more affordable methodology for the researcher with basic knowledge that continues, as will be seen, to offer acceptable results.
The Foss CloudCompare software, Version 2.11.2 (Anoia) was found to offer a simple solution to this question, following the workflow shown in Figure 6.
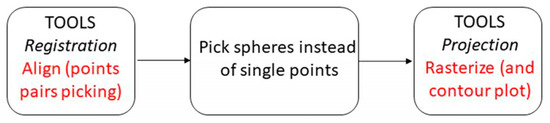
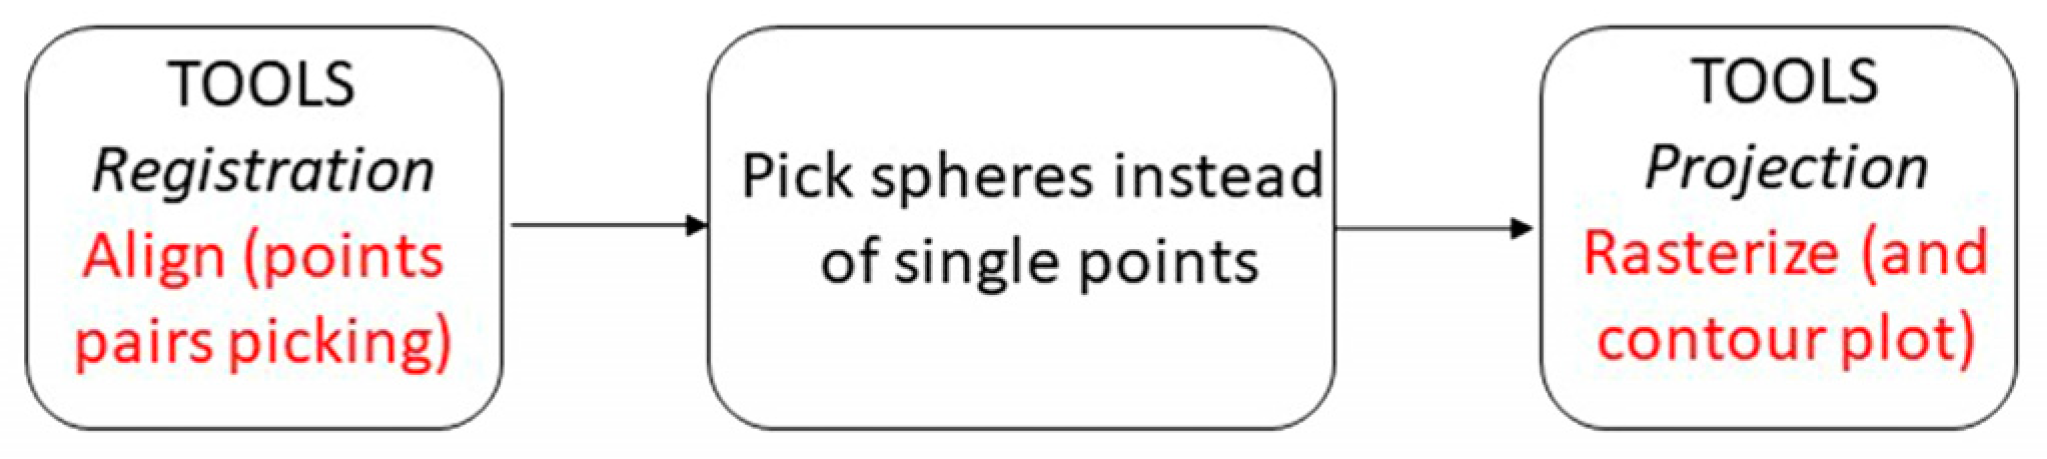
Figure 6.
The workflow followed to match the heights of the CNIG LiDAR and UAV flight datasets. The menu in which the tool used is located is in capital letters, the submenu telling where to find it is in italics, and the name of the tool is in red.
The procedure having been carried out, the two clouds were merged, thus achieving our objective of equalising the height and therefore that of the generated DEMs. Once the resulting cloud has been obtained it can be exported in LAZ format to be processed with GIS, BIM, or any similar software package. In our case, because the same software provides the option to generate a DEM, we use the rasterise tool for the point cloud generated by the UAV flight and not for the two clouds together. This is because the results obtained through this process would need complex post-processing which would be excessive given the purpose of this article.
DEM Analysis and Interpretation
After obtaining the DEM we proceeded to analyse it using various visualisation techniques, mainly in high resolution DTMs [43]. This type of analysis was performed with the Relief Visualization Toolbox (RVT) software, Version 2.2.1, created by Žiga Kokalj from the Institute of Anthropological and Spatial Studies, ZRC SAZU. This is a standalone tool that does not require external software, such as QGIS, to function and it provides a wide range of methods for analysing the surface of a site, as well as the optimal configuration for the effective detection of small-scale archaeological features [44].
The following techniques are preconfigured by default:
- Analytical hillshading;
- Hillshading from multiple directions;
- Slope gradient;
- Sky-view factor (green lines);
- Anisotropic sky-view factor;
- Openness—positive;
- Openness—negative;
- Local dominance (blue lines);
- Simple local relief model (dark red lines).
Once the DTMs have been analysed using the visualisation techniques referred to, the results can be generated in GeoTiff format, making them ideal for working with using GIS software, in this case QGIS. Their analysis and interpretation were carried out manually and the results of each analysis were inserted as an independent raster layer within the GIS. Each image was subsequently analysed individually, and a new vector layer was created on it marking the identified elements. Each layer was given a different colour.
As the results were similar in some cases, only those obtained with techniques that enabled the identification of features that were not present in the other images are shown (Figures 7 and 9).
3. Results
The results obtained can be seen in Figure 7, Figure 8 and Figure 9. The different-coloured lines represent the different structures identified in each of the aforementioned analyses. For the final proposal of the site dimensions, the indications identified in each of the images were superimposed, so that finally the proposed structure that can be seen in Figure 9 measures 28.95 × 21.02 m2. This represents an area of 0.056 ha measured on the outer face of the walls in Area A and 0.133 in Area B, also measured on the outer face of the possible boundary walls. The approximate final size proposed for all the delimited areas is 44.57 × 34.45 m or 0.23 ha.
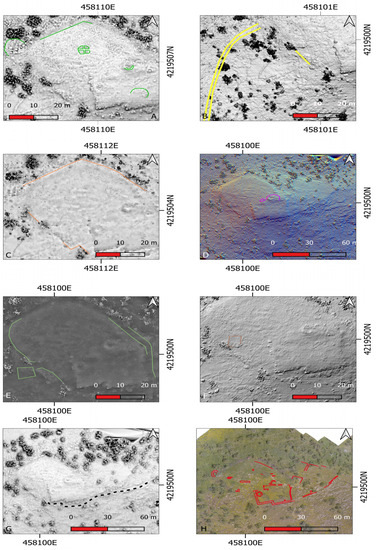
Figure 7.
Remains identified in the various visibility analyses performed on the DEM generated with the orthophoto. (A) SVF_R5_D16_NRstrong_8bit. (B) Slope. (C) OPEN NEG_R10_D16_NRstrong_8bit. (D) MULTI-HS_D16_H35_RGB. (E) MULTI-HS_D16_H35_RGB. (F) HS_A315_H45_8bit. (G) SVF-A_R10_D16_A75_AIlow_NRstrong_8bit. (H) Orthophotography. Referred coordinates in the EPSG: 25,830—ETRS89/UTM Zone 30N.
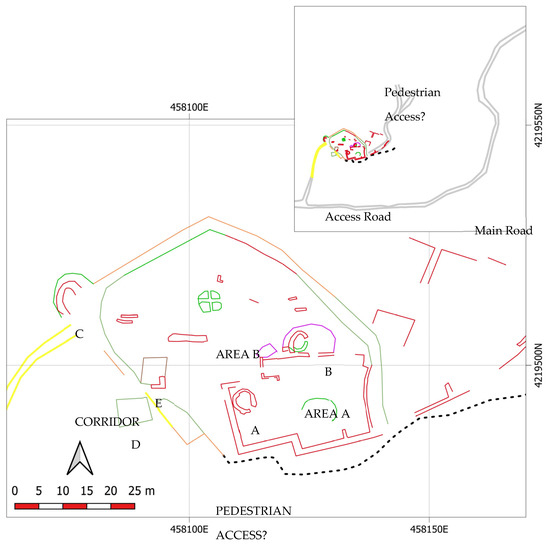
Figure 8.
Joint interpretation of the results obtained after visually analysing the results of the RVT analyses. (Top right) General view of the site with the identified communication routes. (Central area) Detail of the identified structures. Coordinates referred to EPSG: 25,830—ETRS89/UTM Zone 30N.
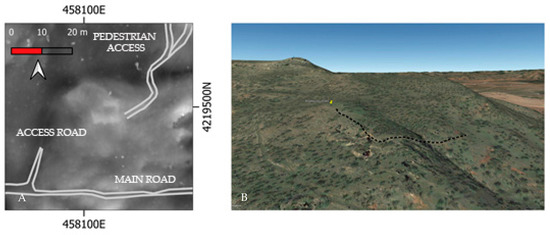
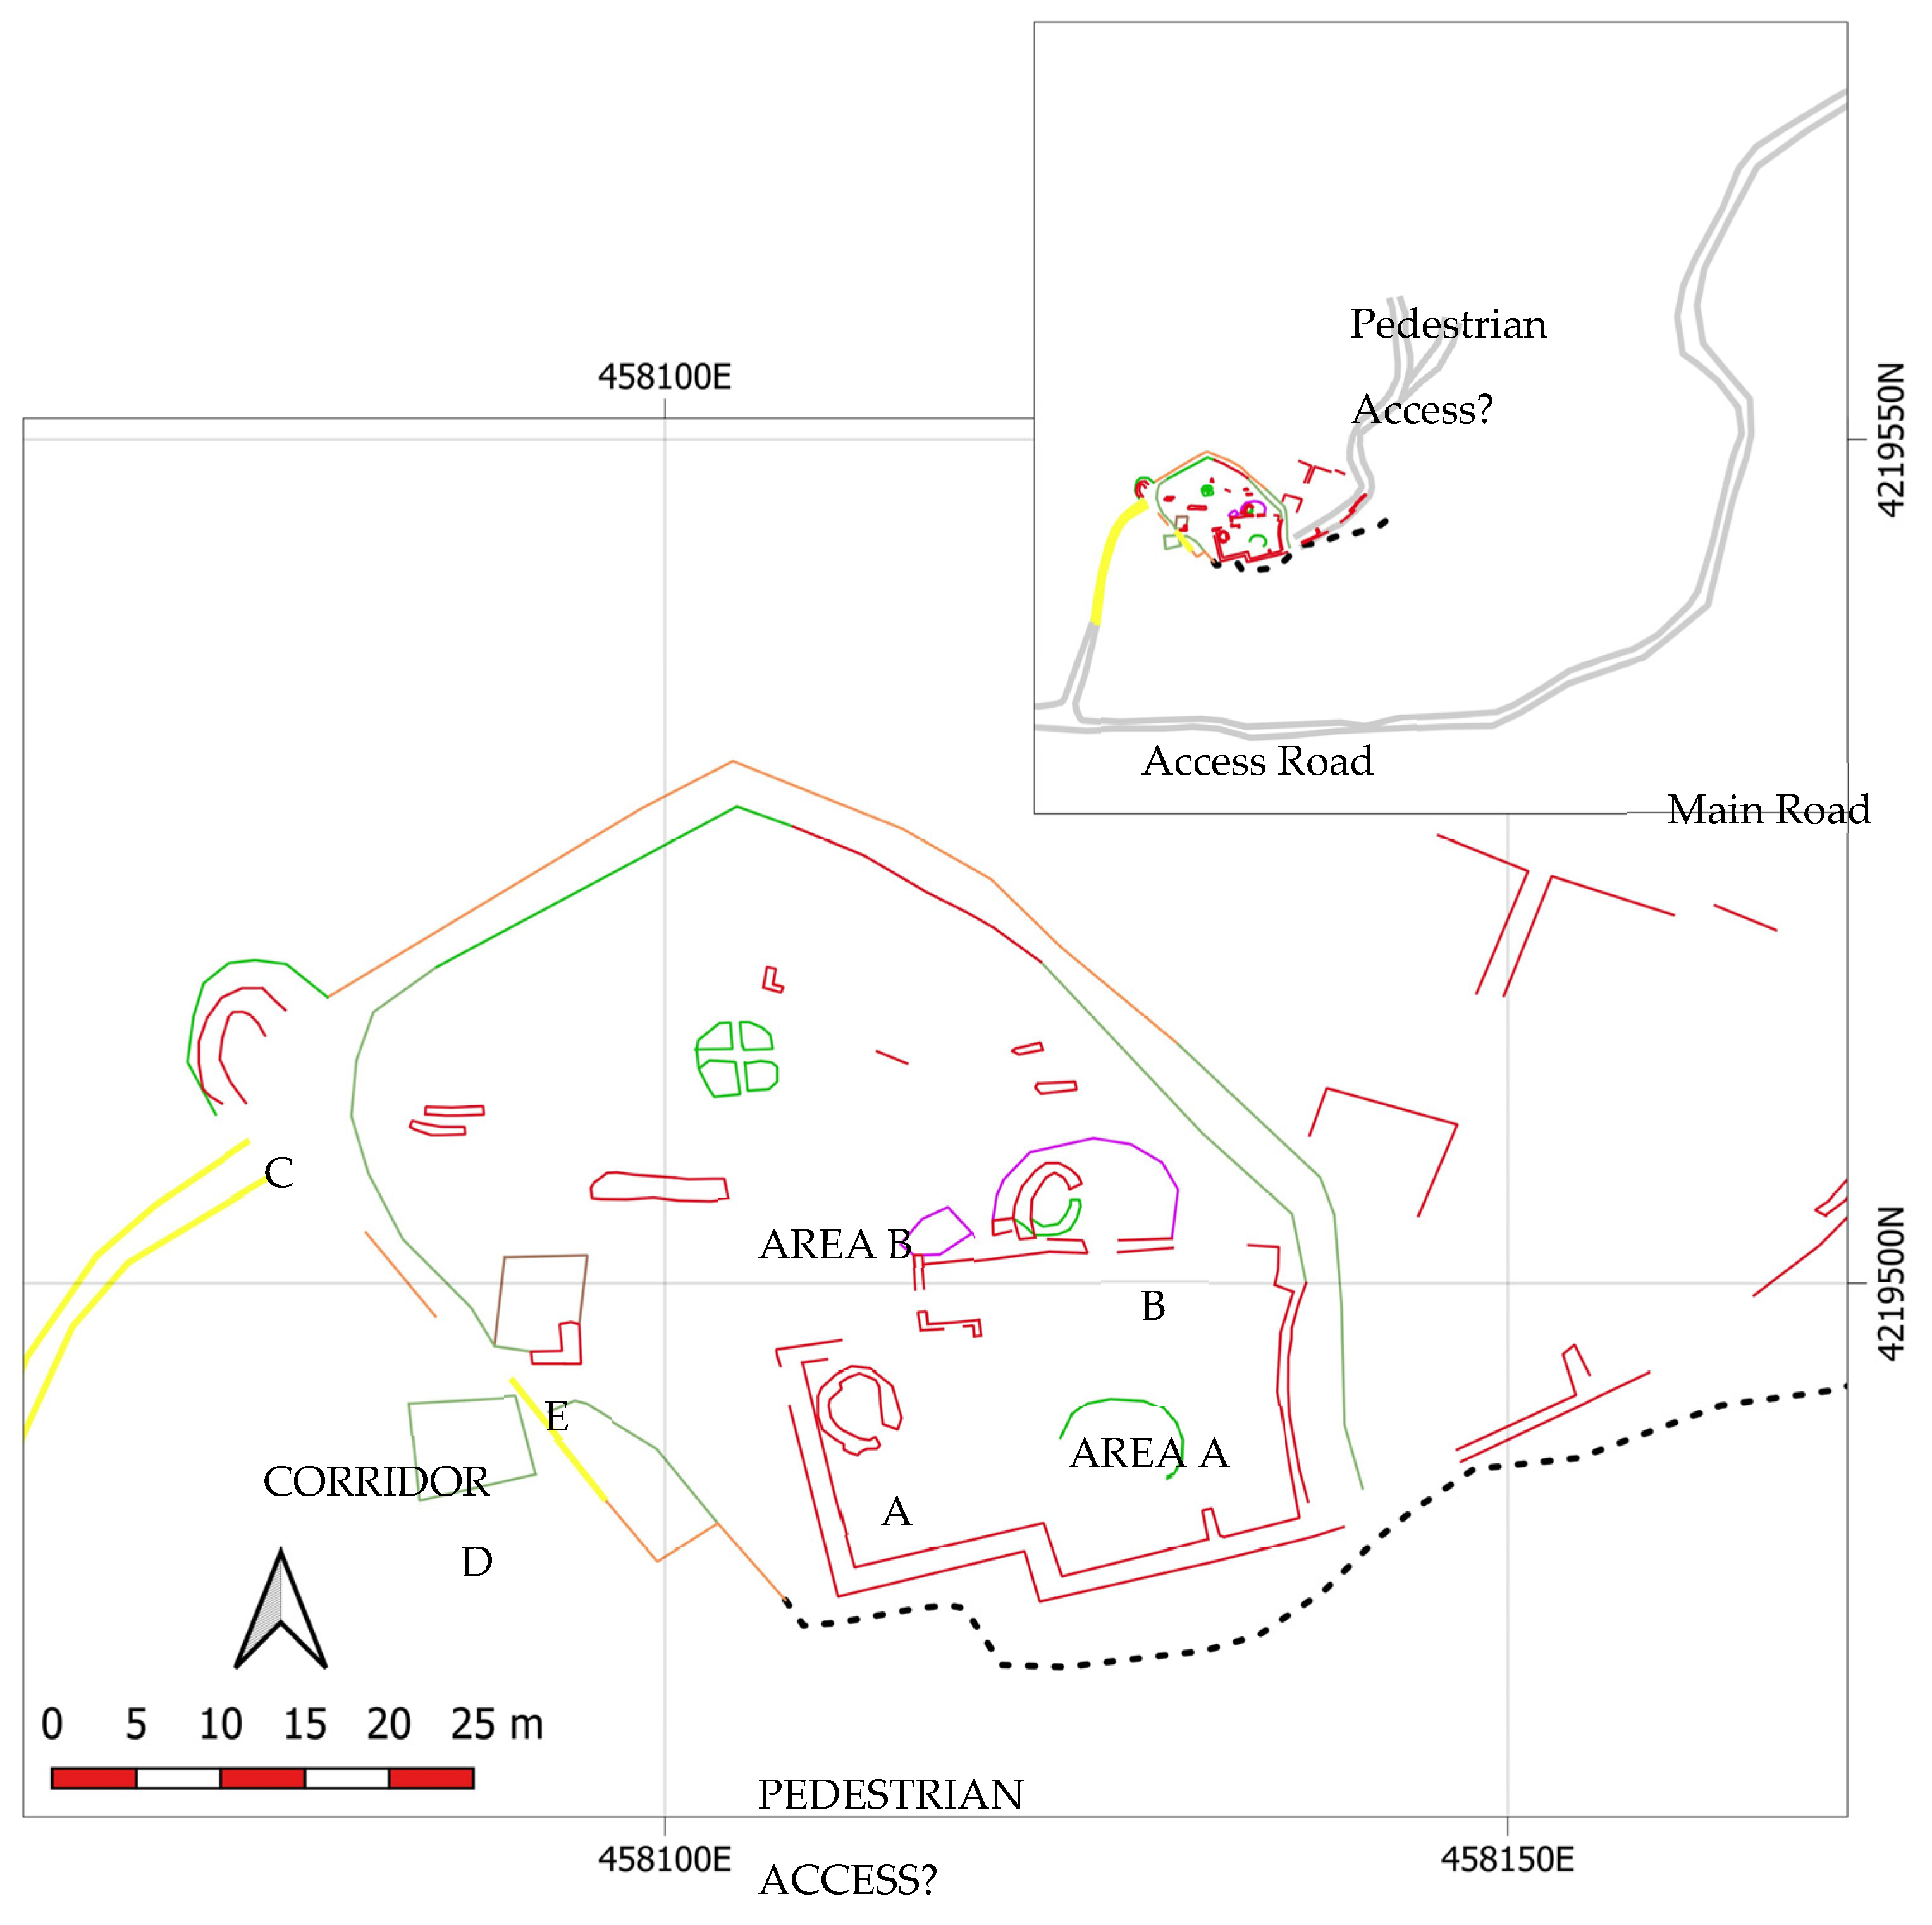
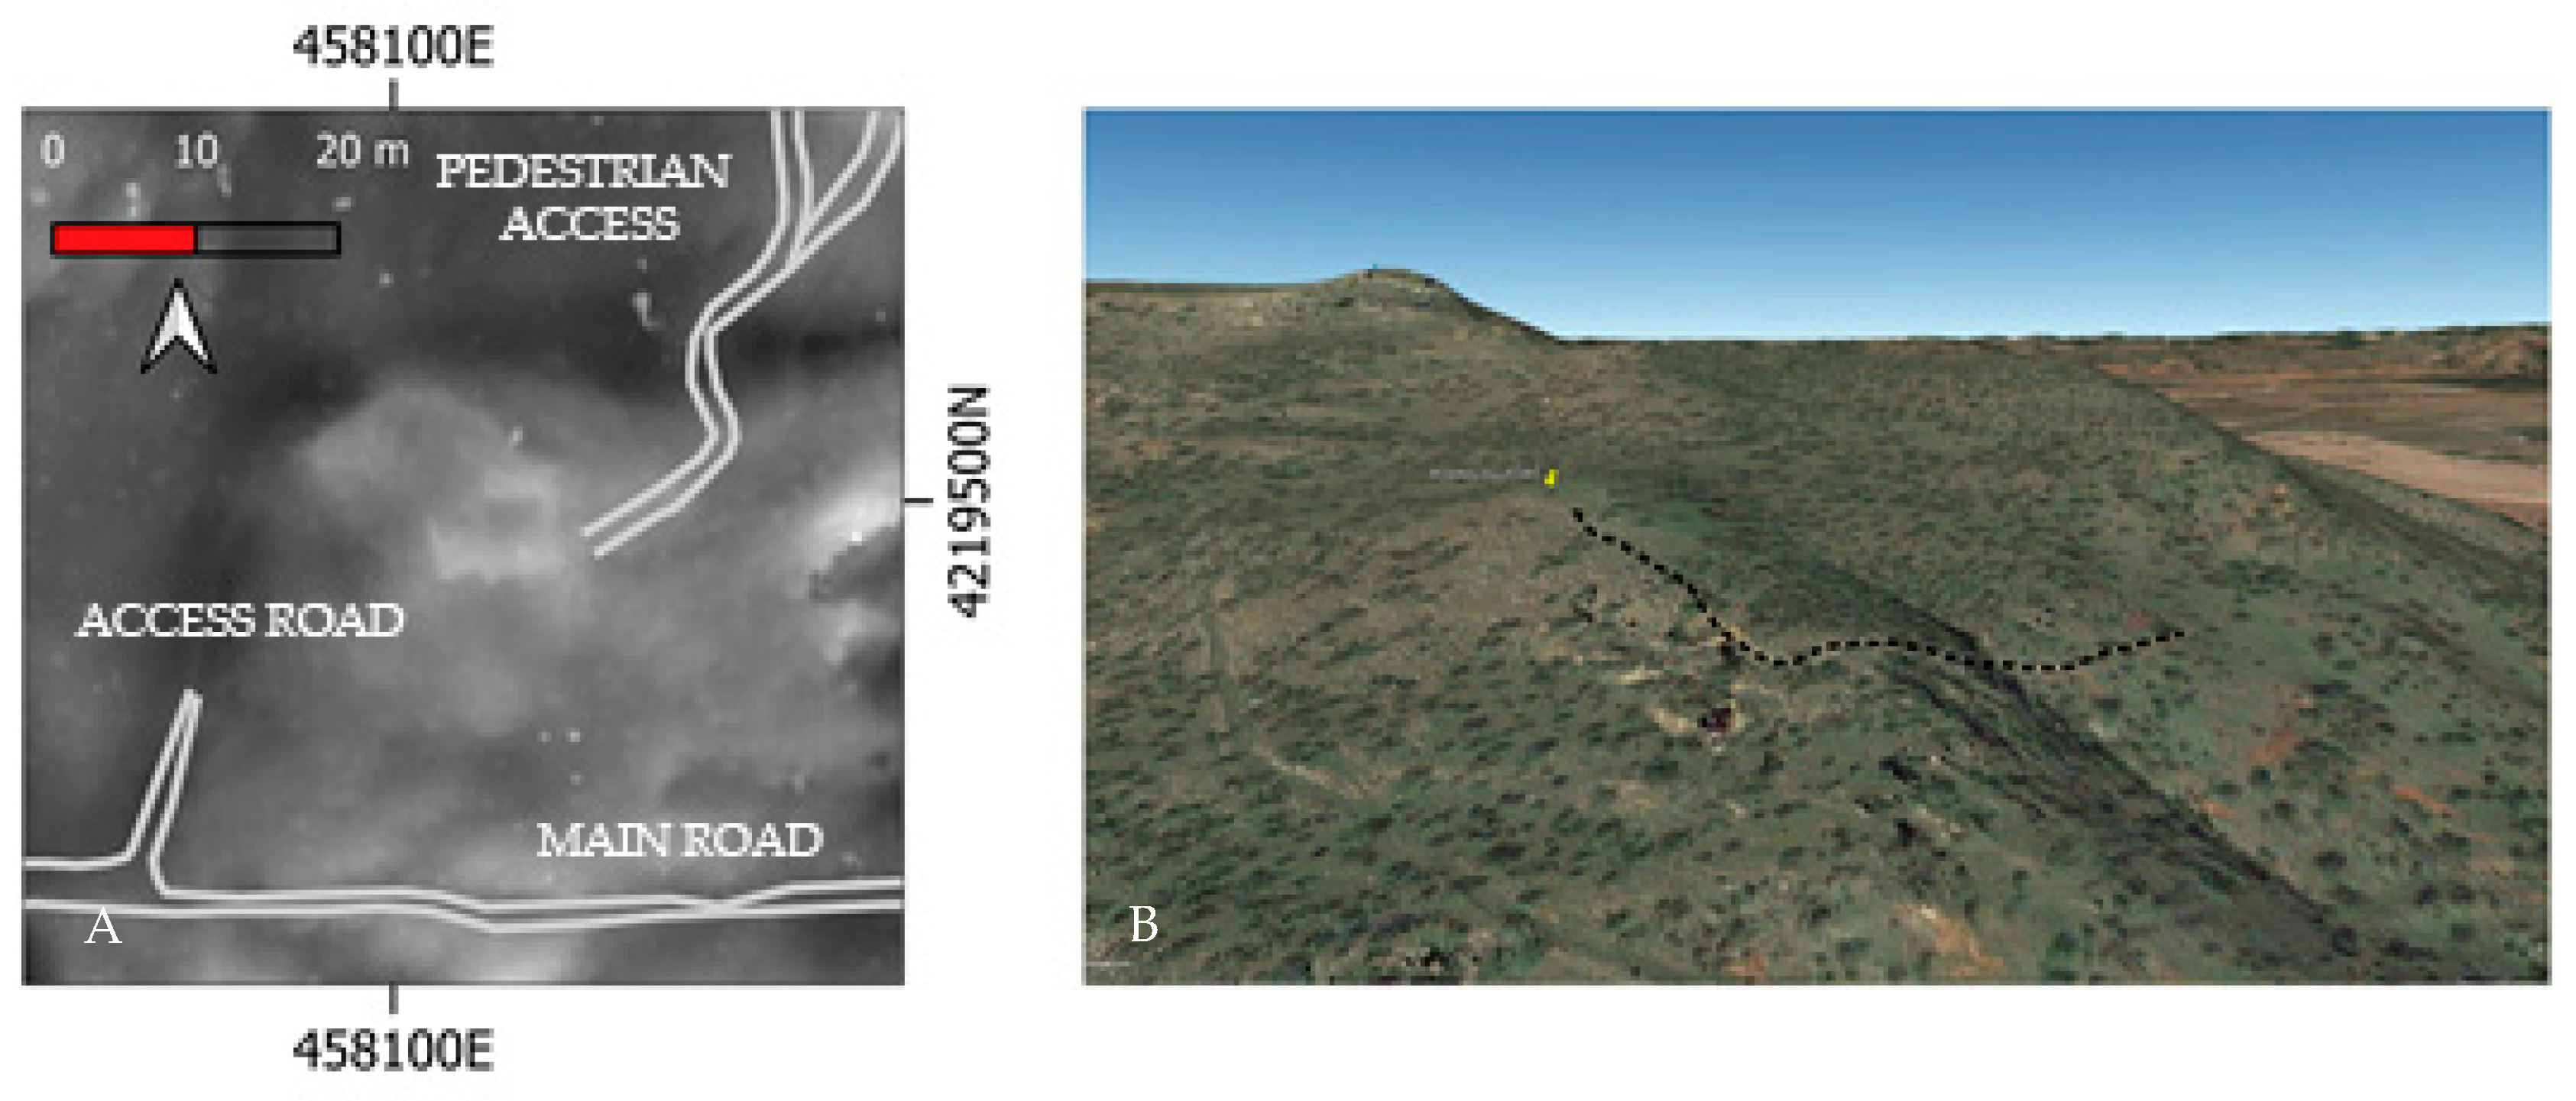
Figure 9.
(A) Possible access routes identified in the DEM generated with the IGN LiDAR data. The Main Road, Access Road and (possible) Pedestrian Access can be appreciated. In this case only the LD_R_M10-20_DI1_A15_OH1.7 technique is shown because no new data was revealed in the others. (B) Proposed Pedestrian Access route using Google Earth Pro. Coordinates referred to EPSG: 25,830—ETRS89/UTM Zone 30N.
Three circular structures reminiscent of towers were also identified and indicated by the letters A, B and C. Their approximate radiuses are:
- 2.44 m;
- 2.50 m;
- 3.39 m.
A priori, little compartmentalisation is documented in either of the areas, although in A you can gain an impression of remnants of it, as can be seen on the southern wall, as well as in the northern part.
Two possible new quadrangular structures reminiscent of access control towers inside an enclosure were also identified. Their dimensions are:
- D.
- 5.89 × 6.29 m2; with an area of 35.52 m2 (0.007 ha);
- E.
- 6.44 × 4.90 m2; with an area of 29.60 m2 (0.003 ha).
The corridor between the two structures has a minimum width of 2.89 m.
Three access roads have been identified (Figure 9):
Main Road. Its length has not been fully determined, as it exceeds the limits of the studied area, although it has been possible to identify its layout. It has an average width of 5.1 m, which would have allowed two carts to pass each other [45]. The documented length is 774.92 m and the average gradient is 5.2% on a slope of 12.4 m (359–388.41 m).
Access Road. This is different to the main road for various reasons. It is 100.79 m long and has a 17-m height difference (417–434 m); in this case it reaches a gradient of 16.84%, while its average width, 3.02 m, is also different. The documented width would also have allowed carts to access the enclosure, although in this case only one at a time, which we interpret as a security and control measure. However, this access road has a steep gradient, as it climbs from the main road to the archaeological site in a straight line. This leads us to believe that, in spite of its width, it would only have allowed small carts to access the interior of the enclosure, as the slope would have made it difficult to carry large loads.
Pedestrian Access (?). Finally, what appears to be a pedestrian access has been identified. It would have been bordered by the walls located to the south of Area A until it reached the southwestern corner of the enclosure, where its function as a pedestrian access seems to be indicated, as it is 2.67 m wide. Although this width would have allowed carts to use it, the same cannot be said of the route parallel to the enclosure wall of Area A that appears to run in a north-easterly direction. The length documented thanks to the SVF analysis (Figure 7G) is 91.60 m (black dotted line), although its length is confusing, as, according to both the DEM and the visual analysis, its layout, and consequently its length and width, vary. This can be seen if we take into account the dimensions documented in Figure 9, where the PNOA (National Aerial Orthophotography Plan) DEM was analysed. The Local Dominance technique was used to represent the routes of the identified roads, as it provided the most information. A possible bifurcation, which needs to be studied in the field, can be appreciated in the northeastern corner of Figure 9. The identified length is approximately 129.63 m and the average width is 4.5 m. Although, once again, the width could have allowed carts to travel along it, the orography of the route up to the flattened surface of the enclosure would have made this completely impossible.
4. Discussion
The results obtained here show the potential of the combined use of different remote sensing and terrestrial surveying techniques for the study of the territory, although it is true that, as we have seen throughout the article, it has some limitations and its combined use and fusion with other research techniques is common practice. In the case we have presented, part of the results were based on the analysis of Digital Elevation Models that were created artificially, which can lead to confusion. This means the fieldwork phase to compare the results obtained should never be omitted. It is in this area that the methodology outlined offers the greatest advantage, as it allows savings in time spent on fieldwork and the attendant costs. This is because less equipment is needed to compare the results and the zones key to understanding the area under study can be accessed directly. Thanks to this type of analysis, the archaeological survey and excavation campaign can be designed to address specific aspects. This allows the optimisation of the results and reduces costs and working time.
The improved knowledge gained of a specific archaeological area thanks to the low-cost, easy-way approach can be a stimulus for continuing with a stagnant investigation, as it allows for the generation of new research hypotheses. This methodology helps to truly democratise access to the newest technologies by non-specialist researchers and archaeologists. It allows them to continue with their research when funds are scarce and to more easily implement conservation policies that could help protect our cultural heritage. This has been the experience in other regions, such us Boastro (Andalusia, Spain) [34], Caracol (Belize) [28], and northeastern Romania [23,24], among others.
Certain expenses, such as the UAV pilot’s license and equipment such as the UAV and RTK receiver, are unavoidable. However, the investment required is relatively small and the equipment purchased can be reused in future projects, thus spreading the investment. In fact, the cost of obtaining a UAV pilot’s license is falling (currently in Spain it costs approximately €400) and thanks to the most recent European regulations, it is valid all over Europe. Moreover, many research bodies have their own equipment obtained from other research projects, departments, etc., that can be used by researchers. If this equipment is not available, a very high precision RTK receiver can be purchased at a very low price, for example, the one used in this study. Even using a mini UAV with a GPS/inertial-measurement unit-based stabiliser, it is easy to fly precisely along a predefined flight path and to change the different viewing directions for image acquisition. A low-cost UAV [35] can be bought for under €1000 (The interested reader can contact the authors for further details).
Thanks to the easiness of the processes described, any researcher with a basic knowledge of computer science and geography will be able to advance in the study of cases in which vegetation is scarce and, more importantly, it will allow the investigation of a specific area to continue.
We are aware that the methodology can be improved by carrying out a more precise and detailed fusion of the datasets, by undertaking specific LiDAR flights, and, of course, and most importantly, by being able to count on a team of geodesic and cartographic engineers, aerial photography specialists, etc., who will help achieve optimal results.
The methodology has proven to be effective for the identification of the smallest archaeological structures in areas with sparse vegetation, as well as for larger features, such as roads. Again, the combined analysis of public LiDAR data together with surface analysis using advanced visualisation techniques, as well as various analyses performed in GIS, can help in the identification of archaeological features that would otherwise be impossible to discover.
As we have seen, a DTM generated from an orthophotograph has major potential for identifying small archaeological structures, as its resolution is very high. Thanks to both the DTM and the orthophotography taken with UAVs, it has been possible to advance considerably in the knowledge of the Giribaile fortified enclosure and establish hypotheses regarding its internal structure.
The contribution of the initial results based on the use of this combined methodology is of great interest in specific cases such as the one discussed here, which is characterised by a low presence of pottery in the surface collection records. It may also predetermine areas of interest for a future archaeological excavation campaign that would be able to confirm the initial hypotheses that have taken into account strategic considerations regarding the location of the archaeological site in relation to the Giribaile settlement. It may have been a site protected by fortification systems, among which of particular interest are several towers identified on the access road to the plateau on which it is situated. To date, no similar site belonging to the Iberian culture of the Upper Guadalquivir has been excavated. This makes it particularly important, since only a town of the size of Giribaile would have been capable of establishing a complex control and advanced defence system in the territory. Only an archaeological excavation campaign, however, can definitively confirm this point.
5. Conclusions
We do not claim that this methodology and its results are exhaustive or new. However, they do provide an accessible methodology—both financially and technically—that will allow archaeological research to be continued in a specific area in cases where there are administrative, economic, sanitary, etc. limitations.
The effectiveness of the combined use of data from different sources, including aerial photogrammetry, LiDAR data, and surface surveying, has proved to be useful and accessible to a wide range of researchers.
Despite the encouraging nature of the results presented here, we should never fail to visit the area under study to carry out an archaeological survey and, whenever possible, an excavation. This is the only way to confirm or rule out the hypotheses generated. In addition, the need to include specialists in topography should not be overlooked, as this will allow progress to be made in the documentation of the territory.
The proposed case of Giribaile should be properly investigated, but the determination of the points of interest revealed in this study contains considerable research potential for solving specific questions regarding the historical hypotheses raised.
Author Contributions
Conceptualisation, A.J.O.-V. and L.-M.G.S.; formal analysis, A.J.O.-V.; funding acquisition, L.-M.G.S.; investigation, A.J.O.-V.; methodology, A.J.O.-V. and L.-M.G.S.; project administration, L.-M.G.S.; resources, A.J.O.-V. and L.-M.G.S.; software, A.J.O.-V.; validation, A.J.O.-V.; visualisation, L.-M.G.S.; writing—original draft, A.J.O.-V. All authors have read and agreed to the published version of the manuscript.
Funding
This research was funded by the Ministerio de Economía y Competitividad (Spain); “Ciudad fortificada de Giribaile, estudios de poliorcética. El caso de la fortificación de compartimentos de tipo barrera (HAR2016-77750-P)”, I+D Projects. This paper has been granted by the Research Group PAIDI-HUM357 (GIPAJ).
Data Availability Statement
Not applicable.
Conflicts of Interest
The authors declare no conflict of interest.
References
- Ortiz Villarejo, A.J. El Área 11 de Giribaile ¿Puerta Al Mediterráneo? In Creando Redes Doctorales; Universidad de Jaén: Jaén, Spain, 2019; p. 446. [Google Scholar]
- La Segunda Guerra Púnica En La Península Ibérica. Baecula, Arqueología de Una Batalla; Bellón, J.P.; Arturo, R.; Molinos, M.; Gómez, F.; Rueda, C. (Eds.) Servicio de Publicaciones de la Universidad de Jaén: Torredonjimeno, Spain, 2015. [Google Scholar]
- Gutiérrez Soler, L.M.; Corpas, F. Estudio Topográfico de La Fundición de La Laguna En El Entorno de Giribaile (Vilches, Jaén). In Minería y metalurgia en el Mediterráneo y su periferia oceánica. Actas de Phicaria III Encuentros Internacionales del Mediterráneo; López Ballesta, M.J., Ed.; Universidad Popular de Mazarrón: Murcia, Spain, 2015; pp. 280–287. [Google Scholar]
- Ortiz Villarejo, A.; Giribaile, J. Estrategias de Ocupación Económica Asociadas Al Dominio Del Territorio Durante Los Siglos IV—III a.C.; Universidad de Jaén: Jaén, Spain, 2019; ISBN 9788491591979. [Google Scholar]
- Jaén, Tierra Ibera: 40 Años de Investigación y Transferencia, 1a; Ruiz, A.; Molinos, M. (Eds.) Universidad de Jaén: Jaén, Spain, 2015. [Google Scholar]
- Villarejo, A.J.O.; Soler, L.M.G.; Armijo, M.A. More than Mudbrick. Construction with Earth during the Fourth and Third Centuries BC in Area 11 of Giribaile (Vilches, Jaén). Lucentum 2019, 38, 171. [Google Scholar] [CrossRef]
- Villarejo, A.J.O.; Soler, L.M.G.; Armijo, M.A. The Area 11 of Giribaile. Architectural Structure and Building Materials of an Iberian Warehouse on IV-II BC. Arch. Esp. Arqueol. 2020, 93, 81–101. [Google Scholar] [CrossRef]
- Soler, L.M.G.; Villarejo, A.J.O.; Vico, D.M.; Sáez, J.A.A. The Iberian Fortifications of Giribaile? A Formal Characterisation and Architectural Interpretation of the Drawer Wall. Pyrenae 2021, 52, 35–60. [Google Scholar] [CrossRef]
- Gutiérrez Soler, L.M. Microprospección Arqueológica En Giribaile (Vilches, Jaén), Protocolo de Trabajo. Trab. Prehist. 2010, 67, 7–35. [Google Scholar] [CrossRef]
- Attema, P.; Bintliff, J.; Van Leusen, M.; Bes, P.; De Haas, T.; Donev, D.; Jongman, W.; Kaptijn, E.; Mayoral, V.; Menchelli, S.; et al. A guide to good practice in Mediterranean surface survey projects. J. Greek Archaeol. 2020, 5, 1–62. [Google Scholar] [CrossRef]
- Gutiérrez, L.M.; Royo, M.A.; Bellón, J.P.; Barba, V. Microprospección de Superficie En El Entorno Del Monumento. In El Santuario Heroico de “El Pajarillo” Huelma (Jaén); Molinos, M., Chapa, T., Rodríguez, A.R., Pereira, J., Rísquez, C., Madrigal, A., Esteban, A., Mayoral, V., Llorente, M., Eds.; Servicio de Publicaciones de la Universidad de Jaén: Jaén, Spain, 1998; pp. 161–215. [Google Scholar]
- Ruiz Rodríguez, A.; Molinos, M.; Gutiérrez, L.M.; Bellón, J.P. El Modelo Político Del Pago En El Alto Guadalquivir (s. IV-III a.n.E.). In Actas de la Taula Rodona celebrada a Ullastret: Territori polític i territori rural durant l´edat del Ferro a la Mediterrània Occi-dental; Museu d´Arqueologia de Catalunya Ullastret: Barcelona, Spain, 2001; pp. 11–22. [Google Scholar]
- Martínez, J.; Rey, J.; Gutiérrez, L.; Novo, A.; Ortiz, A.; Alejo, M.; Galdón, J. Electrical resistivity imaging (ERI) and ground-penetrating radar (GPR) survey at the Giribaile site (upper Guadalquivir valley; southern Spain). J. Appl. Geophys. 2015, 123, 218–226. [Google Scholar] [CrossRef]
- Luo, L.; Wang, X.; Guo, H.; Lasaponara, R.; Zong, X.; Masini, N.; Wang, G.; Shi, P.; Khatteli, H.; Chen, F.; et al. Airborne and spaceborne remote sensing for archaeological and cultural heritage applications: A review of the century (1907–2017). Remote Sens. Environ. 2019, 232, 111280. [Google Scholar] [CrossRef]
- Campana, S. Drones in Archaeology. State-of-the-art and Future Perspectives. Archaeol. Prospect. 2017, 24, 275–296. [Google Scholar] [CrossRef]
- Verhoeven, G. New Technologies, Methodologies, and Procedures for the Beneet of Aerial Archaeological Data Acqui-sition and Analysis Beyond Conventional Boundaries; Nautilus Academic Books: Zelzate, Belgium, 2009. [Google Scholar]
- Waagen, J. New technology and archaeological practice. Improving the primary archaeological recording process in excavation by means of UAS photogrammetry. J. Archaeol. Sci. 2018, 101, 11–20. [Google Scholar] [CrossRef]
- Limp, W.F. Measuring the Face of the Past and Facing the Measurement. In Digital Methods and Remote Sensing in Archaeology. Archaeology in the Age of Sensing; Forte, M., Campana, S., Eds.; Springer International Publishing: Cham, Switzerland, 2016; pp. 349–369. ISBN 978-3-319-40658-9. [Google Scholar]
- Carrera-Hernández, J.J.; Levresse, G.; Lacan, P.; Aranda-Gómez, J.J. A Low Cost Technique for Development of Ultra-High Resolution Topography: Application to a Dry Maar’s Bottom. Rev. Mex. Cienc. Geol. 2016, 33, 122–133. [Google Scholar] [CrossRef]
- Fernández-Hernandez, J.; Gonzalezaguilera, D.; Rodríguez-Gonzálvez, P.; Mancerataboada, J. Image-Based Modelling from Unmanned Aerial Vehicle (UAV) Photogrammetry: An Effective, Low-Cost Tool for Archaeological Applications. Archaeometry 2014, 57, 128–145. [Google Scholar] [CrossRef]
- Ostrowski, W.; Hanus, K. Budget Uav Systems for the Prospection of Small-And Medium-Scale Archaeological Sites. In International Archives of the Photogrammetry, Remote Sensing and Spatial Information Sciences—ISPRS Archives; International Society for Photogrammetry and Remote Sensing: Prague, Czech Republic, 2016; Volume 2016, pp. 971–977. [Google Scholar] [CrossRef]
- Holata, L.; Plzák, J.; Světlík, R.; Fonte, J. Integration of Low-Resolution ALS and Ground-Based SfM Photogrammetry Data. A Cost-Effective Approach Providing an ‘Enhanced 3D Model’ of the Hound Tor Archaeological Landscapes (Dartmoor, South-West England). Remote Sens. 2018, 10, 1357. [Google Scholar] [CrossRef] [Green Version]
- Asăndulesei, A. Inside a Cucuteni Settlement: Remote Sensing Techniques for Documenting an Unexplored Eneolithic Site from Northeastern Romania. Remote Sens. 2017, 9, 41. [Google Scholar] [CrossRef] [Green Version]
- Asăndulesei, A.; Tencariu, F.A.; Nicu, I.C. Pars pro toto—Remote Sensing Data for the Reconstruction of a Rounded Chalcolithic Site from NE Romania: The Case of Ripiceni–Holm Settlement (Cucuteni Culture). Remote Sens. 2020, 12, 887. [Google Scholar] [CrossRef] [Green Version]
- IGN. Centro de Descargas del IGN. Available online: https://centrodedescargas.cnig.es/CentroDescargas/index.jsp (accessed on 5 June 2020).
- Centro Nacional de Información Geográfica. Available online: https://www.ign.es/web/ign/portal/qsm-cnig (accessed on 6 May 2020).
- REAL DECRETO 1071/2007. In De 27 de Julio, Por El Que Se Regula El Sistema Geodésico de Refe_rencia Oficial En España; BOE: Madrid, Spain, 2007; pp. 35986–35989.
- Chase, A.F.; Chase, D.Z.; Weishampel, J.F.; Drake, J.B.; Shrestha, R.L.; Slatton, K.C.; Awe, J.J.; Carter, W.E. Airborne LiDAR, archaeology, and the ancient Maya landscape at Caracol, Belize. J. Archaeol. Sci. 2011, 38, 387–398. [Google Scholar] [CrossRef]
- Hesse, R. LiDAR-Derived Local Relief Models—A new tool for archaeological prospection. Archaeol. Prospect. 2010, 17, 67–72. [Google Scholar] [CrossRef]
- Berrocal-Rangel, L.; Díaz, P.P.; Ruano, L.; Valcárcel, G.R.M. Aplicaciones LiDAR a la topografía arqueológica: El Castro de Irueña (Fuenteguinaldo, Salamanca)/LiDAR applications to the archaeological topography: The Irueña Hillfort (Fuenteguinaldo, Salamanca). Cuad. De Prehist. Y Arqueol. 2017, 43, 195–215. [Google Scholar] [CrossRef] [Green Version]
- Khan, S.; Aragão, L.; Iriarte, J. A UAV–Lidar system to map Amazonian rainforest and its ancient landscape transformations. Int. J. Remote Sens. 2017, 38, 2313–2330. [Google Scholar] [CrossRef]
- Johnson, K.; Ouimet, W.B. Rediscovering the lost archaeological landscape of southern New England using airborne light detection and ranging (LiDAR). J. Archaeol. Sci. 2014, 43, 9–20. [Google Scholar] [CrossRef]
- Rueda, C.; Rodríguez, A.; Moreno, M.I.; Gómez, F.; Gutiérrez, L.M.; Arjonilla, A.; Martínez, A.L.; Mora, C.; Ruiz, A. La Cerámica En El Cerro de Las Albahacas y En El Oppidum de Los Turruñuelos. In La segunda guerra púnica en la península ibérica. Baecula, arqueología de una batalla; Bellón, J.P., Ruiz, A., Molinos, M., Rueda, C., Gómez, F., Eds.; Servicio de Publicaciones de la Universidad de Jaén: Torredonjimeno, Spain, 2015; pp. 477–519. [Google Scholar]
- Enríquez, C.; Jurado, J.; Bailey, A.; Callén, D.; Collado, M.; Espina, G.; Marroquín, P.; Oliva, E.; Osla, E.; Ramos, M.; et al. The UAS-Based 3D Image Characterization of Mozarabic Church Ruins in Bobastro (Malaga), Spain. Remote Sens. 2020, 12, 2377. [Google Scholar] [CrossRef]
- Dubbini, M.; Curzio, L.I.; Campedelli, A. Digital elevation models from unmanned aerial vehicle surveys for archaeological interpretation of terrain anomalies: Case study of the Roman castrum of Burnum (Croatia). J. Archaeol. Sci. Rep. 2016, 8, 121–134. [Google Scholar] [CrossRef] [Green Version]
- Mancini, F.; Dubbini, M.; Gattelli, M.; Stecchi, F.; Fabbri, S.; Gabbianelli, G. Using Unmanned Aerial Vehicles (UAV) for High-Resolution Reconstruction of Topography: The Structure from Motion Approach on Coastal Environments. Remote Sens. 2013, 5, 6880–6898. [Google Scholar] [CrossRef] [Green Version]
- Kršák, B.; Blistan, P.; Pauliková, A.; Puškárová, P.; Kovanič, L.; Palková, J.; Zelizňaková, V. Use of low-cost UAV photogrammetry to analyze the accuracy of a digital elevation model in a case study. Measurement 2016, 91, 276–287. [Google Scholar] [CrossRef]
- Agüera-Vega, F.; Carvajal-Ramírez, F.; Carricondo, P.J.M. Assessment of photogrammetric mapping accuracy based on variation ground control points number using unmanned aerial vehicle. Measurement 2017, 98, 221–227. [Google Scholar] [CrossRef]
- Schonberger, J.L.; Frahm, J.-M. Structure-from-Motion Revisited. In Proceedings of the IEEE Conference on Computer Vision and Pattern Recognition, Las Vegas, NV, USA, 27–30 June 2016; pp. 4104–4113. [Google Scholar] [CrossRef]
- QGIS Un Sistema de Información Geográfica libre y de Código Abierto. Available online: https://qgis.org/es/site/ (accessed on 2 February 2019).
- LAStools. Available online: http://lastools.org/ (accessed on 6 May 2020).
- SuMapa.com Mapas Como los Quiera para lo que Quiera. Available online: http://sumapa.com/ (accessed on 6 May 2020).
- Mayoral, A.; Toumazet, J.P.; Simon, F.X.; Vautier, F.; Peiry, J.L. The Highest Gradient Model: A New Method for Analytical Assessment of the Efficiency of Lidar-Derived Visualization Techniques for Landform Detection and Mapping. Remote Sens. 2017, 9, 120. [Google Scholar] [CrossRef] [Green Version]
- Kokalj, Ž.; Zaksek, K.; Oštir, K.; Čotar, K. Relief Visualization Toolbox, Version 1.3, Manual Special Issue “Applications of Micro-and Nano-Satellites for Earth Observation” View Project; ZaloŽba ZRC: Ljubljana, Slovenia, 2017. [Google Scholar]
- Bonet Rosado, H.; Vives-Ferrándiz Sánchez, J. Sistemas de Acceso y Puertas de Los Poblados Ibéricos Del País Valenciano. Rev. D’arqueologia Ponent 2009, 19, 287–306. [Google Scholar]


Publisher’s Note: MDPI stays neutral with regard to jurisdictional claims in published maps and institutional affiliations. |
© 2021 by the authors. Licensee MDPI, Basel, Switzerland. This article is an open access article distributed under the terms and conditions of the Creative Commons Attribution (CC BY) license (https://creativecommons.org/licenses/by/4.0/).