Abstract
The dynamics of terrestrial vegetation have changed a lot due to climate change and direct human interference. Monitoring these changes and understanding the mechanisms driving them are important for better understanding and projecting the Earth system. Here, we assessed the dynamics of vegetation in a semi-arid region of Northwest China for the years from 2000 to 2019 through satellite remote sensing using Vegetation Index (VI) data from the Moderate Resolution Imaging Spectroradiometer (MODIS), and analyzed the interannual covariation between vegetation and three climatic factors—air temperature, precipitation, and vapor pressure deficit (VPD)—at nine meteorological stations. The main findings of this research are: (1) herbaceous land greened up much more than forests (2.85%/year vs. 1.26%/year) in this semi-arid region; (2) the magnitudes of green-up for croplands and grasslands were very similar, suggesting that agricultural practices, such as fertilization and irrigation, might have contributed little to vegetation green-up in this semi-arid region; and (3) the interannual dynamics of vegetation at high altitudes in this region correlate little with temperature, precipitation, or VPD, suggesting that factors other than temperature and moisture control the interannual vegetation dynamics there.
1. Introduction
Climate change [1,2,3,4] and direct human interference [5,6,7,8] have changed terrestrial vegetation dynamics greatly. Significant efforts have been undertaken to monitor these changes and to understand the mechanisms driving them, so as to better understand and project the Earth system [9].
There have been numerous studies investigating vegetation dynamics and their driving factors at various spatial and temporal scales (e.g., [10,11,12,13,14]). Among these, the dynamics of vegetation in semi-arid regions are of particular interest [15,16,17], for several reasons. First, ecosystems of semi-arid regions are easily affected by climate change and human interference [18,19,20,21,22,23]. Second, because vegetation in semi-arid landscapes has large interannual variability compared to in other systems, it is especially important to understand these dynamics in order to clarify their roles in the global carbon cycle [24,25]. Third, the dynamics of vegetation in semi-arid regions affect the availability of water resources [26,27]. Fourth, variations of vegetation in semi-arid regions have the potential to cause feedback to climate warming through changes in albedo and evapotranspiration [28,29,30,31,32].
Northwest China is one of the largest semi-arid regions in the world [33], with an area of 790,000 km2, about 8% of the land area of China. Multiple ecological engineering projects are carried out here, such as the Three-North Shelter Forest program [34] and the Grain for Green project [35]. How the vegetation evolves in this semi-arid region not only affects the local environment and socio-economic development, but also has implications for the carbon cycle [6,24], water cycle [27,36], and energy exchange [29], at the local, regional, and global scales. Thus, it is informative to investigate the vegetation dynamics in semi-arid regions of Northwest China, their drivers, and their environmental consequences.
Chen et al. [8] assessed the global interannual dynamics of leaf area index for the period from 2000 to 2017, claiming that China and India lead in the greening of the world through land-use management. Piao et al. [28] suggested a weakening relationship between interannual temperature variability and northern vegetation activity. The research was based on satellite remote sensing and reanalysis meteorological data from the Climate Research Unit, University of East Anglia [37]. The spatial resolution of this investigation was 0.5° × 0.5°, which is very coarse for the highly heterogeneous landscapes of Northwest China. As a consequence, in that study, some insights about the relationship between vegetation and temperature might have been missed. Yuan et al. [2] suggested that increased vapor pressure deficit reduces global vegetation growth, while Liu et al. [38] suggested that soil moisture dominated water stress on ecosystem production. As for the methods for deriving the trends of vegetation greenness, the ordinary least squares method and Sen’s method [39] have usually been applied.
There are some gaps in the previous literature. First, vegetation dynamics have not been assessed by land cover types in the semi-arid regions of Northwest China. Vegetation dynamics differ by land cover type, and an analysis of the differences could lead to a better understanding of the nature of these vegetation changes. Second, a detailed analysis of the relationship between interannual vegetation change and air temperature, using satellite remote sensing as well as direct measurements from meteorological stations, is missing. Third, limited work has been done to compare the effects of precipitation and atmospheric vapor pressure deficit (VPD) on the interannual dynamics of vegetation, specifically in semi-arid regions.
Air temperature and vapor pressure deficit impact the vegetation photosynthesis rate through their respective mechanisms. Temperature affects the efficiency of photosynthetic enzymes in leaf cells, while VPD affects the leaf stomata opening, which determines how much CO2 is available to leaf chloroplasts. Hence, air temperature and VPD are important for vegetation dynamics.
Here, we assessed the dynamics of vegetation in a semi-arid region of Northwest China for the years from 2000 to 2019 through satellite remote sensing and analyzed the interannual covariation between vegetation and three climatic factors—air temperature, precipitation, and VPD—at nine meteorological stations. The main goals of this study are: (1) to quantify the interannual dynamics of vegetation in this semi-arid region in the years from 2000 to 2019, especially for the various land cover types; (2) to see if the vegetation greening has a positive or negative effect on local temperature; and (3) to evaluate the effects of precipitation and VPD on the interannual dynamics of vegetation in semi-arid regions.
2. Study Area and Data
2.1. Study Area
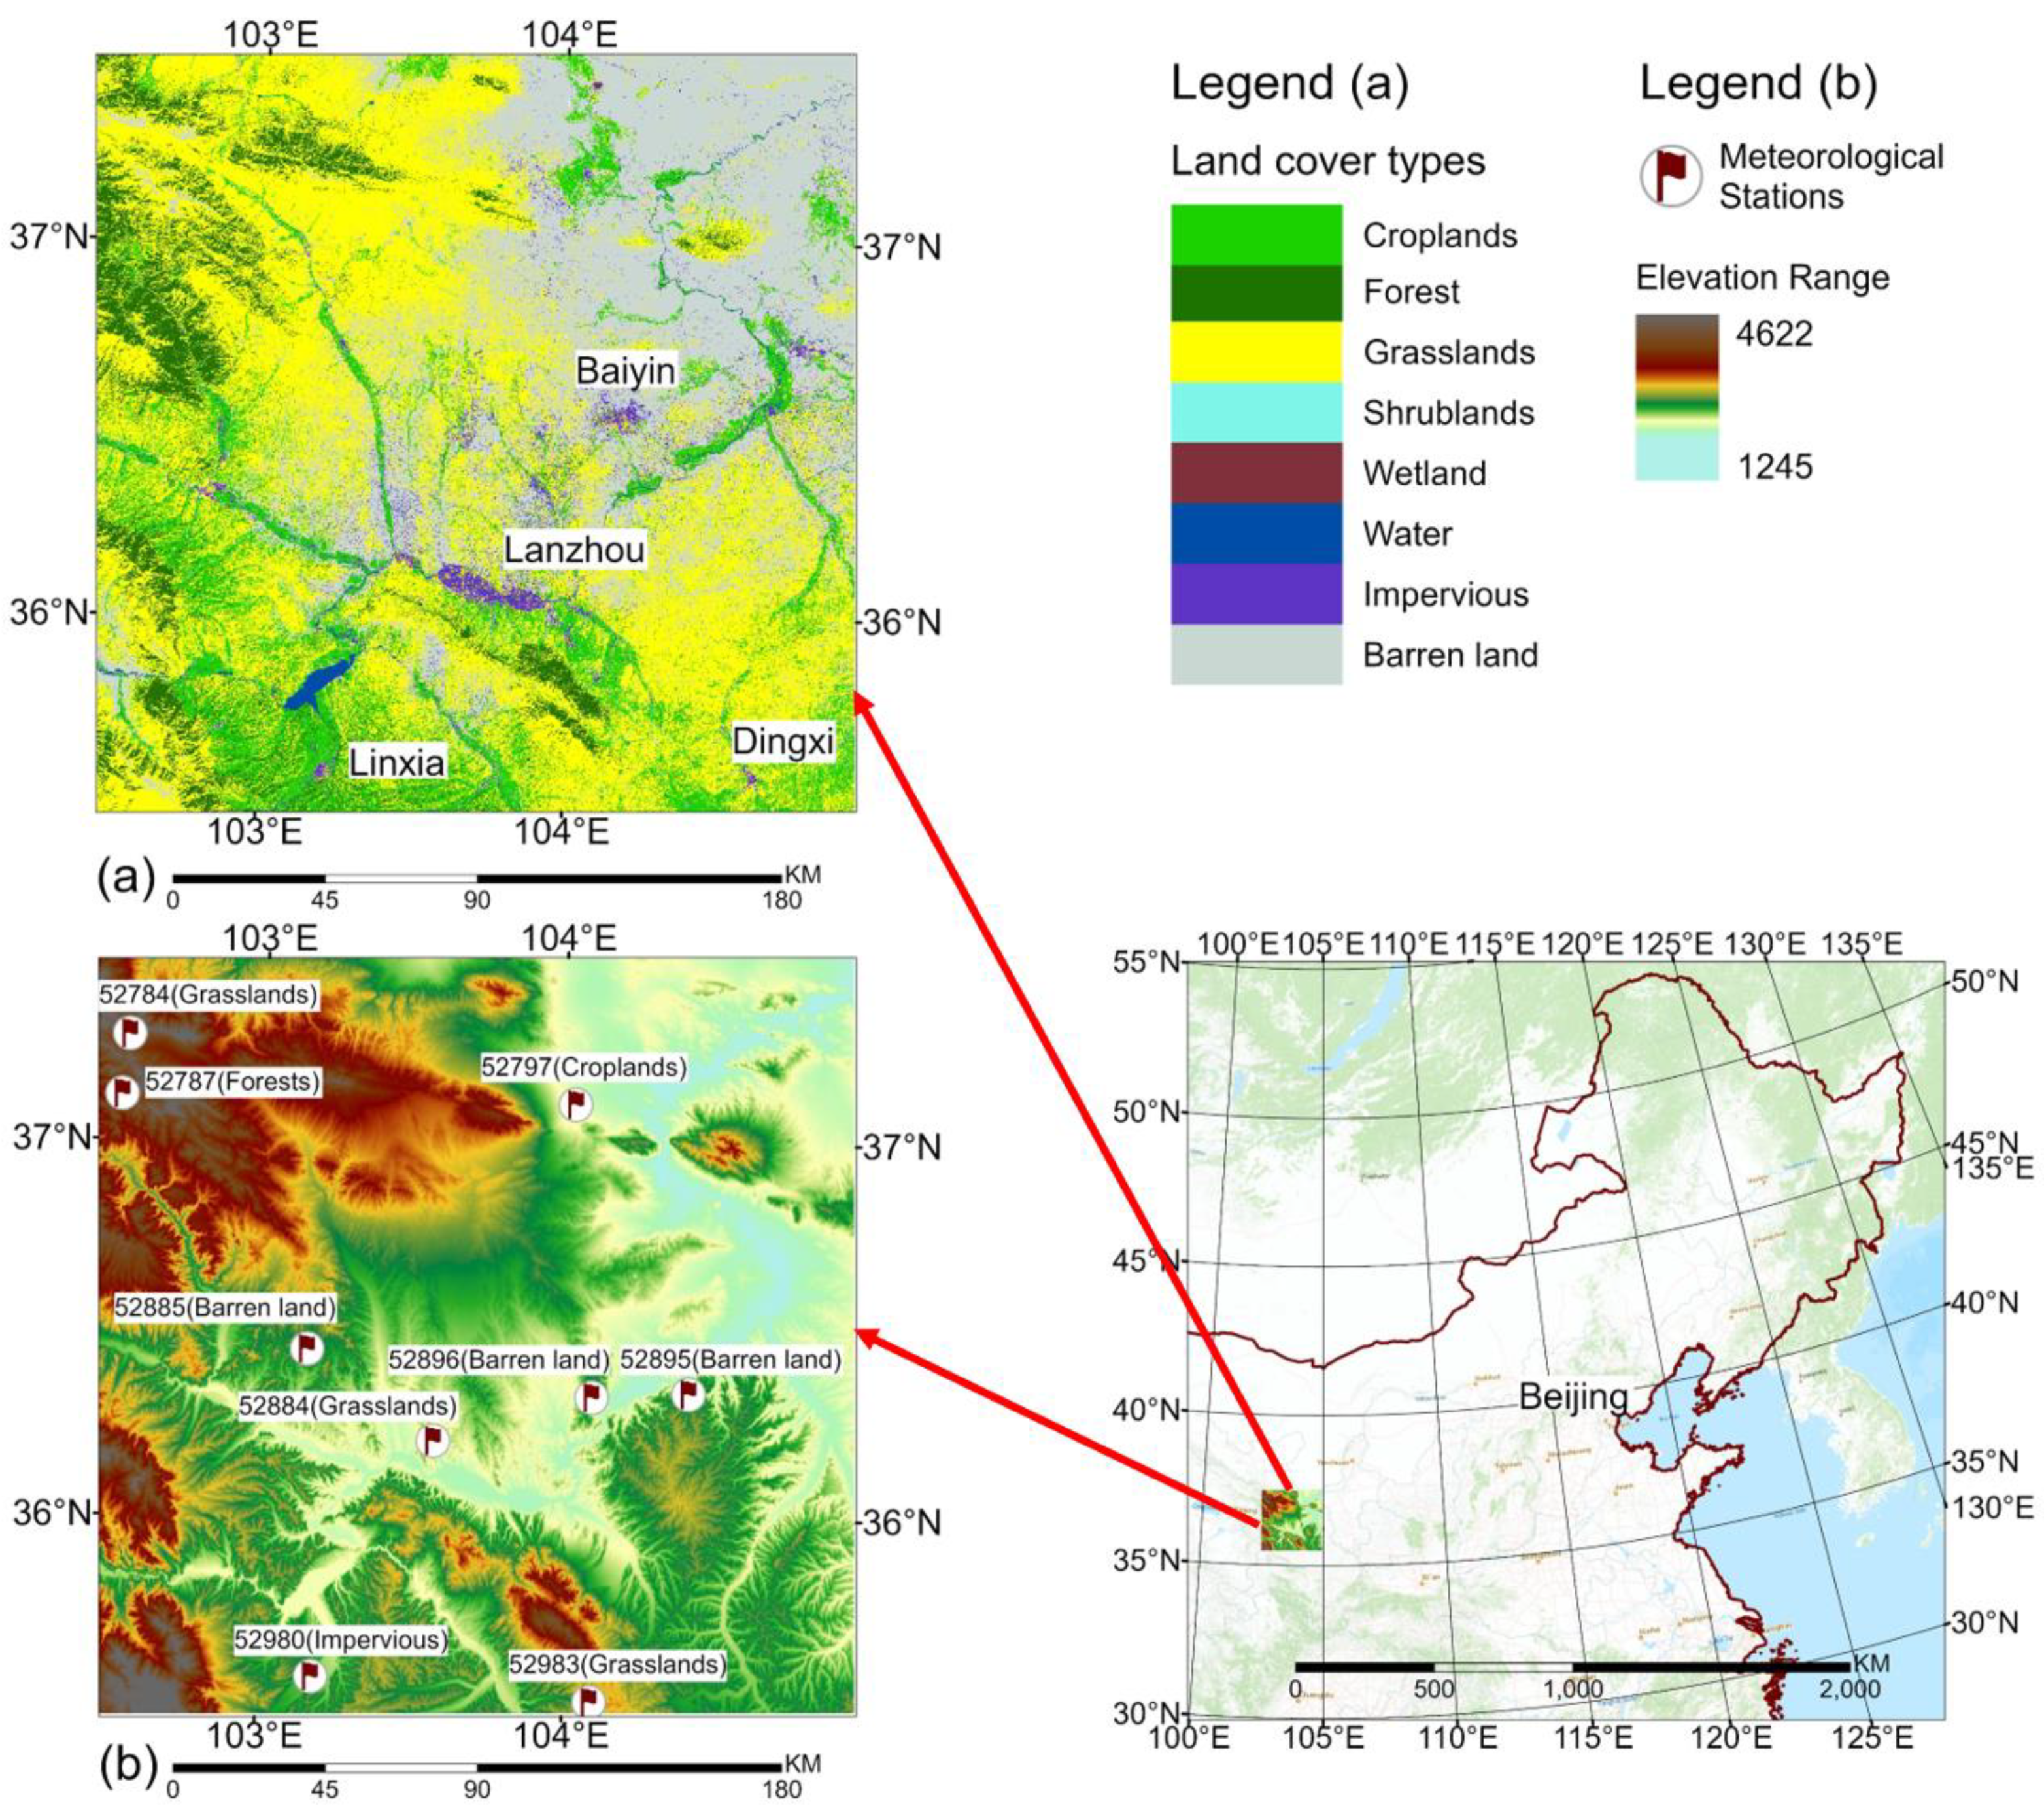
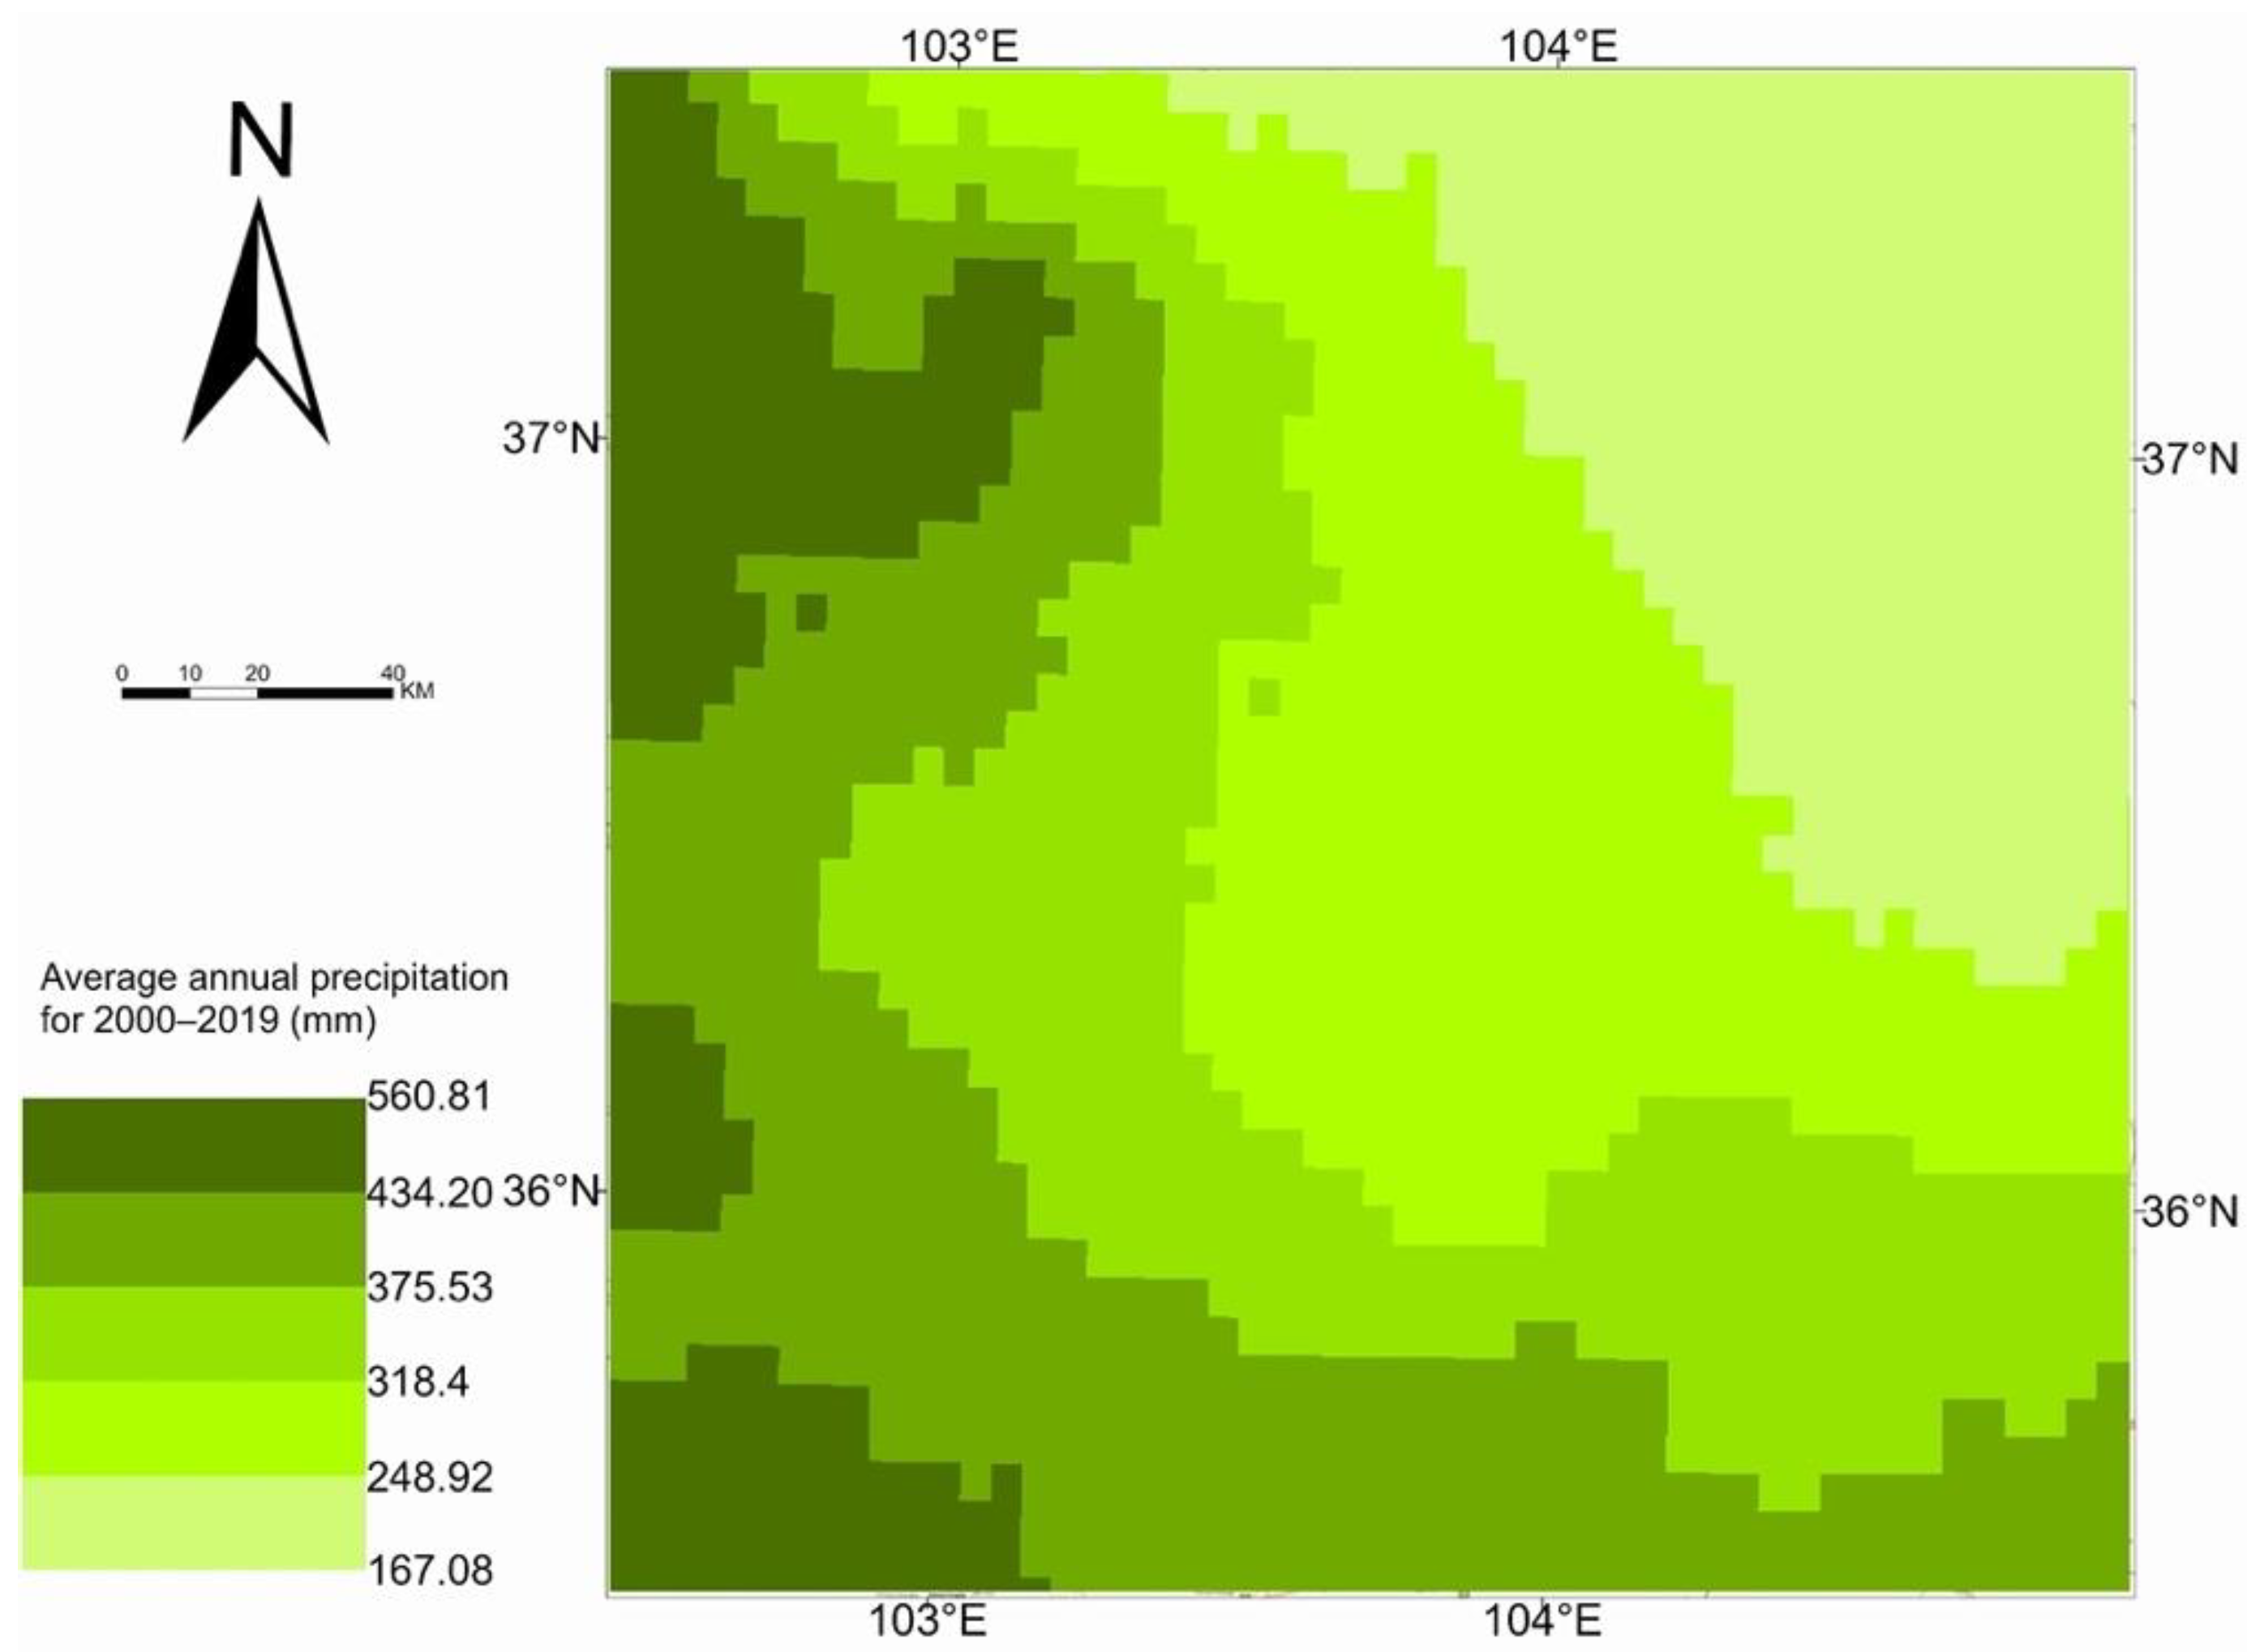
The study area is located within the geographic coordinates of 35°28′N–37°31′N and 102°25′E–104°57′E, covering an area of 48,400 km2 (Figure 1). It is located in the west of the Loess Plateau, at the junction of China’s arid and semi-arid regions, with an elevation ranging from 1245 to 4622 m (Figure 1b). Lanzhou, Baiyin, Linxia, and Dingxi are major cities in this region. The Yellow River runs from southwest to northeast across the study area, and the Liujiaxia Reservoir is in the southwest of the region, just north of Linxia City. The climate is generally semi-arid, and rainfall mainly falls in the months from June to September. In the northeastern part of the study area, precipitation is relatively low compared to other parts of the study area (Figure 2). The annual average temperature in this region is 7.63 °C.

Figure 1.
Land cover types and elevation of the study region. (a) Several land cover types are distributed in this arid and semi-arid region. The land cover data were obtained from the Finer Resolution Observation and Monitoring—Global Land Cover (FROM-GLC10) dataset, which provides land cover types of the whole globe at 10 m resolution. (b) The elevation of the study area ranges from 1245 to 4622 m. Nine meteorological stations are distributed at various elevations and land cover types in this region, two of which are located at elevations of more than 3300 m above mean sea level.

Figure 2.
Spatial pattern of the annual precipitation in the study area. The spatial pattern of vegetation greenness generally agrees with the spatial pattern of precipitation.
The climate in this region is characterized by very steep gradients. In the northeastern part, there is a temperate continental arid climate, with annual precipitation of less than 200 mm. This climate is accompanied by low vegetation coverage, mostly barren land with some grassland and cropland patches scattered within it. Very sparse short bushes grow on this barren land. Crops are cultivated along the river valleys, where water conditions are favorable (Figure 1a). Besides barren land and cropland, grasslands are also very common in this region.
The grasslands in the study area mainly consist of the following species: Stipa bungeana, Stipa breviflora Griseb, and Stipa grandis P. Smirn. The forests mainly include Picea crassifolia Kom and Sabina przewalskii Kom. The shrubland mainly contains Reaumuria soongorica, Caragana licentiana, and C. opulens. On the cropland, there are mainly Zea mays L, Triticum aestivum L, and Solanum tuberosum L.
In the northwest of the study area is Wushaoling Mountain, with its main peak at 3562 m above mean sea level. It belongs to the Qilian Mountains and represents the boundary between the arid and semi-arid regions in China. Jishi Mountain is in the southeastern part of the study area, with its highest elevation at more than 4000 m above mean sea level, and it is the border between the Qinghai-Tibet Plateau and the Loess Plateau.
2.2. Data
2.2.1. Satellite Remote Sensing Data
We used the Collection 6 MOD13Q1 Normalized Difference Vegetation Index (NDVI) data derived from the Moderate Resolution Imaging Spectroradiometer (MODIS) onboard the National Aeronautics and Space Administration’s (NASA’s) EOS/Terra satellite to assess the vegetation dynamics in the study region [40]. MOD13Q1 is provided at a temporal resolution of 16 days and a spatial resolution of 250 m. The QA band in MOD13Q1 indicates the quality of the retrieved NDVI (i.e., whether and how the retrieval is contaminated by clouds, cloud shadows, and aerosols). We used the Collection 6 MOD13Q1 data for the period from 2000 to 2019.
The land cover data were obtained from Finer Resolution Observation and Monitoring—Global Land Cover (FROM-GLC10) dataset, which provides land cover type data of the whole globe at a 10 m resolution [41]. We used the FROM-GLC10 data of 2017 and resampled them to a resolution of 250 m. According to FROM-GLC10, the main land cover types of this semi-arid region are grasslands (44.93%), barren land (29.92%), cropland (13.46%), forests (8.26%), and impervious surfaces (2.49%) (Figure 1).
We also used the MODIS Collection 6 Land Surface Temperature (LST) product MOD11A1 [42] to assess the relationship between vegetation greenness and temperature. The daily temperature was used in our investigation. When calculating atmospheric vapor pressure deficit, we needed land altitudes [2]. The Shuttle Radar Topography Mission (SRTM) digital elevation data [43] were used in our calculations.
2.2.2. Climate Data
We used climate data from the China Meteorological Data Network [44] to investigate the climatic variations in this region. There are nine meteorological stations in our study area (Figure 1b). Daily mean air temperature, daily mean precipitation, and daily mean air relative humidity at the nine meteorological stations in the years from 2000 to 2016 were used. The identification numbers, land cover types, and elevations of the nine stations are listed in Table 1.

Table 1.
Land cover types, elevations, and geographic coordinates of the nine meteorological stations in our study area. The locations of the nine stations are shown in Figure 1b.
As for the spatial data of precipitation, we used the Climate Hazards Group InfraRed Precipitation with Station data (CHIRPS) [45]. CHIRPS daily precipitation data in the years from 2000 to 2019 were used. As for the spatial data of VPD, we used the ERA5-Land data [46]. Specifically, the daily air temperature and dew point temperature from ERA5-Land were used in our study.
3. Methods
We used the growing season mean vegetation greenness to investigate the interannual dynamics of vegetation activity in our study area, and their relationship with climatic factors, such as air temperature, precipitation and air humidity. Trends were calculated using Sen’s method [39], and the statistical significance of the trends was evaluated with the Mann–Kendall test [47]. The growing season in this region extends between May and September [48,49,50].
3.1. Trends of Growing Season Mean NDVI
We first filtered out the 16-day NDVI retrievals in MOD13Q1 that were contaminated by clouds, cloud shadows, or aerosols. Atmospheric contaminations are indicated in the quality assessment (QA) band of MOD13Q1 (i.e., MODLAND QA) [51]. We included NDVI retrievals with the following QA criteria: (1) “VI Quality” (MODLAND QA Bits 0-1) must be equal to 0 (VI produced with good quality) or 1 (VI produced, but check other QA); (2) “VI Usefulness” (MODLAND QA Bits 2–5) must be less than 10; (3) “Adjacent cloud detected”, “Mixed clouds”, and “Possible shadow” flags (MODLAND QA Bits 8, 10, and 14) must be equal to 0; and (4) “Aerosol Quantity” flags (MODLAND QA Bits 6-7) must be equal to 1 (low) or 2 (intermediate). The missing NDVI after filtering were then substituted with the good-quality 16-day NDVI climatology for the period from 2000 to 2019 (Figure S1).
The two 16-day NDVI in a month were composited to monthly NDVI using the maximum value compositing method. The monthly NDVI in the months from May to September were averaged to obtain the growing season mean NDVI. Growing season mean NDVI in the years from 2000 to 2019 were used to investigate the dynamics of vegetation activity in our study area.
3.2. Trends of Climatic Factors
We compute growing season temperature, precipitation, and vapor pressure deficit (VPD) from the daily air temperature, precipitation, and air relative humidity at the nine meteorological stations in the study area. The growing season temperature is the average daily air temperature in the months from May to September. Growing season precipitation is the total precipitation in the months from May to September. Growing season VPD is the average daily VPD in the months from May to September. There are many ways to calculate VPD (e.g., [2,52]). In our study, VPD was calculated using the following equations, following [2]:
where SVP and AVP are the saturated vapor pressure and actual vapor pressure (hPa), respectively.
where is the land air temperature (°C), is the altitude (m), is the air pressure (hPa), is the air pressure at mean sea level (1013.25 hPa), and RH is the air relative humidity (%).
Trends of growing season temperature, precipitation, and VPD at the nine meteorological stations were calculated using the linear regression method, and the statistical significance of the trends was evaluated by means of the t-test to see if the trends were different from zero.
3.3. Interannual Covariation between Vegetation Activity and Climate
The NDVI for a meteorological station was the average of the NDVI values in the 3 by 3 km square collocated with the meteorological station. We analyzed the interannual covariation between growing season NDVI and growing season temperature, precipitation, as well as VPD at the nine meteorological stations for the years from 2000 to 2016. The methods for calculating growing season vegetation greenness and climatic factors are described in Section 3.2. We computed the Pearson’s correlation coefficients between the detrended growing season NDVI and each of the detrended growing season climatic factors at the nine meteorological stations. We detrended the original time series of the variables by removing the ordinary least squares linear regression trend.
4. Results
4.1. Spatial Pattern of the Multi-Year Average Growing Season NDVI
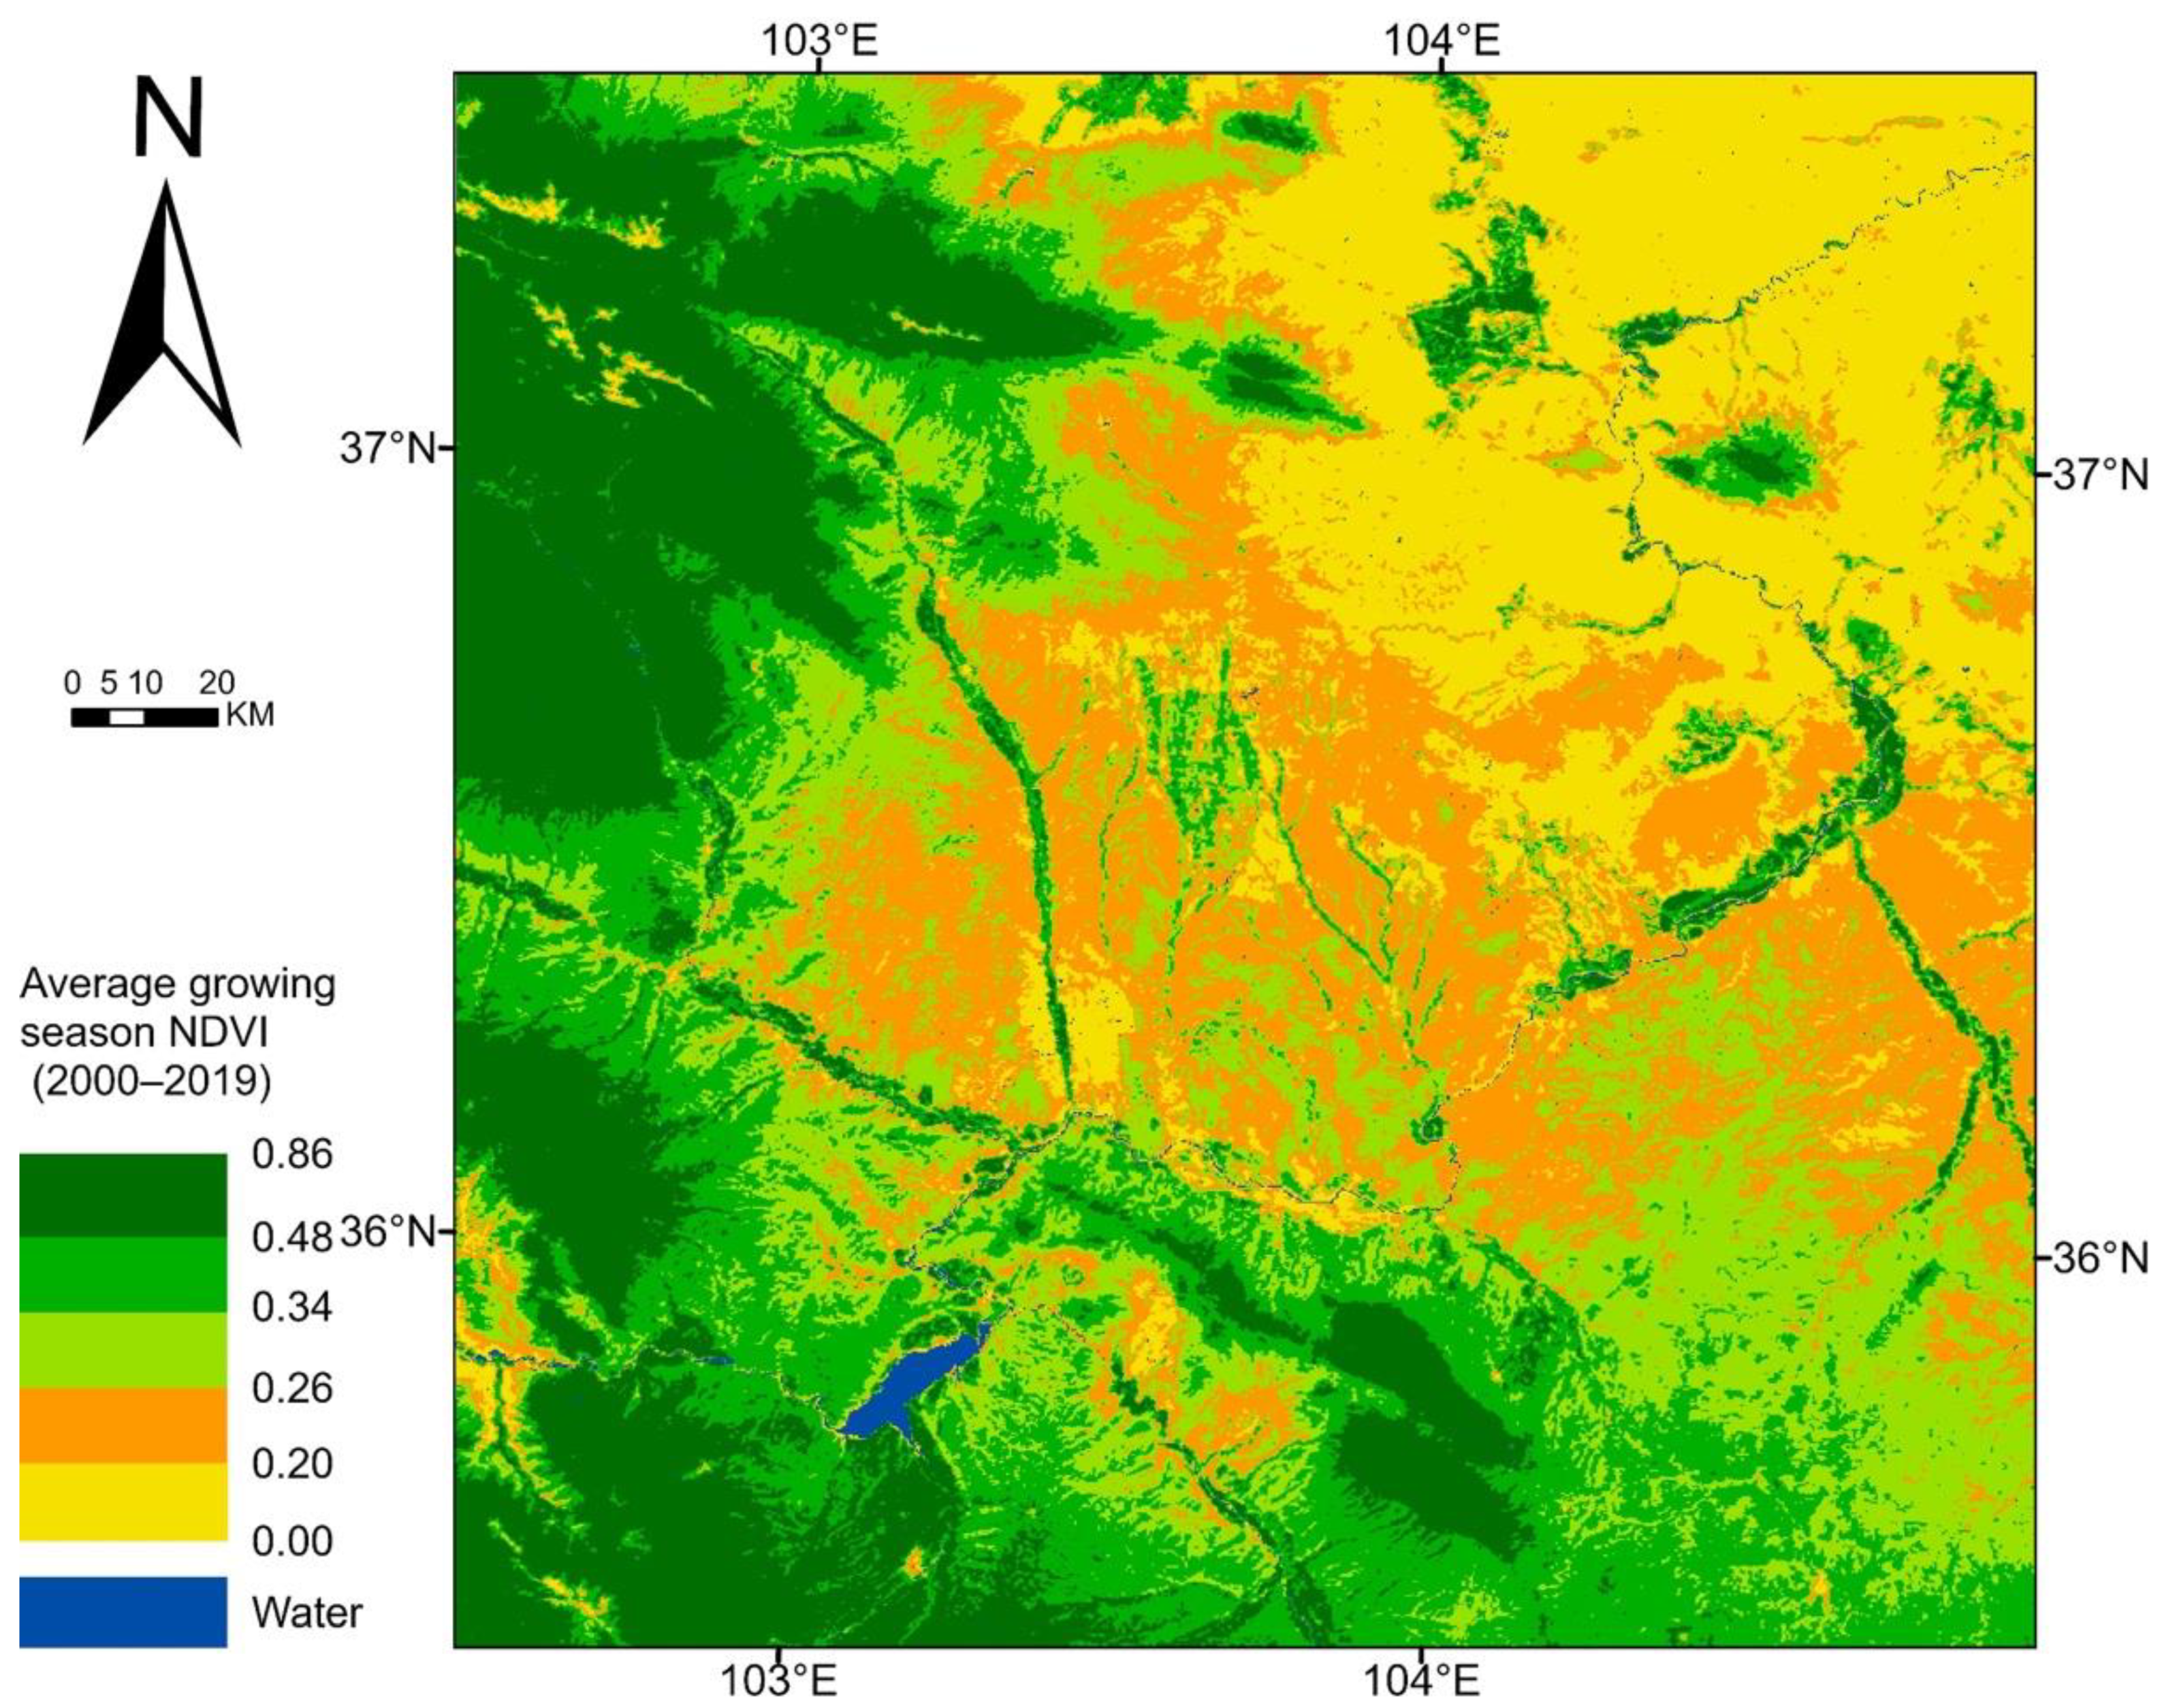
The average growing season NDVI for the study area was calculated using the growing season NDVI data for the period from 2000 to 2019. The growing season vegetation greenness in the study area is very diverse, ranging from below 0.20 in the northeast to approximately 0.5 in the mountains (Figure 3). The northeast mostly consists of barren land, while the mountains are covered by forests. As for the two herbaceous land cover types, the growing season NDVI of cropland is higher than that of grasslands. Because trees were planted during the development of the Lanzhou New District, the growing season NDVI there is higher than that of the surrounding areas, which are mostly covered by grasslands. The growing season NDVI for the Lanzhou Basin and small portions of Wushaoling Mountain has high uncertainty (Figure S1), due to atmospheric contamination.

Figure 3.
Average growing season Normalized Difference Vegetation Index (NDVI) for the study region during the period from 2000 to 2019. The growing season was defined as May to September. The NDVI data were obtained from the Moderate Resolution Imaging Spectroradiometer (MODIS) Collection 6 MOD13Q1 product, in which NDVI and accompanying quality assurance (QA) fields are provided. The NDVI data corrupted by clouds, aerosols, and cloud shadows were filtered out in the calculation of the growing season mean NDVI.
4.2. Spatial Pattern of the Vegetation Greenness Trends
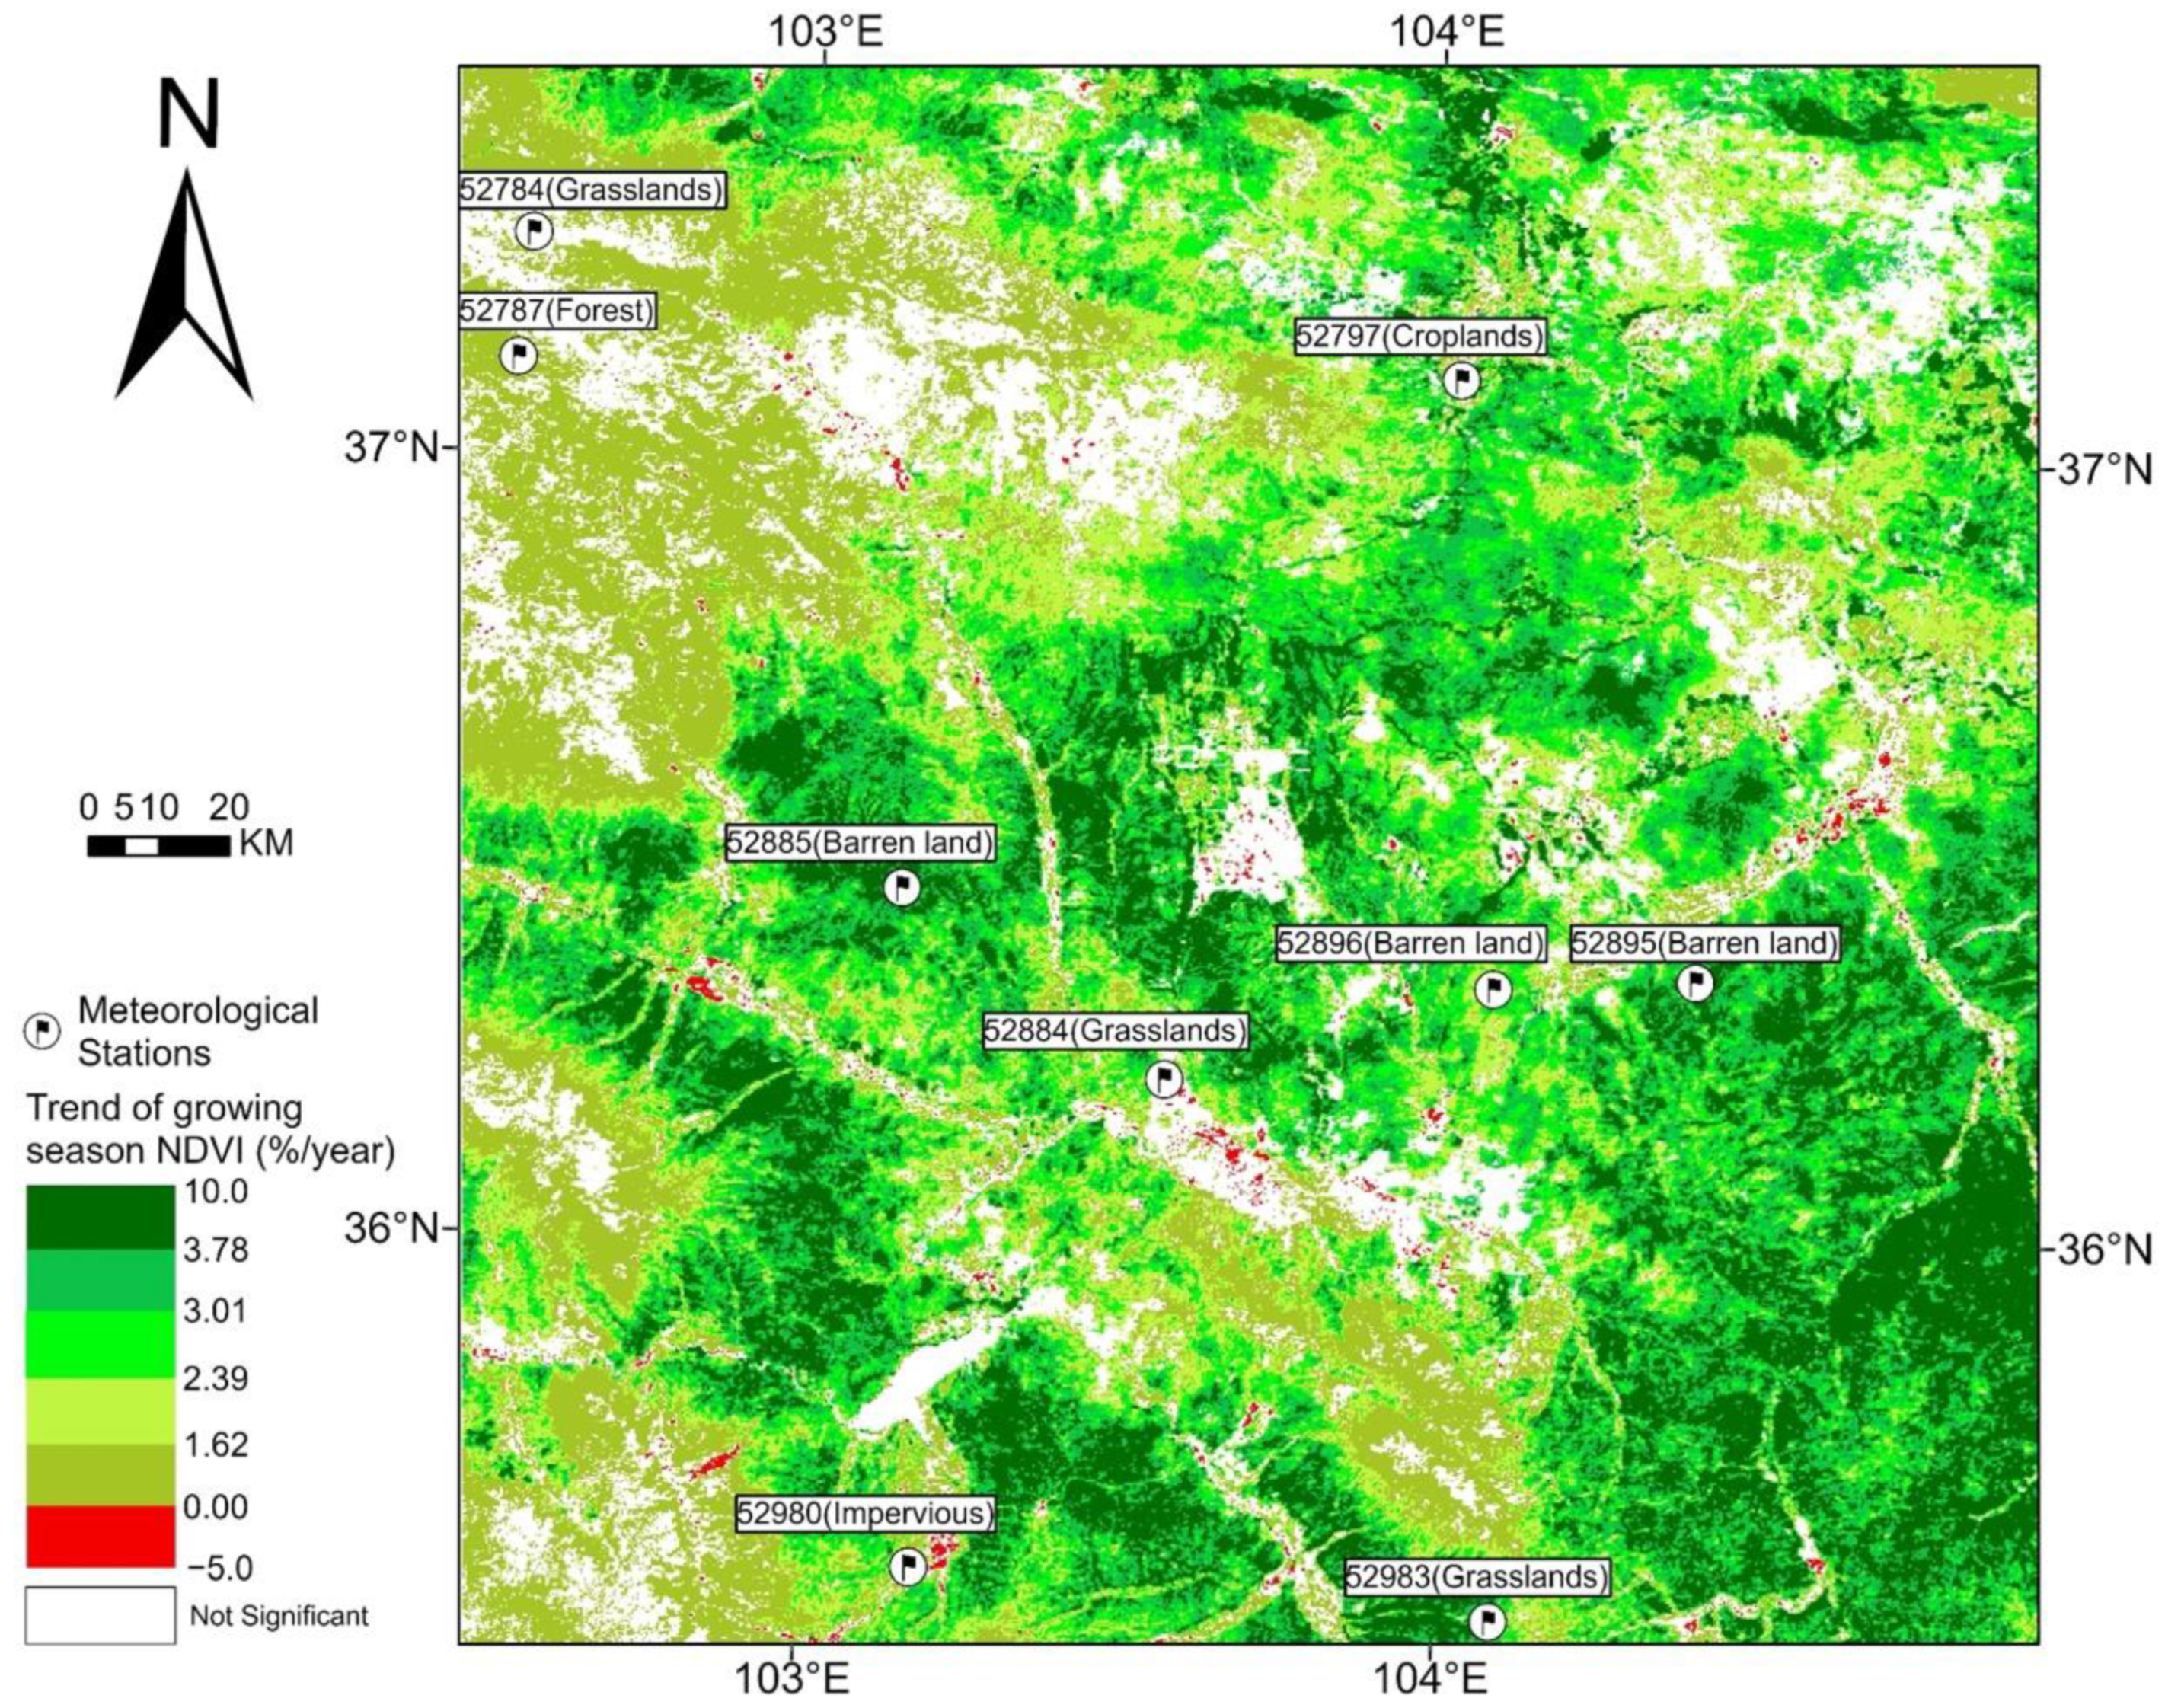
From 2000 to 2019, 84.1% of the study region greened up (p < 0.05), although at various magnitudes (Figure 4). Nearly half (49.87%) of the region greened up more than 2.39%/year, and 15.66% more than 3.78%/year, with respect to the average growing season NDVI for the years from 2000 to 2002. Only 0.43% of the study region experienced browning at a 5% level (Figure 4). These browning regions were mostly located in the urbanizing regions of Lanzhou, Baiyin, and Linxia, where vegetation was replaced by impervious surfaces.

Figure 4.
Spatial pattern of the trends of growing season mean NDVI for the study region in the period from 2000 to 2019. The trends were calculated using Sen’s method, and were tested at the 5% level using the Mann–Kendall test. Areas with no statistically significant trends are colored white. The unit of the trends relates to the average growing season NDVI for the years from 2000 to 2002.
Some forests on Wushaoling and Jishi mountains show no statistically significant trends of growing season greenness (Figure 4), which suggests that there might be limiting factors for the forests to green up, given the warming climate and rising atmospheric CO2 concentration. In addition, the average magnitude of green-up for forests (1.26%/year) is much lower than those for cropland (2.88%/year), grasslands (2.84%/year), and even barren land (2.77%/year), where sparse short bushes grow (Figure 4). This suggests that the forests in our study region are, in general, quite mature—premature forests usually exhibit higher rates of greening due to natural growth. Nevertheless, some forests greened up at comparable rates to the average green-up rate of the herbaceous biomes. These forests are distributed close to the tree lines on the mountains.
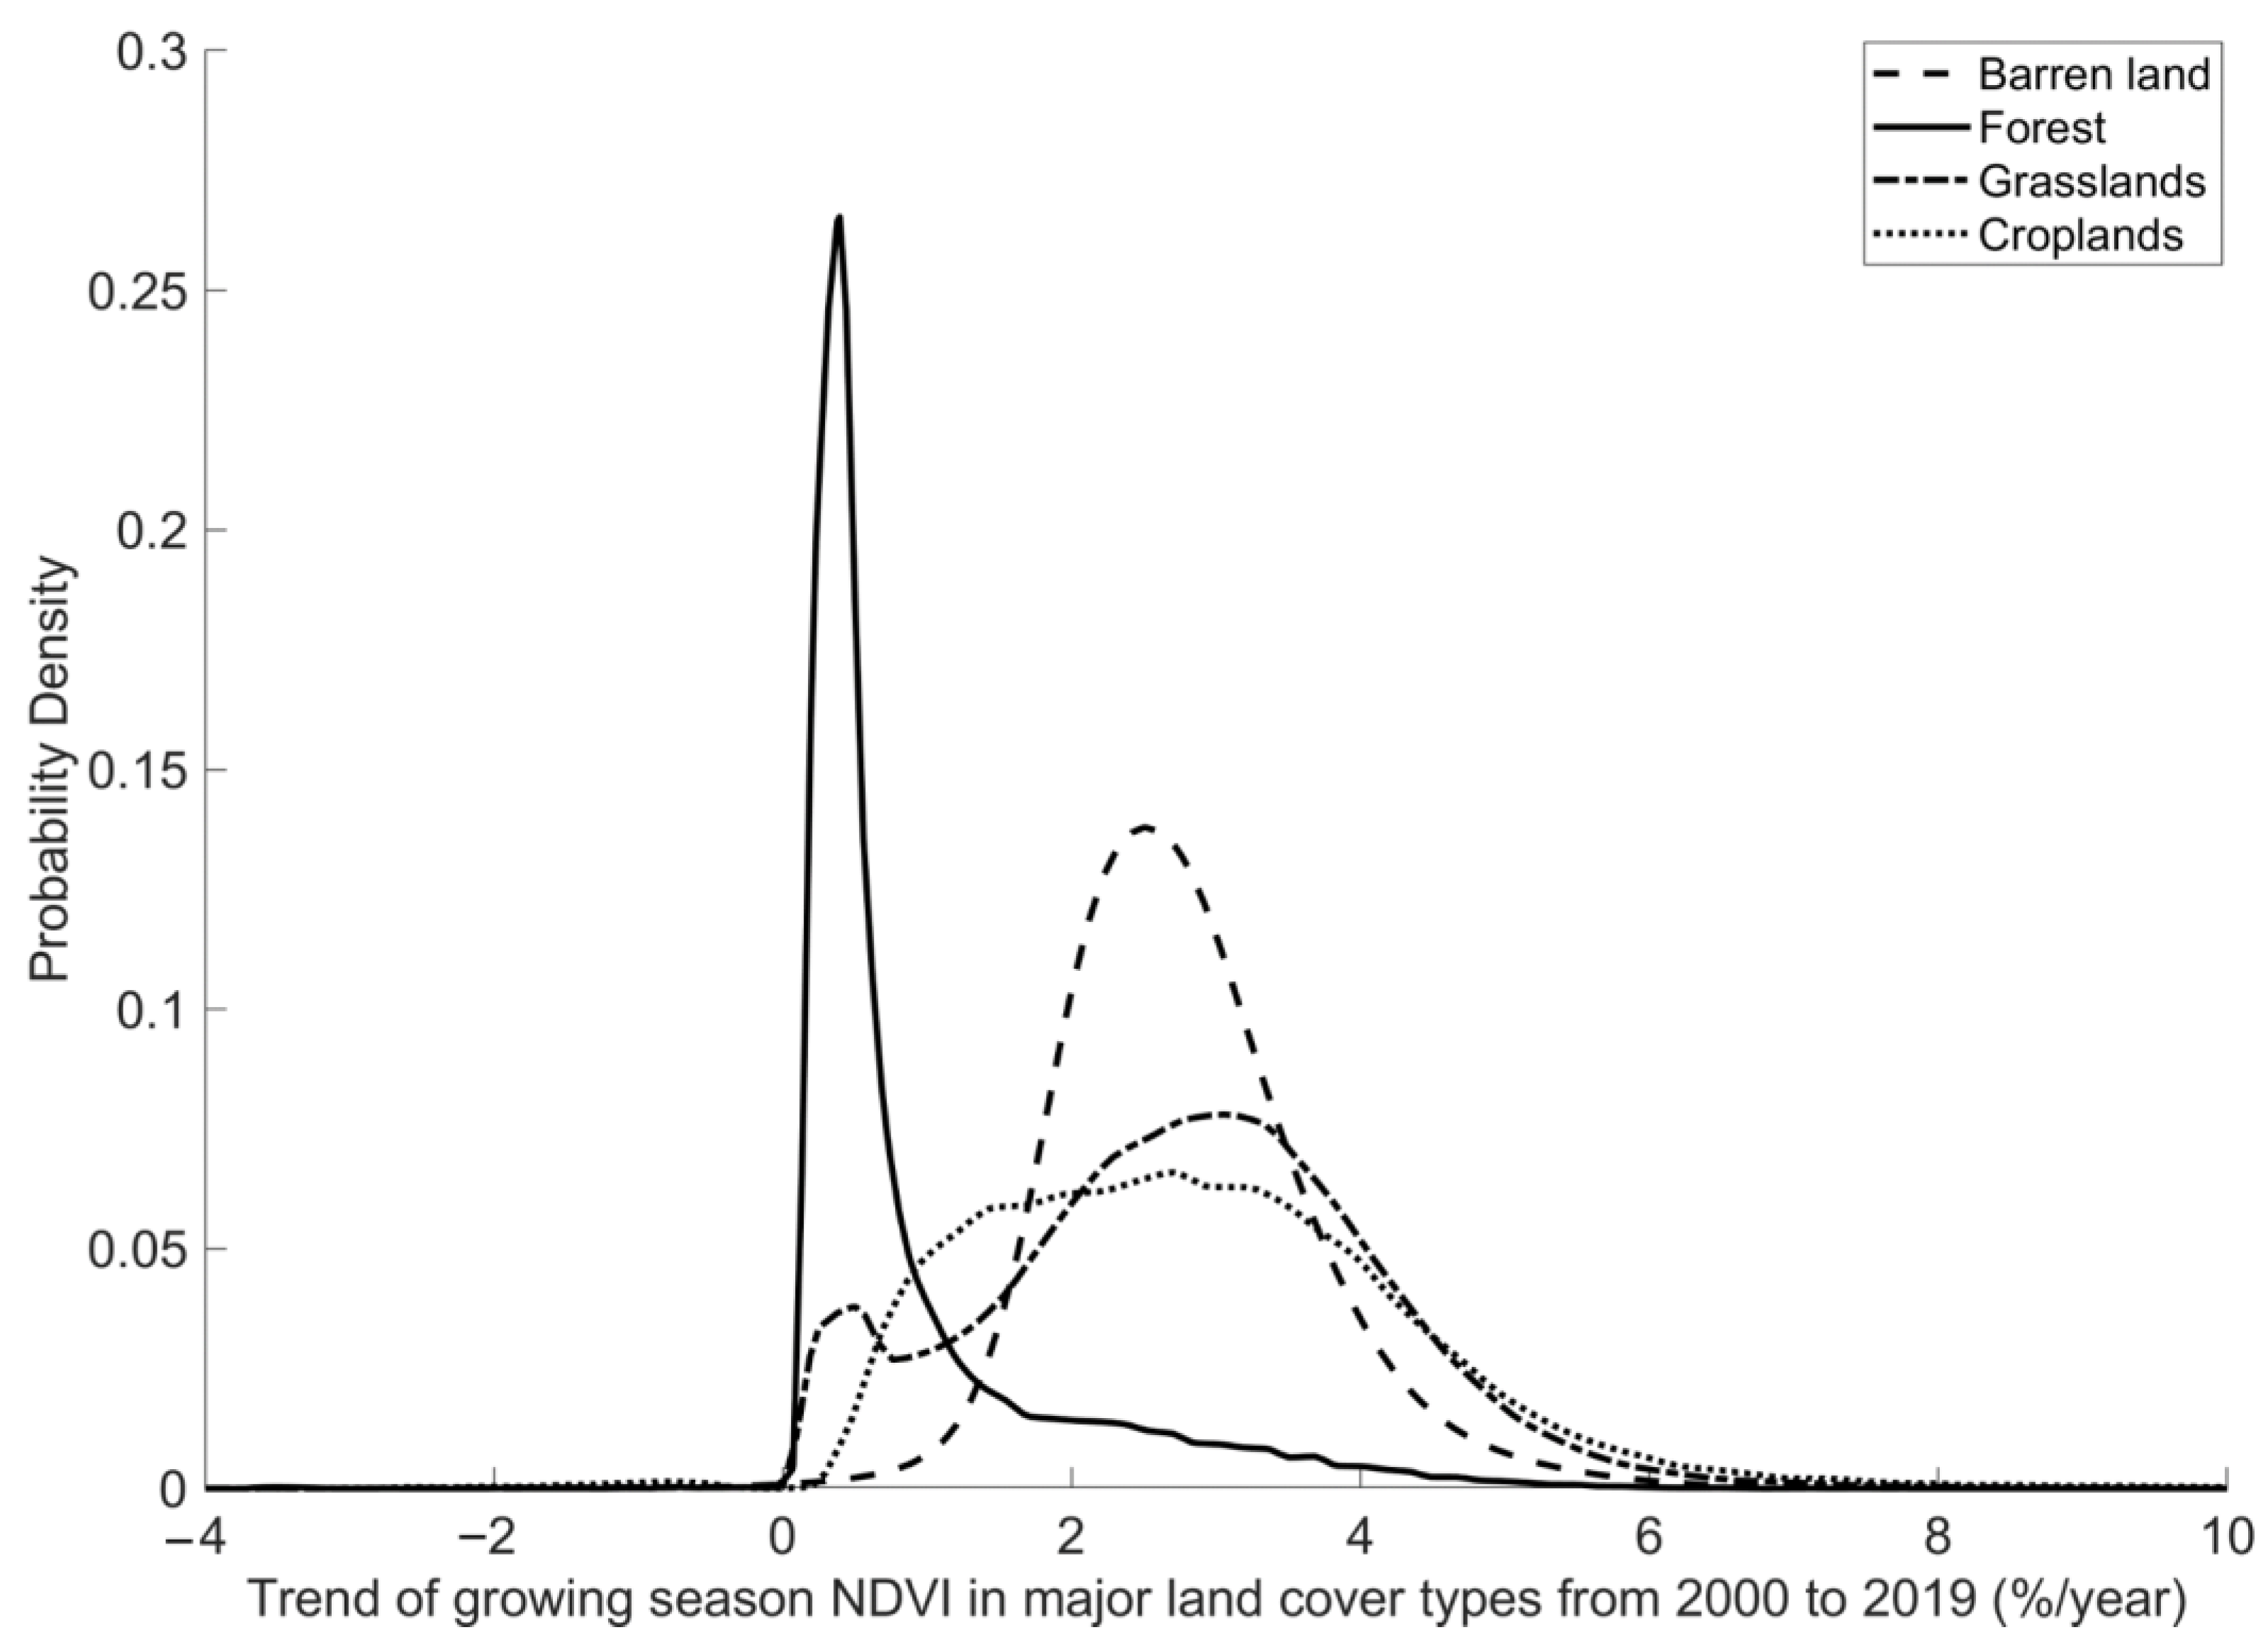
The trends of growing season NDVI for grasslands are bimodally distributed (Figure 5), with one mode at around 0.5%/year, and the other at around 3.3%/year. This suggests that there are two sub-types of grasslands in our study region: one type greened up much faster than the other. Other than that, the greenness trends of grasslands are similar to those of cropland. This can be explained by the fact that they are both herbaceous. On the other hand, this suggests that agricultural practices, such as fertilization and irrigation, might contribute little to the greenness trends of cropland, while climate and CO2 fertilization might play a major role in driving the greenness trends of cropped vegetation in this semi-arid region. The mean green-up magnitude of the barren land is similar to that of the herbaceous land cover types (i.e., grasslands and cropland), but the variation of the former is smaller than that of the latter, suggesting that barren land is more homogeneous than grassland and cropland.

Figure 5.
Frequency distribution of the trends of growing season NDVI for major land cover types in the study region from 2000 to 2019. Almost all of the trends are positive. The bimodal frequency distribution of the trends for grasslands suggests there are two categories of grasslands.
4.3. Interannual Variation of the Vegetation Greenness in the Study Region
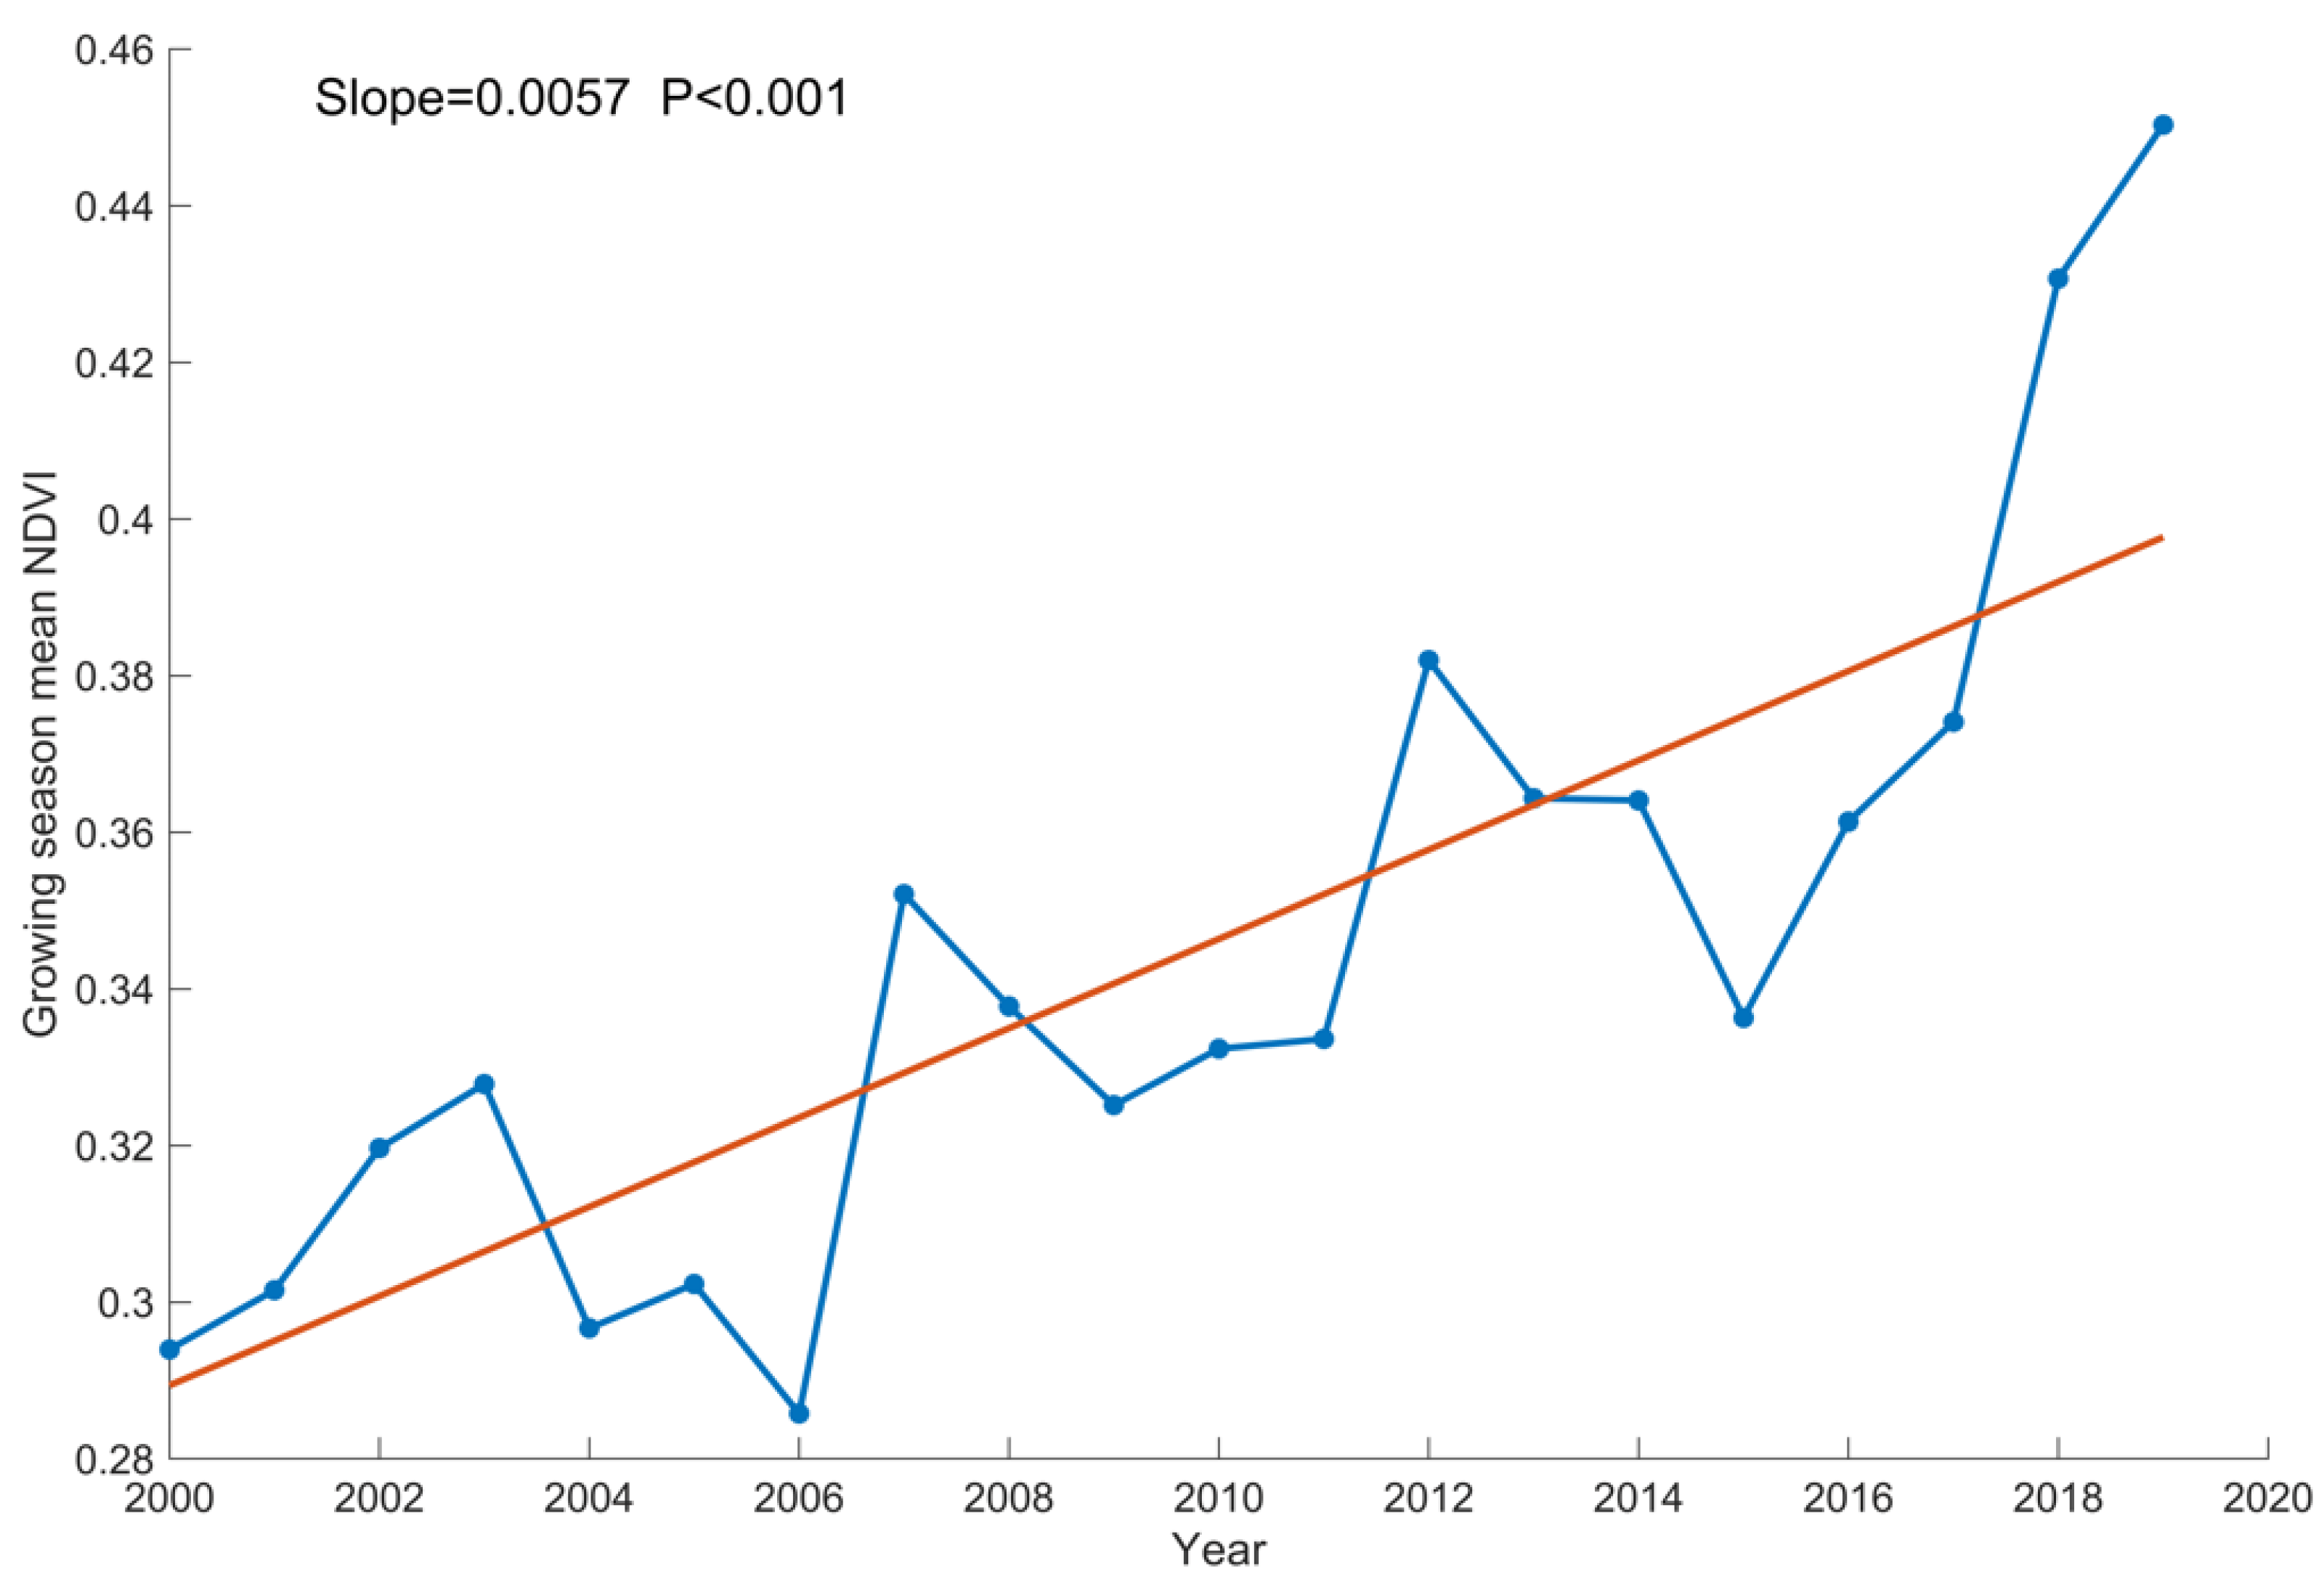
From 2000 to 2019, the growing season vegetation greenness increased at a rate of 0.0057 units of NDVI per year, which was statistically significant, but there was interannual variability (Figure 6). In 2006, the vegetation was the “brownest”, because a very severe drought happened in this year. However, in the next year, 2007, the vegetation growing season greenness not only recovered, but also reached a higher level than the previous few years. This indicates a strong resilience of the vegetation in this region to water deficits. It is noteworthy that the vegetation growing season NDVI increased continuously from 2015 onwards, which might be related to changes in ecological management practices in this region. There are very high growing season NDVI peaks in 2018 and 2019, which could be related to wet conditions (i.e., high precipitation and low VPD) in these two years, since the vegetation dynamics in this region are mainly related to moisture conditions (see Section 4.4 and Figure 7).

Figure 6.
Time series and trend of the growing season mean NDVI for the study area from 2000 to 2019. The growing season is defined as May to September.
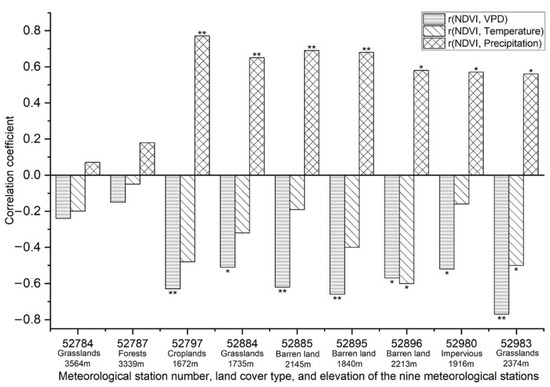
Figure 7.
Correlation coefficients between the detrended growing season NDVI and the detrended growing season temperature, precipitation, as well as atmospheric vapor pressure deficit (VPD) at the nine meteorological stations in the period from 2000 to 2016. NDVI at a meteorological station is the average of NDVI values in the 3 by 3 km square collocated with the meteorological station. The meteorological data are from the China Meteorological Data Network [44]. One asterisk indicates that the correlation coefficient is at the 5% level of statistical significance, and two asterisks denote a 1% level of statistical significance.
4.4. Interannual Covariation between the Vegetation Greenness and Climatic Factors
The interannual dynamics of vegetation are affected by direct human activities, such as fertilization, irrigation, harvesting, etc., as well as environmental factors, such as atmospheric CO2 concentration and climatic factors. Environmental factors affect vegetation dynamics at much larger spatial scales than direct human activities. We investigate the covariation between the growing season NDVI and the growing season air temperature, precipitation, as well as air vapor pressure deficit at the nine meteorological stations in the study region.
In general, the growing season vegetation greenness was positively correlated with the growing season precipitation, and negatively correlated with the growing season temperature and vapor pressure deficit (Figure 7). The interannual dynamics of vegetation at the two high-elevation stations correlate little with temperature, precipitation, or VPD, suggesting that factors other than temperature and moisture control interannual vegetation dynamics there.
The growing season air temperature was negatively correlated with the growing season vegetation greenness, and the correlation coefficients were statistically insignificant except at one station on grassland. This suggests that warming did not drive vegetation growth at the interannual time scale in this region, and inversely, vegetation growth might have cooled the near-surface air temperature (Figure S2) with the enhanced evapotranspiration from the vegetation green-up. In addition, the magnitudes of the correlation between temperature and vegetation greenness were generally much smaller than those of the correlation between humidity (i.e., precipitation and VPD) and vegetation greenness. This suggests that the interannual vegetation dynamics in this region might be driven by soil moisture and atmospheric humidity—that is, precipitation and VPD, if we assume that precipitation is related to soil moisture, and VPD represents air humidity.
The correlation magnitude of vegetation greenness with precipitation is similar to that with VPD at each of the seven low-elevation stations at the interannual time scale. Nevertheless, at only one of the seven low-elevation stations, which is located on grassland, vegetation greenness was correlated more with VPD than with precipitation, while at the other six low-elevation stations, the biome types of which are cropland, grassland, and barren land, vegetation greenness was correlated more with precipitation than with VPD. Hence, in general, the interannual dynamics of vegetation greenness in this semi-arid region correlate more with precipitation than with VPD.
Air temperature is more meaningful for the vegetation photosynthesis rate than land surface temperature, because the enzyme efficiency in leaf cells is affected by the air temperature surrounding leaves, not by the land surface temperature beneath vegetation leaves, although land surface temperature and air temperature may be highly correlated in some cases. There is a MODIS land surface temperature product, but no VPD derived from MODIS. Because air temperature and land surface temperature relate to different substances, we cannot compare them directly, but we can assess their correlations. We assessed the correlation of air temperature and land surface temperature at the nine meteorological stations, and found that the average correlation coefficient was 0.49.
In addition to our investigation into the correlation between vegetation greenness and climatic factors at the nine meteorological stations, we analyzed the correlation between growing season vegetation greenness and land surface temperature, precipitation, as well as atmospheric vapor pressure deficit for the whole study region (Figure 8). In general, the results based on the measurements from the meteorological stations agree with those based on the gridded climate data.
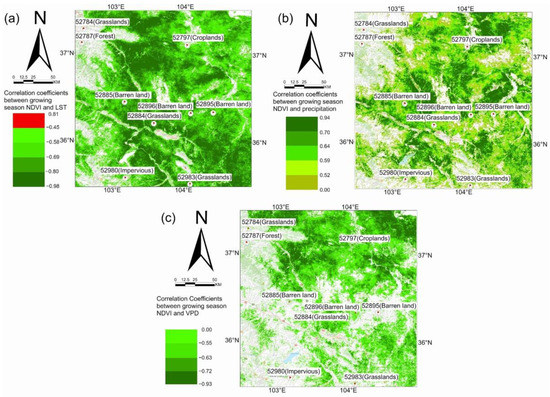
Figure 8.
Correlation coefficients between the growing season vegetation greenness and the three climatic factors: (a) land surface temperature, (b) precipitation, (c) atmospheric vapor pressure deficit. The correlation coefficients are at the interannual scale for the years from 2000 to 2019.
Nemani et al. [14] showed that in the semi-arid regions of Northwest China, water is the main limiting factor for vegetation growth. This agrees with our findings in the semi-arid regions lower than two kilometers above sea level. However, as for the vegetation at high elevations, neither water nor temperature seem to be the main limiting factor. The global study in [14] missed the details associated with elevation, because of the coarse spatial resolution data used, and hence studies using high spatial resolution data are needed to improve our understanding of the drivers of vegetation dynamics at regional scales.
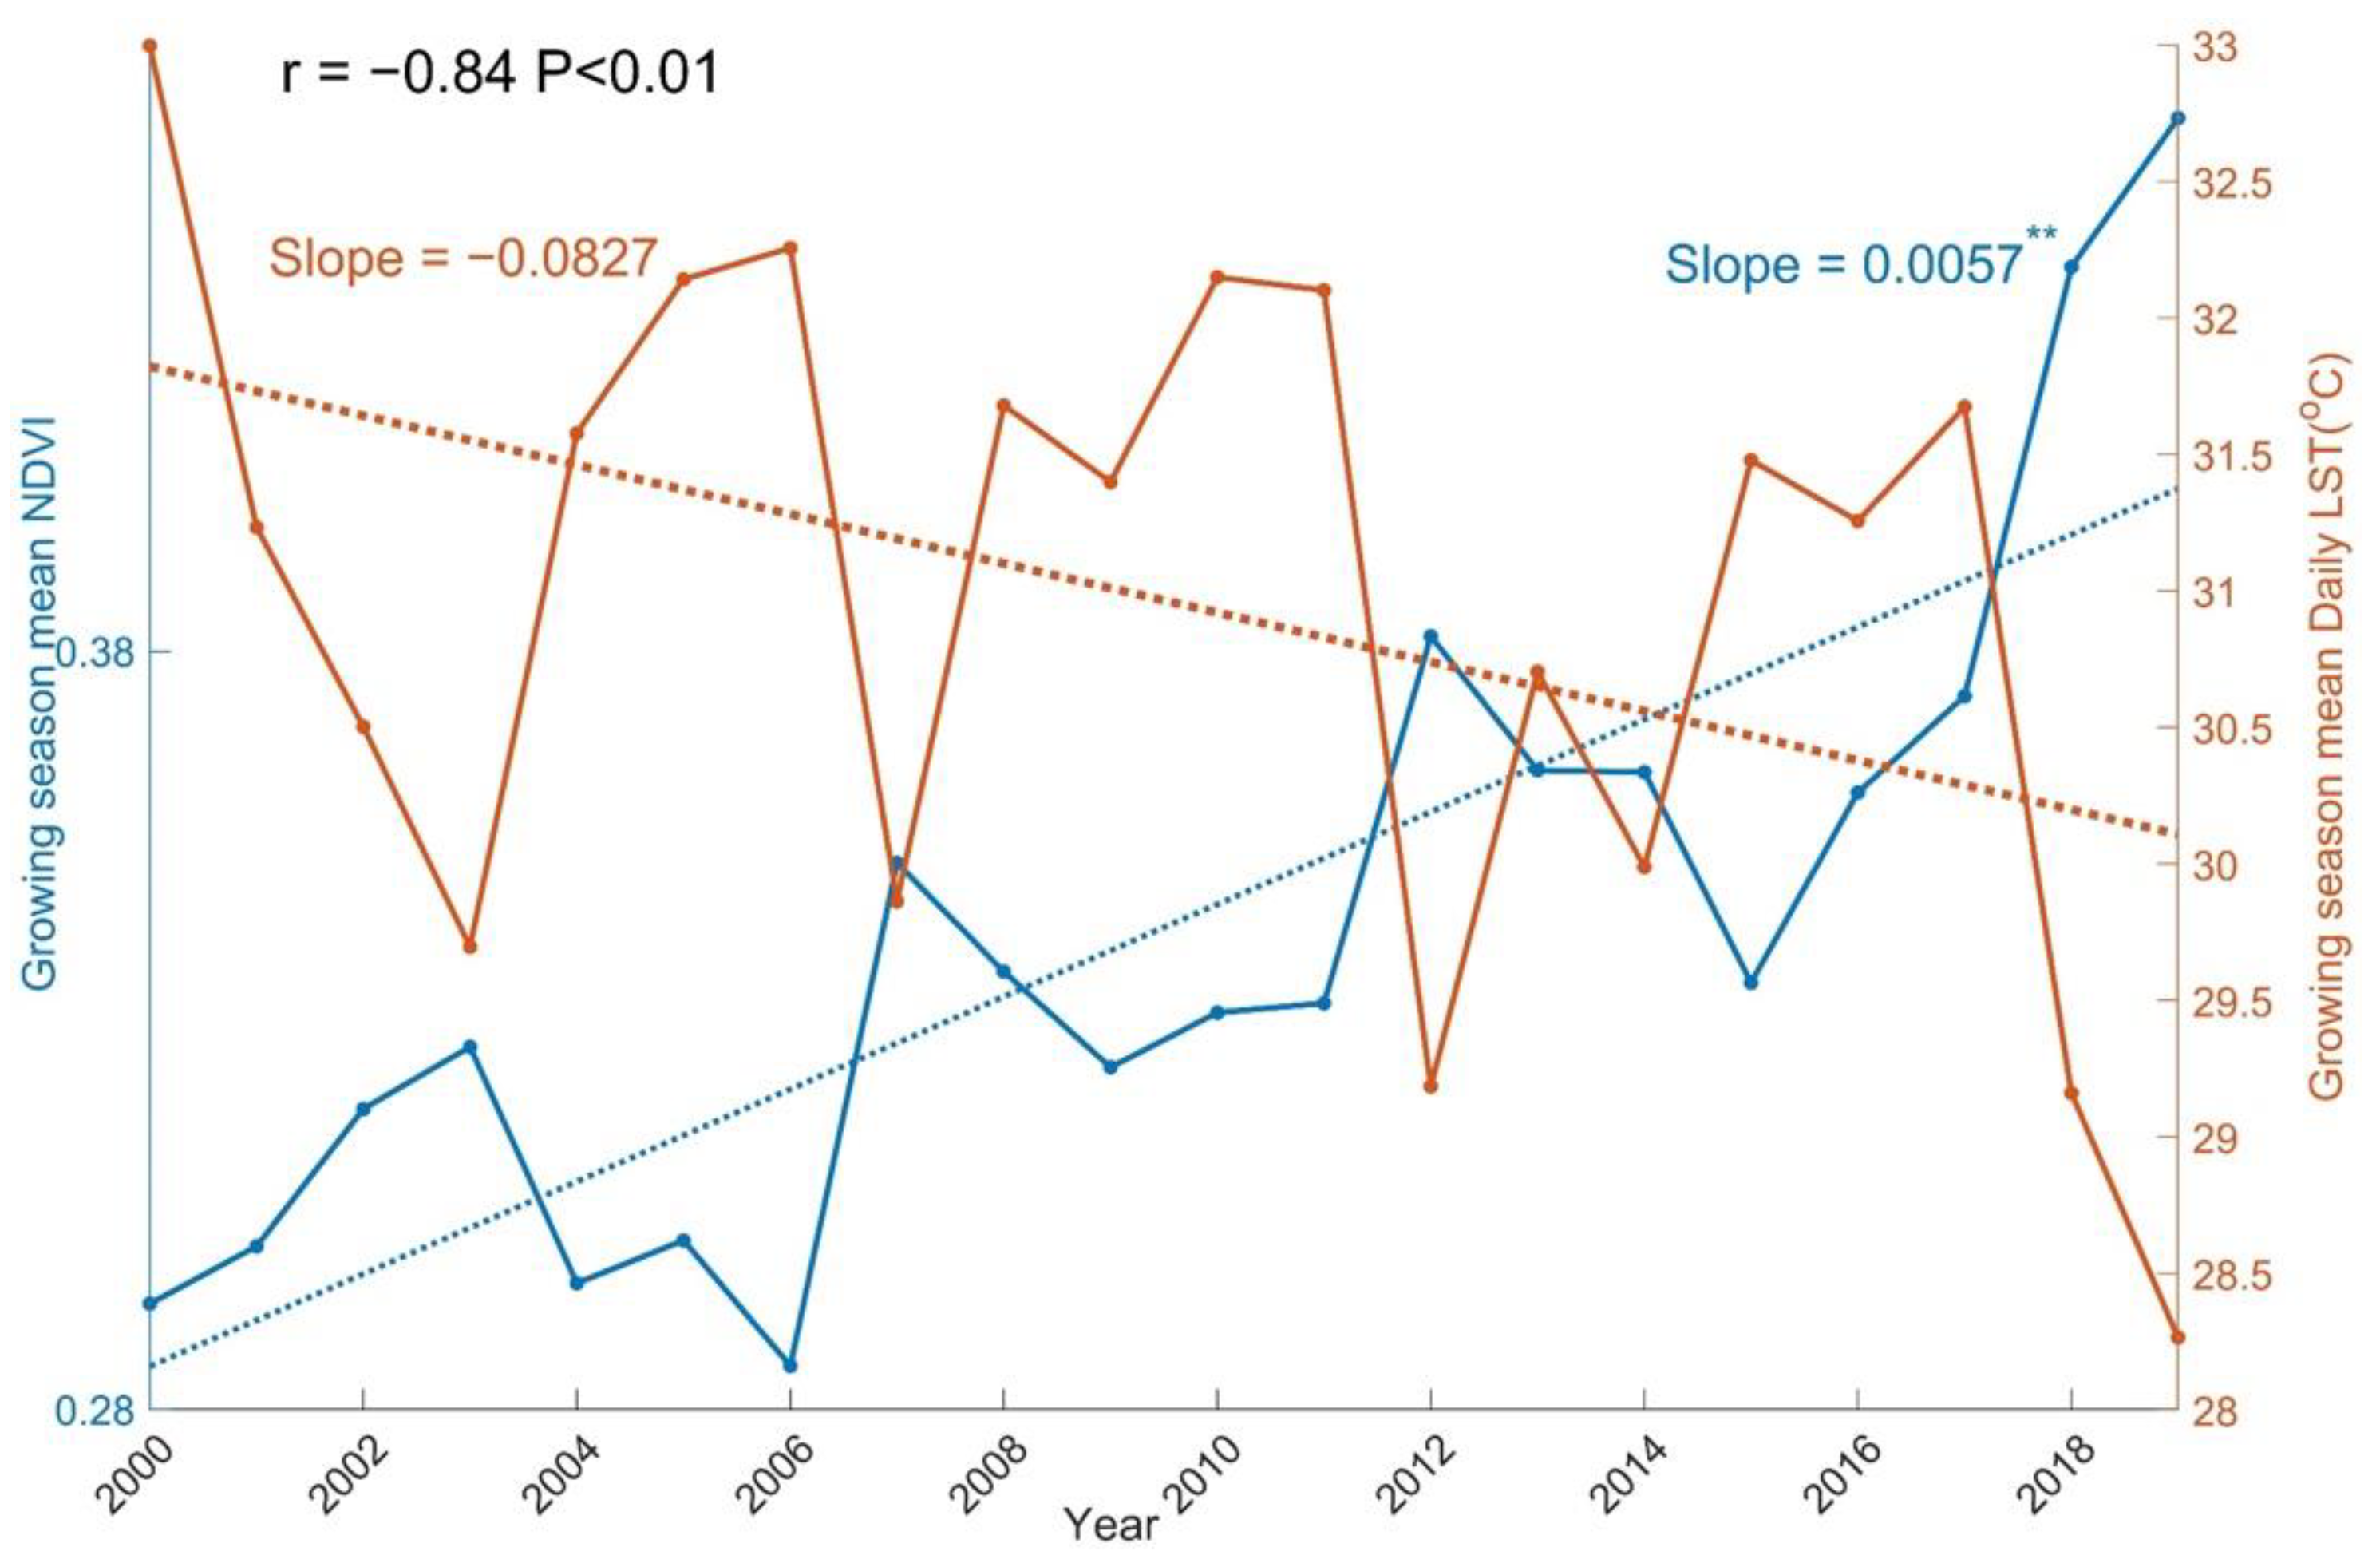
The greening of vegetation does have an effect on the local climate, as shown in Figure 9. The land surface temperature in the study area had a decreasing trend at the rate of 0.0827 °C/year in the years from 2000 to 2019, while the vegetation greenness had an increasing trend. The interannual variation of temperature is highly correlated with that of the vegetation greenness. The cooling effect of increasing vegetation was also reported in [53].

Figure 9.
Interannual variation of the growing season vegetation greenness and land surface temperature. Two asterisks indicate that the slope is at the 1% level of statistical significance.
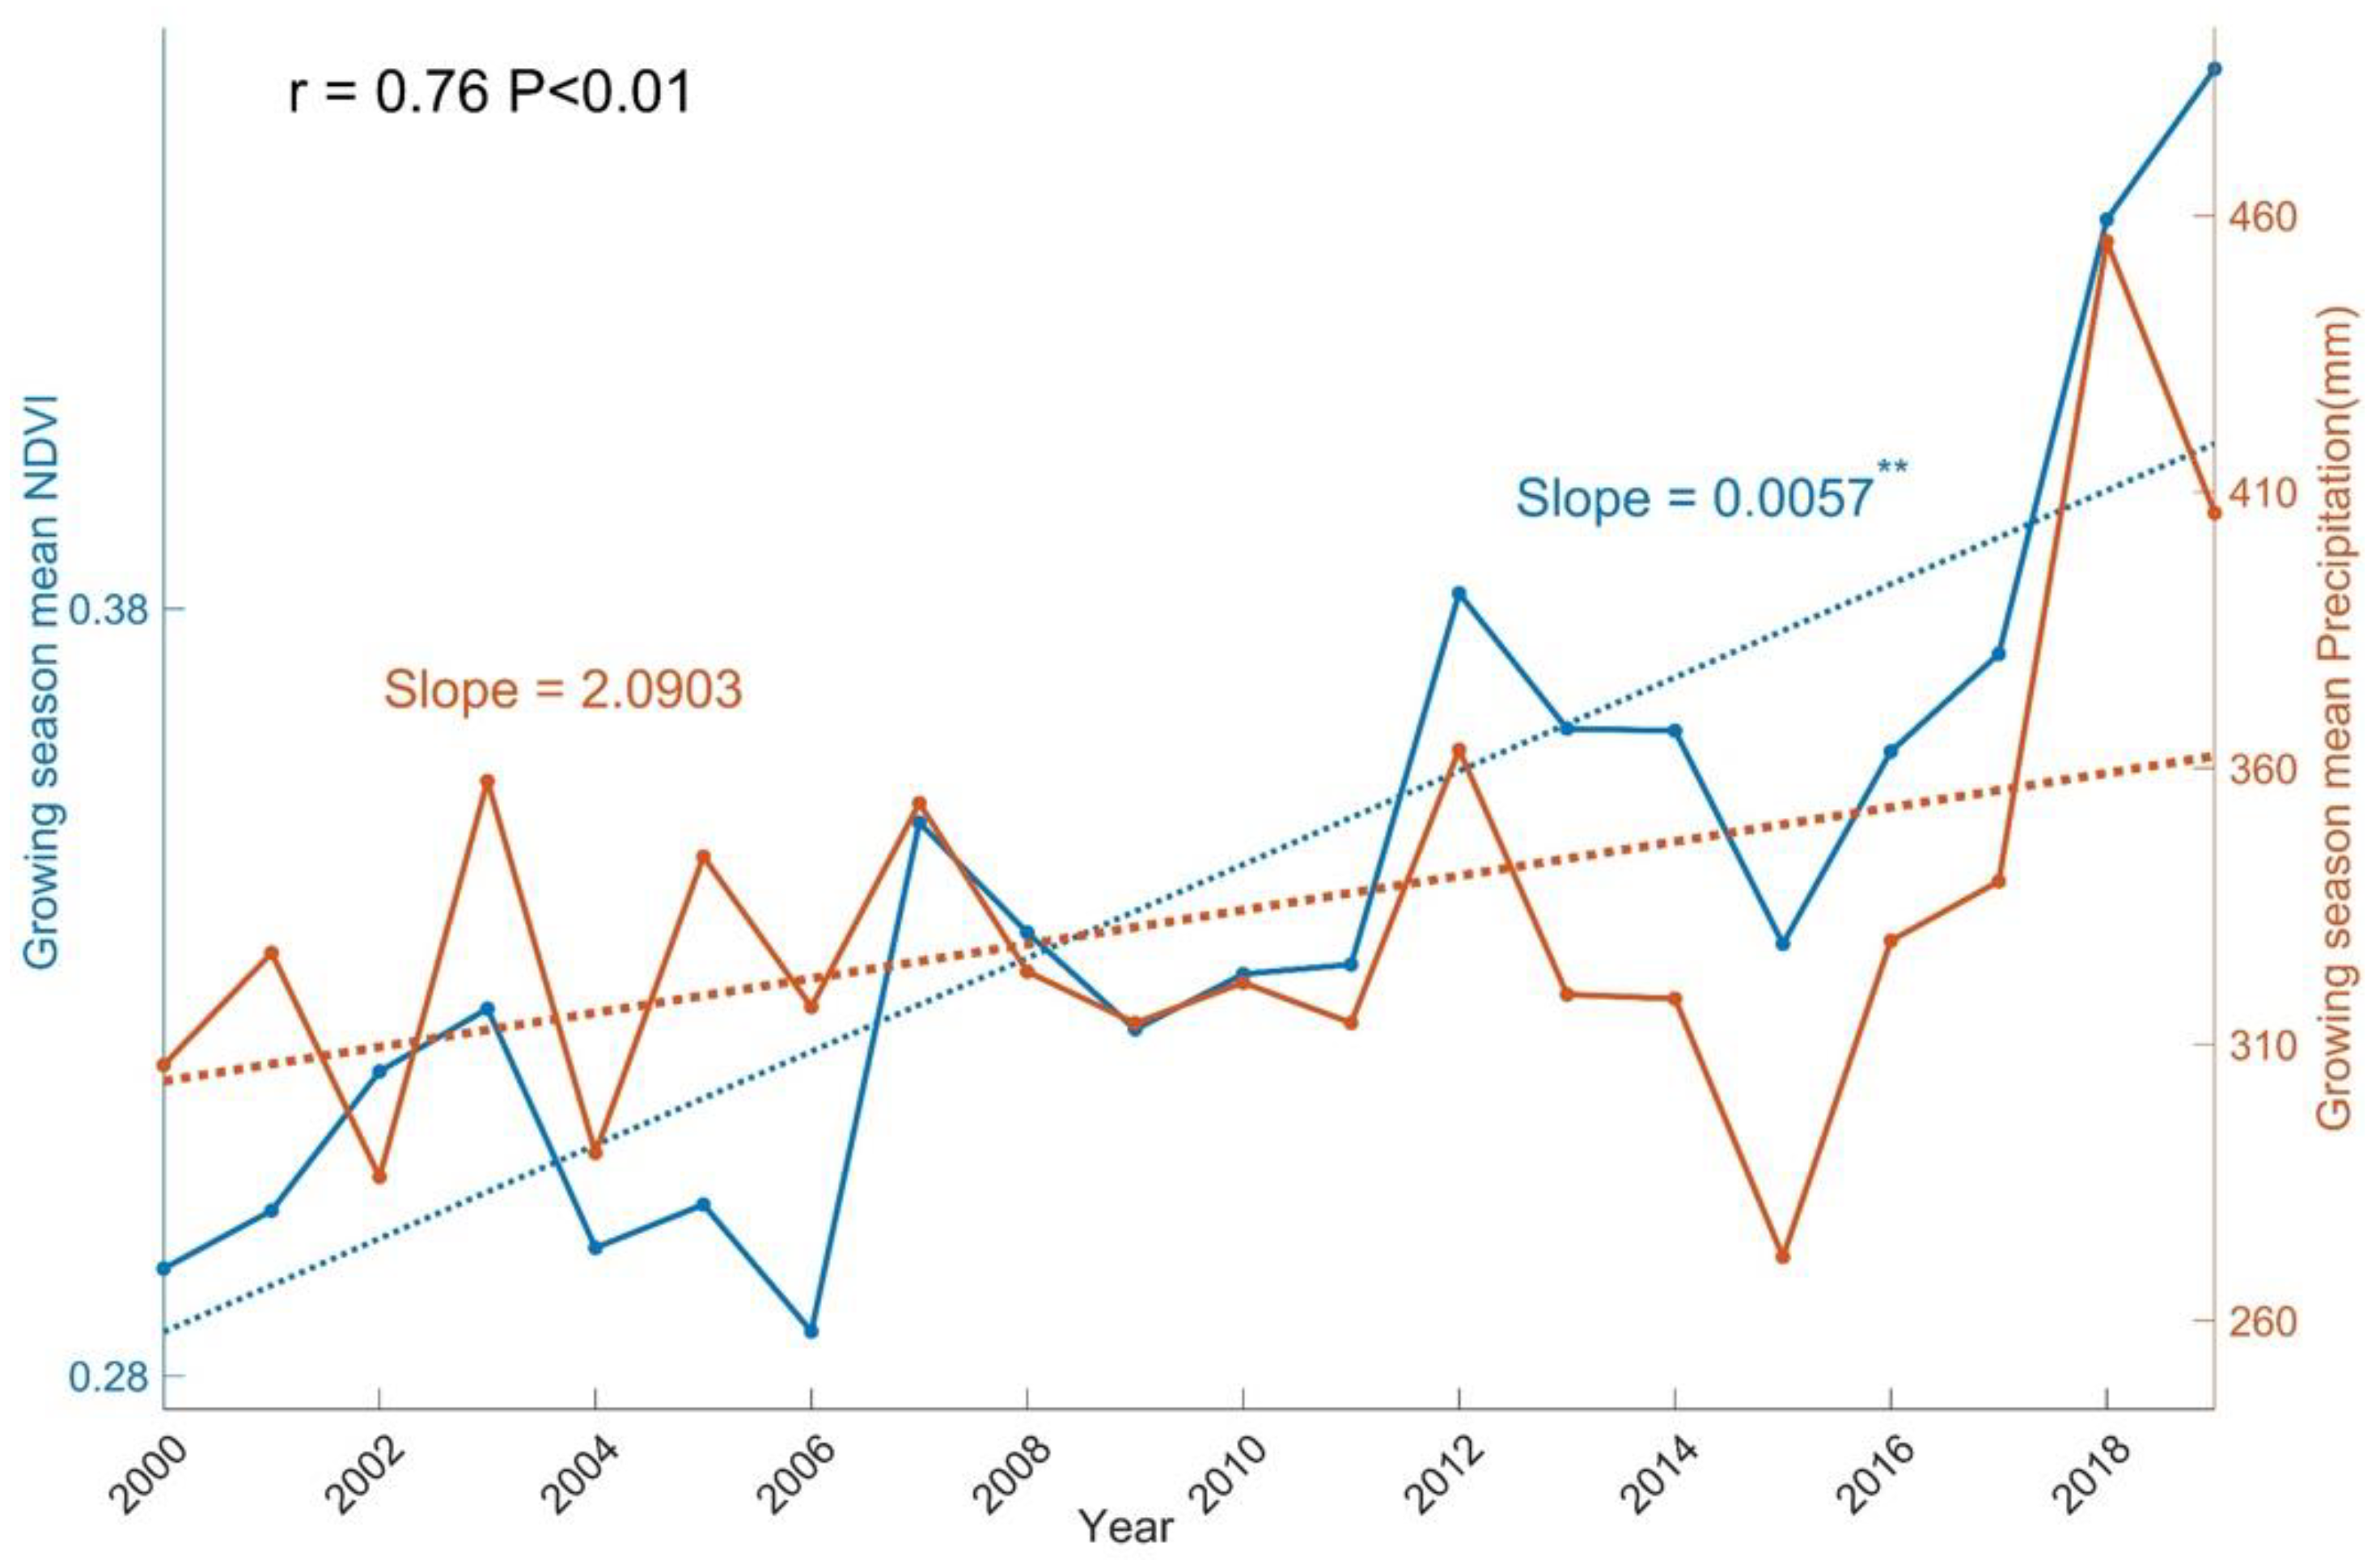
As we can see in Figure 10, the sudden drops in NDVI value in 2004–2006 and 2015 are related to the drop in precipitation in those years. The interannual variation of vegetation greenness is highly correlated with that of precipitation. Hence, precipitation might be the reason for the sudden drops in the NDVI value in the years of 2004–2006 and 2015.
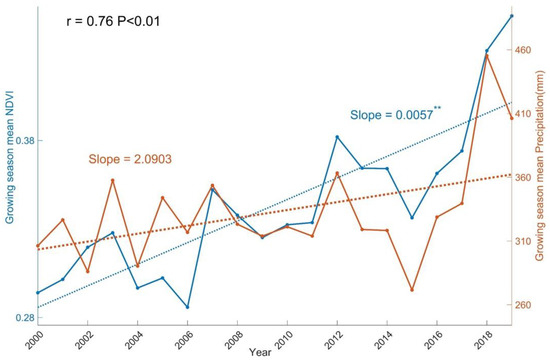
Figure 10.
Interannual variation of the growing season vegetation greenness and precipitation. Two asterisks indicate that the slope is at the 1% level of statistical significance.
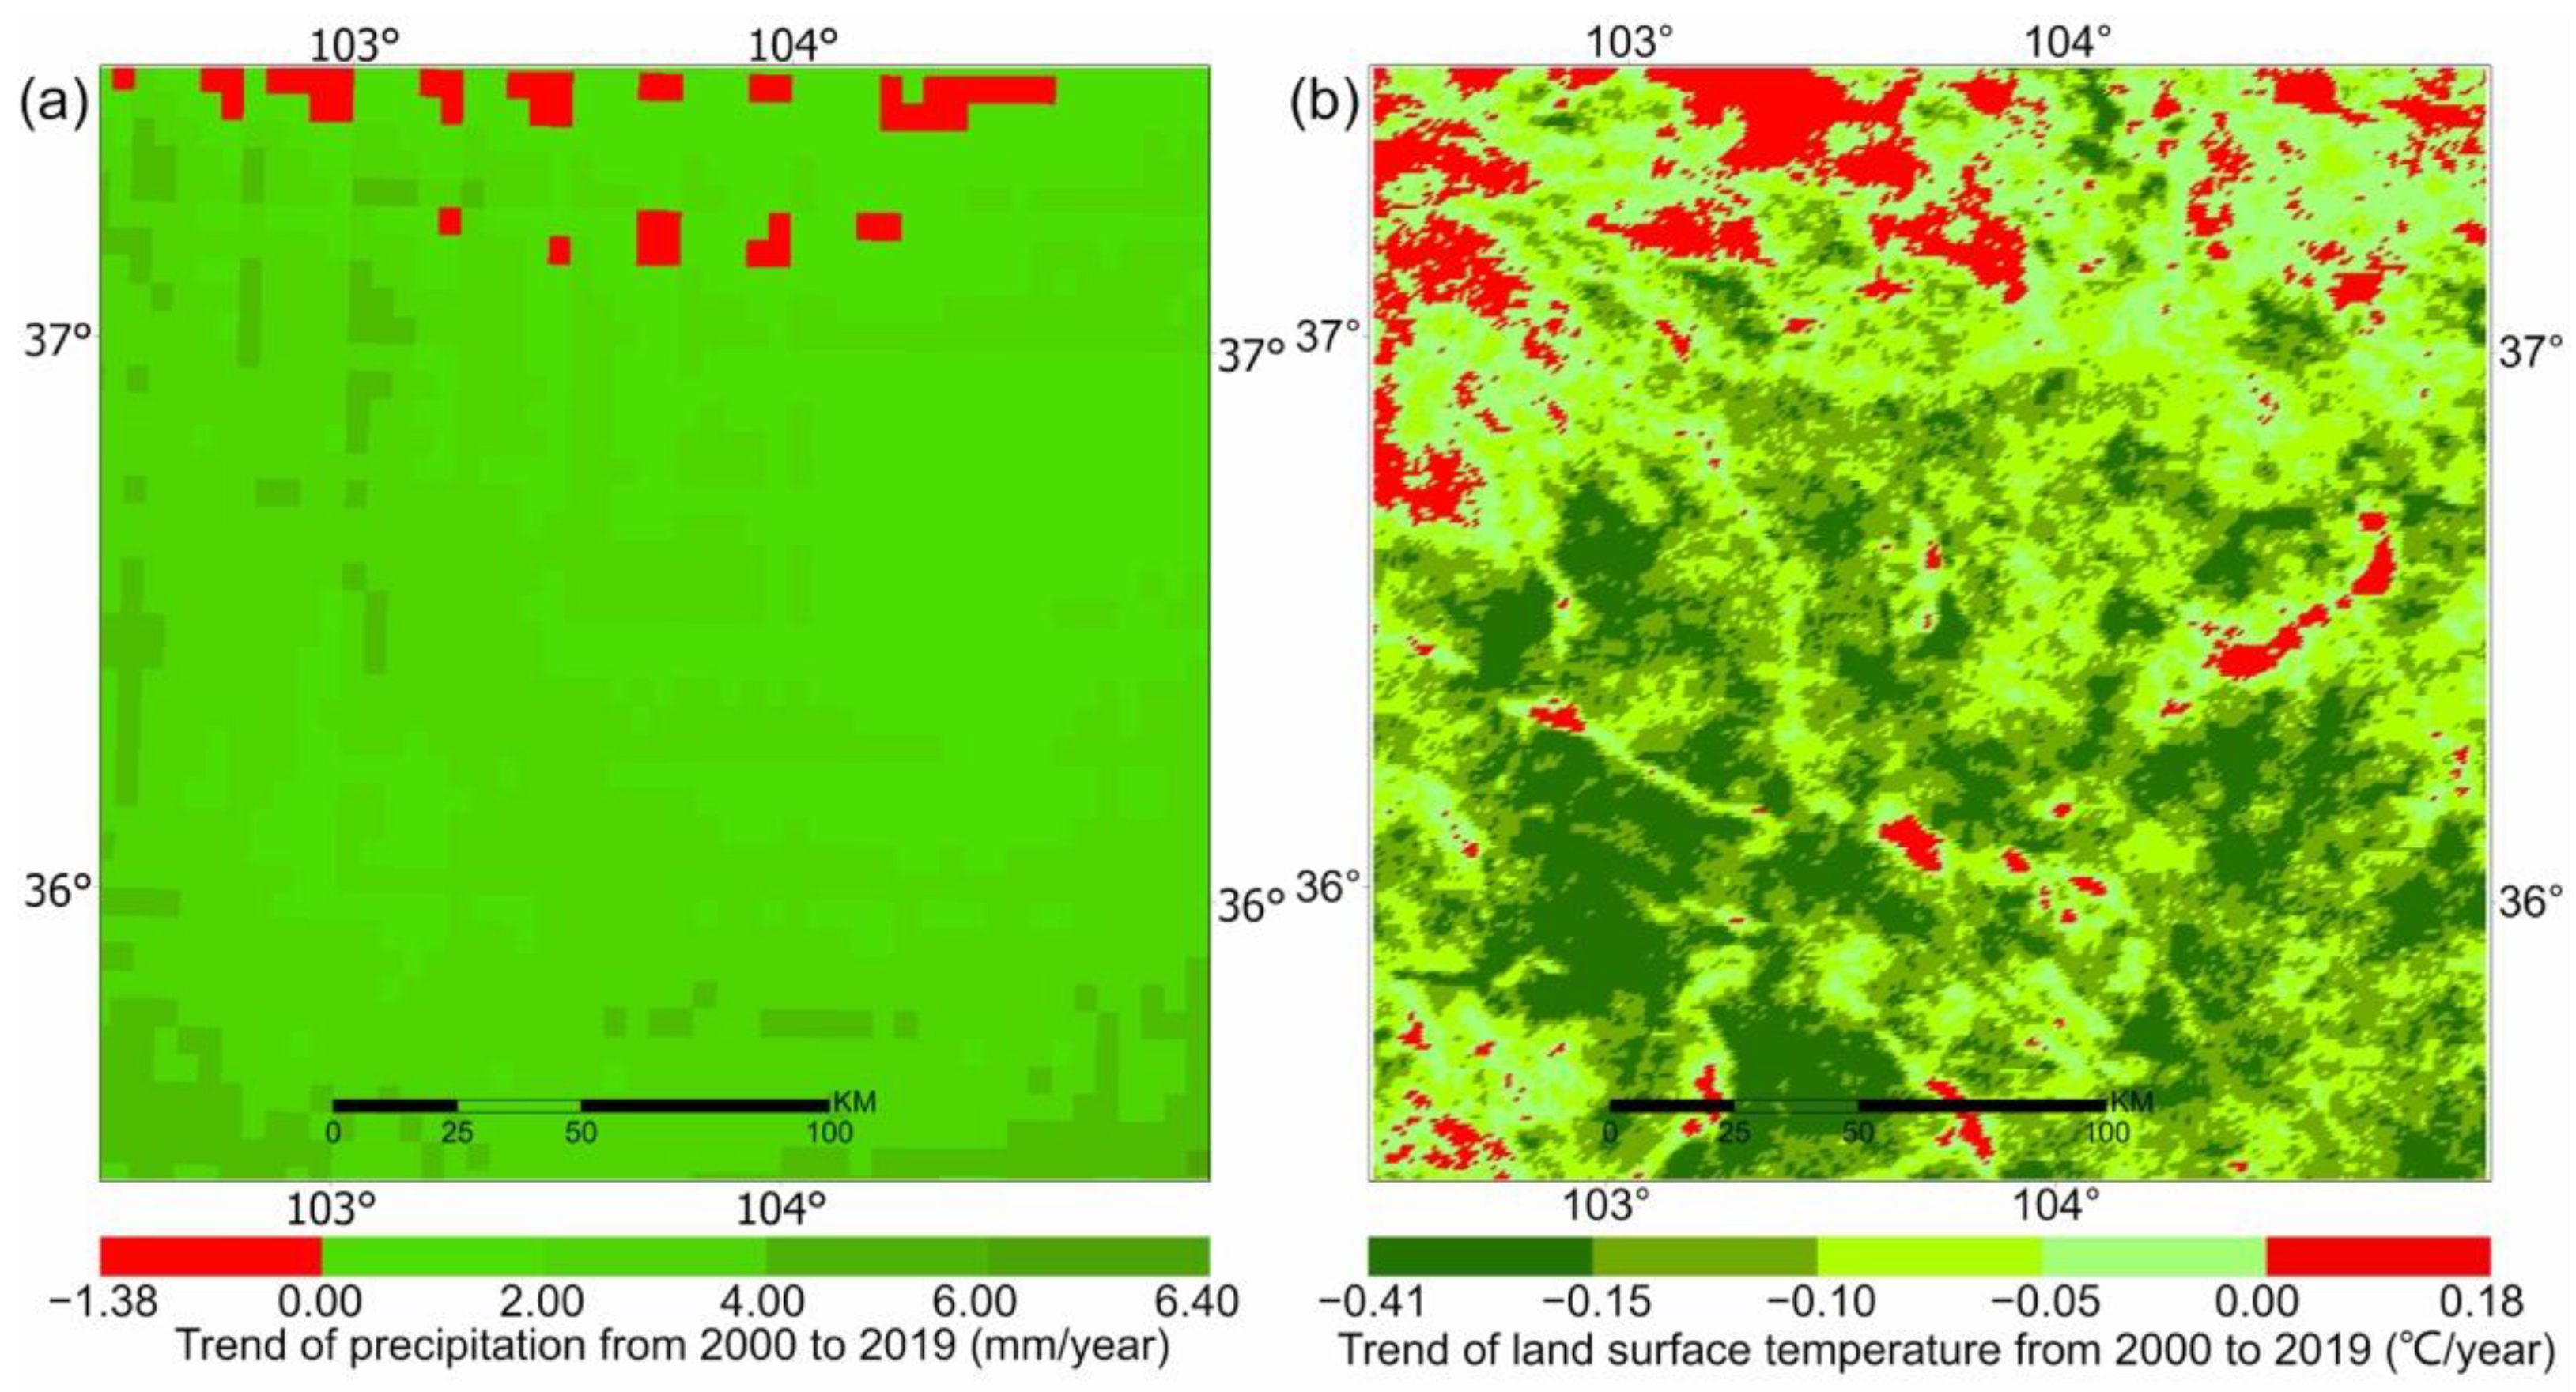
During the years from 2000 to 2019, the study area experienced increasing precipitation and decreasing land surface temperature (Figure 11). The spatial patterns of the precipitation and land surface temperature trends also agree with Figure 9 and Figure 10.

Figure 11.
Trends of the growing season precipitation (a) and temperature (b) in the study area for the years from 2000 to 2019.
5. Discussion
5.1. The Green-Up of Cropland and Natural Vegetation
The herbaceous and barren land has greened up more than forests in this semi-arid region (Figure 5). This is in part because forests’ NDVI are larger than those of non-forests—a small increase in NDVI for non-forests results in a large “percentage” increase in vegetation greenness. In general, in this semi-arid region, where forests and non-forests experienced similar climatic and environmental changes, the non-forest land greened up more significantly.
This significant change to non-forest land could have profound impacts on the carbon and water cycles, energy exchanges, and microclimate in semi-arid regions. Poulter et al. [24] suggested that the inter-annual variability of atmospheric CO2 concentration is largely driven by the dynamics of semi-arid ecosystems. To be more specific, it is probably the non-forest vegetation of semi-arid climatic zones that plays a dominant role in driving the interannual variability of the global carbon cycle. Ukkola et al. [26] suggested that semi-arid ecosystems in Australia became more prone to water stress from 1982 to 2010, and with the increase in atmospheric CO2, semi-arid catchments in Australia not only greened-up but also consumed more water, leading to significant reductions in streamflow. We suspect that significant changes to non-forests in semi-arid regions of Northwest China could also have similar impacts on the carbon and water cycles and microclimate, such as reductions in streamflow, which needs further investigation.
In this semi-arid region, the magnitudes of green-up for cropland and grasslands were very similar during the period from 2000 to 2019. Previous studies (e.g., [6,7,8]) suggested that agricultural practices, such as fertilization and irrigation, promote greening in agricultural land. This is not the case in the semi-arid region in Northwest China. This suggests that fertilization and irrigation practices have not changed much since 2000 in this semi-arid region, meaning that climate [14] and the CO2 fertilization effect [1] play major roles in the greening of cropland, as well as in the greening of natural vegetation. The CO2 fertilization effect causes plants to assimilate more carbon at the same level of stomata opening. The cropland greenness may further increase if more advanced agricultural management practices, such as drip irrigation, are adopted in this region [54].
5.2. Vegetation Green-Up and Its Effects on Air Temperature
Increasing vegetation decreases land surface albedo [55] and increases evapotranspiration (ET) [56]. Decreasing land surface albedo tends to amplify the land surface temperature by absorbing more solar energy, while increasing ET tends to decrease the land surface temperature by increasing turbulent energy fluxes. How these two mechanisms influence the land surface temperature depends on which of them dominates the influence [29]. Forzieri et al. [29] suggested that in dry regions, the magnitude of cooling from the enhanced ET is larger than that of warming from the decreased albedo.
In our investigation in the semi-arid region of Northwest China, some of the sites have a warming trend with increasing vegetation greenness, while some others have a cooling trend with vegetation green-up (Figure S2). At only one of the nine sites, which is barren land, growing season air temperature decreased with increasing vegetation greenness at the annual scale, while the other sites experienced moderate warm-up or no change with increasing vegetation greenness. This suggests that the mechanisms controlling the trends of interannual air temperature are more complex—factors other than changes in albedo and ET are also important, such as rising atmospheric CO2 concentration, elevation, topography, microclimate, etc. [57].
Nevertheless, the correlation coefficients between the detrended growing season vegetation greenness and the detrended growing season air temperature at the nine sites were all negative (Figure 7). This suggests that the mechanism of land surface cooling by enhanced ET from vegetation green-up generally dominates in this semi-arid region, which agrees with [29]. Hence, vegetation green-up in the semi-arid regions of Northwest China helps to mitigate climate warming, especially during the growing season. Huang et al. [58] suggested that there are air temperature optima of vegetation productivity across global biomes, and the optimum air temperature for the primary production of tropical forests are projected to decrease under all future climate scenarios, implying a decrease in tropical forests’ productivity, given the projected warming of the tropics. As for this semi-arid region in China, the cooling effect of increasing vegetation greenness slows down the increase in the growing season air temperature in the context of global warming, which alleviates the issue of ecosystem-level optimum air temperature change; nevertheless, more research is needed with regard to the projection of the optimum air temperature in this region.
5.3. Effects of Soil Moisture and Atmospheric Humidity on Vegetation Dynamics
At the nine meteorological sites in the semi-arid region, there were no statistically significant trends of growing season precipitation (Figure S3). Influenced by both precipitation and air temperature, VPD experienced statistically significant increasing trends at two of the nine stations, the land cover types of which are grassland and barren land; VPD at the other seven stations did not experience statistically significant trends (Figure S4, supplementary materials).
It is probably not precipitation that drove the vegetation green-up in this semi-arid region, since none of the nine sites experienced a statistically significant precipitation increase. VPD could not explain the vegetation green-up either, because two of the nine sites experienced statistically significant increasing trends of VPD, and the other seven sites experienced no statistically significant trends. Yuan et al. [2] suggested that increased atmospheric VPD reduces global vegetation growth. This is probably not the case in this semi-arid region during the period from 2000 to 2016.
Nonetheless, the correlation coefficients between the detrended growing season vegetation greenness and the detrended growing season precipitation as well as VPD at the seven low elevation sites were all greater than 0.5, and statistically significant (Figure 7). This suggests that in the semi-arid regions of Northwest China, water plays an important role in driving the interannual dynamics of vegetation. In general, the interannual dynamics of vegetation greenness in this semi-arid region correlate more with precipitation than with VPD. This suggests that soil moisture affects the growth of vegetation more than VPD does at the annual scale in this semi-arid region, which agrees with the claim that soil moisture dominates water stress on ecosystem production globally [38].
Huang et al. [59] investigated the change in ecosystem water use efficiency in response to climate change, and suggested that the seasonal trends of ecosystem water use efficiency are mainly associated with those of climate and not increasing atmospheric CO2 or nitrogen deposition. Our research shows that an increase in vegetation greenness was accompanied by a change in temperature, and this also implies the increase in ecosystem water use efficiency, because of the higher temperature sensitivity of GPP relative to ET, as suggested in [59]. Konings et al. [21] suggested that increases in VPD rather than changes in precipitation will dominantly influence future anisohydric grassland productivity. This is presently not the case in this semi-arid region—at six of the seven low elevation sites, vegetation greenness was correlated more with precipitation than with VPD, which may be due to the prevalent isohydric ecosystems in this region. Roby et al. [60] found that shrubs dominated by C3 photosynthetic pathways are more sensitive to VPD than grasses dominated by C4 pathways, which agrees with our results. Most of the vegetation in our study region are C3 plants, hence the vegetation greenness interannual variability is more sensitive to precipitation than to VPD. Yao et al. [61] highlighted the vulnerability of dryland subtypes to more frequent and severe climate extremes—this solicits continued monitoring of semi-arid regions.
Interannual vegetation dynamics are affected by direct human interference and environmental factors. Temperature, precipitation, and VPD are the three climatic factors closely related to vegetation photosynthesis in semi-arid regions. Hence, our study focused on the relationship between vegetation greenness and these three factors at the interannual scale. Nevertheless, other factors may also be important in the interannual vegetation dynamics, such as solar radiation, nitrogen deposition, as well as ecological conservation and restoration practices in China. Our study cannot exclude the impacts of other factors, but helps us to understand the driving factors for the vegetation dynamics in semi-arid regions. To further understand the driving factors, field control experiments are needed, such as the Free Air CO2 Enrichment experiment, rainfall addition and deduction experiments, chamber warming experiments, etc.
6. Conclusions
We assessed the dynamics of vegetation in a semi-arid region of Northwest China for the years from 2000 to 2019 through satellite remote sensing, and analyzed the interannual covariation between vegetation and three climatic factors—air temperature, precipitation, and VPD—at nine meteorological stations. The main findings of this research are: (1) herbaceous land greened up much more than forests (2.85%/year vs. 1.26%/year) in this semi-arid region; (2) the magnitudes of green-up for cropland and grasslands were very similar, suggesting that agronomic practices, such as fertilization and irrigation, might have contributed little to vegetation green-up in this semi-arid region since 2000; and (3) the interannual dynamics of vegetation at high altitudes in this region correlate little with temperature, precipitation, or VPD, suggesting that factors other than temperature and moisture control the interannual vegetation dynamics in this region. For follow-up research, it would be good to see if vegetation in other semi-arid regions exhibits similar characteristics of greening.
Supplementary Materials
The following are available online at www.mdpi.com/article/10.3390/rs13214246/s1, Figure S1: Availability of remote sensing observations for the study. (a) Average number of months without valid NDVI in the period from 2000 to 2019. (b) Standard deviation of the number of months without valid NDVI in the period from 2000 to 2019. In regions other than the Lanzhou basin, the monthly NDVI estimates during the growing season are almost complete. Figure S2: Inter-annual covariation between growing season NDVI and temperature at the nine meteorological stations for the years from 2000 to 2016. NDVI for a meteorological station is the average of NDVI values in the 3 by 3 km square collocated with the meteorological station. One asterisk indicates the coefficient is at the 0.05 level of statistical significance, and two asterisks at the 0.01 level of statistical significance. NDVI for the nine stations all experienced positive trends, five of which were statistically significant. In comparison, one of the nine stations experienced statistically significant warming, one experienced statistically significant cooling, and the other seven stations experienced no statistically significant temperature trends. The detrended NDVI and temperature are correlated significantly at only two stations, the land cover types of which are barren land and cropland, respectively. Additionally, these significant correlations are negative. This suggests that temperature plays a minor role in vegetation inter-annual dynamics in the study region, and conversely, temperature is affected by vegetation dynamics at the inter-annual scale, probably through evapotranspiration. Figure S3: Inter-annual covariation between growing season NDVI and precipitation at the nine meteorological stations for the years from 2000 to 2016. NDVI for a meteorological station is the average of NDVI values in the 3 by 3 km square collocated with the meteorological station. One asterisk indicates the coefficient is at the 0.05 level of statistical significance, and two asterisks at the 0.01 level of statistical significance. The NDVI for the nine stations all experienced positive trends, five of which were statistically significant. In contrast, precipitation at the nine stations experienced large inter-annual variations, and hence no statistically significant trends. The detrended NDVI and precipitation are positively correlated at the nine stations, and seven of the correlation coefficients are larger than 0.5 and statistically significant. This suggests that precipitation plays a major role in the vegetation inter-annual dynamics in the study region. Figure S4: Inter-annual covariation between growing season NDVI and vapor pressure deficit (VPD) at the nine meteorological stations for the years from 2000 to 2016. NDVI for a meteorological station is the average of NDVI values in the 3 by 3 km square collocated with the meteorological station. One asterisk indicates the coefficient is at the 0.05 level of statistical significance, and two asterisks at the 0.01 level of statistical significance. NDVI for the nine stations all experienced positive trends, five of which were statistically significant. In contrast, VPD at the nine stations experienced large inter-annual variations, and VPD at only two stations experienced statistically significant trends, both of which are positive. The detrended NDVI and VPD are negatively correlated at the nine stations, and seven of the correlation coefficients are less than -0.5 and statistically significant. In addition, the magnitudes of these correlation coefficients are generally smaller than those between NDVI and precipitation. This suggests that precipitation affected vegetation inter-annual variations more than VPD did in this semi-arid region.
Author Contributions
Conceptualization, Z.W., J.B. and Y.G.; Data curation, Z.W.; Methodology, Z.W.; Supervision, J.B.; Writing—original draft, Z.W. and J.B.; Writing—review and editing, Z.W., J.B. and Y.G. All authors have read and agreed to the published version of the manuscript.
Funding
This research was funded by the funding granted to new faculty of Lanzhou University.
Data Availability Statement
Not applicable.
Acknowledgments
The authors would like to thank the reviewers for their comments.
Conflicts of Interest
The authors declare no conflict of interest.
References
- Zhu, Z.; Piao, S.; Myneni, R.B.; Huang, M.; Zeng, Z.; Canadell, J.G.; Ciais, P.; Sitch, S.; Friedlingstein, P.; Arneth, A.; et al. Greening of the Earth and its drivers. Nat. Clim. Chang. 2016, 6, 791–795. [Google Scholar] [CrossRef]
- Yuan, W.; Zheng, Y.; Piao, S.; Ciais, P.; Lombardozzi, D.; Wang, Y.; Ryu, Y.; Chen, G.; Dong, W.; Hu, Z.; et al. In-creased atmospheric vapor pressure deficit reduces global vegetation growth. Sci. Adv. 2019, 5, 1396. [Google Scholar] [CrossRef] [PubMed] [Green Version]
- Myneni, R.; Keeling, C.D.; Tucker, C.J.; Asrar, G.; Nemani, R. Increased plant growth in the northern high latitudes from 1981 to 1997. Nat. Cell Biol. 1997, 386, 698–702. [Google Scholar] [CrossRef]
- Xu, L.; Myneni, R.; Iii, F.S.C.; Callaghan, T.V.; Pinzon, J.E.; Tucker, C.J.; Zhu, Z.; Bi, J.; Ciais, P.; Tømmervik, H.; et al. Temperature and vegetation seasonality diminishment over northern lands. Nat. Clim. Chang. 2013, 3, 581–586. [Google Scholar] [CrossRef] [Green Version]
- Song, X.-P.; Hansen, M.C.; Stehman, S.V.; Potapov, P.V.; Tyukavina, A.; Vermote, E.F.; Townshend, J.R. Global land change from 1982 to 2016. Nature 2018, 560, 639–643. [Google Scholar] [CrossRef] [PubMed]
- Gray, J.; Frolking, S.; Kort, E.; Ray, D.; Kucharik, C.; Ramankutty, N.; Friedl, M.A. Direct human influence on atmospheric CO2 seasonality from increased cropland productivity. Nat. Cell Biol. 2014, 515, 398–401. [Google Scholar] [CrossRef]
- Zeng, N.; Zhao, F.; Collatz, G.J.; Kalnay, E.; Salawitch, R.J.; West, T.O.; Guanter, L. Agricultural Green Revolution as a driver of increasing atmospheric CO2 seasonal amplitude. Nat. Cell Biol. 2014, 515, 394–397. [Google Scholar] [CrossRef]
- Chen, C.; Park, T.; Wang, X.; Piao, S.; Xu, B.; Chaturvedi, R.K.; Fuchs, R.; Brovkin, V.; Ciais, P.; Fensholt, R.; et al. China and India lead in greening of the world through land-use management. Nat. Sustain. 2019, 2, 122–129. [Google Scholar] [CrossRef]
- Piao, S.; Wang, X.; Park, T.; Chen, C.; Lian, X.; He, Y.; Bjerke, J.; Chen, A.; Ciais, P.; Tømmervik, H.; et al. Characteristics, drivers and feedbacks of global greening. Nat. Rev. Earth Environ. 2020, 1, 14–27. [Google Scholar] [CrossRef]
- Bi, J.; Knyazikhin, Y.; Choi, S.; Park, T.; Barichivich, J.; Ciais, P.; Fu, R.; Ganguly, S.; Hall, F.; Hilker, T.; et al. Sun-light mediated seasonality in canopy structure and photosynthetic activity of Amazonian rainforests. Environ. Res. Lett. 2015, 10, 064014. [Google Scholar] [CrossRef] [Green Version]
- Leakey, A.; Ainsworth, E.A.; Bernacchi, C.; Rogers, A.; Long, S.; Ort, D.R. Elevated CO2 effects on plant carbon, nitrogen, and water relations: Six important lessons from FACE. J. Exp. Bot. 2009, 60, 2859–2876. [Google Scholar] [CrossRef]
- Frank, D.; Poulter, B.; Saurer, M.; Esper, J.; Huntingford, C.; Helle, G.; Treydte, K.; Zimmermann, N.; Schleser, G.H.; Ahlström, A.; et al. Water-use efficiency and transpiration across European forests during the Anthropocene. Nat. Clim. Chang. 2015, 5, 579–583. [Google Scholar] [CrossRef] [Green Version]
- Pan, Y.; Birdsey, R.A.; Fang, J.; Houghton, R.; Kauppi, P.E.; Kurz, W.A.; Phillips, O.L.; Shvidenko, A.; Lewis, S.L.; Canadell, J.G.; et al. A Large and Persistent Carbon Sink in the World’s Forests. Science 2011, 333, 988–993. [Google Scholar] [CrossRef] [PubMed] [Green Version]
- Nemani, R.R.; Keeling, C.D.; Hashimoto, H.; Jolly, W.M.; Piper, S.C.; Tucker, C.J.; Myneni, R.B.; Running, S.W. Climate-Driven Increases in Global Terrestrial Net Primary Production from 1982 to 1999. Science 2003, 300, 1560–1563. [Google Scholar] [CrossRef] [Green Version]
- Maestre, F.T.; Eldridge, D.J.; Soliveres, S.; Kéfi, S.; Delgado-Baquerizo, M.; Bowker, M.A.; García-Palacios, P.; Gaitán, J.; Gallardo, A.; Lázaro, R.; et al. Structure and Functioning of Dryland Ecosystems in a Changing World. Annu. Rev. Ecol. Evol. Syst. 2016, 47, 215–237. [Google Scholar] [CrossRef] [PubMed] [Green Version]
- Burrell, A.L.; Evans, J.P.; Liu, Y. Detecting dryland degradation using time series segmentation and residual trend analysis (TSS-RESTREND). Remote Sens. Environ. 2017, 197, 43–57. [Google Scholar] [CrossRef]
- Huang, L.; He, B.; Chen, A.; Wang, H.; Liu, J.; Lű, A.; Chen, Z. Drought dominates the interannual variability in global terrestrial net primary production by controlling semi-arid ecosystems. Sci. Rep. 2016, 6, 24639. [Google Scholar] [CrossRef] [Green Version]
- Bailey, R.M. Spatial and temporal signatures of fragility and threshold proximity in modelled semi-arid vegetation. Proc. R. Soc. B Biol. Sci. 2011, 278, 1064–1071. [Google Scholar] [CrossRef] [Green Version]
- John, R.; Chen, J.; Lu, N.; Wilske, B. Land cover/land use change in semi-arid Inner Mongolia: 1992–2004. Environ. Res. Lett. 2009, 4, 045010. [Google Scholar] [CrossRef]
- Ding, J.; Yang, T.; Zhao, Y.; Liu, D.; Wang, X.; Yao, Y.; Peng, S.; Wang, T.; Piao, S. Increasingly Important Role of Atmospheric Aridity on Tibetan Alpine Grasslands. Geophys. Res. Lett. 2018, 45, 2852–2859. [Google Scholar] [CrossRef]
- Konings, A.G.; Williams, P.; Gentine, P. Sensitivity of grassland productivity to aridity controlled by stomatal and xylem regulation. Nat. Geosci. 2017, 10, 284–288. [Google Scholar] [CrossRef]
- Wang, J.; Xie, Y.; Wang, X.; Guo, K. Driving Factors of Recent Vegetation Changes in Hexi Region, Northwest China Based on a New Classification Framework. Remote Sens. 2020, 12, 1758. [Google Scholar] [CrossRef]
- Guan, Q.; Yang, L.; Pan, N.; Lin, J.; Xu, C.; Wang, F.; Liu, Z. Greening and Browning of the Hexi Corridor in Northwest China: Spatial Patterns and Responses to Climatic Variability and Anthropogenic Drivers. Remote Sens. 2018, 10, 1270. [Google Scholar] [CrossRef] [Green Version]
- Poulter, B.; Frank, D.; Ciais, P.; Myneni, R.B.; Andela, N.; Bi, J.; Broquet, G.; Canadell, J.G.; Chevallier, F.; Liu, Y.Y.; et al. Contribution of semi-arid ecosystems to interannual variability of the global carbon cycle. Nat. Cell Biol. 2014, 509, 600–603. [Google Scholar] [CrossRef] [Green Version]
- Ahlström, A.; Raupach, M.R.; Schurgers, G.; Smith, B.; Arneth, A.; Jung, M.; Reichstein, M.; Canadell, J.G.; Friedlingstein, P.; Jain, A.K.; et al. The dominant role of semi-arid ecosystems in the trend and variability of the land CO2 sink. Science 2015, 348, 895–899. [Google Scholar] [CrossRef] [Green Version]
- Ukkola, A.; Prentice, I.C.; Keenan, T.F.; Van Dijk, A.; Viney, N.; Myneni, R.; Bi, J. Reduced streamflow in water-stressed climates consistent with CO2 effects on vegetation. Nat. Clim. Chang. 2015, 6, 75–78. [Google Scholar] [CrossRef] [Green Version]
- Zhao, M.; Geruo, A.; Zhang, J.; Velicogna, I.; Liang, C.; Li, Z. Ecological restoration impact on total terrestrial water storage. Nat. Sustain. 2021, 4, 56–62. [Google Scholar] [CrossRef]
- Piao, S.; Nan, H.; Huntingford, C.; Ciais, P.; Friedlingstein, P.; Sitch, S.; Peng, S.; Ahlström, A.; Canadell, J.G.; Cong, N.; et al. Evidence for a weakening relationship between interannual temperature variability and northern vegetation activity. Nat. Commun. 2014, 5, 5018. [Google Scholar] [CrossRef] [Green Version]
- Forzieri, G.; Alkama, R.; Miralles, D.G.; Cescatti, A. Satellites reveal contrasting responses of regional climate to the widespread greening of Earth. Science 2017, 356, 1180–1184. [Google Scholar] [CrossRef] [PubMed] [Green Version]
- Peng, S.; Piao, S.; Zeng, Z.; Ciais, P.; Zhou, L.; Li, L.; Myneni, R.; Yin, Y.; Zeng, H. Afforestation in China cools local land surface temperature. Proc. Natl. Acad. Sci. USA 2014, 111, 2915–2919. [Google Scholar] [CrossRef] [Green Version]
- Jiang, B.; Liang, S.; Yuan, W. Observational evidence for impacts of vegetation change on local surface climate over northern China using the Granger causality test. J. Geophys. Res. Biogeosci. 2015, 120, 1–12. [Google Scholar] [CrossRef]
- Shen, M.; Piao, S.; Jeong, S.J.; Zhou, L.; Zeng, Z.; Ciais, P.; Chen, D.; Huang, M.; Jin, C.S.; Li, L.Z.; et al. Evap-orative cooling over the Tibetan Plateau induced by vegetation growth. Proc. Natl. Acad. Sci. USA 2015, 112, 9299–9304. [Google Scholar] [CrossRef] [Green Version]
- Huang, J.; Li, Y.; Fu, C.; Chen, F.; Fu, Q.; Dai, A.; Shinoda, M.; Ma, Z.; Guo, W.; Li, Z.; et al. Dryland climate change: Recent progress and challenges. Rev. Geophys. 2017, 55, 719–778. [Google Scholar] [CrossRef]
- Qiu, B.; Chen, G.; Tang, Z.; Lu, D.; Wang, Z.; Chen, C. Assessing the Three-North Shelter Forest Pro-gram in China by a novel framework for characterizing vegetation changes. ISPRS J. Photogramm. Remote Sens. 2017, 133, 75–88. [Google Scholar] [CrossRef]
- Chen, Y.; Wang, K.; Lin, Y.; Shi, W.; Song, Y.; He, X. Balancing green and grain trade. Nat. Geosci. 2015, 8, 739–741. [Google Scholar] [CrossRef]
- Feng, X.; Fu, B.; Piao, S.; Wang, S.; Ciais, P.; Zeng, Z.; Lü, Y.; Zeng, Y.; Li, Y.; Jiang, X.; et al. Revegetation in China’s Loess Plateau is approaching sustainable water resource limits. Nat. Clim. Chang. 2016, 6, 1019–1022. [Google Scholar] [CrossRef]
- New, M.; Hulme, M.; Jones, P. Representing twentieth-century space–time climate variability. Part II: Development of 1901–96 monthly grids of terrestrial surface climate. J. Clim. 2000, 13, 2217–2238. [Google Scholar] [CrossRef]
- Liu, L.; Gudmundsson, L.; Hauser, M.; Qin, D.; Li, S.; Seneviratne, S.I. Seneviratne, Soil moisture dominates dryness stress on ecosystem production globally. Nat. Commun. 2020, 11, 4892. [Google Scholar] [CrossRef]
- Gocic, M.; Trajkovic, S. Analysis of changes in meteorological variables using Mann-Kendall and Sen’s slope estimator statistical tests in Serbia. Glob. Planet Chang. 2013, 100, 172–182. [Google Scholar] [CrossRef]
- Huete, A.; Didan, K.; Miura, T.; Rodriguez, E.P.; Gao, X.; Ferreira, L.G. Overview of the radiometric and bio-physical performance of the MODIS vegetation indices. Remote Sens. Environ. 2002, 83, 195–213. Available online: https://lpdaac.usgs.gov/products/mod13q1v006/ (accessed on 16 September 2020). [CrossRef]
- Gong, P.; Liu, H.; Zhang, M.; Li, C.; Wang, J.; Huang, H.; Clinton, N.; Ji, L.; Li, W.; Bai, Y.; et al. Stable classification with limited sample: Transferring a 30-m resolution sample set collected in 2015 to mapping 10-m resolution global land cover in 2017. Sci. Bull. 2019, 64, 370–373. Available online: http://data.ess.tsinghua.edu.cn (accessed on 25 August 2020). [CrossRef] [Green Version]
- Wan, Z. New refinements and validation of the collection-6 MODIS land-surface temperature/emissivity product. Remote Sens. Environ. 2014, 140, 36–45. [Google Scholar] [CrossRef]
- Farr, T.G.; Rosen, P.A.; Caro, E.; Crippen, R.; Duren, R.; Hensley, S.; Kobrick, M.; Paller, M.; Rodriguez, E.; Roth, L.; et al. The Shuttle Radar Topography Mission. Rev. Geophys. 2004, 45, RG2004. [Google Scholar] [CrossRef] [Green Version]
- China Meteorological Data Network. Available online: http://data.cma.cn/ (accessed on 12 September 2020).
- Funk, C.; Peterson, P.; Landsfeld, M.; Pedreros, D.; Verdin, J.; Shukla, S.; Husak, G.; Rowland, J.; Harrison, L.; Hoell, A.; et al. The climate hazards infrared precipitation with stations—a new environmental record for monitoring extremes. Sci. Data 2015, 2, 1–21. [Google Scholar] [CrossRef] [Green Version]
- Muñoz-Sabater, J.; Dutra, E.; Agustí-Panareda, A.; Albergel, C.; Arduini, G.; Balsamo, G.; Boussetta, S.; Choulga, M.; Harrigan, S.; Hersbach, H.; et al. ERA5-Land: A state-of-the-art global reanalysis dataset for Land ap-plications. Earth Syst. Sci. Data Discuss. 2021, 13, 4349–4383. [Google Scholar] [CrossRef]
- Kendall, M.G. Rank Correlation Methods; Griffin: Oxford, UK, 1948. [Google Scholar]
- Wang, J.; Xie, Y.; Wang, X.; Dong, J.; Bie, Q. Detecting Patterns of Vegetation Gradual Changes (2001–2017) in Shiyang River Basin, Based on a Novel Framework. Remote Sens. 2019, 11, 2475. [Google Scholar] [CrossRef] [Green Version]
- Zhang, Y.; Peng, C.; Li, W.; Tian, L.; Zhu, Q.; Chen, H.; Fang, X.; Zhang, G.; Liu, G.; Mu, X.; et al. Multiple afforestation pro-grams accelerate the greenness in the “Three North” region of China from 1982 to 2013. Ecol. Indic. 2016, 61, 404–412. [Google Scholar] [CrossRef]
- Piao, S.; Fang, J.; Zhou, L.; Ciais, P.; Zhu, B. Variations in satellite-derived phenology in China’s temperate vegetation. Glob. Chang. Biol. 2006, 12, 672–685. [Google Scholar] [CrossRef]
- Bi, J.; Myneni, R.; Lyapustin, A.; Wang, Y.; Park, T.; Chi, C.; Yan, K.; Knyazikhin, Y. Amazon Forests’ Response to Droughts: A Perspective from the MAIAC Product. Remote Sens. 2016, 8, 356. [Google Scholar] [CrossRef] [Green Version]
- Abdi, A.M.; Boke-Olén, N.; Tenenbaum, D.E.; Tagesson, T.; Cappelaere, B.; Ardö, J. Evaluating Water Controls on Vegetation Growth in the Semi-Arid Sahel Using Field and Earth Observation Data. Remote Sens. 2017, 9, 294. [Google Scholar] [CrossRef] [Green Version]
- Wang, L.P.; Duan, S.B.; Zhang, X.Y.; Chang, S. The influence of afforestation on land surface temperature in China. Natl. Remote. Sens. Bull. 2021, 25, 1862–1872. [Google Scholar]
- Zou, H.; Fan, J.; Zhang, F.; Xiang, Y.; Wu, L.; Yan, S. Optimization of drip irrigation and fertilization regimes for high grain yield, crop water productivity and economic benefits of spring maize in Northwest China. Agric. Water Manag. 2020, 230, 105986. [Google Scholar] [CrossRef]
- Li, Q.; Ma, M.; Wu, X.; Yang, H. Snow Cover and Vegetation-Induced Decrease in Global Albedo From 2002 to 2016. J. Geophys. Res. Atmos. 2018, 123, 124–138. [Google Scholar] [CrossRef] [Green Version]
- Shao, R.; Zhang, B.; Su, T.; Long, B.; Cheng, L.; Xue, Y.; Yang, W. Estimating the Increase in Regional Evaporative Water Consumption as a Result of Vegetation Restoration Over the Loess Plateau, China. J. Geophys. Res. Atmos. 2019, 124, 11783–11802. [Google Scholar] [CrossRef]
- Chen, C.; Li, D.; Li, Y.; Piao, S.; Wang, X.; Huang, M.; Gentine, P.; Nemani, R.R.; Myneni, R.B. Biophysical impacts of Earth greening largely controlled by aerodynamic resistance. Sci. Adv. 2020, 6, eabb1981. [Google Scholar] [CrossRef]
- Huang, M.; Piao, S.; Ciais, P.; Peñuelas, J.; Wang, X.; Keenan, T.F.; Peng, S.; Berry, J.A.; Wang, K.; Mao, J.; et al. Air temperature optima of vegetation productivity across global biomes. Nat. Ecol. Evol. 2019, 3, 772–779. [Google Scholar] [CrossRef]
- Huang, M.; Piao, S.; Zeng, Z.; Peng, S.; Ciais, P.; Cheng, L.; Mao, J.; Poulter, B.; Shi, X.; Yao, Y.; et al. Seasonal responses of terrestrial ecosystem water-use efficiency to climate change. Glob. Chang. Biol. 2016, 22, 2165–2177. [Google Scholar] [CrossRef]
- Roby, M.C.; Scott, R.L.; Moore, D.J.P. High Vapor Pressure Deficit Decreases the Productivity and Water Use Efficiency of Rain-Induced Pulses in Semiarid Ecosystems. J. Geophys. Res. Biogeosci. 2020, 125, 5665. [Google Scholar] [CrossRef]
- Yao, J.; Liu, H.; Huang, J.; Gao, Z.; Wang, G.; Li, D.; Yu, H.; Chen, X. Accelerated dryland expansion regulates future variability in dryland gross primary production. Nat. Commun. 2020, 11, 1–10. [Google Scholar] [CrossRef] [Green Version]


Publisher’s Note: MDPI stays neutral with regard to jurisdictional claims in published maps and institutional affiliations. |
© 2021 by the authors. Licensee MDPI, Basel, Switzerland. This article is an open access article distributed under the terms and conditions of the Creative Commons Attribution (CC BY) license (https://creativecommons.org/licenses/by/4.0/).