Abstract
The current glacial lake datasets in the High Mountain Asia (HMA) region still need to be improved because their boundary divisions in the land–water transition zone are not precisely delineate, and also some very small glacial lakes have been lost due to their mixed reflectance with backgrounds. In addition, most studies have only focused on the changes in the area of a glacial lake as a whole, but do not involve the actual changes of per pixel on its boundary and the potential controlling factors. In this research, we produced more accurate and complete maps of glacial lake extent in the HMA in 2008, 2012, and 2016 with consistent time intervals using Landsat satellite images and the Google Earth Engine (GEE) cloud computing platform, and further studied the formation, distribution, and dynamics of the glacial lakes. In total, 17,016 and 21,249 glacial lakes were detected in 2008 and 2016, respectively, covering an area of 1420.15 ± 232.76 km2 and 1577.38 ± 288.82 km2; the lakes were mainly located at altitudes between 4400 m and 5600 m. The annual areal expansion rate was approximately 1.38% from 2008 to 2016. To explore the cause of the rapid expansion of individual glacial lakes, we investigated their long-term expansion rates by measuring changes in shoreline positions. The results show that glacial lakes are expanding rapidly in areas close to glaciers and had a high expansion rate of larger than 20 m/yr from 2008 to 2016. Glacial lakes in the Himalayas showed the highest expansion rate of more than 2 m/yr, followed by the Karakoram Mountains (1.61 m/yr) and the Tianshan Mountains (1.52 m/yr). The accelerating rate of glacier ice and snow melting caused by global warming is the primary contributor to glacial lake growth. These results may provide information that will help in the understanding of detailed lake dynamics and the mechanism, and also facilitate the scientific recognition of the potential hazards associated with glacial lakes in this region.
1. Introduction
The High Mountain Asia (HMA), consisting mainly of the Tibetan Plateau (TP) and the surrounding mountains, has the largest volume of glaciers in the world outside the Arctic and Antarctic and is known as the Earth’s third pole [1,2]. In response to significant warming since the 1950s, more than half of the glaciers in the HMA have been found to be retreating [3,4,5,6]. Meanwhile, the size and number of glacial lake systems have increased rapidly in recent years [7,8,9]. This glacier retreat has been accompanied by a growth in the population living close to the high mountains and potentially dangerous glacial lakes are emerging in the glaciated regions. Given the right trigger produced by an avalanche, rockslide or calving, the natural moraine or ice dams that impound these glacial lakes can be breached, resulting in catastrophic glacial lake outburst floods (GLOFs) [10,11,12]. In the HMA, these GLOFs usually originate at high altitudes and can travel downstream for long distances, potentially endangering people and damaging infrastructure in the valleys.
Because of poor accessibility and difficulties in collecting field-based measurements, satellite remote sensing has proven to be an effective tool for studying and monitoring glacial lake changes over the long-term [13,14,15,16]. Landsat images including Landsat Multispectral Scanner (MSS), Landsat Thematic Mapper (TM), Landsat Enhanced Thematic Mapper Plus (ETM+), and Landsat Operational Land Imager (OLI) data are a primary data source for cryospheric research, and provide glacier and glacial lake extent information from 1972 onward [17,18,19,20,21]. The recent rapid growth of glacial lakes in the Mount Everest region of Nepal [22,23] and the Nyainqentanglha range in the central Tibetan Plateau [24,25] was investigated using several types of remote sensing data. According to measurements derived from Landsat satellite images, seasonal lake-area changes of glacial lakes in the Northern Tien Shan were examined and found that their variability was mainly related to the regional geomorphological conditions [26]. An integrated understanding of the relationship between the glacier change, debris expansion, and glacial lake evolution were improved based on the observation data in the central Himalayas [27]. Because the southeastern Tibetan Plateau suffered from serious GLOF hazards, studies on glacial lake dynamics and hazard assessments were performed and were of great significance for this area [18,28]. As well as studies of some typical areas in the HMA, much progress has been made in making quantitative estimates of glacial lake dynamics at a large scale and in other inaccessible glaciated regions using automated adaptive lake mapping methods and manual interpretation. Himalayan glacial lake and GLOF inventories were derived, which identified the Southern Himalayas as a hotspot region [29,30]. Glacial lake inventories for the Tibet Plateau were also produced [31] combined with geomorphological data, where numerous unreported GLOFs were found and their risk were modeled [32,33]. More recently, there have been efforts at producing glacial lake dataset in the whole HMA region [20,34]. Apart from the optical images, high resolution satellite Synthetic Aperture Radar (SAR) data such as TerraSAR-X, Radarsat-2 [35,36], ALOS PALSAR imagery [26,37], and Sentinel-1 [38,39] can also be employed for reliable detection of glacial lakes.
Although the investigations of glacial lake changes have already been conducted in the central Himalayas, the southeastern Tibet Plateau, the Tianshan Mountains or even the whole HMA region for specific time periods, the relevant datasets still need to be further improved because the rich details of the edge of the glacial lake were not fully captured and a significant amount of very small glacial lakes were missing. Specifically, manual digitization is still the main approach for glacial lake mapping. The accuracy and level of detail in the derived glacial lake maps are unstable, which depend on the image acquisition conditions and the diverse characteristics of the glacial lakes, etc. The commonly used mapping techniques such as water indices work well under homogeneous spectral conditions, the classification accuracy is hampered in complex surroundings—a severe limitation for high mountain areas in general and for areas affected by different atmospheric circulation patterns in particular. This complicates reliable, long-term monitoring of glacial lakes in the HMA. Some automated methods based on the active contour models have been proposed for the extraction of glacial lake outlines and have proven to be effective for spectrally heterogeneous backgrounds [40,41]. However, because the initial contours from global thresholding results of NDWIs may not be optimal and complete as well as the interference of bad observations, some small glacial lakes and the local details of the lake edges were not precisely delineated. Apart from the lake datasets, at present, predicting where or when significant outburst hazards will probably develop is not possible because so little is known about the processes involved during the lake development. Therefore, a much greater understanding of the mechanisms and processes involved in the lake formation and expansion is required, specifically in terms of changes in shoreline position and the direction of its movement, in order to allow for the accurate prediction of potential hazards and to provide timely mitigation.
Having an ongoing and continuously updated inventory of glacial lakes remains important for the investigation of the latest distribution of the lakes and their spatial-temporal heterogeneities, and the assessment of glacier and climate change as well as GLOF hazard risks. To address this need, the objectives of our study were (1) to employ high spatial resolution Landsat imagery (30 m) acquired in 2008, 2012, and 2016 that had the consistent time intervals to produce the accurate and complete glacial lake maps; (2) to detect changes in the number and extent of glacial lakes in the HMA and to quantify these rates of change in the shoreline position over time for the different river basins; and (3) to examine the distribution of these features in the HMA and discuss their formation, dynamics, and relation to the climate change.
2. Study Area
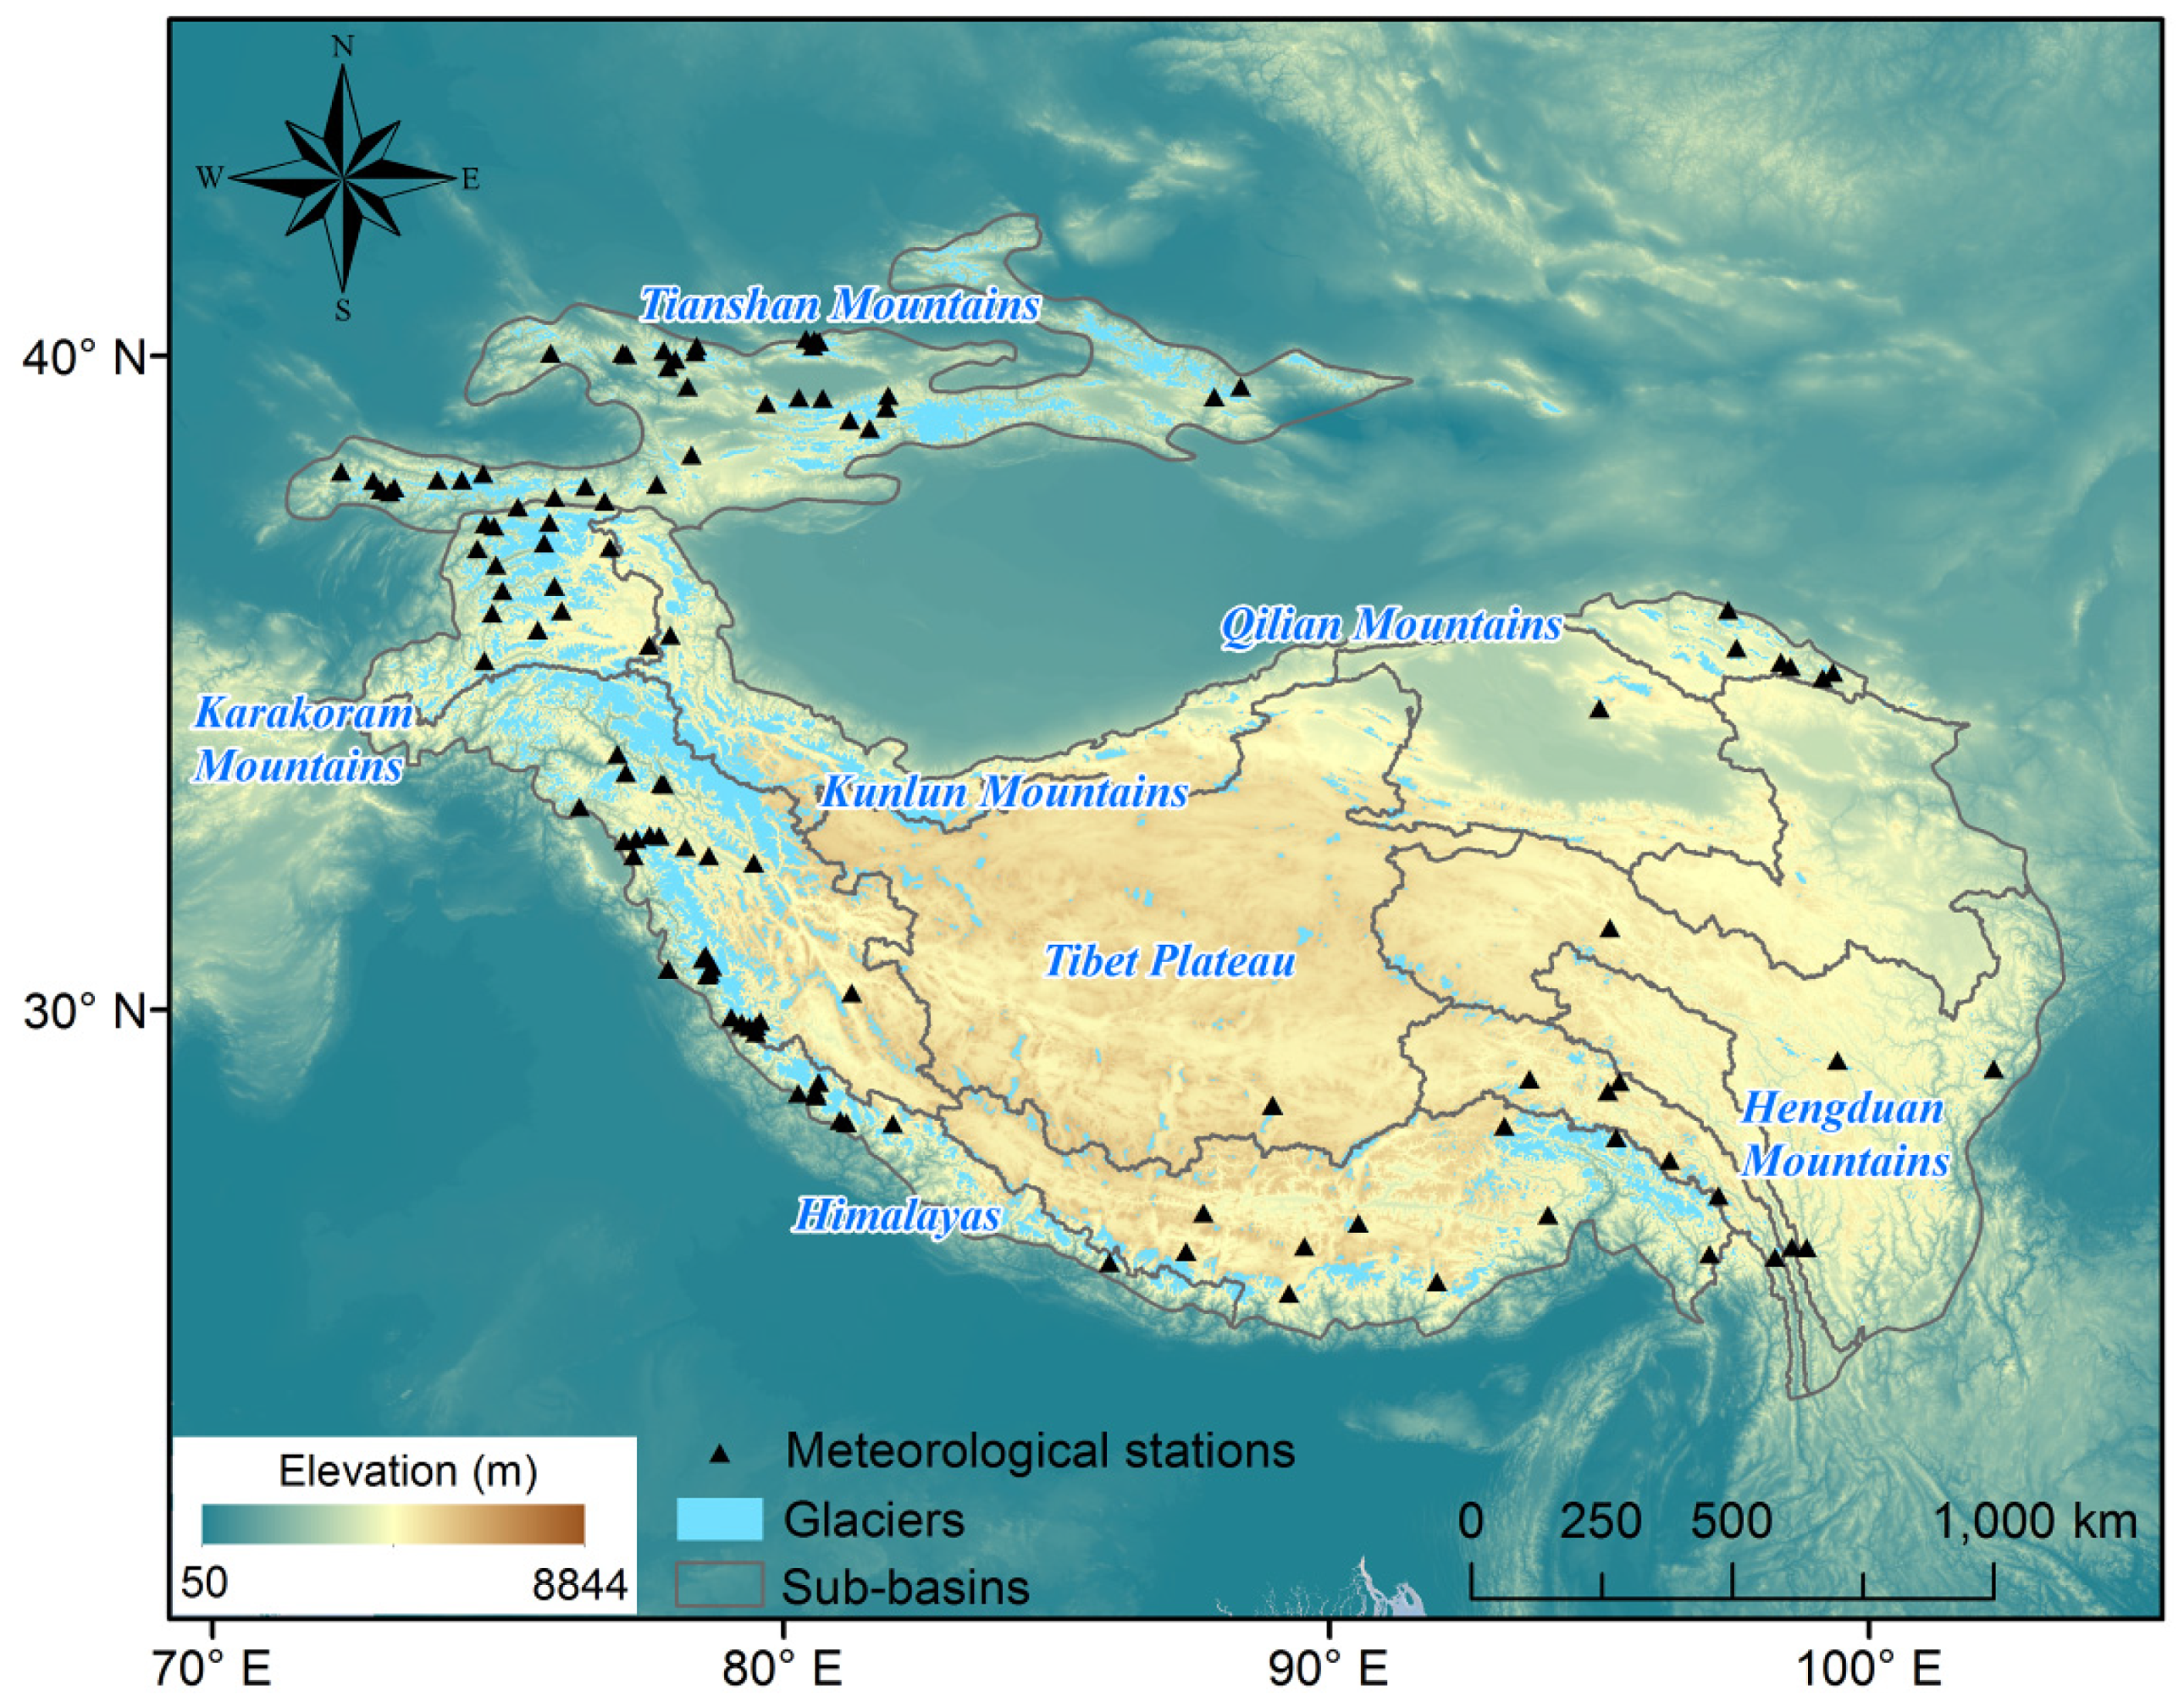
HMA refers to the high-altitude region in Central Asia centered on the Tibet Plateau, which includes the Himalayas, Nyainqentanglha, Kunlun, Karakoram, Tianshan, and other mountain systems (Figure 1). The area is approximately 3804.98 × 103 km2, accounting for 9.34% of the total land area of Asia [42]. The topography of the HMA is complex, steep, and changeable, and the altitude ranges from 2000 m to 8844 m with an average altitude of 4046 m. It has the largest amount of snow and ice outside the two poles and is the source of the 10 largest rivers in Asia [43]. The glaciers in the HMA can be divided into three types: ocean warm glaciers, subcontinental glaciers, and extremely continental cold glaciers. Since the 1990s, the glaciers in the HMA have basically turned into a state of comprehensive retreat, the most obvious being the glaciers in Southeast Tibet as well as the glaciers in other low altitude areas [44,45]. However, other studies have also pointed out the “Karakoram anomaly” in the Karakoram mountain region, that is, the glacier area, and reserves in this region remain relatively stable, even with a slightly increasing trend [5,46]. In addition to the glaciers, permafrost is widely spread on the plateau, serving as an important part of the natural ecosystem. The climate in the HMA region are mainly characterized by the low temperature and intense solar radiation, closely related with the Asian monsoon and the global climate dynamic change [47]. The southeast region is warm and wet, while the northwest is cold and dry. The average annual temperature decreases from 20 °C in southeast to below −6 °C in northwest [1]. Because the warm and humid airflow in the South Ocean is blocked by multiple mountain ranges, the annual precipitation also decreased from 2000 mm to less than 50 mm, and precipitation in the marginal areas was greater than that in the Tibetan interior mountains.

Figure 1.
The location of sub-basins of High Mountain Asia (HMA). Glacier outlines are from the Randolph Glacier Inventory (RGI v6.0), the Second Chinese Glacier Inventory (CGI2), and the GAMDAM inventory, and are drawn in sky blue; the positions of the China Meteorological Administration (CMA) stations are indicated by black triangles.
3. Data and Methods
3.1. Study Materials
3.1.1. Landsat Images
Landsat TM, ETM+, and OLI images with a spatial resolution of 30 m covering three time periods—2008, 2012, and 2016—were acquired from the Google Earth Engine (GEE) cloud computing platform (https://earthengine.google.org/ (accessed on 10 May 2021)). All Landsat images used in this study were Level 1 Terrain-corrected (L1T) data and had been radiometrically corrected and projected in the UTM coordinate system. A total of approximately 4052 scenes covering the entire HMA were used to produce the glacial lake maps for each year. To reduce the influence of seasonal lake fluctuations on the glacial lake dynamic monitoring, one effective solution is to map glacial lakes and measure their long-term changes during stable seasons when lake extents are minimally affected by meteorological conditions and glacier runoff. Here, the selected Landsat data were generally from the months of July to November. During this period, the Landsat images featured less perennial snow coverage. The lakes also reached their maximum extent, specifically around the end of the glacier ablation season (June–August) [11].
3.1.2. Glacier Inventory Data
The Randolph Glacier Inventory (RGI) is a near globally complete inventory of glacier outlines excluding the ice sheets. RGI version 6.0, released on 28 July 2017, has improved coverage and reorganized flag attributes [48]. For our study area, glacier outlines were extracted from Region 13 (Central Asia), Region 14 (South Asia West), and Region 15 (South Asia East). To improve quality, the RGI v6.0 incorporated glacier outlines from the Second Chinese Glacier Inventory (CGI2) [49] for the northern flanks of the HMA and from the GAMDAM inventory for the southern side [50]. Based on the glacier inventory data, in this study, a 10 km buffer around the glacier outlines was generated and used to determine the extent of glacial lakes [51]. It was intended that this buffer would include nearly all the glacial lakes present in the region that are closely related to glaciers and exclude lakes located farther from the glacier termini.
3.1.3. Digital Elevation Model (DEM) data
DEM data were obtained to investigate the altitudinal distribution of glacial lakes as well as to derive terrain slopes and aspect information over the HMA. This study used version 3 of the Shuttle Radar Topography Mission (SRTM3) DEM, which has a 30-m resolution and was acquired in February 2000. SRTM DEM has high vertical accuracy and can accurately represent the topographic details. Although there are a few data gaps in this version as a consequence of radar shadow, layover, and insufficient interferometric coherence, most of these gaps cover rather rugged high-mountain terrain and almost no data gaps are present over the relatively flat areas such as the glacier tongues and the surroundings of the glacial lakes [52]. During the mapping process, some of the glacial lakes were easily mixed up with mountain shadows due to the similar spectral characteristics. To eliminate the influence from terrain shadows, slope and shaded relief maps derived from the SRTM were used.
3.1.4. Meteorological Observations
Annual and monthly temperature and precipitation data were collected for HMA from the China Meteorological Administration (CMA) stations (http://data.cma.cn/ (accessed on 21 May 2021)) for the period 1979–2016. The locations of the 117 meteorological stations used are shown in Figure 1. It can be seen that weather stations are distributed unevenly in the HMA. Therefore, the monthly gridded climate dataset from the Global Precipitation Climatology Project (GPCP) together with NOAA National Center for Environmental Prediction (NCEP) Reanalysis information were used to examine spatial changes in climate in the HMA. The GPCP time-series data (v2.3) combined observations and satellite precipitation data into 2.5° × 2.5° global grids and included four climate variables [53]. The combined GPCP satellite-based precipitation dataset was then adjusted using a rain gauge analysis. It was provided by the NOAA/OAR/ESRL Physical Sciences Division (PSD) and can be downloaded online from http://www.esrl.noaa.gov/psd/ (accessed on 25 May 2021). The NCEP/NCAR Reanalysis project uses a state-of-the-art analysis/forecast system to perform data assimilation using data from 1948 to the present. The Reanalysis information and selected output are also available online at http://www.ncep.noaa.gov (accessed on 30 May 2021). All these data were used to measure the climatic variables.
3.2. Methods
3.2.1. Glacial Lake Mapping
The automation of glacial lake mapping using satellite-derived remotely sensed data remains a challenge across HMA because of heterogeneous reflectance, complex lake features, and limited access to local knowledge. To overcome these limitations, annual glacial lake extents for 2008, 2012, and 2016 were extracted using an automatic and effective mapping method that integrated global threshold segmentation with a non-local active contour (NLAC) model [41]. Because of the superior ability to delineate water bodies and the most stable threshold provided, the modified normalized difference water index (MNDWI) [54], which was calculated from standardized top-of-atmosphere (TOA) reflectance data, was used to derive the potential extent of the glacial lakes. The method used included (i) pre-processing of a large amount of Landsat TOA data using the GEE; (ii) extraction of the potential glacial lake areas by applying a loose initial MNDWI threshold; and (iii) regional refinement of individual glacial lake using the NLAC model. Based on an inspection of sample lakes that were manually digitized, the automatic mapping method produced good results. Given that the spatial resolution of Landsat images and the relative stability of glacial lakes, only lakes larger than nine pixels (≥0.0081 km2) were considered in this study [30].
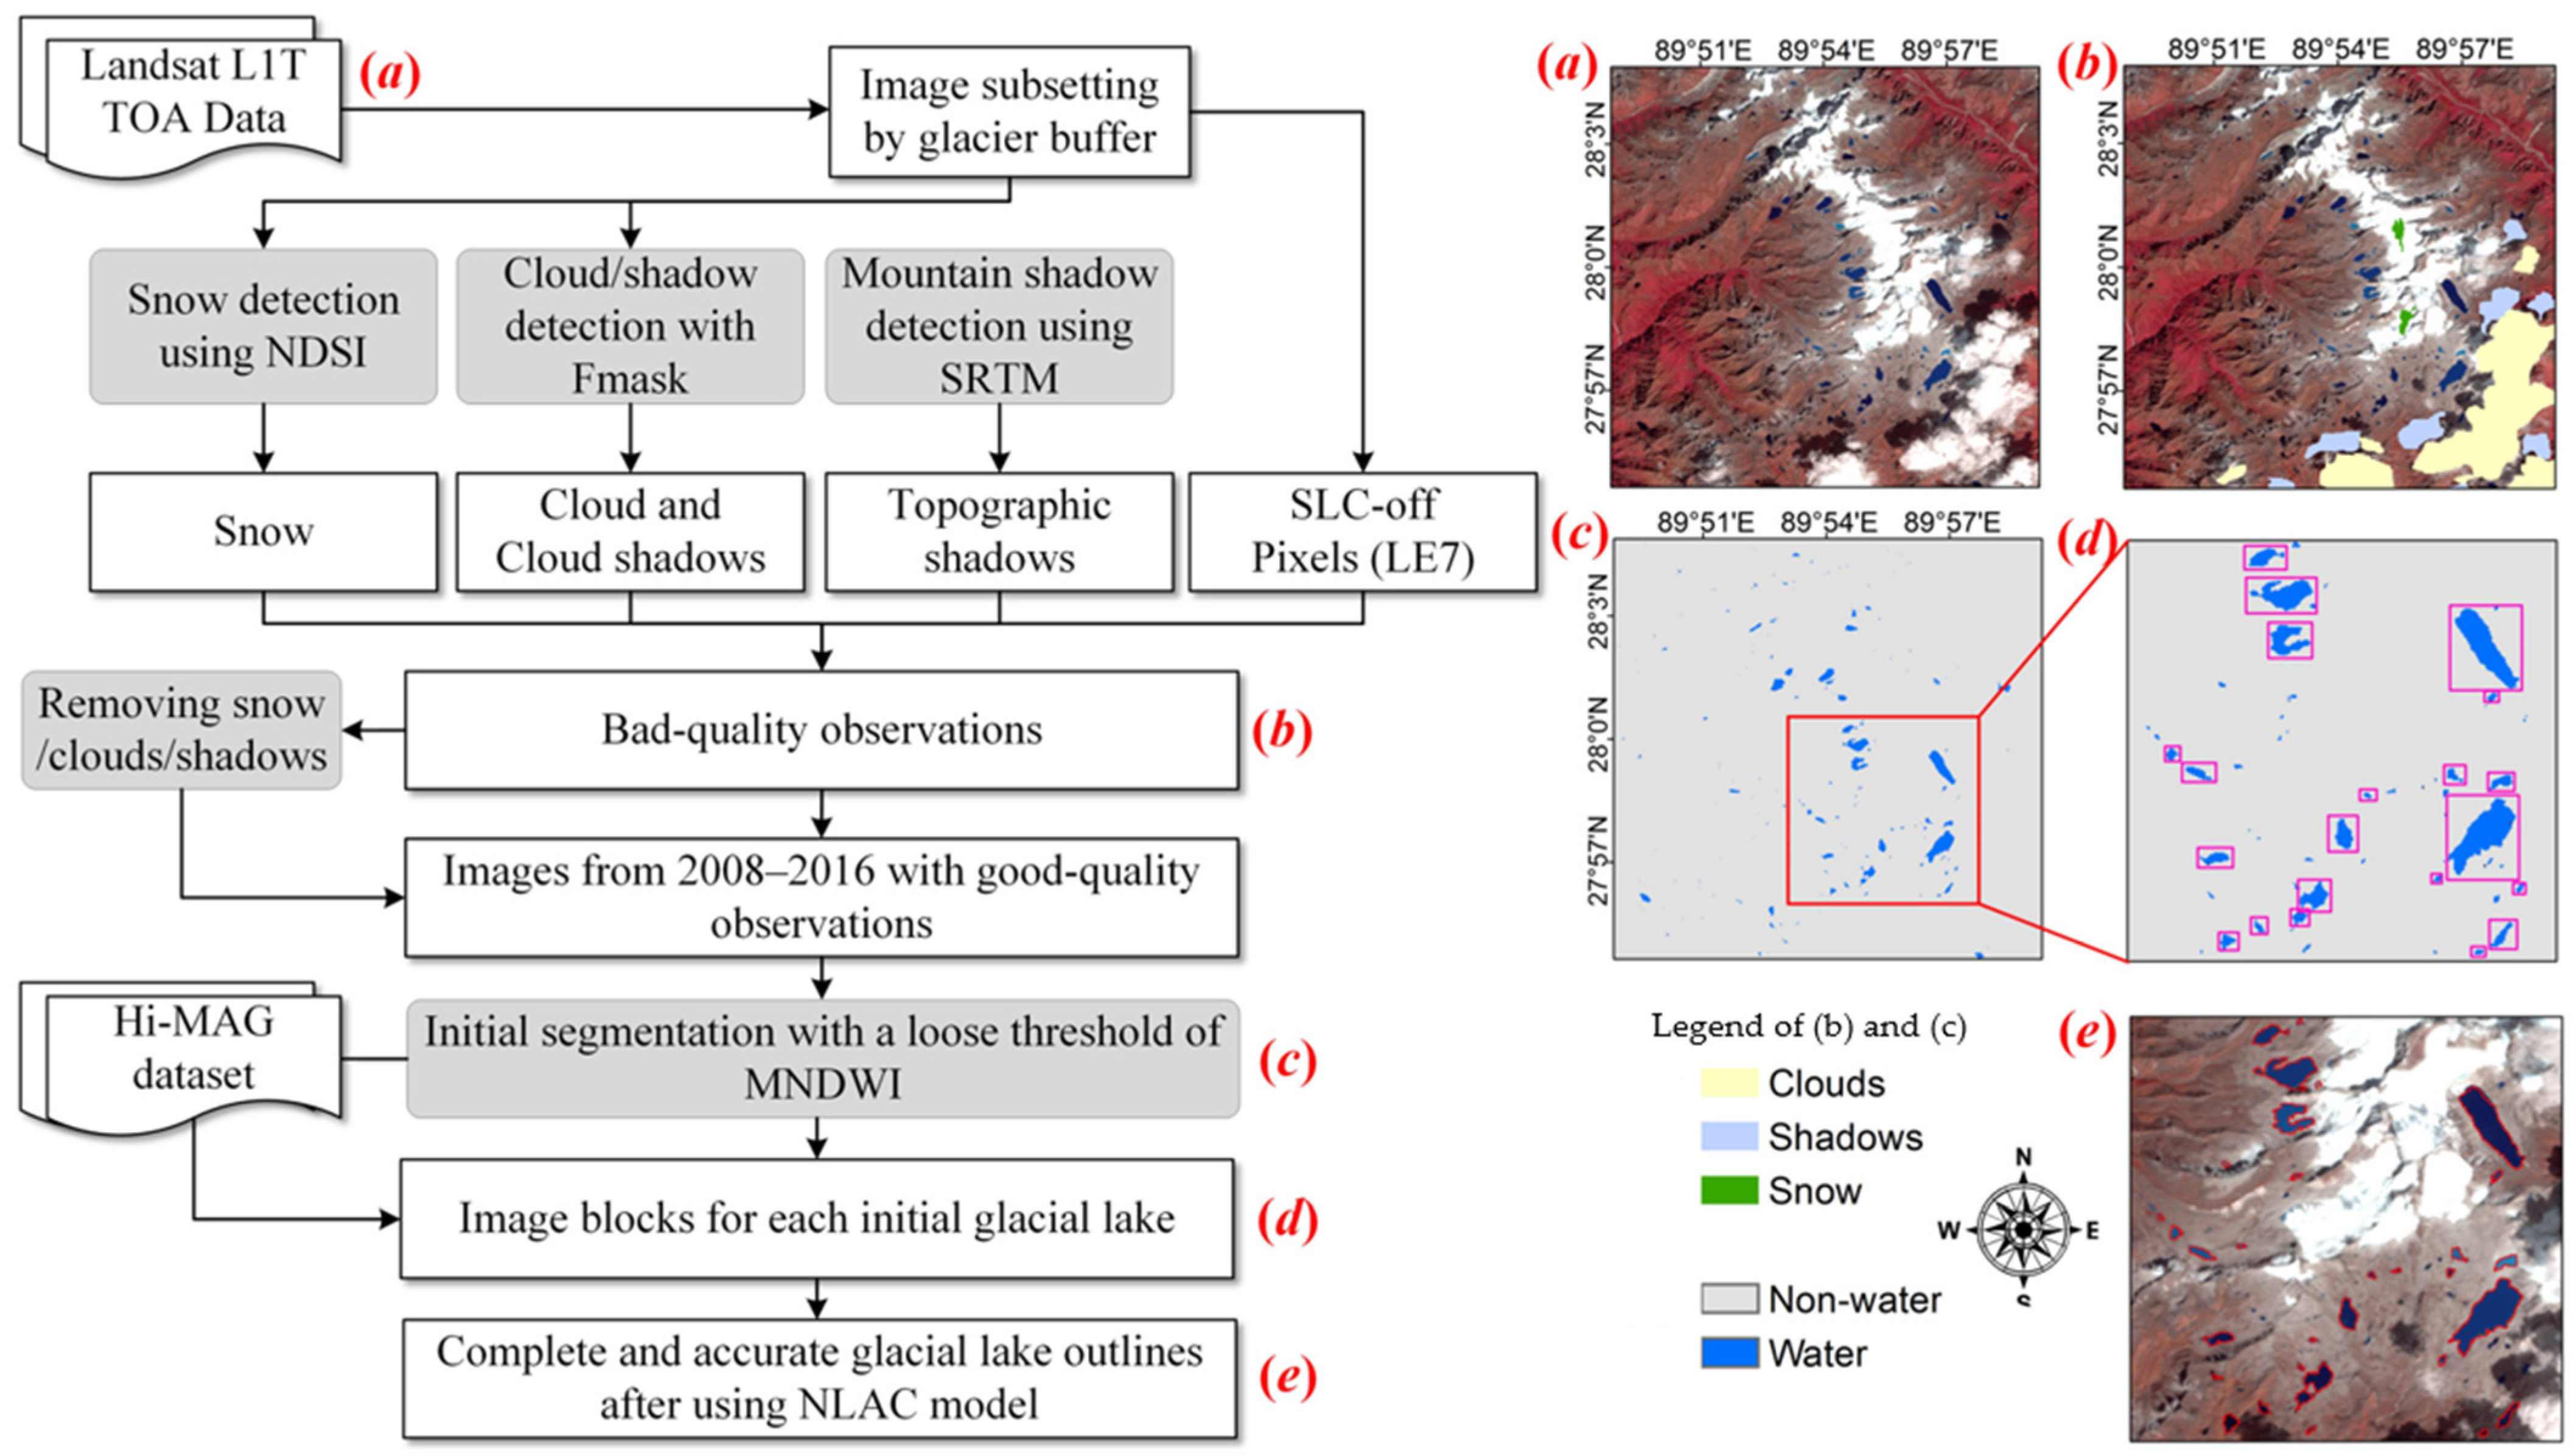
Figure 2 illustrates the main procedures involved in our automated lake mapping method. First, the original Landsat TOA images were all clipped by the extent of the glacier 10 km buffer and combined into a time-series dataset with consistent time interval. After that, bad observations including cloud/cloud shadows, mountain shadows, snow cover, and scan line corrector off (SLC-off) gaps were identified in different ways. We used Fmask (Function of mask) routine to extract the area covered by clouds (including the thin cirrus clouds) and cloud shadows, which identified the cloud pixels according to its physical properties and generated a shadow layer based on the darkening effects of the cloud shadows in the near infrared (NIR) band [55]. Topographic shadows were located in the back slope of mountains where the sunlight was greatly obscured. The shaded areas had large surface gradients, but small terrain reliefs. Therefore, topographic shadows can be detected using the slope (>10°) and shaded relief maps (<0.25) derived from SRTM data [56]. For some images acquired near winter, normalized difference snow index (NDSI) was used to delineate and map permanent snow cover even under topographic shadows. The SLC failure caused about 22% of each image to be lost and gives images a slatted appearance at the edges. As glacial lakes covered by SLC-off gaps in Landsat 7 ETM+ images will be misclassified, further manual editing using high-quality images from adjacent periods were necessary for the lake mapping. All of these preprocessing procedures were performed on the GEE, making use of millions of servers across the world. Then, a mask of potential glacial lake areas was generated by a global-level threshold segmentation of the MNDWI. A loose initial MNDWI threshold was set at 0.1 to minimize the omission of lakes during the global filtering. For the potential lake that was segmented using this global threshold, an image block that almost completely covered the water body was built to refine the local shoreline using the NLAC approach. Moreover, image block for each glacial lake obtained from the HMA glacial-lake inventory (Hi-MAG) database was used as auxiliary data to optimize glacial lake boundaries. It is important to note that this procedure can replenish a large number of previously unrecognized small glacial lake areas and can improve the details of the lake edge. Based on the initial contours from global thresholding results and Hi-MAG dataset, this local-level segmentation was conducted iteratively until the water extent stabilized. As a result, the final lake boundaries were delineated using the NLAC model, which is adaptive to local variations in lake spectra induced by water turbidity, depth and image acquisition date.
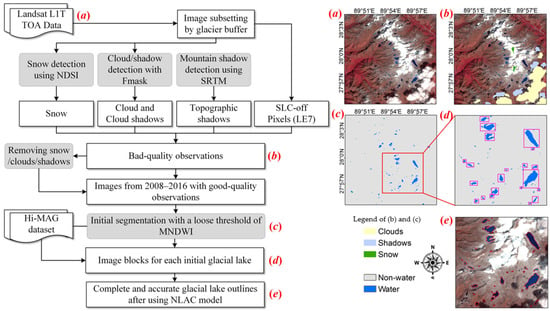
Figure 2.
Automated lake mapping procedure (left) including image subsetting, snow, cloud, shadow, and SLC-off pixel detection, global threshold segmentation, generation of an image block for each glacial lake obtained from Hi-MAG dataset and initial segmentation results, and local glacial lake mapping. Lake mapping procedures taking one area in the central Himalayas as an example (right): (a) false color composite (R/G/B = Band 5/4/3) of original TOA data; (b) bad observation identification including clouds, shadows, and snow; (c) potential glacial lake extent found by applying an MNDWI threshold (≥0.1); (d) image block for each glacial lake; and (e) the final glacial lake shorelines determined using the NLAC model. The image used in this case was acquired by the Landsat-8 OLI on 28 October 2014. The sequence numbers (a–e) in the left-hand diagram correspond with those in the right-hand parts.
Following the automatic mapping of glacial lakes, an interactive quality control was required to correct the residual errors in the mapping results. Mountain shadows and partial streams that were incorrectly classified as glacial lakes were deleted manually by superimposing the extracted glacial lake boundaries onto the original Landsat images and other high-resolution Google Earth images. Meanwhile, some missing glacial lakes were also added using ArcGIS during the visual inspection. Finally, cross-checking of glacial lake data by different experts using multi-temporal Landsat images was necessary for the final output dataset.
3.2.2. Estimating Lake Area Uncertainties
Uncertainty in the glacial lake area can be attributed to multiple factors including various data sources, spatial resolution of the image data, and the methodologies adopted for the lake mapping. Lake areas were all derived from the Landsat series satellite images, which were the most widely used and effective Earth resource satellite data in the world. In this Landsat Data Continuity Mission, image quality has been improved continuously, with higher radiation resolution, geometric accuracy, and signal-to-noise ratio. In this study, the multi-temporal glacial lake outlines extracted from Landsat images were transformed into the Asia North Albers Equal Area Conic Projection and were referenced to the World Geodetic System (WGS) 1984 coordinate system, almost no offset exists between them. In addition, all the Landsat TM/ETM+/OLI images used had a spatial resolution of 30 m. The uncertainty of glacial lake area from the same resolution images has been estimated as an error of ±1 pixel on the inside and outside of the extracted lake outline [20,57]. As for the impact from the method, we used a consistent automated method for the classification of glacial lakes in the different years, which was combined with the final visual correction to differentiate between glacial lakes and other water look-alike features, so could minimize the differences in the product quality caused by the mapping methods. The remaining mapping errors were also re-edited according to the high-resolution images during the interactive processing stage.
3.2.3. Measuring Lake Shoreline Changes
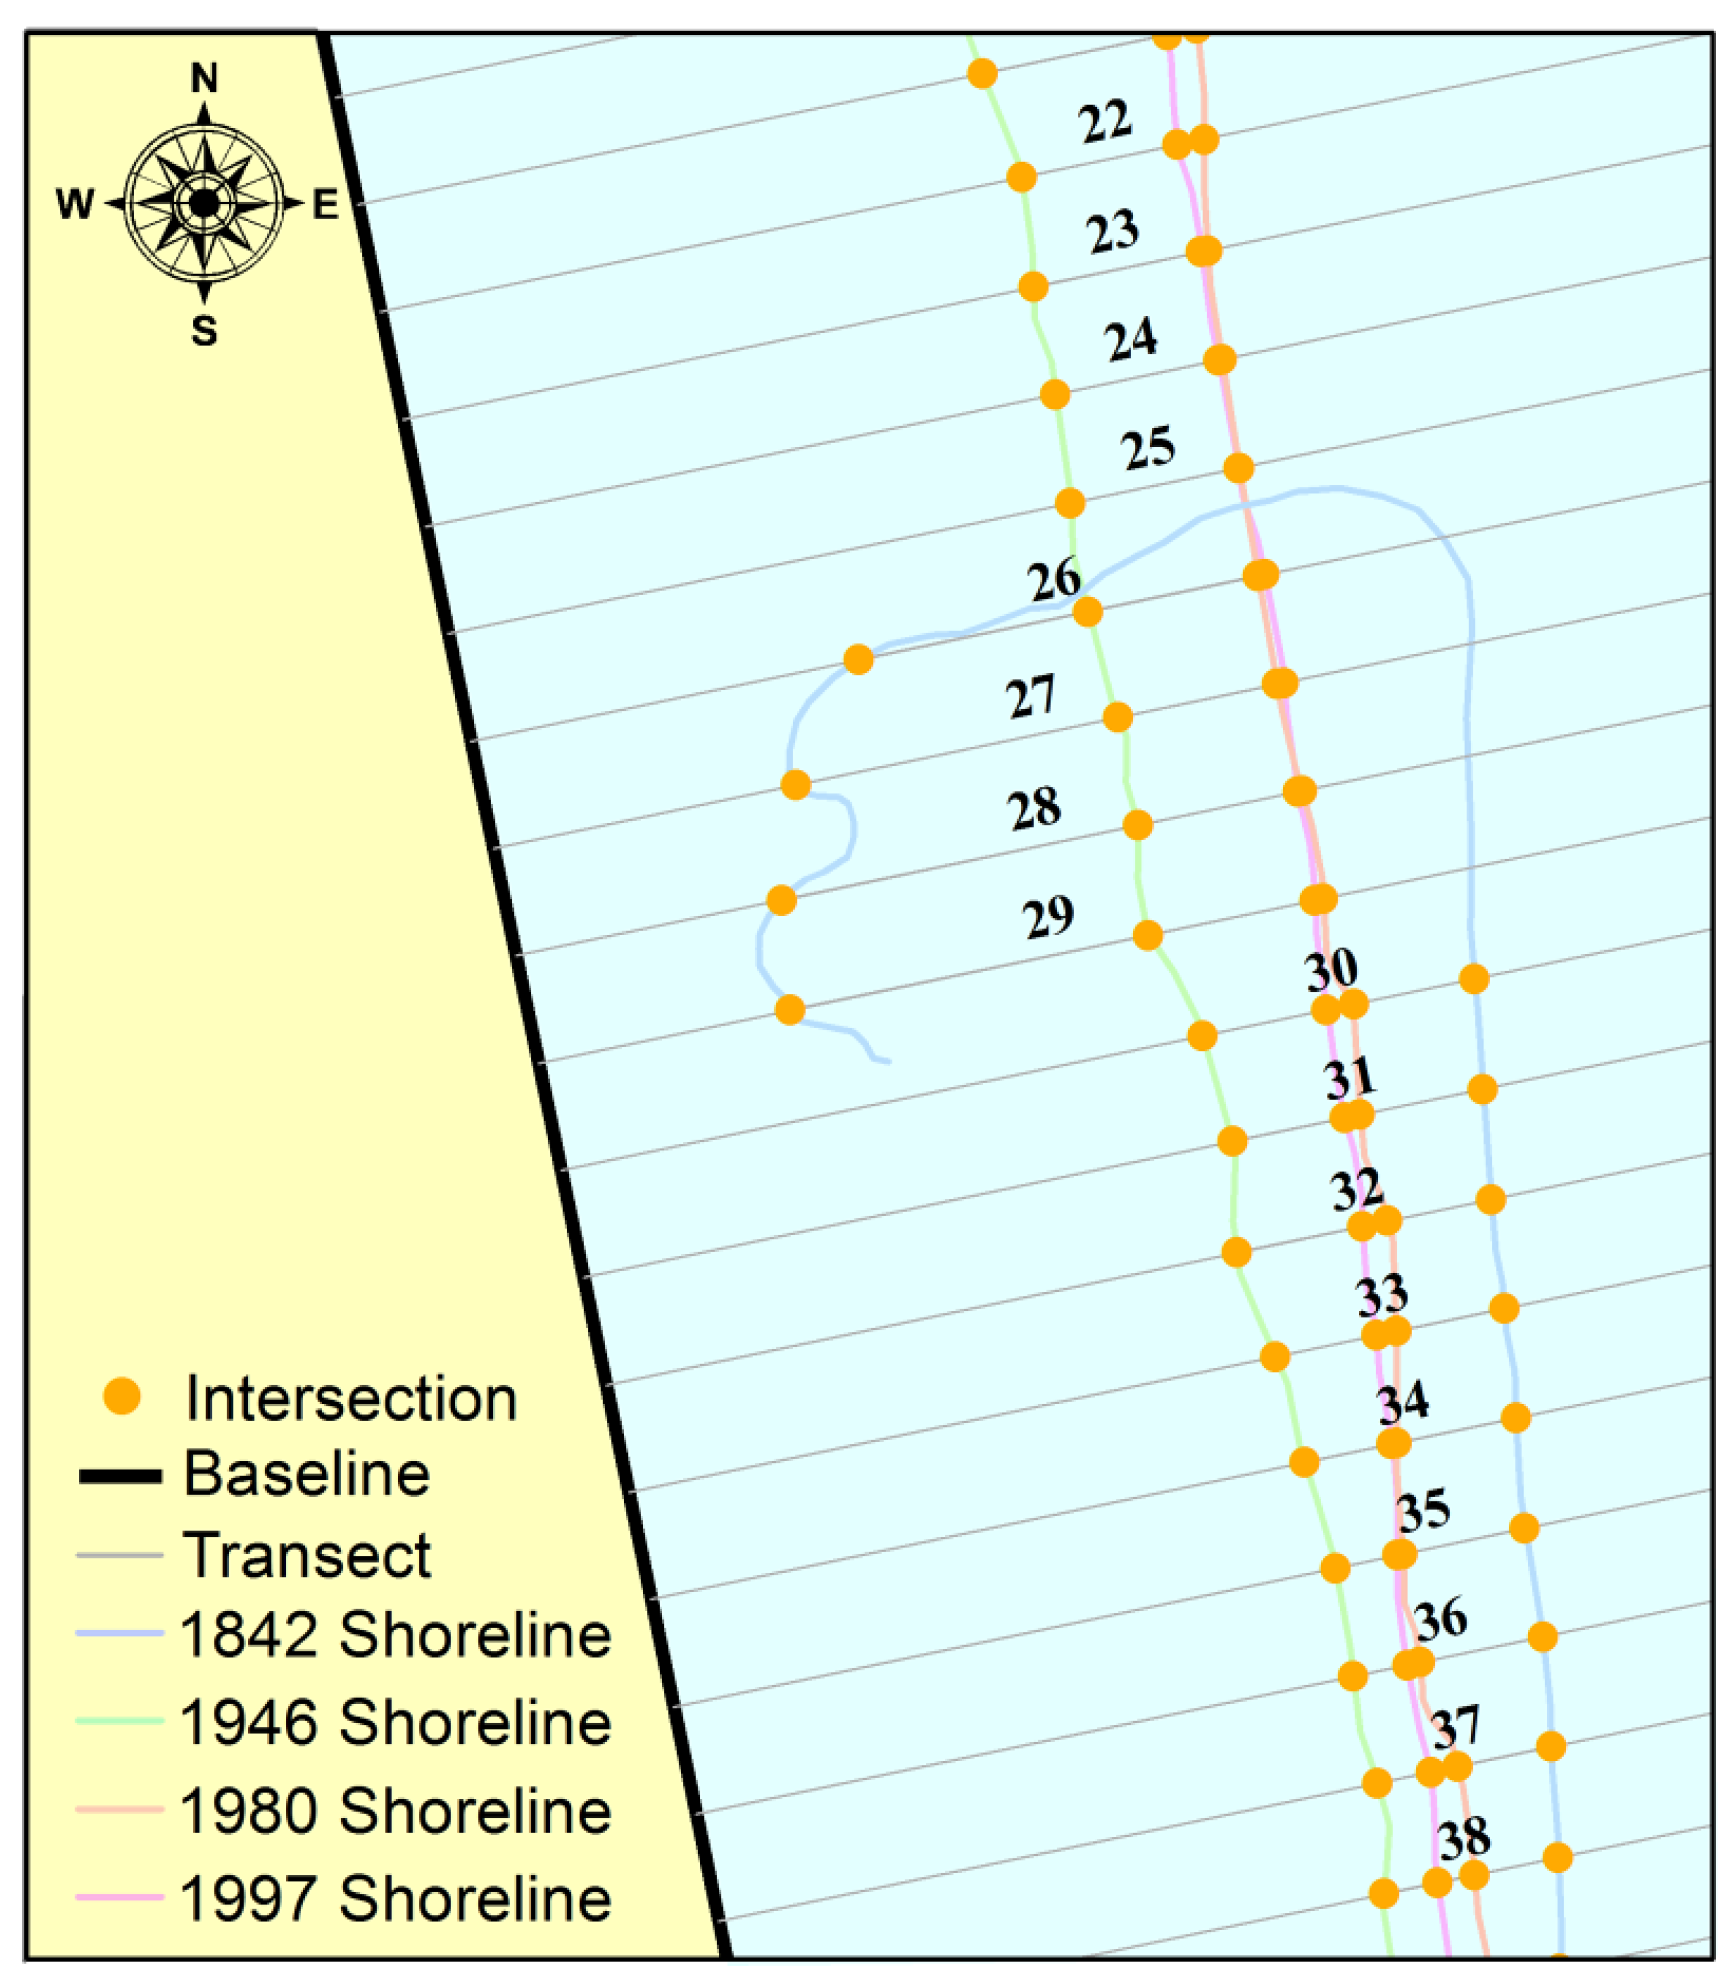
Although the widespread expansion of glacial lakes in the glaciated zone is a well-known phenomenon, there are very few data on their expansion rates of the lake boundary. The Digital Shoreline Analysis System (DSAS) was designed to facilitate the calculation of shoreline changes and to provide shoreline rate-of-change statistics based on multiple historic shoreline positions [58]. This tool was originally used for change detection for coastlines and is also useful for computing rates of change for any boundary that incorporates features at discrete times such as glacier limits, river banks, or lake boundaries. Figure 3 shows a schematic diagram of the DSAS used for the analysis of coastline movement. For this study, we used a 30-m buffer around the most recent lake perimeter as the baseline and cast transect lines orthogonal to the shorelines at 30 m intervals along the lake baseline. The intersection position between the transect and each shoreline was recorded, and the least median of squares (LMS) method was used to compute rates of shoreline change between three or more vector files (i.e., glacial lake shorelines from different times) based on the elapsed time and the linear distance. These results were summarized as change rates at different points on the shoreline in meters per year and were used to help to assess the preferential expansion along the major axis of each lake.
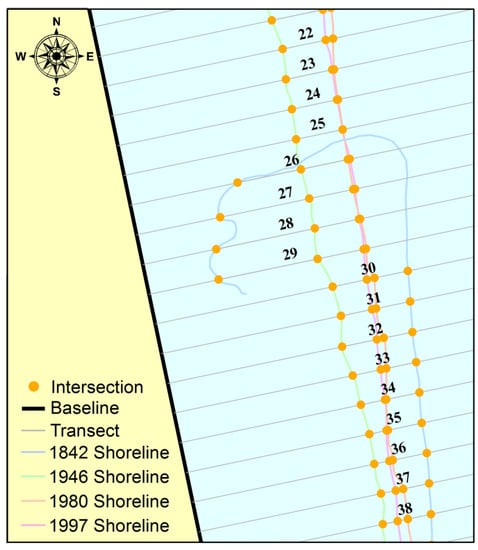
Figure 3.
Schematic diagram of the Digital Shoreline Analysis System (DSAS). The sample data of the shoreline are provided by the DSAS software application.
4. Results
4.1. Spatial Distribution and Temporal Development of Glacial Lakes from 2008 to 2016
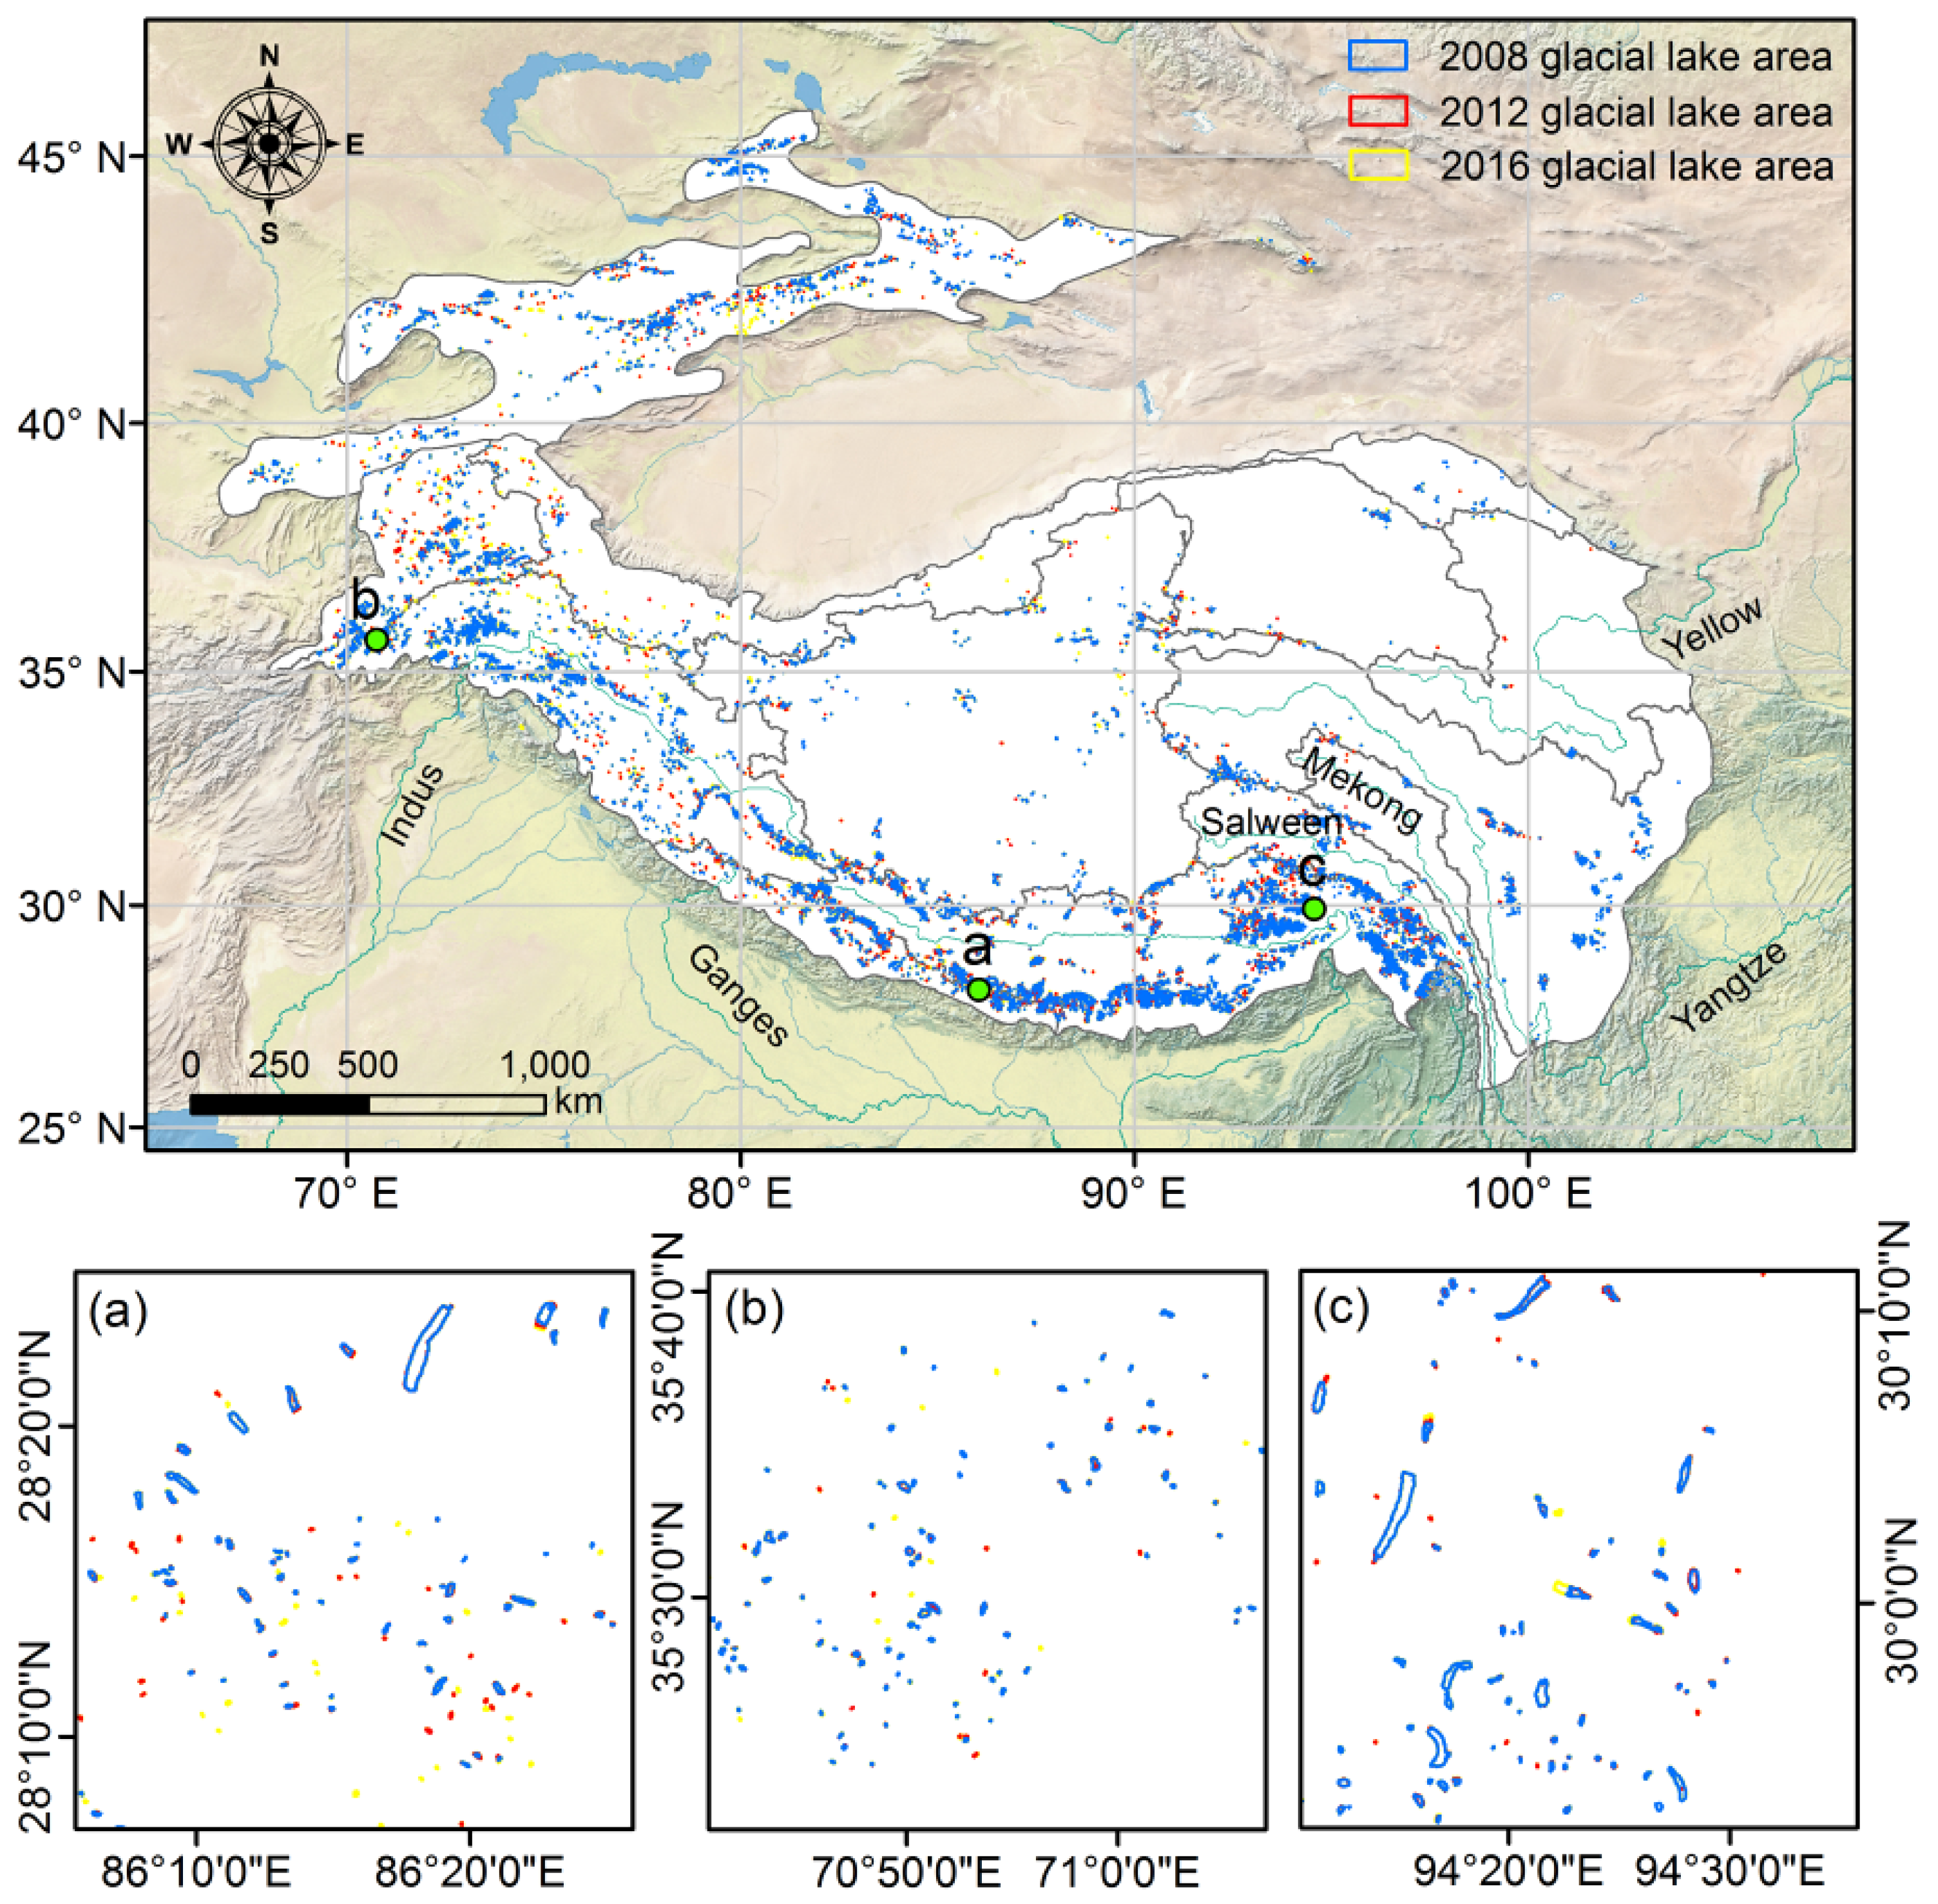
Using our lake mapping technique, a total of 17,016, 18,943, and 21,249 glacial lakes larger than 0.0081 km2 and with an overall area of 1420.15 ± 232.76 km2, 1455.48 ± 256.46 km2, and 1577.38 ± 288.82 km2 were identified in the HMA region for the years 2008, 2012, and 2016, respectively (Table 1). The lakes were more densely distributed in the central Himalaya and Pamir-Hindu Kush-Karakoram region and more sparsely distributed on the Inner Plateau (Figure 4). Most of the lakes were smaller than 0.1 km2 (15,456 glacial lakes) in 2016, but larger lakes (area > 0.1 km2) contributed 71.15% of the total area (Table 1).

Table 1.
Distribution of glacial lakes by number and area for 2008, 2012, and 2016 for five size classes. The values inside the brackets are the corresponding area (km2).
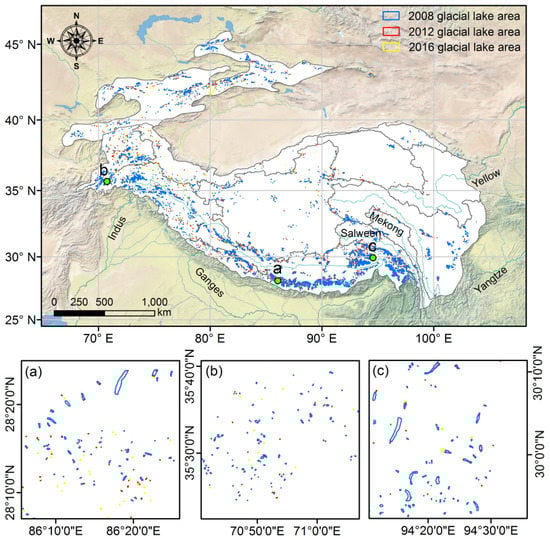
Figure 4.
Distribution of glacial lakes in the HMA in 2008, 2012, and 2016. This map was produced using an automated mapping method and Landsat images collected throughout the year. The three zoom-in maps (a–c) show local detail in different regions including the central Himalaya (a), Eastern Hindu Kush (b), and Nyainqentanglha (c).
In general, it was found that the glacial lakes grew considerably both in area and number from 2008 to 2016, but the expansion varied according to the lake size. During the study period, the total number of glacial lakes increased by 4233 and the total area expanded by 157.23 ± 25.77 km2 (11.07%, Table 1). In the inter-annual timescales, we observed that these glacial lakes substantially increased in area at a rate of 1.38% a−1 between 2008 and 2016. Comparing the situation of lakes of different sizes, we found that medium-sized (0.1–0.2 km2 and 0.2–1.0 km2) glacial lakes contributed most to the total expansion of HMA’s glacial lakes, with an increase in area of ~87.12 km2 (an expansion of 13.70% and a contribution of 55.41% to the total expansion) from 2008 to 2016 (Table 1). Small (≤0.1 km2) and large (1.0–3.0 km2) glacial lakes expanded by 39.44 ± 7.75 km2 and 23.30 ± 6.22 km2, at a rate of approximately 9.48% and 10.29%, respectively, between 2008 and 2016. Very large (≥3.0 km2) glacial lakes expanded a little, growing by 7.37 ± 2.03 km2 (5.18%). In the previous study, most glaciers in the HMA showed a strong and sustained retreating trend, with an average rate of −0.30% a−1 from 1970s to 2000s [1]. The decline was most pronounced in the Hengduan Shan in the southeastern Tibetan Plateau, where glacier area decreased at an average rate of −0.57% a−1. The melting and retreat of the source glaciers is the main reason for the lake area expansion. Other factors such as glacier morphology, calving, subaqueous melting, and ice face ablation all contribute to the development of the glacial lakes [12,59].
We also examined the distribution of lake size and number according to altitude (derived from the SRTM3 DEM), and the distribution patterns for the two measures were found to be similar (Figure 5a). The altitudes of all glacial lakes mapped in 2008 and 2016 ranged from 1700 m to 6400 m, with more than 58.85% of the lakes being concentrated in the altitudinal range 4400–5600 m. The observed changes in glacial lakes also varied according to elevation. During the period from 2008 to 2016, the greatest expansion in glacial lake areas was in the belt between 5200 m and 5600 m (~28.62% of the total expansion), and the increased lake area at higher altitudes tended to be larger due to the intense melting of glaciers upward. The expansion of the glacial lakes was also obvious between 4400 m and 5200 m (Figure 5b), which was closely related to the wider valleys and gentler terrain suitable for a lake development environment [18].
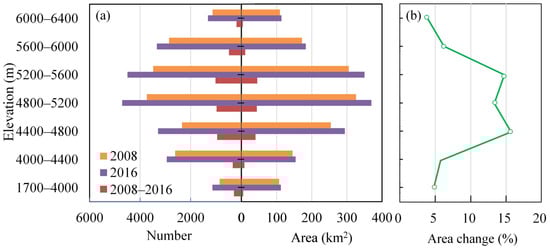
Figure 5.
(a) Frequency and areal distribution of glacial lakes by elevation class; and (b) expansion rate of glacial lake area within the different elevation range from 2008 to 2016.
4.2. Different Evolution Patterns for Glacial Lakes
There are three types of glacial lake in the HMA region. (1) Proglacial lakes, the lakes that are directly fed by ice meltwater near the end of the glacier tongue, and are usually connected to the glacier terminus and dammed by loose moraines. (2) Supraglacial lakes, which are commonly distributed on some large glaciers and can be formed in two ways. One is that the subglacial channel continues to erode the glacier and creates huge caves or tunnels. Then, the top of the caves collapses, forming a deep and large long lake. Another way is the accumulation of water caused by the strong melting and erosion in the depression area on the glacier. (iii) Unconnected glacial lakes, which are glacial lakes not connected to the parent glacier but which, to some extent, may be fed by some glaciers located in the basin.
It was found that the lake development processes that occurred in the study area were very different according to the type of lake. The proglacial lakes mostly showed continuous growth in the frontal area of retreating glaciers and were much larger in 2016 than in 2008, as shown in Figure 6a–c. This is because the increase in glacier meltwater, and the retreat and thinning of glacial tongues has provided more space for lake basins. However, on the other hand, since the water has a thermokarst effect on ice, the proglacial lakes also speed up the recession of the glacier tongues that they are in contact with [45,60]. Some of these lakes contain large quantities of meltwater and are susceptible to producing GLOFs.
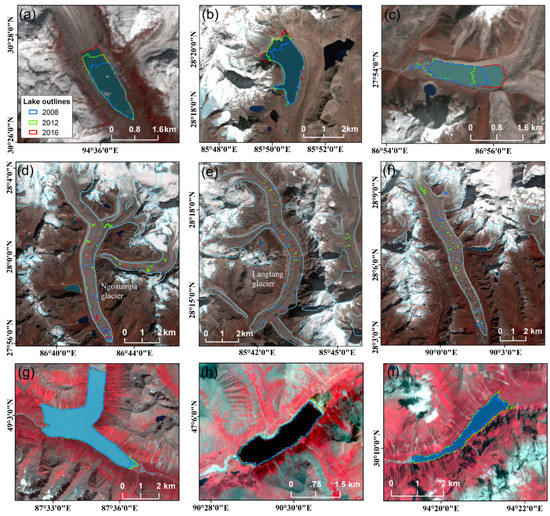
Figure 6.
Evolution of different types of glacial lakes: (a–c) proglacial lakes; (d–f) supraglacial lakes; and (g–i) unconnected glacial lakes. Background images were derived from USGS Landsat 8 satellite data for 2016.
In contrast to the proglacial lakes, the supraglacial lakes are ephemeral and highly dynamic [30,59]. Figure 6d–f show typical supraglacial lakes that developed on three debris-covered glaciers. The rough surface topography of glaciers provide the conditions for the formation of supraglacial lakes, and their low gradients encourage the retention of meltwater. Seasonal differences in ice or snow melting predominantly contribute to the rapid variation in the area of supraglacial lakes, which reach their maximum in summer, but may shrink or even disappear in winter. Sometimes, these lakes can also expand through coalescence of adjacent small lakes.
For unconnected glacial lakes in the HMA region, relatively stable lake sizes can be observed for 2008–2016 (Figure 6g–i). Unconnected glacial lakes are usually located in areas where glaciers have experienced serious material loss and recession, and mainly consist of glacial erosion lakes and trough valley lakes that formed in overdeepenings left by vanishing Quaternary glaciers. As there are insufficient nearby glaciers to supply them, once the unconnected glacial lakes have formed, they are primarily filled by seasonal snow meltwater and precipitation rather than glacier meltwater. In summary, the difference between these three glacial lake types is that both proglacial lakes and supraglacial lakes have exhibited significant changes and are sensitive to climate change, while the size of the unconnected glacial lakes has remained basically stable. In addition, along with the lake level rises, proglacial lakes with surface drainage are prone to outburst if water overflows from the terminal moraine outlet.
Continuous expansion of the glacial lake area will produce more potentially dangerous lakes in the HMA region. One of the most striking examples of a rapidly developing lake is located in the Sary Jaz-Kumarik River Basin of the central Tianshan. This typical ice-dammed lake, Lake Merzbacher, has suddenly started to breach nearly every year due to abundant glacier meltwater or ice periodically entering the lake [51,61]. From Figure 7, we can see that Lake Merzbacher probably developed in early summer 2015 on the tongue of a debris-covered glacier. The lake drained suddenly on 9 September 2015 and then again rapidly increased in area within a short period of time. With increasing lake size and therefore increasing water pressure on the dam, the risk of dam failure increases. In addition, since the peak discharge of a GLOF is directly correlated to the volume of lake water, the expansion of the lake will intensify the magnitude of potential outburst floods. The resulting GLOF events at Lake Merzbacher caused severe damage and hundreds of fatalities in the village downstream and, thus, comprehensive analysis of change rates along the glacial lake outline is necessary to thoroughly evaluate the possible location and probability of future outbursts [62,63].
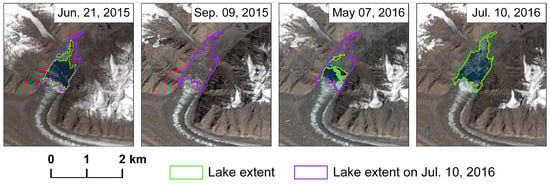
Figure 7.
Temporal development and sudden drainage of Lake Merzbacher (79.89°E, 42.23°N).
4.3. Shoreline Expansion and Erosion Rates
The expansion rate of glacial lakes is one of the most important indicators of potential outburst hazards [64]. However, few studies have quantified rates of shoreline erosion and expansion for individual glacial lakes. In the study area, the vector maps of glacial lakes for 2008, 2012, and 2016 were imported into the DSAS to measure changes in shoreline positions and calculate expansion rates. To clearly understand the characteristics of the evolution of rapidly expanding lakes, three examples in the study area were then selected (Figure 8).
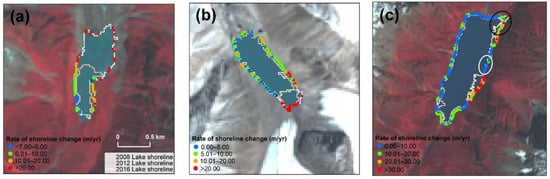
Figure 8.
Examples of shoreline erosion and expansion rates measured at 30 m intervals between 2008, 2012, and 2016 for lake (a) (94.2667°E, 30.1018°N); lake (b) (89.1916°E, 28.3325°N); and lake (c) (94.0917°E, 30.1251°N).
Spatial variations in the rates of change may be a function of surrounding shoreline irregularity and geology. For example, lake (a) had an irregular northeast shoreline consisting of unconsolidated moraine, where some of the highest rates of change occur, but there are erosion rates along the southern shoreline, which is related to the growth of upland tundra. However, lake (b) showed an overall expanding trend, with higher rates along its southeast shore where the lake is expanding into the terminal of the glacier tongue. Both of these lakes receive a large amount of glacier meltwater, and have outlets and outflow river channels that are clearly visible in the image. For lake (c), the expansion rates were seemingly more uniform along the west and north shorelines. Tiny changes such as the area marked with the white ellipse demonstrate that the lakeshore is stable and mainly composed of bedrock, while the area marked by the black ellipse has large edge changes and is probably the area of the breach. This also highlights the potentially unexpected nature of moraine instabilities in the region as a result of perennial water flows.
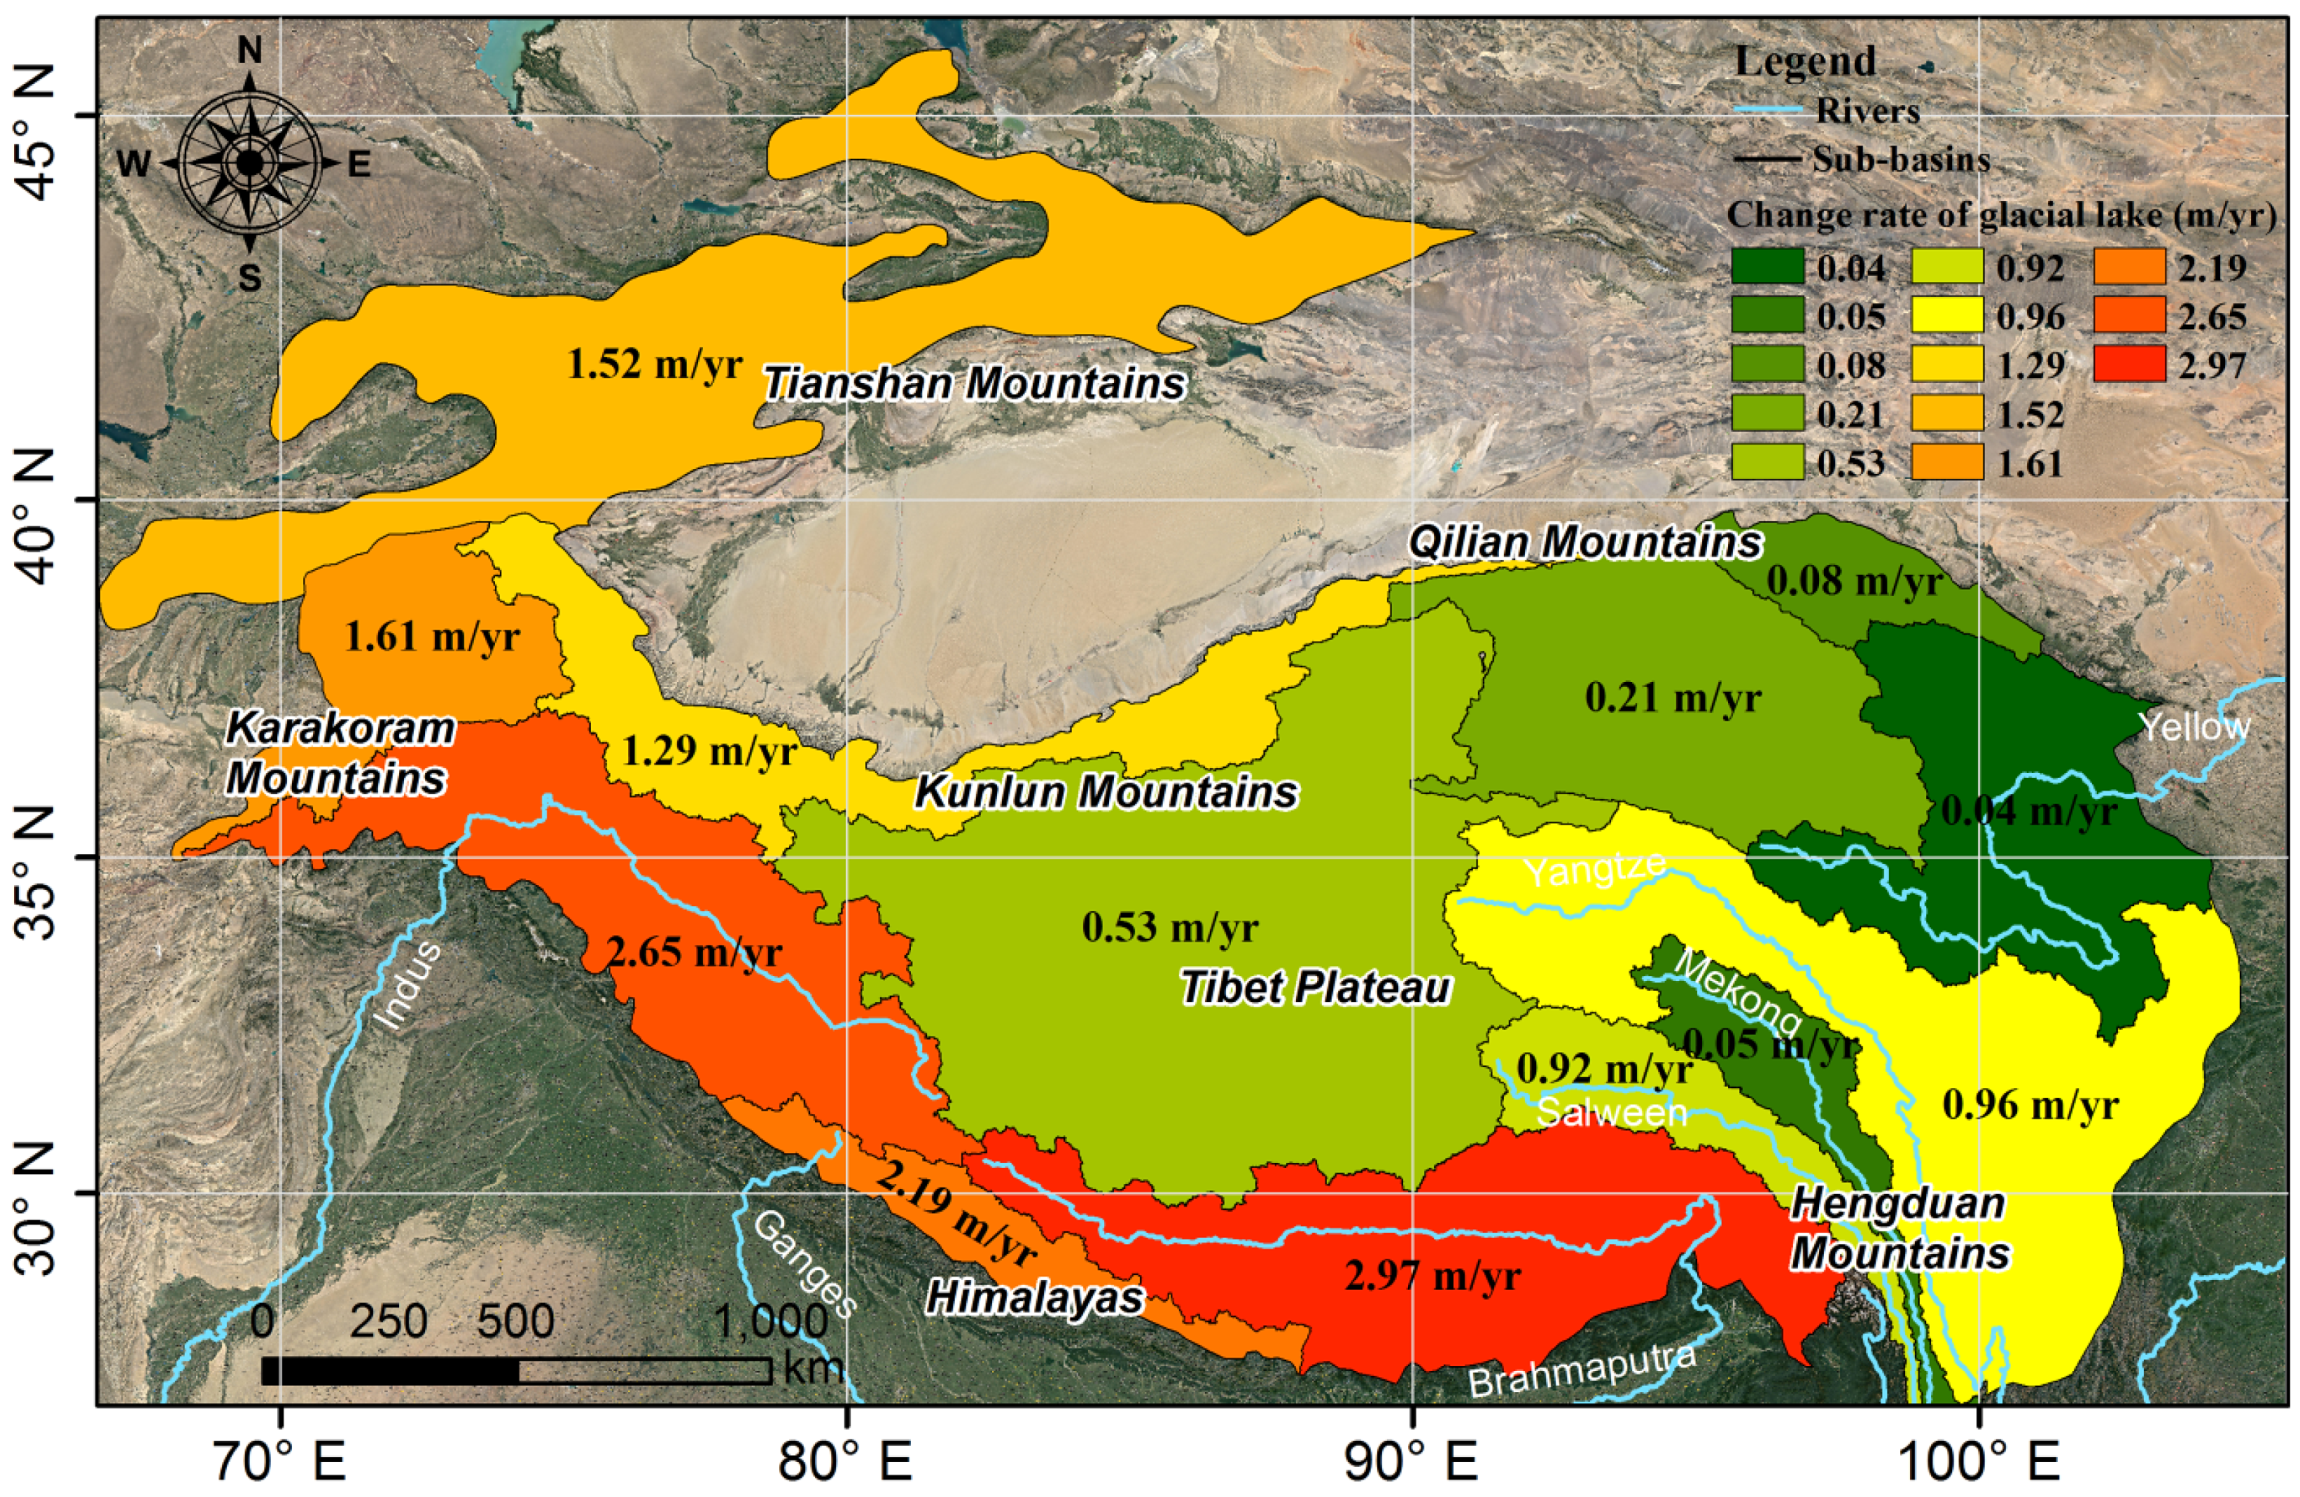
For the entire HMA region, over this 8-year period, the mean annual shoreline expansion rate for all lakes was 1.15 m/yr (Figure 9). These changes in shoreline position resulted in a 157.23 ± 25.77 km2, or 11.07%, increase in lake area across the 13 lake basins in the region (Table 1). Due to errors associated with image co-registration, lake perimeter delineation, and image pixel size, there was a small difference in expansion rates between the sub-basins, but this was within the degree of uncertainty in our measurements. The mean expansion rate for an individual lake ranged from a low of −7.57 m/yr to a high of 9.81 m/yr and the maximum expansion rate for an individual location was 64.37 m/yr. The rate of movement of the lake shorelines varied from region to region across the HMA: glacial lakes in the Himalaya showed the most rapid expansion with all the sub-basins having an expansion rate higher than 2 m/yr (i.e., 2.97 m/yr in the Brahmaputra, 2.65 m/yr in the Indus, and 2.19 m/yr in the Ganges Basin); this was followed by the Karakoram Mountains (1.61 m/yr) and the Tianshan Mountains (1.52 m/yr). The expansion rate of glacial lakes in the Yellow River Basin was the lowest (0.04 m/yr).
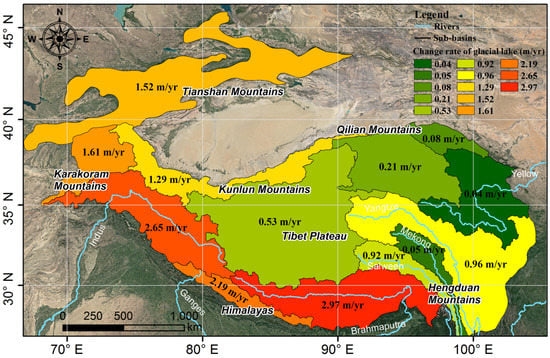
Figure 9.
Mean rate of expansion of glacial lakes from 2008 to 2016 across the HMA region.
4.4. Climate Data Analysis
Although accelerated temperature rises and precipitation changes have resulted in the retreat and thinning of many mountain glaciers, which has, in turn, produced abundant meltwater for glacial lake development, few studies have provided convincing evidence of an association between glacial lake evolution and spatial variability in temperature and precipitation, especially in large-scale regions like HMA where in situ measurements are difficult to obtain [59,65].
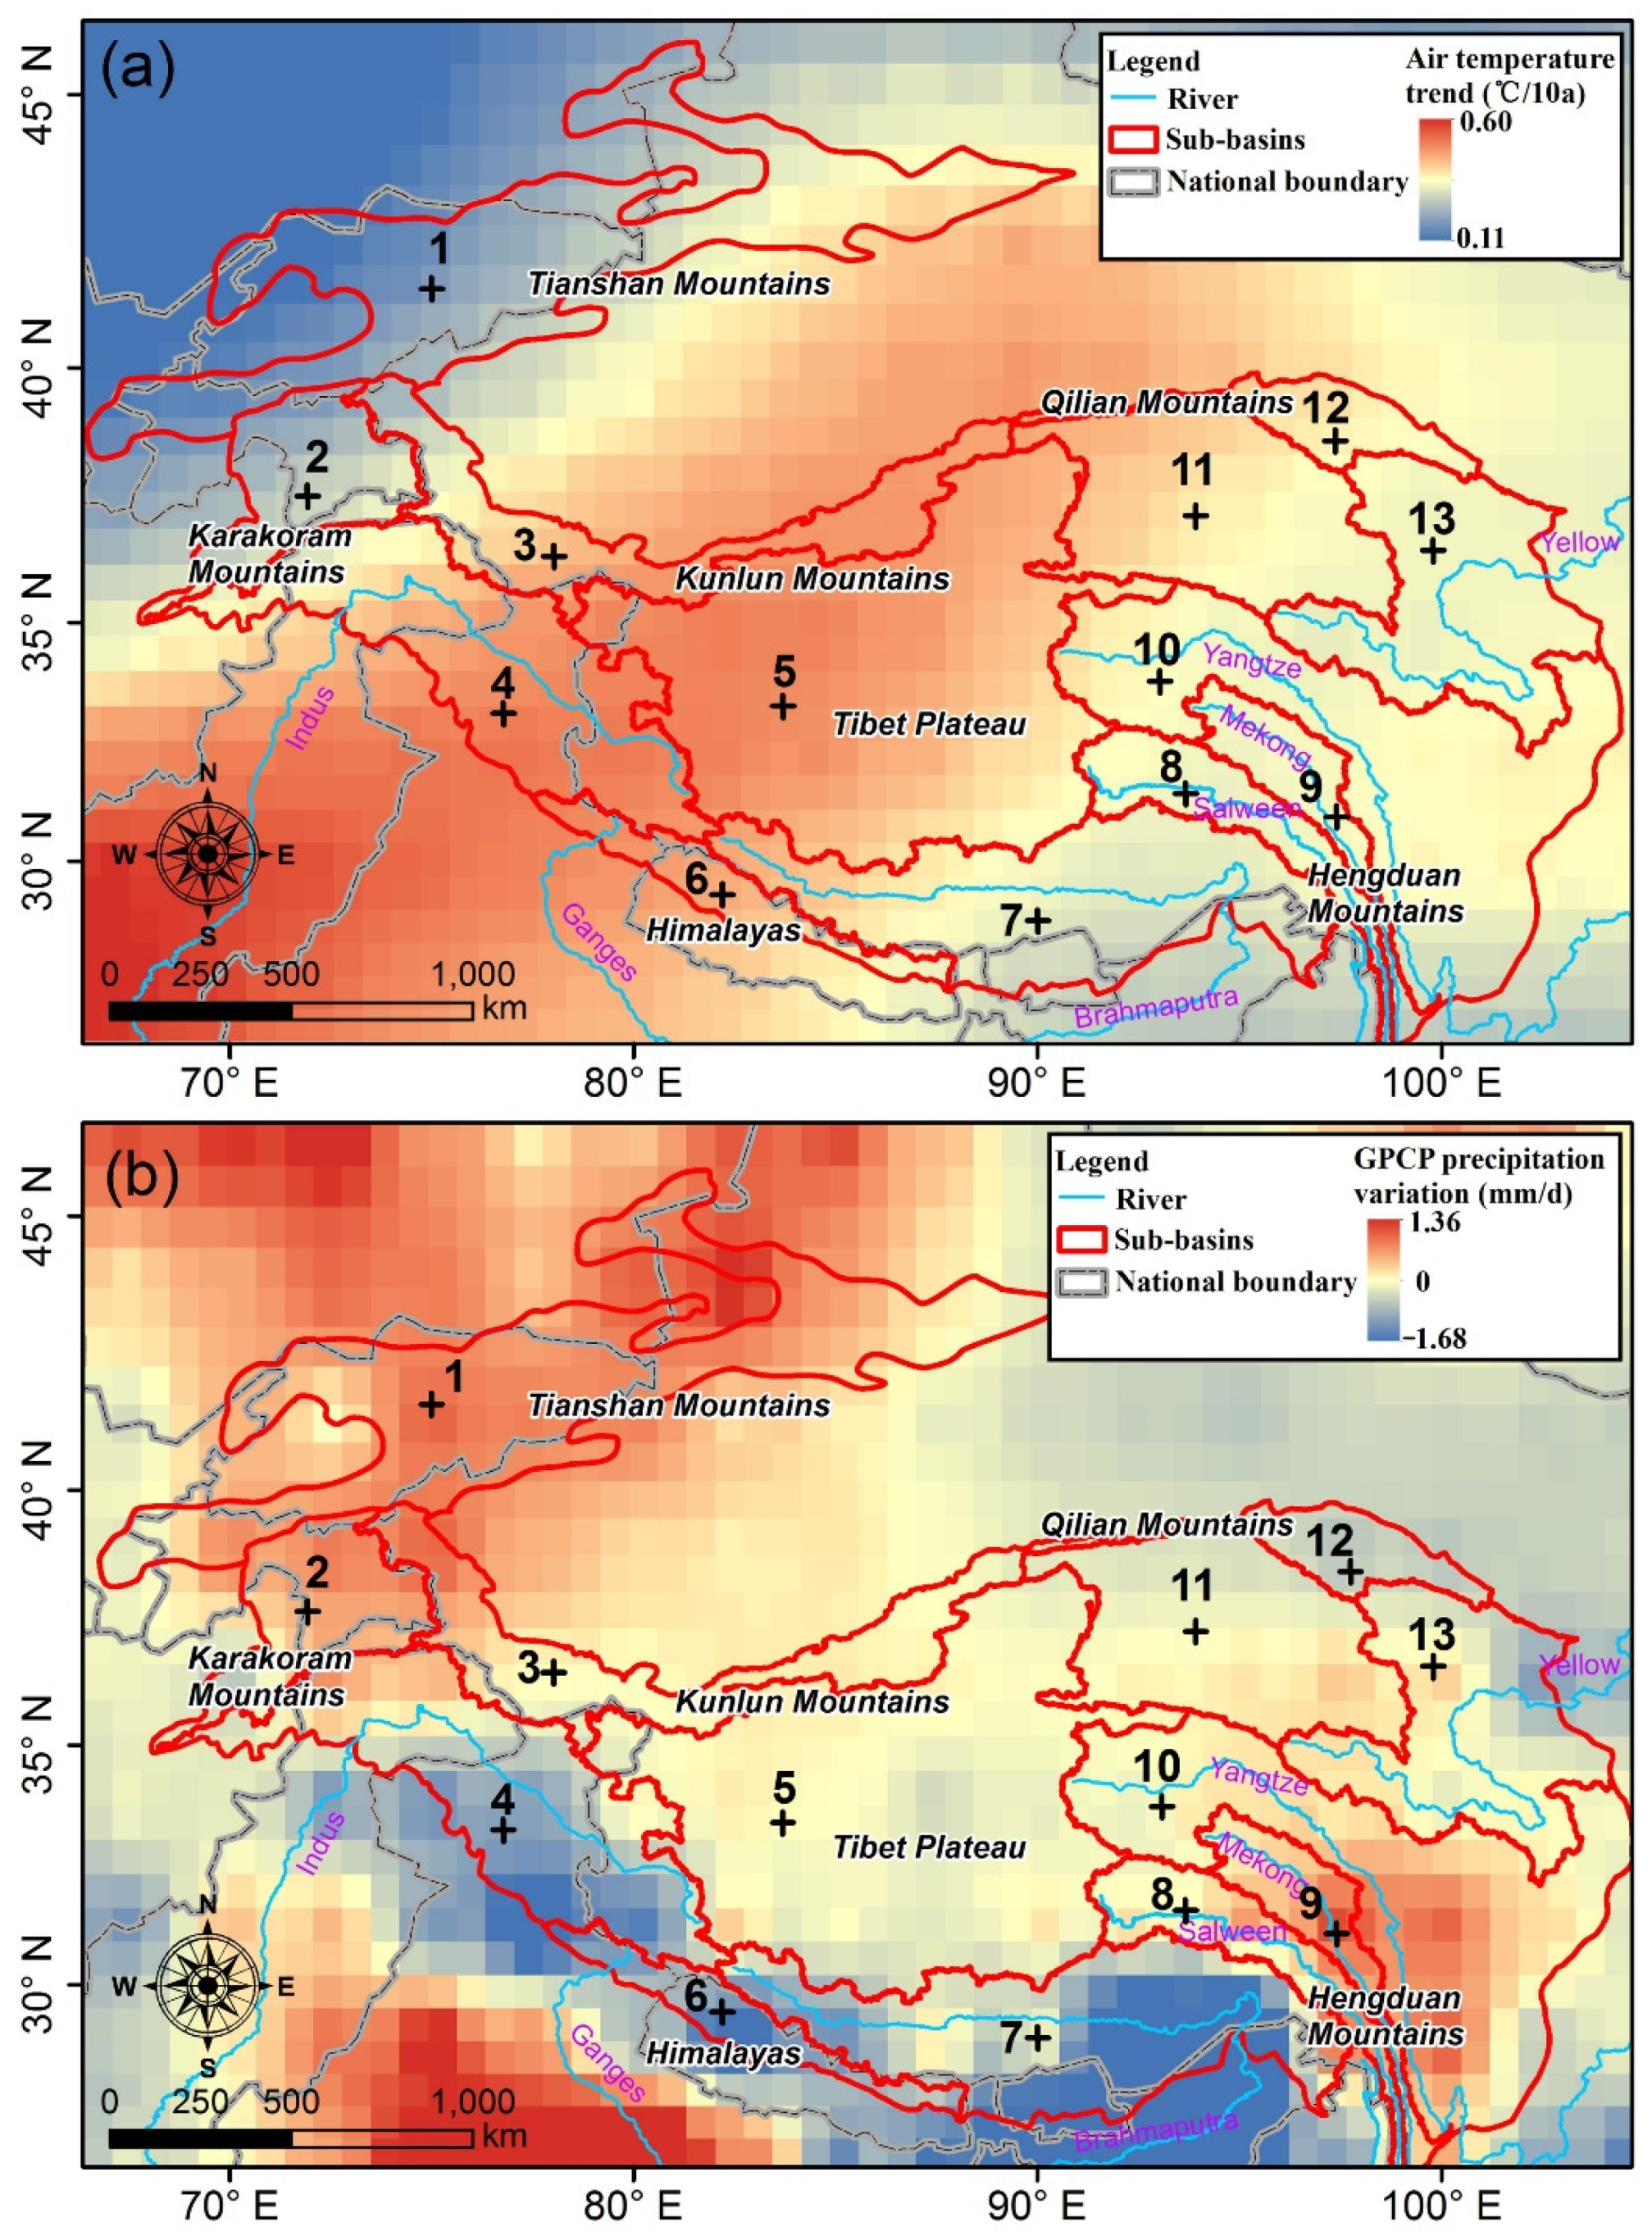
The variations in air temperature and precipitation, and their temporal trends during the period 1979 to 2016 were analyzed. Meteorological stations in the HMA are grouped according to 13 large sub-basins that have similar water-balance processes [66]. There has been a clear acceleration in warming accompanied by inconsistent changes in precipitation in these basins in the past thirty years (Figure 10). The mean rate of increase in the air temperature is 0.033 °C/a (Table 2). For most of the regions, the meteorological data for this period indicates that the climate is becoming warmer and more humid. A typical example is the southeastern Tibet Plateau (basin nos. 8 and 9). The climate of this region is dominated by two major atmospheric circulation systems. In the dry season from November to April, the southern branch of the westerlies brings only a little rainfall and cold climate conditions to the region, while in the wet season from May to October, the westerlies become weak and the Indian monsoon moves northward, producing warm and rainy conditions that account for 60–90% of the annual precipitation [1,18]. Due to the abundant precipitation and higher ice-layer temperature, this region has rather extensive monsoonal temperate glaciers. Recently, numerous studies have reported that these glaciers have been melting and thinning faster than continental glaciers in the inner Tibetan Plateau during the past several decades, and are more sensitive to climate change and variability. The ever-increasing glacier ablation is probably the primary cause for lake expansion in the HMA region.

Figure 10.
Spatial variation in (a) air temperature, as derived from NCEP Reanalysis data, and (b) precipitation, as derived from GPCP data, from 1979 to 2016 in the HMA region. Plus symbols indicate the different sub-basins listed in Table 2.
Table 2.
Variation of linear trends of temperature and precipitation calculated from meteorological stations in each sub-basin for 1979–2016.
However, from the large-scale pattern of precipitation derived from gridded GPCP data for the period 1979 to 2016 (Figure 10b), it can be seen that the precipitation differences in the Himalayas showed an overall decreasing trend. This may be linked to the weakening Indian monsoon. The glaciers in the Himalayas showed the greatest decrease in length and area, and also the most negative mass balance [1,46]. Because precipitation run-off and glacier meltwater are deemed to be the main inputs to the lakes and evaporation is the main way that water is lost, the glacier meltwater produced by the drier climate may be the dominant driver behind the expansion of glacial lakes in this area.
5. Discussion
5.1. Factors Controlling the Morphological Characteristics of Glacial Lakes
The orientation of the parent glaciers, topography, relief, ground ice content, wind direction, and the lake basin can effect glacial lake morphometry in the cryospheric environment. The glacial lake orientation is, and has been, mainly controlled by glacier activity effects. Glacial lakes develop in the valleys eroded by the glaciers, and thus the orientation of the lake is consistent with that of the glacier terminus. It is noted that lake elongation is favored in areas of rolling topography and low relief [67]. High ice contents (20% to 40%) can foster thermal erosion in lakes. In terms of wind direction, the preferential erosion of the lake shores agrees well with the current prevailing wind direction. For smaller lakes, wind has a stronger effect on their orientation [68,69]. In terms of lake basins, old lake basins exist in nearly all the regions studied and restrict future lake expansion. After the rapid drainage of lake water, the spatial development of second-generation glacial lakes in existing basins proceeds uniformly, as can be seen from the analysis of evolution patterns (Figure 7). As illustrated above, the combination of all of these elements may have had a strong impact on lake formation and morphology, with consequent impact on the water and energy balances in the area affected.
5.2. Potentially Dangerous Glacial Lakes and GLOF Risk Assessment
Glaciers and glacial lakes in the HMA show strong spatial and temporal heterogeneities because of the diverse climatic conditions and complex topography. Local factors such as the sedimentary geology, debris composition, and surrounding terrain may also lead to these differences. Through the analysis of the relationship between fluctuations in climate and the behavior of glacial lakes, the climate warming trend was concluded to be the primary driving factor. The gradual increase in air temperatures in high mountain regions is resulting in an increase in glacier meltwater and is accelerating the filling of glacial lakes with water. Under these conditions, the number and total area of the glacial lakes are changing rapidly and the majority of lakes will likely continue to grow until the lake dam fails, presenting a considerable GLOF risk within the next few decades. It has been suggested in many studies that changes in the area of an individual glacial lake are usually a good method of identifying potentially dangerous glacial lakes [7,61,70]. However, it is usually dynamic and complex for the assessment of GLOF risk, and should be adjusted according to the intensity and frequency of human activity in the particular region of interest. Using multi-temporal lake inventory for the HMA region, we determined the spatial variation in shoreline position for each lake. This will aid in a better understanding of the processes driving lake basin expansion as well as the prediction of shifts in lake morphometry or lake outburst events.
5.3. Planned Future Work
With the continuous development of remote sensing technology, other higher resolution multi-spectral sources could also be used to extend the temporal sampling and further improve the lake mapping details. The European Space Agency’s Sentinel-2A/2B satellites launched in 2015/2017 obtained optical imagery at 10 m resolution [71,72,73]. They are freely accessible, and the spatial and temporal information reported in the Sentinel-2 dataset will complement that acquired in the past, and will benefit future researches for long-term accurate monitoring of changes in HMA’s glacial lakes. Based on the results obtained in this study, the glacial lake inventory will be continuously updated to an earlier or newer period for high-frequency monitoring. It is also necessary for us to conduct some more in-depth analyses for studies of the complex interactions between glaciers, climate, and glacial lakes, and potentially dangerous glacial lakes should be considered for further detailed risk assessments that include geological and hydrological data.
6. Conclusions
This study provides an updated and complete outline of glacial lakes using an automated lake mapping method. By analyzing glacial lake inventories from different years, we quantified the variability of lake extents in the HMA from 2008 to 2016, and for the first time, patterns of spatial variation in the shoreline were also determined for each lake to help better understand the complex changing characteristics.
The total glacial lake area has exhibited a persistent and accelerated expansion since 2008, with medium-sized lakes contributing most (55.41%) to the overall area expansion. Although there are a large number of small glacial lakes (~15,000) in the HMA region, their total area does not appears to be large. On the vertical gradient, the expansion of the glacial lake area is moving toward higher altitudes, with the significant expansion in the range between 5200 m and 5600 m. Regional differences in the rates of shoreline movement were also found. Himalayan glacial lakes showed the highest expansion rates (>2 m/yr) and these were far higher than those in the Yellow River Basin (0.04 m/yr), which were the lowest overall.
We then linked our results to the climate change in order to investigate their influences on the status of glacial lakes. Regional heterogeneities in climate change will inevitably cause differences in the changes of glacial lakes across the study area. These changes arise from different local patterns of temperature and precipitation variability. Temperature fluctuations are believed to be a major factor influencing glacial lake variations and GLOF events. Under the present warming conditions, glacier shrinkage might further accelerate glacial lake expansion in the HMA.
Author Contributions
Conceptualization, M.Z.; Methodology, M.Z. and F.C.; Validation, H.Z., J.W. and N.W.; Formal analysis, M.Z. and J.W.; Writing, M.Z. and F.C.; Funding acquisition, F.C. All authors have read and agreed to the published version of the manuscript.
Funding
This work was supported by the International Partnership Program of the Chinese Academy of Sciences (131551KYSB20160002/131211KYSB20170046) and the National Natural Science Foundation of China (41871345).
Institutional Review Board Statement
Not applicable.
Informed Consent Statement
Not applicable.
Data Availability Statement
The data presented in this study are available on request from the corresponding author.
Acknowledgments
The authors would like to thank the China Center for Resources Satellite Data and Application for providing the meteorological data.
Conflicts of Interest
The authors declare no conflict of interest.
References
- Yao, T.; Thompson, L.; Yang, W.; Yu, W.; Yang, G.; Guo, X.; Yang, X.; Duan, K.; Zhao, H.; Xu, B. Different glacier status with atmospheric circulations in Tibetan plateau and surroundings. Nat. Clim. Chang. 2012, 2, 663–667. [Google Scholar] [CrossRef]
- Pfeffer, W.T.; Arendt, A.A.; Bliss, A.; Bolch, T.; Cogley, J.G.; Gardner, A.S.; Hagen, J.O.; Hock, R.; Kaser, G.; Kienholz, C. The Randolph glacier inventory: A globally complete inventory of glaciers. J. Glaciol. 2014, 60, 537–552. [Google Scholar] [CrossRef] [Green Version]
- Yao, T.; Wang, Y.; Liu, S.; Pu, J.; Shen, Y.; Lu, A. Recent glacial retreat in high asia in china and its impact on water resource in northwest china. Sci. Sin. Terrae 2004, 47, 1065–1075. [Google Scholar] [CrossRef]
- He, Y.; Theakstone, W.H.; Tandong, Y.; Tuo, C.; Zhang, D.D. The irregular pattern of isotopic and ionic signals in the typical monsoon temperate-glacier area, Yulong Mountain, China. Ann. Glaciol. 2002, 35, 167–174. [Google Scholar]
- Gardner, A.S.; Moholdt, G.; Cogley, J.G.; Wouters, B.; Arendt, A.A.; Wahr, J.; Berthier, E.; Hock, R.; Pfeffer, W.T.; Kaser, G. A reconciled estimate of glacier contributions to sea level rise: 2003 to 2009. Science 2013, 340, 852–857. [Google Scholar] [CrossRef] [Green Version]
- Kääb, A.; Berthier, E.; Nuth, C.; Gardelle, J.; Arnaud, Y. Contrasting patterns of early twenty-first-century glacier mass change in the himalayas. Nature 2012, 488, 495–498. [Google Scholar] [CrossRef]
- Bajracharya, S.R.; Mool, P. Glaciers, glacial lakes and glacial lake outburst floods in the mount Everest region, Nepal. Ann. Glaciol. 2014, 50, 81–86. [Google Scholar] [CrossRef] [Green Version]
- Richardson, S.D.; Reynolds, J.M. An overview of glacial hazards in the Himalayas. Quat. Int. 2000, 65–66, 31–47. [Google Scholar] [CrossRef]
- Shrestha, A.B.; Aryal, R. Climate change in Nepal and its impact on Himalayan glaciers. Reg. Environ. Chang. 2011, 11, 65–77. [Google Scholar] [CrossRef]
- Westoby, M.J.; Glasser, N.F.; Brasington, J.; Hambrey, M.J.; Quincey, D.J.; Reynolds, J.M. Modelling outburst floods from moraine-dammed glacial lakes. Earth-Sci. Rev. 2014, 134, 137–159. [Google Scholar] [CrossRef] [Green Version]
- Liu, J.J.; Cheng, Z.L.; Su, P.C. The relationship between air temperature fluctuation and glacial lake outburst floods in Tibet, China. Quat. Int. 2014, 321, 78–87. [Google Scholar] [CrossRef]
- Thompson, S.S.; Benn, D.I.; Dennis, K.; Luckman, A. A rapidly growing moraine-dammed glacial lake on Ngozumpa glacier, Nepal. Geomorphology 2012, 145–146, 1–11. [Google Scholar] [CrossRef]
- Bolch, T.; Buchroithner, M.F.; Peters, J.; Baessler, M.; Bajracharya, S. Identification of glacier motion and potentially dangerous glacial lakes in the Mt. Everest region/Nepal using spaceborne imagery. Nat. Hazards Earth Syst. Sci. 2008, 8, 1329–1340. [Google Scholar] [CrossRef] [Green Version]
- Quincey, D.J.; Richardson, S.D.; Luckman, A.; Lucas, R.M.; Reynolds, J.M.; Hambrey, M.J.; Glasser, N.F. Early recognition of glacial lake hazards in the Himalaya using remote sensing datasets. Glob. Planet. Chang. 2007, 56, 137–152. [Google Scholar] [CrossRef]
- Huggel, C.; Fischer, L.; Guex, S.; Paul, F.; Roer, I.; Salzmann, N.; Schlaefli, S.; Schmutz, K.; Schneider, D. Remote sensing of glacier- and permafrost-related hazards in high mountains: An overview. Nat. Hazards Earth Syst. Sci. 2005, 5, 527–554. [Google Scholar]
- Wang, W.; Xiang, Y.; Gao, Y.; Lu, A.; Yao, T. Rapid expansion of glacial lakes caused by climate and glacier retreat in the central Himalayas. Hydrol. Process. 2015, 29, 859–874. [Google Scholar] [CrossRef]
- Bhardwaj, A.; Singh, M.K.; Joshi, P.K.; Snehmani; Singh, S.; Sam, L.; Gupta, R.D.; Kumar, R. A lake detection algorithm (LDA) using Landsat 8 data: A comparative approach in glacial environment. Int. J. Appl. Earth Obs. Geoinf. 2015, 38, 150–163. [Google Scholar] [CrossRef]
- Song, C.; Sheng, Y.; Ke, L.; Nie, Y.; Wang, J. Glacial lake evolution in the southeastern Tibetan plateau and the cause of rapid expansion of proglacial lakes linked to glacial-hydrogeomorphic processes. J. Hydrol. 2016, 540, 504–514. [Google Scholar] [CrossRef] [Green Version]
- Kaushik, S.; Rafiq, M.; Joshi, P.K.; Singh, T. Examining the glacial lake dynamics in a warming climate and GLOF modelling in parts of Chandra basin, Himachal Pradesh, India. Sci. Total Environ. 2020, 714, 136455. [Google Scholar] [CrossRef]
- Chen, F.; Zhang, M.; Guo, H.; Allen, S.; Watson, C.S. Annual 30 m dataset for glacial lakes in high mountain Asia from 2008 to 2017. Earth Syst. Sci. Data 2021, 13, 741–766. [Google Scholar] [CrossRef]
- Shugar, D.H.; Burr, A.; Haritashya, U.K.; Kargel, J.S.; Watson, C.S.; Kennedy, M.C.; Bevington, A.R.; Betts, R.A.; Harrison, S.; Strattman, K. Rapid worldwide growth of glacial lakes since 1990. Nat. Clim. Chang. 2020, 10, 939–945. [Google Scholar] [CrossRef]
- Thakuri, S.; Salerno, F.; Bolch, T.; Guyennon, N.; Tartari, G. Factors controlling the accelerated expansion of Imja lake, mount Everest region, Nepal. Ann. Glaciol. 2016, 57, 245–257. [Google Scholar] [CrossRef] [Green Version]
- Wood, L.R.; Neumann, K.; Nicholson, K.N.; Bird, B.W.; Sharma, S. Melting Himalayan glaciers threaten domestic water resources in the mount Everest region, Nepal. Front. Earth Sci. 2020, 8, 128. [Google Scholar] [CrossRef]
- Luo, W.; Zhang, G.; Chen, W.; Xu, F. Response of glacial lakes to glacier and climate changes in the western Nyainqentanglha range. Sci. Total Environ. 2020, 735, 139607. [Google Scholar] [CrossRef]
- Wang, S. Glacial lake change risk and management on the Chinese Nyainqentanglha in the past 40 years. Nat. Hazards Earth Syst. Sci. Discuss. 2016. [Google Scholar] [CrossRef]
- Mirlan, D.; Chiyuki, N.; Tsutomu, Y.; Takeo, T.; Andreas, K.; Jinro, U. Regional geomorphological conditions related to recent changes of glacial lakes in the Issyk-Kul basin, northern Tien Shan. Geosciences 2018, 8, 99. [Google Scholar]
- Jiang, S.; Nie, Y.; Liu, Q.; Wang, J.; Liu, L.; Hassan, J.; Liu, X.; Xu, X. Glacier change, supraglacial debris expansion and glacial lake evolution in the Gyirong river basin, central Himalayas, between 1988 and 2015. Remote Sens. 2018, 10, 986. [Google Scholar] [CrossRef] [Green Version]
- Fan, J.; An, C.; Zhang, X.; Li, X.; Tan, J. Hazard assessment of glacial lake outburst floods in southeast Tibet based on RS and GIS technologies. Int. J. Remote Sens. 2019, 40, 4955–4979. [Google Scholar] [CrossRef]
- Veh, G.; Korup, O.; von Specht, S.; Roessner, S.; Walz, A. Unchanged frequency of moraine-dammed glacial lake outburst floods in the Himalaya. Nat. Clim. Chang. 2019, 9, 379–383. [Google Scholar] [CrossRef]
- Nie, Y.; Sheng, Y.; Liu, Q.; Liu, L.; Liu, S.; Zhang, Y.; Song, C. A regional-scale assessment of Himalayan glacial lake changes using satellite observations from 1990 to 2015. Remote Sens. Environ. 2017, 189, 1–13. [Google Scholar] [CrossRef] [Green Version]
- Zhang, G.; Yao, T.; Xie, H.; Wang, W.; Yang, W. An inventory of glacial lakes in the Third Pole region and their changes in response to global warming. Glob. Planet. Chang. 2015, 131, 148–157. [Google Scholar] [CrossRef]
- Zheng, G.; Bao, A.; Allen, S.; Ballesteros-Cánovas, J.; Stoffel, M. Numerous unreported glacial lake outburst floods in the Third Pole revealed by high-resolution satellite data and geomorphological evidence. Sci. Bull. 2021, 66, 1270–1273. [Google Scholar] [CrossRef]
- Zheng, G.; Allen, S.K.; Bao, A.; Ballesteros-Cánovas, J.A.; Huss, M.; Zhang, G.; Li, J.; Yuan, Y.; Jiang, L.; Yu, T.; et al. Increasing risk of glacial lake outburst floods from future Third Pole deglaciation. Nat. Clim. Chang. 2021, 11, 411–417. [Google Scholar] [CrossRef]
- Wang, X.; Guo, X.; Yang, C.; Liu, Q.; Wei, J.; Zhang, Y.; Liu, S.; Zhang, Y.; Jiang, Z.; Tang, Z. Glacial lake inventory of high mountain Asia (1990–2018) derived from Landsat images. Earth Syst. Sci. Data 2020, 12, 2169–2182. [Google Scholar] [CrossRef]
- Julia, N.; Mahdi, M.; Hans-Ulrich, W. Estimating spatial and temporal variability in surface kinematics of the Inylchek glacier, central Asia, using Terrasar–x data. Remote Sens. 2014, 6, 9239–9259. [Google Scholar]
- Peppa, M.; Maharjan, S.; Joshi, S.; Xiao, W.; Mills, J. Glacial lake evolution based on remote sensing time series: A case study of Tsho Rolpa in nepal. ISPRS Ann. Photogramm. Remote Sens. Spat. Inf. Sci. 2020, V-3-2020, 633–639. [Google Scholar] [CrossRef]
- Daiyrov, M.; Narama, C.; Kääb, A.; Tadono, T. Formation and outburst of the Toguz-Bulak glacial lake in the northern Teskey range, Tien Shan, Kyrgyzstan. Geosciences 2020, 10, 468. [Google Scholar] [CrossRef]
- Zhang, M.; Chen, F.; Tian, B.; Liang, D. Using a phase-congruency-based detector for glacial lake segmentation in high-temporal resolution sentinel-1a/1b data. IEEE J. Sel. Top. Appl. Earth Obs. Remote Sens. 2019, 12, 2771–2780. [Google Scholar] [CrossRef]
- Dirscherl, M.; Dietz, A.J.; Kneisel, C.; Kuenzer, C. A Novel Method for Automated Supraglacial Lake Mapping in Antarctica Using Sentinel-1 SAR Imagery and Deep Learning. Remote Sens. 2021, 13, 197. [Google Scholar] [CrossRef]
- Zhao, H.; Chen, F.; Zhang, M. A systematic extraction approach for mapping glacial lakes in high mountain regions of Asia. IEEE J. Sel. Top. Appl. Earth Obs. Remote Sens. 2018, 11, 2788–2799. [Google Scholar] [CrossRef]
- Chen, F.; Zhang, M.; Tian, B.; Li, Z. Extraction of glacial lake outlines in Tibet plateau using Landsat 8 imagery and google earth engine. IEEE J. Sel. Top. Appl. Earth Obs. Remote Sens. 2017, 10, 4002–4009. [Google Scholar] [CrossRef]
- Baumann, F.; Jinsheng, H.E.; Karsten, S.; Peter, K.; Thomas, S. Pedogenesis, permafrost, and soil moisture as controlling factors for soil nitrogen and carbon contents across the Tibetan plateau. Glob. Chang. Biol. 2009, 15, 3001–3017. [Google Scholar] [CrossRef]
- Immerzeel, W.W.; Bierkens, M.F.P. Seasonal prediction of monsoon rainfall in three Asian river basins: The importance of snow cover on the Tibetan plateau. Int. J. Climatol. 2010, 30, 1835–1842. [Google Scholar] [CrossRef]
- Neckel, N.; Kropáček, J.; Bolch, T.; Hochschild, V. Glacier mass changes on the Tibetan plateau 2003–2009 derived from ICESat laser altimetry measurements. Environ. Res. Lett. 2014, 9, 468–475. [Google Scholar] [CrossRef]
- Kääb, A.; Treichler, D.; Nuth, C.; Berthier, E. Brief communication: Contending estimates of 2003–2008 glacier mass balance over the Pamir-Karakoram-Himalaya. Cryosphere 2015, 9, 557–564. [Google Scholar] [CrossRef] [Green Version]
- Bolch, T.; Kulkarni, A.; Kääb, A.; Huggel, C.; Paul, F.; Cogley, J.G.; Frey, H.; Kargel, J.S.; Fujita, K.; Scheel, M. The state and fate of Himalayan glaciers. Science 2012, 336, 310–314. [Google Scholar] [CrossRef] [Green Version]
- Schiemann, R.; Lüthi, D.; Schär, C. Seasonality and interannual variability of the westerly jet in the Tibetan plateau region. J. Clim. 2009, 22, 2940–2957. [Google Scholar] [CrossRef]
- Arendt, A.; Bliss, A.; Bolch, T.; Cogley, J.; Gardner, A.; Hagen, J.-O.; Hock, R.; Huss, M.; Kaser, G.; Kienholz, C. Randolph Glacier Inventory—A Dataset of Global Glacier Outlines: Version 6.0: Technical Report, Global Land Ice Measurements from Space; RGI Consortium: Boulder, CO, USA, 2017. [Google Scholar] [CrossRef]
- Guo, W.; Liu, S.; Xu, J.; Wu, L.; Shangguan, D.; Yao, X.; Wei, J.; Bao, W.; Yu, P.; Liu, Q. The second Chinese glacier inventory: Data, methods and results. J. Glaciol. 2015, 61, 357–372. [Google Scholar] [CrossRef] [Green Version]
- Nuimura, T.; Sakai, A.; Taniguchi, K.; Nagai, H.; Lamsal, D.; Tsutaki, S.; Kozawa, A.; Hoshina, Y.; Takenaka, S.; Omiya, S. The Gamdam glacier inventory: A quality-controlled inventory of Asian glaciers. Cryosphere 2015, 9, 849–864. [Google Scholar] [CrossRef] [Green Version]
- Wang, X.; Ding, Y.; Liu, S.; Jiang, L.; Wu, K.; Jiang, Z.; Guo, W. Changes of glacial lakes and implications in Tian Shan, central Asia, based on remote sensing data from 1990 to 2010. Environ. Res. Lett. 2013, 8, 575–591. [Google Scholar] [CrossRef]
- Farr, T.G.; Rosen, P.A.; Caro, E.; Crippen, R.; Duren, R.; Hensley, S.; Kobrick, M.; Paller, M.; Rodriguez, E.; Roth, L. The shuttle radar topography mission. Rev. Geophys. 2007, 45, RG2004. [Google Scholar] [CrossRef] [Green Version]
- Huffman, G.J.; Adler, R.F.; Bolvin, D.T.; Gu, G. Improving the global precipitation record: GPCP version 2.1. Geophys. Res. Lett. 2009, 36, 153–159. [Google Scholar] [CrossRef] [Green Version]
- Xu, H. Modification of normalised difference water index (NDWI) to enhance open water features in remotely sensed imagery. Int. J. Remote Sens. 2006, 27, 3025–3033. [Google Scholar] [CrossRef]
- Zhu, Z.; Woodcock, C.E. Object-based cloud and cloud shadow detection in Landsat imagery. Remote Sens. Environ. 2012, 118, 83–94. [Google Scholar] [CrossRef]
- Li, J.; Warner, T.A.; Wang, Y.; Bai, J.; Bao, A. Mapping glacial lakes partially obscured by mountain shadows for time series and regional mapping applications. Int. J. Remote Sens. 2019, 40, 615–641. [Google Scholar] [CrossRef]
- Krumwiede, B.S.; Kamp, U.; Leonard, G.J.; Kargel, J.S.; Dashtseren, A.; Walther, M. Recent glacier changes in the Mongolian Altai mountains: Case studies from Munkh Khairkhan and Tavan Bogd. In Global Land Ice Measurements from Space; Springer: Berlin/Heidelberg, Germany, 2014; pp. 481–508. [Google Scholar]
- Thieler, E.R.; Himmelstoss, E.A.; Zichichi, J.L.; Ergul, A. The Digital Shoreline Analysis System (DSAS) Version 4.0—An ArcGIS Extension for Calculating Shoreline Change; U.S. Geological Survey: Reston, VA, USA, 2009. [CrossRef]
- Gardelle, J.; Arnaud, Y.; Berthier, E. Contrasted evolution of glacial lakes along the Hindu Kush Himalaya mountain range between 1990 and 2009. Glob. Planet. Chang. 2011, 75, 47–55. [Google Scholar] [CrossRef] [Green Version]
- Paul, F.; Kääb, A.; Haeberli, W. Recent glacier changes in the Alps observed by satellite: Consequences for future monitoring strategies. Glob. Planet. Chang. 2007, 56, 111–122. [Google Scholar] [CrossRef]
- Xie, Z.; Zhang, S.; Ding, Y.; Liu, S.; Shangguan, D. Index for hazard of glacier lake outburst flood of lake Merzbacher by satellite-based monitoring of lake area and ice cover. Glob. Planet. Chang. 2012, 107, 229–237. [Google Scholar] [CrossRef]
- Shen, Y.; Wang, G.; Ding, Y. Changes in Merzbacher lake of Inylchek glacier and glacial flash floods in Aksu river basin, Tianshan during the period of 1903–2009. J. Glaciol. Geocryol. 2009, 31, 993–1002. [Google Scholar]
- Glazirin, G.E. A century of investigations on outbursts of the ice-dammed lake Merzbacher (central Tien Shan). Austrian J. Earth Sci. 2010, 103, 171–179. [Google Scholar]
- Wang, X.; Chai, K.; Liu, S.; Wei, J.; Jiang, Z.; Liu, Q. Changes of glaciers and glacial lakes implying corridor-barrier effects and climate change in the Hengduan Shan, southeastern Tibetan plateau. J. Glaciol. 2017, 63, 535–542. [Google Scholar] [CrossRef] [Green Version]
- Wang, X.; Liu, S.; Ding, Y.; Guo, W.; Jiang, Z.; Lin, J.; Han, Y. An approach for estimating the breach probabilities of moraine-dammed lakes in the Chinese Himalayas using remote-sensing data. Nat. Hazards Earth Syst. Sci. 2012, 12, 3109–3122. [Google Scholar] [CrossRef] [Green Version]
- Zhang, G.; Yao, T.; Piao, S.; Bolch, T.; Xie, H.; Chen, D.; Gao, Y.; O’Reilly, C.M.; Shum, C.K.; Yang, K. Extensive and drastically different Alpine lake changes on Asia’s high plateaus during the past four decades. Geophys. Res. Lett. 2017, 44, 252–260. [Google Scholar] [CrossRef] [Green Version]
- Sellmann, P.V.; Brown, J.; Lewellen, R.I.; Mckim, H.L.; Merry, C.J. The Classification and Geomorphic Implications of Thaw Lakes on the Arctic Coastal Plain, Alaska; US Department of Defense, Department of the Army, Corps of Engineers, Cold Regions Research and Engineering Laboratory: Hanover, NH, USA, 1975.
- Côté, M.M.; Burn, C.R. The Oriented Lakes of Tuktoyaktuk Peninsula, Western Arctic Coast, Canada: A GIS-Based Analysis. Permafr. Periglac. Process. 2010, 13, 61–70. [Google Scholar] [CrossRef]
- Hinkel, K.M.; Frohn, R.C.; Nelson, F.E.; Eisner, W.R.; Beck, R.A. Morphometric and spatial analysis of thaw lakes and drained thaw lake basins in the western Arctic Coastal Plain, Alaska. Permafr. Periglac. Process. 2010, 16, 327–341. [Google Scholar] [CrossRef]
- Moussavi, M.S.; Abdalati, W.; Pope, A.; Scambos, T.; Tedesco, M.; Macferrin, M.; Grigsby, S. Derivation and validation of supraglacial lake volumes on the greenland ice sheet from high-resolution satellite imagery. Remote Sens. Environ. 2016, 183, 294–303. [Google Scholar] [CrossRef] [Green Version]
- Paul, F.; Winsvold, S.; Kääb, A.; Nagler, T.; Schwaizer, G. Glacier Remote Sensing Using Sentinel-2. Part II: Mapping Glacier Extents and Surface Facies, and Comparison to Landsat 8. Remote Sens. 2016, 8, 575. [Google Scholar] [CrossRef] [Green Version]
- Hochreuther, P.; Neckel, N.; Reimann, N.; Humbert, A.; Braun, M. Fully Automated Detection of Supraglacial Lake Area for Northeast Greenland Using Sentinel-2 Time-Series. Remote Sens. 2021, 13, 205. [Google Scholar] [CrossRef]
- Wangchuk, S.; Bolch, T. Mapping of glacial lakes using sentinel-1 and sentinel-2 data and a random forest classifier: Strengths and challenges. Sci. Remote Sens. 2020, 2, 100008. [Google Scholar] [CrossRef]


Publisher’s Note: MDPI stays neutral with regard to jurisdictional claims in published maps and institutional affiliations. |
© 2021 by the authors. Licensee MDPI, Basel, Switzerland. This article is an open access article distributed under the terms and conditions of the Creative Commons Attribution (CC BY) license (https://creativecommons.org/licenses/by/4.0/).