Abstract
Urbanization can induce environmental changes such as the urban heat island effect, which in turn influence the terrestrial ecosystem. However, the effect of urbanization on the phenology of subtropical vegetation remains relatively unexplored. This study analyzed the changing trend of vegetation photosynthetic phenology in Dongting Lake basin, China, and its response to urbanization using nighttime light and chlorophyll fluorescence datasets. Our results indicated the start of the growing season (SOS) of vegetation in the study area was significantly advanced by 0.70 days per year, whereas the end of the growing season (EOS) was delayed by 0.24 days per year during 2000–2017. We found that urbanization promoted the SOS advance and EOS delay. With increasing urbanization intensity, the sensitivity of SOS to urbanization firstly increased then decreased, while the sensitivity of EOS to urbanization decreased with urbanization intensity. The climate sensitivity of vegetation phenology varied with urbanization intensity; urbanization induced an earlier SOS by increasing preseason minimum temperatures and a later EOS by increasing preseason precipitation. These findings improve our understanding of the vegetation phenology response to urbanization in subtropical regions and highlight the need to integrate human activities into future vegetation phenology models.
1. Introduction
Phenology describes the adaptation of the physiological activities of organisms to periodic changes in their surroundings [1]. Because vegetation phenology is profoundly influenced by regional climatic conditions [2,3,4], it provides important evidence of climate change [5]. Numerous studies on vegetation phenology around the world have indicated that earlier spring phenology (start of growing season, SOS), later autumn phenology (end of growing season, EOS), and extended vegetation growing seasons (length of growing season, LOS) are driven by climate change [6,7,8]. Vegetation phenology also has profound implications for climate system feedbacks, ecosystem structure and function, and the carbon balance [8,9]. Hence, vegetation phenology research not only improves our understanding of the response mechanisms of vegetation to climate change but also provides more a nuanced perspective of the energy cycle of the ground-air system, which is significant for the assessment of regional carbon sinks.
Temperature, precipitation, and photoperiod are considered as primary natural factors affecting vegetation phenology [10,11]. For example, in arid and semi-arid regions, increased precipitation leads to earlier SOS [12], whereas maximum and minimum temperatures have different effects on EOS for different regions or vegetation types [10]. In recent decades, increasing urbanization, which is an extremely complex and comprehensive change experienced by a human society that has resulted in multiple ecological issues [13,14], is closely related to changes in vegetation phenology [15]. Many studies have demonstrated that urbanization and its collateral effects (e.g., the urban heat island (UHI) effect and precipitation changes) can lead to an earlier SOS, and later EOS by altering hydrothermal conditions and material cycling in the plant surroundings [16,17]. For example, Meng et al. [18] analyzed the vegetation phenology among 85 large cities in the conterminous United States. They found that the SOS occurred 6.1 ± 6.3 days earlier in urban areas than in corresponding rural areas. Moreover, Zhou et al. [19] analyzed the vegetation phenological differences among 32 major cities and their surrounding rural areas in China. They also found that urbanization advanced the SOS by an average of 11.9 days and delayed the EOS by an average of 5.4 days when compared with those in surrounding rural areas. In addition, accumulating evidence has revealed that urbanization could influence vegetation physiology and phenology by altering the nightlight conditions [20,21]. For example, artificial light pollution affects the flowering phenology by altering the photoperiod [22].
Although vegetation phenology in mid-to-high latitude regions are well studied [23], subtropical regions remain poorly studied, resulting in a very limited understanding of the response of subtropical vegetation phenology to urbanization. This represents an important gap in current knowledge because subtropical regions are characterized by diverse vegetation types with high biodiversity, which play a key role in the global carbon cycle and climate change [24]. In addition, studies on the factors influencing vegetation tend to analyze its relationship with natural factors, whereas the impact of human activities is rarely quantified. As the dominant form of human activity, urbanization can produce marked impact on the timing of plant phenology [23,25]. Therefore, further research on the response of vegetation phenology to urbanization in subtropical regions is of great significance.
Satellite observation has emerged as an essential tool in the observation and analysis of medium- and large-scale vegetation phenology, with the normalized difference vegetation index (NDVI) and enhanced vegetation index (EVI) as common indicators of vegetation phenology [26,27]. However, subtropical evergreen forests are characterized by small variations of canopy reflectance, and these vegetation indices are not suitable for detecting the phenological changes in subtropical regions [26]. Recently, the remote sensing of solar-induced chlorophyll fluorescence (SIF) has provided a new perspective on the detection of vegetation phenology [28,29,30]. Because chlorophyll fluorescence can reflect the photosynthetic information of vegetation, the use of SIF for inverting vegetation physiological change in subtropical regions is more reliable than the use of vegetation indices [24,31], enabling more accurate monitoring of the photosynthetic phenology of subtropical vegetation.
As a typical subtropical vegetation ecosystem, the Dongting Lake basin in China plays an important role in enhancing regional ecosystem service functions and maintaining regional ecological security. In recent years, the Dongting Lake basin has experienced rapid urbanization; the rapidly growing population and urban built-up area have both had an enormous influence on the regional ecosystem [32]. Therefore, it is crucial to quantify the impact of urbanization on the vegetation phenology of this region in order to enhance the carbon sink effect and ecosystem service function of regional vegetation. In this study, we explore the trends of vegetation photosynthetic phenology in the Dongting Lake basin and its response to urbanization. The objectives of this study are to (1) evaluate the spatiotemporal trends of vegetation photosynthetic phenology in the Dongting Lake basin, (2) analyze the sensitivity of vegetation photosynthetic phenology in the study area to urbanization, and (3) explore the climate sensitivity of vegetation phenology and its response to urbanization in the study area.
2. Data and Methods
2.1. Study Area
Situated in 24°38′N~30°08′N, 108°47′E~114°15′E, the Dongting Lake basin is the second-largest sub-basin in the middle and lower reaches of the Yangtze River, and plays an essential role in climate regulation, global biodiversity conservation, and climate response. This area is characterized by a typical subtropical monsoonal humid climate with an annual average temperature of 15.6–17.5 °C, the annual average precipitation is 1429 mm. In addition, the complex and diverse topography of the basin is reflected in the hills and mountains with high topography in the east, west and south, and low topography in the north. With a suitable climate and topography, the Dongting Lake basin has more forest areas and is one of the major forest areas in the south of China. The natural vegetation types are mainly evergreen broadleaf forests and evergreen needleleaf forest, followed by grasslands and shrubs. The natural vegetation covers an area of 1,480,000 km2, accounting for about 56% of the total basin. And the artificial vegetation is mainly agricultural land.
2.2. Data Sources
The global OCO-2-based solar-induced fluorescence (GOSIF) data used in this study were retrieved from the Orbiting Carbon Observatory 2 (OCO-2) [33]. The data, which were used to extract the photosynthetic phenology of vegetation, are characterized by a long time span and high resolution (0.05° and 8-day, respectively) [33]. GOSIF was developed by a data-driven method that established a predictive SIF model from discrete OCO-2 soundings and MODIS remote sensing data [34]. This dataset plays an important role in understanding long-term trends in global photosynthesis and has been widely used to evaluate inter-annual variations in vegetation phenology [15,35].
Nighttime light remote sensing time-series data directly reflect the spatial and temporal distribution of human activity intensity [36], and provide data support for rapidly and conveniently measuring the level of urbanization. In this study, we used the Defense Meteorological Sate-Lite Program (DMSP) nighttime light data constructed by Zhao et al. which provides annual average values [37]. The original DMSP data are optimized according to urbanization in Asia; therefore, the spatial and temporal distribution of human activity intensity in the Dongting Lake basin is accurately reflected. The images were resampled into 18-year annual average images with a resolution of 1 km and digital number (DN) values ranging from 0 to 63.
Climate data, including monthly average maximum temperature, minimum temperature, and precipitation data, were obtained from the Resources and Environmental Sciences and Data Center of the Chinese Academy of Sciences (https://www.resdc.cn/) (accessed on 1 August 2021) from January 2000 to December 2017. The spatial resolution of the climate data is 0.1° × 0.1°. Considering that phenology is most sensitive to changes in preseason climate factors, a preseason period of 1–5 months for each climatic factor, that is, maximum temperature, minimum temperature, and precipitation was analyzed for partial correlation with the phenological indicators. Subsequently, the period with the largest absolute partial correlation coefficient was selected as the optimal preseason time, and the correlation between each climate factor and vegetation phenology was determined at this optimal time [11]. The significance of each pixel was also determined.
The regional vegetation classification data for the Dongting Lake basin were derived from the rasterization of a digitized 1:1,000,000 vegetation map of China [38]. To analyze the sensitivity of different vegetation to urbanization, we selected four main vegetation types in the subtropical region of China, including evergreen coniferous forest (ECF), evergreen broadleaved forest (EBF), shrub, and grassland [24]. In addition, because of the impacts of sparse vegetation on the extraction of vegetation phenology [39], we used Moderate Resolution Imaging Spectroradiometer (MODIS) NDVI data to identify the areas with low vegetation cover. The MODIS NDVI datasets (2000–2017) were extracted from the MOD13C1 v006 dataset with a spatial resolution of 0.05° and an interval of 16 days.
2.3. Vegetation Photosynthesis Extraction
In this study, the dynamic threshold method was used for the extraction of phenological indicators. Time-series SIF data were smoothed using the Savitzky-Golay (S-G) filter to eliminate noise from the remote sensing data caused by environmental effects [40]. Subsequently, the dynamic threshold method was applied to estimate vegetation phenology [39,41]. As compared with the fixed threshold method, the dynamic threshold method can dynamically set the threshold value according to different conditions, thereby eliminating the effect of background values and better reflecting the growth stage of the same vegetation cover under different spatial and temporal conditions [39]. Several studies have verified that the dynamic threshold method has considerable accuracy for vegetation phenology extraction in China [24,42]. The formula is as follows:
where SIFt is the SIF value for a given time and SIFmax and SIFmin are the maximum and minimum values of SIF during the entire year. Specifically, the SOS or EOS dates were defined as the first day of the year in the rising or falling phase when the SIF ratio reaches 0.5 in this study. The threshold of 0.5 has been proved to be very effective for determining the vegetation phenology, which has been verified by multiple studies based on ground observation data from the subtropical region of China [10,24,42].
2.4. DMSP Nighttime Light Classification Statistics
The magnitude of the DN value of nighttime light data pixels is positively correlated with the level of regional urbanization [43]; thus, the DN value can be used as a basis for classifying the regional urbanization intensity level. In order to maximize the areas of medium and high urbanization intensity covering the major built-up areas of towns and traffic lanes in the basin, and to reflect the differences in urbanization levels between built-up areas and their surrounding radiation zones, the urbanization intensity levels were classified according to the following process. First, urban built-up areas were extracted using the pixel DN threshold method. Then, after comparing with the built-up areas and traffic lanes, the urbanization intensity was determined as either low (0 < DN ≤ 1), medium (1 < DN ≤ 10), or high (10 < DN ≤ 63) (Figure 1).
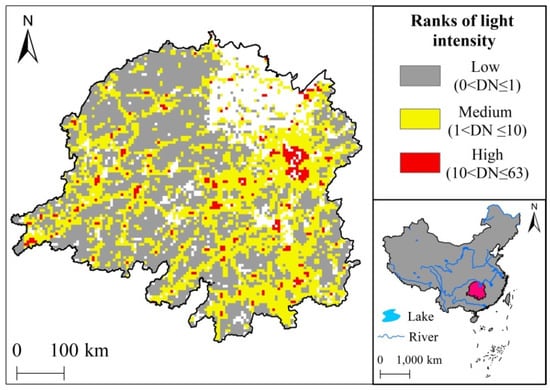
Figure 1.
Classification of urbanization intensity in Dongting Lake basin.
2.5. Analysis
In this study, we calculated the regression coefficients of vegetation phenology versus year in the Dongting Lake basin during 2000–2017 using linear regression analysis and determined the confidence values (p-values), where the slope of the regression line is the phenological variability. In order to explore the response of phenology to urbanization, the trends of phenology were calculated individually for different urbanization intensity levels, and the impact of urbanization level on photosynthetic phenology was analyzed by comparing the magnitude of phenological variability at different urbanization intensity levels. Then, linear regression analysis was performed on the phenology and nighttime light DN values of different urbanization levels, and the regression coefficient was determined as the sensitivity of phenology to urbanization intensity. The difference in sensitivity to different levels of urbanization was compared between the regression coefficients of SOS, EOS, and DN values. Using the linear regression analysis, we also evaluated the phenological sensitivity to urbanization across different vegetation types.
To explore the climatic sensitivity of vegetation phenology and its response pattern to urbanization, partial correlation analysis was first used to individually calculate the climatic sensitivity of phenology to preseason maximum temperature, minimum temperature, precipitation, thereby eliminating the effects of the other two factors. The main climatic factors affecting vegetation phenology in the study area were then explored by comparing the correlation between different climatic factors and phenology [10]. Subsequently, vegetation phenology and climate factors were regressed at different urbanization levels, and the regression coefficients were used to indicate the sensitivity of vegetation phenology to climate factors at different urbanization levels. By comparing the climatic sensitivity of vegetation phenology under different levels of urbanization, the differences in the impact of climate factors on phenology were also analyzed. Throughout the analysis, we adjusted the spatial resolution of all data to 0.1° to match the data with the coarsest resolution. In addition, the areas with low vegetation cover were eliminated from the results by excluding pixels with annual average MODIS NDVI < 0.1. We also excluded pixels dominated by cropland because cropland may have two or more growth cycles.
3. Results
3.1. Vegetation Photosynthetic Phenology Trends in Dongting Lake Basin
In terms of time scale, the SOS in the Dongting Lake basin was significantly advanced by 0.7 days per year during the period 2000–2017 (Figure 2). The SOS advanced in more than 95% of the study area, with approximately 64% of the area showing significant advances (p < 0.05) (Figure 3a). Meanwhile, the EOS was delayed by 0.24 days per year (Figure 2). The delay in the EOS occurred across more than 72% of the Dongting Lake basin, with approximately 23% of the area exhibiting a statistically significant delay (p < 0.05, Figure 3b). Due to the advance of the SOS and delay in the EOS, the LOS was significantly extended by 0.94 days per year over the 18-year period (Figure 2). This LOS extension occurred in approximately 91% of the study area and was significant in 57% of the study area (Figure 3c).
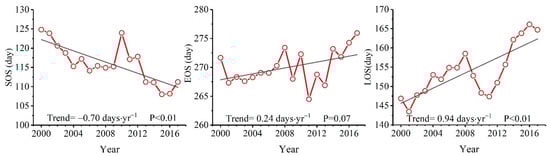
Figure 2.
The overall trends in vegetation phenology in the Dongting Lake basin during 2000–2017.
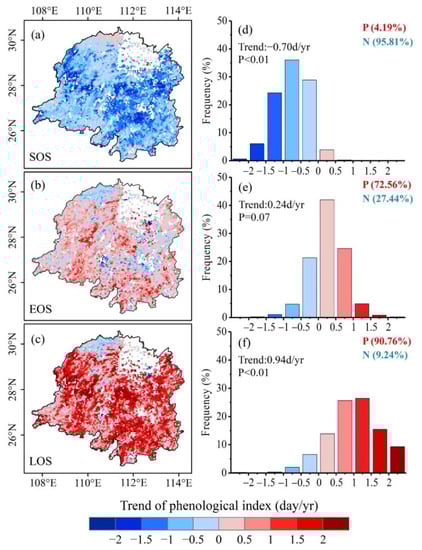
Figure 3.
Vegetation phenology trends and frequency distribution in the Dongting Lake basin during 2000–2017. (a,d) for the start of the growing season (SOS), (b,e) for the end of the growing season (EOS) and (c,f) for the length of growing season (LOS).
3.2. Patterns of Vegetation Photosynthetic Phenological Changes with Increased Urbanization
This subsection evaluates the phenological change trends for different urbanization intensity gradients. The advance of the SOS increased rapidly from 0.61 days per year for low urbanization intensity to 0.93 days per year for medium urbanization intensity, reaching 1.01 days per year for high urbanization intensity (Figure 4). Although the delay in the EOS was in the range of 0.24–0.28 days/year for all urbanization levels (Figure 4), we observed a weak increase as urbanization increased from low to medium levels (from 0.25 days/year to 0.28 days/year), followed by a small decrease to 0.24 days/year at high urbanization.
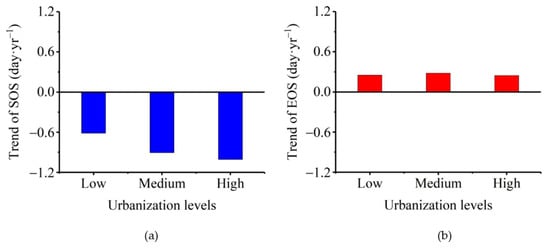
Figure 4.
Variability of vegetation phenology in the Dongting Lake basin across different urbanization levels. (a) start of the growing season (SOS) and (b) end of the growing season (EOS).
With respect to the vegetation phenology sensitivity of urbanization, SOS typically exhibited higher sensitivity to urbanization than EOS. SOS sensitivity to nighttime light intensity first increased (from −1.76 days/DN to −2.11 days/DN) then decreased (to −0.80 days/DN) with rising urbanization level. EOS sensitivity to nighttime light intensity decreased from 1.69 days/DN year at lower urbanization levels to 0.19 days/DN at higher urbanization levels (Figure 5).
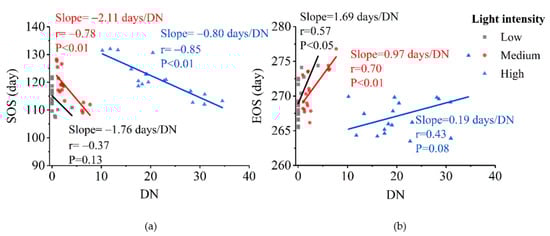
Figure 5.
Sensitivity of vegetation phenology to nighttime light intensity across urbanization levels. (a) start of the growing season (SOS) and (b) end of the growing season (EOS).
Spatially, the sensitivity of vegetation phenology to urbanization intensity varied across geographic locations, with vegetation in the northern part of the basin generally less sensitive to urbanization than in the central and southern parts of the basin (Figure 6a). Vegetation with more sensitive EOS to urbanization was mainly distributed in the western part of the basin (Figure 6b).
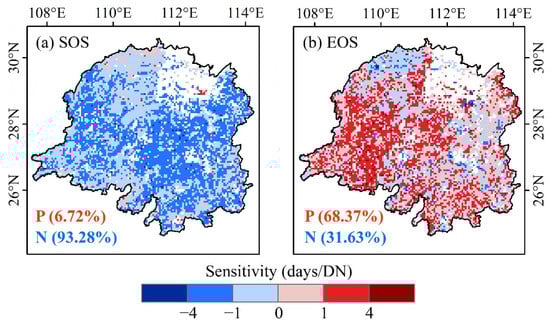
Figure 6.
Spatial distribution of sensitivity of vegetation phenology to light intensity in Dongting Lake basin. (a) start of the growing season (SOS) and (b) end of the growing season (EOS).
The phenology of different vegetation types was significantly affected by urbanization. The SOS of four vegetation types were more sensitive to urbanization than EOS (Figure 7). Evergreen broadleaved forests were less sensitive to urbanization than the other three vegetation types (Figure 7b,f). Both SOS and EOS of evergreen coniferous forests were significantly affected by increasing urbanization. Grassland had the highest SOS sensitivity to urbanization at −2.65 days/DN (Figure 7d), followed by evergreen coniferous forest with a sensitivity of −2.35 days/DN (Figure 7a). Urbanization had the most significant effect on EOS in shrubs and evergreen coniferous forests (Figure 7g,e), which is consistent with the spatial distribution characteristics of EOS sensitivity to urbanization.
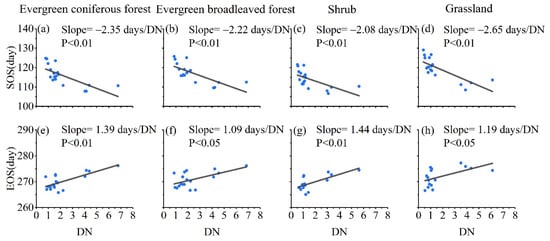
Figure 7.
Sensitivity of vegetation phenology to light intensity in four vegetation types: (a,e) evergreen coniferous forest, (b,f) evergreen broadleaved forest, (c,g) shrub, (d,h) grassland. (a–d) start of the growing season (SOS) and (e–h) end of the growing season (EOS).
3.3. Climate Sensitivity of Vegetation Phenology According to Urbanization Gradient
SOS and EOS exhibited notably different partial correlation coefficients with different climate factors. In general, SOS was negatively correlated with the preseason maximum temperature, minimum temperature, and precipitation, and the pixels with negative partial correlation coefficients accounted for 71.98%, 89.33%, and 73.19%, respectively (Figure 8). The negative correlation between preseason minimum temperature and SOS was the most significant. Negative EOS correlations were observed with preseason maximum temperature, whereas positive EOS correlations were observed with minimum temperature and precipitation (Figure 8). Among these, the partial correlation with preseason precipitation was the strongest, with a ratio of 78.37%.
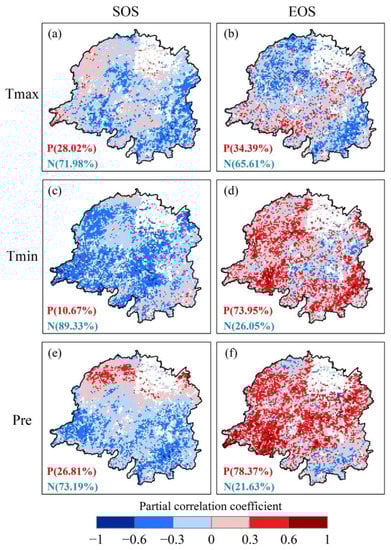
Figure 8.
Partial correlation coefficient between phenology indicators and maximum temperature (Tmax), minimum temperature (Tmin) and precipitation (Pre) in the Dongting Lake basin. (a,c,e) start of the growing season (SOS) and (b,d,f) end of the growing season (EOS).
The sensitivity of SOS and EOS to climate factors differed substantially at different urbanization levels. The sensitivity of SOS to the preseason maximum temperature and preseason precipitation decreased and increased, respectively, with an increase in the intensity of urbanization, whereas SOS sensitivity to the preseason minimum temperature did not change substantially, showing a trend of first increasing then decreasing (Figure 9). For EOS, sensitivity to the preseason maximum temperature increased substantially from low to medium urbanization but barely increased from medium to high urbanization (Figure 9). Moreover, the sensitivity of EOS to the preseason minimum temperature decreased significantly with the intensification of urbanization, reaching almost zero. Finally, the sensitivity of EOS to preseason precipitation steadily increased with the intensification of urbanization (Figure 9). Overall, EOS and SOS sensitivity to preseason maximum temperature and precipitation showed opposite trends with increasing urbanization intensity. Moreover, the sensitivity to preseason minimum temperature exhibited smaller changes for SOS than EOS.
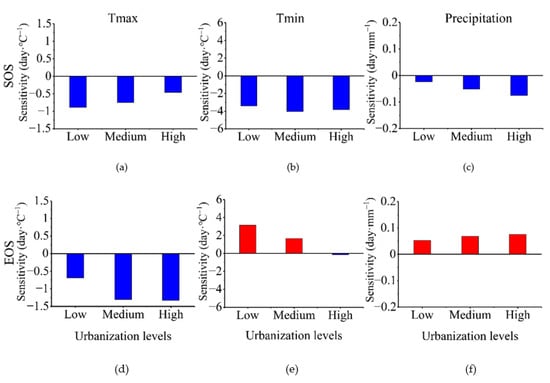
Figure 9.
Patterns of phenology climatic sensitivity according to urbanization gradient. (a–c) start of the growing season (SOS) and (d–f) end of the growing season (EOS).
4. Discussion
4.1. Changes of Vegetation Photosynthetic Phenology in the Dongting Lake Basin
Overall, the SOS in the Dongting Lake basin was significantly advanced by 0.7 days per year, whereas the observed delay in the EOS of vegetation was not insignificant. Several previous studies have also reported a trend of earlier SOS dates; however, the rate of advancement varies among regions and periods [44,45]. For example, SOS dates exhibited a significant and consistent advance over Eurasia from 1982 to 2011, at a rate of 1.7 ± 0.6 days per decade [44], and those in the temperate grasslands of China advanced at a significant rate of 1.84 days per decade from 1982 to 2015 [45]. This indicates a similar overall trend of the SOS in the northern hemisphere [7]; however, the spring photosynthetic phenology of vegetation in the subtropical region of China appears to have experienced a more rapid advance than other regions.
Regarding autumn phenology, several studies have shown a delayed trend in recent decades. From 1982 to 2006, the average delay in the autumn phenology of vegetation in North America was 0.55 days per year [46], whereas that of vegetation in temperate regions of China was 0.12 days per year from 1982 to 2011 [47]. Non-significant delays in the EOS of vegetation were observed in the Dongting Lake basin, suggesting that the EOS trend is more regional than that of SOS. In general, our studies showed an earlier SOS and later EOS in the Dongting Lake basin. Several studies have shown that ecosystems will absorb more carbon as a result of the extended LOS, by increasing the duration of photosynthesis [48,49]. Warmer springs stimulate the advancement of SOS, leading to an increasing in ecosystem carbon sequestration by increasing leaf area [48]. However, the delayed EOS induced by temperature has regional differences effects on carbon uptake in ecosystems [49,50]. A recent study suggested that the increase in net ecosystem carbon caused by increasing temperature in autumn is primarily related to whether the ecosystem is radiation-limited [27]. The stronger radiation limitation at higher latitudes would reduce the warming effect on photosynthesis, and carbon release through respiration increased more than the carbon uptake through photosynthesis, leading to a net carbon loss from ecosystems. However, the weaker limitation in the low- and mid-latitude region will benefit from warming and result in ecosystem carbon gain [27]. Therefore, the increasing temperature is likely to lead to an increased net carbon uptake from ecosystems due to the fewer radiation limitation in subtropical regions.
4.2. Response of Vegetation Phenology Changes to Urbanization
An increase in urbanization level increased the variability of SOS but did not change the EOS, indicating that the effect of urbanization on the advancement of the vegetation SOS was more dramatic than that on the delay in the EOS. This was likely due to the distinctly lower preseason temperatures for SOS than EOS, which resulted in a more pronounced UHI effect. Indeed, studies have shown that the effect of urbanization on phenology is stronger in areas with low background temperatures [16]. For different vegetation types, the evergreen broadleaf forests are widespread in lower elevations where human activities were frequent and more accessible to urban. Due to the higher background temperatures there, vegetation has adapted to the environmental changes, making the phenology less sensitive to urbanization [51], while the evergreen coniferous forests, shrubs, and grasslands at higher elevations may be more sensitive to the increase in temperature caused by the UHI phenomenon [52].
In terms of sensitivity trends, although urbanization promoted changes in vegetation phenology during 2000–2017, the sensitivity of SOS and EOS to urbanization gradually weakened as the urbanization level increased from medium to high. This suggests that the continued development of urbanization will gradually weaken the effects of urbanization on SOS and EOS in the study area. The underlying reason for this finding may be the shifts in the atmospheric composition of the urban area induced by urbanization, which generates negative feedback mechanisms; for example, urbanization will promote an increase of ozone concentration that is not conducive to vegetation photosynthesis [53]. Previous studies have reported that urbanization predominantly influences plant phenology by altering the hydrothermal conditions in the environment of organisms [16,19,54]. In addition, urbanization also increase the area of parks, green spaces [55], and plant species composition, and then weakens the sensitivity of SOS and EOS to urbanization. For example, urban green spaces help mitigate the UHI effect by playing a cooling role through evaporation and shading, thus providing a buffering effect on vegetation phenology [56,57]. This also explains the decreasing sensitivity of vegetation phenology to urbanization in our study.
The finding that urbanization in the Dongting Lake basin promoted the advancement of the SOS and a delay in the EOS agrees with the results of previous studies [18,29]. According to differences in vegetation phenology changes with urbanization level, vegetation phenological variability in the Dongting Lake basin exhibits a smaller difference between urban and suburban areas than the northeastern part of China. Hu et al. showed that the SOS in Harbin, China, was advanced by 2.28 days and 1.35 days per year in urban and suburban areas, respectively [58], whereas the EOS was delayed by 0.43 days and 0.40 days per year in urban and suburban areas, respectively [58]. This north-south variation agrees with the results of Jia et al. on the influence of urbanization on vegetation phenology in different regions across China [59] and demonstrates that the impact of urbanization on vegetation phenology in the Dongting Lake basin is consistent with the geographical distribution pattern. The primary reason for this difference is likely the climatic background of different research areas. Another possible reason is differences in the remote sensing data and processing methods employed in different research [16].
4.3. Effects of Urbanization on the Climatic Sensitivity of Vegetation Photosynthetic Phenology
Our results revealed the highest negative bias correlation between the preseason minimum temperature and the SOS, with SOS exhibiting high sensitivity to this parameter at all urbanization intensity levels; thus, the preseason minimum temperature was the dominant climatic factor contributing to the advancement of SOS. In addition, the sensitivity of the preseason minimum temperature to urbanization level was consistently and significantly increased with increasing urbanization intensity (Table 1), indicating that the impact of urbanization on SOS occurred predominantly through the UHI effect [60], which promoted a rise in preseason temperatures [18]. There was also a negative correlation between preseason precipitation and spring phenology (SOS), with SOS sensitivity to preseason precipitation increasing with urbanization intensity, indicating that this parameter promotes the advancement of vegetation spring photosynthetic phenology in the study area. This may be because precipitation promotes the deposition of atmospheric nitrogen and phosphorus elements so is conducive to vegetation growth [19,61]. On the other hand, the Dongting Lake basin is a typical subtropical monsoonal humid climate, the warm and humid environment favoring vegetation growth, and precipitation increases the soil moisture, which is beneficial for the recovery of photosynthesis [62]. Similarly, SOS showed a significantly negative correlation with the preseason maximum temperature in most regions; however, its sensitivity decreased with increasing urbanization levels. Related studies have pointed out that reduced sensitivity of SOS to urbanization may be due to the UHI effect, which increases the winter temperature and thus reduces the accumulation of cold temperature, which is not conducive to vernalization [29]. This may be the primary reason for the gradual decrease in the climatic sensitivity of SOS with increasing urbanization gradient. In addition, artificial light pollution caused by urbanization could inhibit the vegetation phenology advance induced by climate warming [63], which partially explains the decreasing climatic sensitivity of vegetation phenology to urbanization.

Table 1.
Sensitivity of preseason climate factors to urbanization at different nighttime lighting levels.
Regarding the EOS, we found that preseason precipitation is a critical climatic factor driving its delay, and the sensitivity of EOS to preseason precipitation progressively increased with urbanization intensity (Table 1). Several studies have revealed a trend of increasing precipitation during the spring and summer floods in some cities and surrounding areas of the study area [64,65]. Therefore, it is reasonable to assume that urbanization produces a rain island effect [66], increasing preseason precipitation in the study area and promoting a delay in the EOS. Furthermore, the preseason minimum temperature also promoted a change in the EOS; however, the sensitivity of vegetation to EOS decreased significantly with increasing urbanization. Therefore, early stages of urbanization may contribute to an EOS delay by increasing the preseason minimum temperature but will exhibit a progressively weaker effect on phenology when the temperature rises to a certain level [3]. A negative correlation between the preseason maximum temperature and EOS, as well as a rapid increase in the sensitivity of EOS to preseason maximum temperature with increasing urbanization intensity, further implied that the preseason maximum temperature is an inhibitory factor for EOS changes in the study area. Moreover, the intensity of urbanization will increase with a progressive increase in this inhibitory effect, which may lead to a gradual decrease in the delay rate of the EOS.
4.4. Uncertainty and Insights
Linear relationships were employed in this study to characterize the response patterns of vegetation phenology and phenological climate sensitivity to nighttime light data; however, the complex nonlinear relationships between urbanization, climate factors, and phenology could not be excluded. Recent studies reported that machine learning methods such as support vector machines and random forests have achieved significant results in fitting climate factors to phenology, and it showed better performance than the linear method in the prediction of phenology [67,68,69,70], thereby provides new insights into the relationship between phenology and environmental factors. Furthermore, the method of classifying regional nighttime light levels focuses on the urbanization intensity as the sole classification criterion, so does not reflect differences in the topography or vegetation type. Therefore, future research should employ a nonlinear regression method to further explore the relationship between phenology and climate and between climate and urbanization [71,72]. Moreover, the classification of urbanization intensity can be improved by incorporating the vegetation distribution and topography to reveal the relationship more accurately between urbanization and phenological changes.
Our results for the Dongting Lake basin shed new light on the key role of SOS advancement in lengthening the growing season. Significant extension of the growing season indicates a notable increase in the carbon sink effect of the Dongting Lake basin, with the advancement of the SOS the leading factor behind this increase, which is significant for assessing the regional carbon balance. We found that the sensitivity of SOS and EOS to urbanization will gradually weaken in the study area. Thus, the continued acceleration of urbanization in the study area is likely to slow the trend of earlier SOS and delayed EOS dates for vegetation in the Dongting Lake basin, which in turn will weaken the regional carbon sink effect. Moreover, urbanization exerts different effects on the climate sensitivity of vegetation phenology, not only through the promotion of the UHI effect, but also through the rain island effect and overall climate change. Temperature changes are only an indirect way in which the UHI effect affects vegetation phenology. The effects of heat islands on changes in urban atmospheric composition and variations in the ecosystem material cycle on phenology are also worthy of continued attention.
5. Conclusions
In this study, we evaluated the temporal and spatial patterns of vegetation photosynthetic phenology and its response to urbanization intensity in the Dongting Lake basin using SIF and nighttime light products. In the study area, the SOS was advanced by 0.7 days per year, the EOS was delayed by 0.24 days per year, and the LOS was extended by 0.94 days per year; these photosynthetic phenological changes were more significant in spring than in autumn. Urbanization promoted the advance of the SOS and the delay in the EOS in the study area, and ecosystems will absorb more carbon as a result of the extended LOS, by increasing the duration of photosynthesis. With increasing urbanization, the advance of the SOS firstly increased then decreased rapidly, whereas the delay in EOS tended to decrease continuously. Our study indicated that the SOS was predominantly influenced by the minimum temperature in the study area, whereas precipitation was the key climatic factor affecting EOS. Thus, urbanization in the study area can dramatically affect the climate sensitivity of vegetation photosynthesis by promoting an increase in the regional air temperature and precipitation, which in turn advances the SOS and delays the EOS. These findings provide a new perspective for exploring the effect of urbanization on vegetation photosynthetic phenology in tropical regions. This work also provides a useful reference for constructing subtropical vegetation phenology models and assessing the regional carbon balance.
Author Contributions
Formal analysis, Y.L. and M.S.; Investigation, P.L.; Methodology, P.L.; Software, P.L., Y.L. and M.S.; Writing—original draft, Y.L. and M.S.; Writing—review & editing, P.L., P.R., C.P., X.Z. and J.T. All authors have read and agreed to the published version of the manuscript.
Funding
This research was funded by the National Natural Science Foundation of China (41901117), Natural Science Foundation of Hunan Province, China (2020JJ5362), the Outstanding Youth Project of Hunan Provincial Education Department (18B001), and the Natural Sciences and Engineering Research Council of Canada (NSERC) Discover Grant.
Institutional Review Board Statement
Not applicable.
Informed Consent Statement
Not applicable.
Data Availability Statement
The global OCO-2-based solar-induced fluorescence (GOSIF) datasets are available at http://globalecology.unh.edu/data/GOSIF.html (accessed on 1 August 2021). The climate data can be accessed through website https://www.resdc.cn (accessed on 1 August 2021). The Nighttime light data can be downloaded from https://www.ngdc.noaa.gov/eog/dmsp/downloadV4composites.html (accessed on 1 August 2021). All the relevant data from this study are also available from the corresponding author upon request.
Conflicts of Interest
The authors declare no conflict of interest.
References
- Zhu, K.Z.; Wan, M.W. Phenology; Hunan Education Press: Changsha, China, 1999. [Google Scholar]
- Ge, Q.S.; Wang, H.J.; Rutishauser, T.; Dai, J.H. Phenological response to climate change in China: A meta-analysis. Glob. Chang. Biol. 2015, 21, 265–274. [Google Scholar] [CrossRef]
- Fu, Y.S.; Zhao, H.F.; Piao, S.L.; Peaucelle, M.; Peng, S.S.; Zhou, G.Y.; Ciais, P.; Huang, M.T.; Menzel, A.; Penuelas, J.; et al. Declining global warming effects on the phenology of spring leaf unfolding. Nature 2015, 526, 104–107. [Google Scholar] [CrossRef] [PubMed] [Green Version]
- Fu, Y.S.; Piao, S.L.; Zhou, X.C.; Geng, X.J.; Hao, F.H.; Vitasse, Y.; Janssens, I.A. Short photoperiod reduces the temperature sensitivity of leaf-out in saplings of Fagus sylvatica but not in horse chestnut. Glob. Chang. Biol. 2019, 25, 1696–1703. [Google Scholar] [CrossRef] [PubMed]
- Linderholm, H.W. Growing season changes in the last century. Agric. For. Meteorol. 2006, 137, 1–14. [Google Scholar] [CrossRef]
- Menzel, A.; Yuan, Y.; Matiu, M.; Sparks, T.; Scheifinger, H.; Gehrig, R.; Estrella, N. Climate change fingerprints in recent European plant phenology. Glob. Chang. Biol. 2020, 26, 2599–2612. [Google Scholar] [CrossRef] [Green Version]
- Piao, S.L.; Liu, Q.; Chen, A.P.; Janssens, I.A.; Fu, Y.S.; Dai, J.H.; Liu, L.L.; Lian, X.; Shen, M.G.; Zhu, X.L. Plant phenology and global climate change: Current progresses and challenges. Glob. Chang. Biol. 2019, 25, 1922–1940. [Google Scholar] [CrossRef]
- Richardson, A.D.; Keenan, T.F.; Migliavacca, M.; Ryu, Y.; Sonnentag, O.; Toomey, M. Climate change, phenology, and phenological control of vegetation feedbacks to the climate system. Agric. For. Meteorol. 2013, 169, 156–173. [Google Scholar] [CrossRef]
- Liu, X.T.; Zhou, L.; Shi, H.; Wang, S.Q.; Chi, Y.G. Phenological characteristics of temperate coniferous and broad-leaved mixed forests based on multiple remote sensing vegetation indices, chlorophyll fluorescence and CO2 flux data. Acta Ecol. Sin. 2018, 38, 3482–3494. [Google Scholar] [CrossRef]
- Wu, C.Y.; Wang, X.Y.; Wang, H.J.; Ciais, P.; Peñuelas, J.; Myneni, R.B.; Desai, A.R.; Gough, C.M.; Gonsamo, A.; Black, A.T.; et al. Contrasting responses of autumn-leaf senescence to daytime and night-time warming. Nat. Clim. Chang. 2018, 8, 1092–1096. [Google Scholar] [CrossRef] [Green Version]
- Li, P.; Liu, Z.L.; Zhou, X.L.; Xie, B.G.; Li, Z.W.; Luo, Y.P.; Zhu, Q.A.; Peng, C.H. Combined control of multiple extreme climate stressors on autumn vegetation phenology on the Tibetan Plateau under past and future climate change. Agric. For. Meteorol. 2021, 308–309. [Google Scholar] [CrossRef]
- Huang, W.L.; Zhang, Q.; Kong, D.D.; Gu, X.H.; Sun, P.; Hu, P. Response of vegetation phenology to drought in Inner Mongolia from 1982 to 2013. Acta Ecol. Sin. 2019, 39, 4953–4965. [Google Scholar] [CrossRef]
- Chen, M.X. Research progress and scientific issues in the field of urbanization. Geogr. Res. 2015, 34, 614–630. [Google Scholar] [CrossRef]
- Buyantuyev, A.; Wu, J. Urbanization diversifies land surface phenology in arid environments: Interactions among vegetation, climatic variation, and land use pattern in the Phoenix metropolitan region, USA. Landsc. Urban Plan. 2012, 105, 149–159. [Google Scholar] [CrossRef]
- Qiu, T.; Song, C.H.; Zhang, Y.L.; Liu, H.S.; Vose, J.M. Urbanization and climate change jointly shift land surface phenology in the northern mid-latitude large cities. Remote Sens. Environ. 2020, 236, 111477. [Google Scholar] [CrossRef]
- Li, D.; Stucky, B.J.; Deck, J.; Baiser, B.; Guralnick, R.P. The effect of urbanization on plant phenology depends on regional temperature. Nat. Ecol. Evol. 2019, 3, 1661–1667. [Google Scholar] [CrossRef]
- Wohlfahrt, G.; Tomelleri, E.; Hammerle, A. The urban imprint on plant phenology. Nat. Ecol. Evol. 2019, 3, 1668–1674. [Google Scholar] [CrossRef]
- Meng, L.; Mao, J.F.; Zhou, Y.Y.; Richardson, A.D.; Lee, X.; Thornton, P.E.; Ricciuto, D.M.; Li, X.C.; Dai, Y.J.; Shi, X.Y.; et al. Urban warming advances spring phenology but reduces the response of phenology to temperature in the conterminous United States. Proc. Natl. Acad. Sci. USA 2020, 117, 4228–4233. [Google Scholar] [CrossRef]
- Zhou, D.C.; Zhao, S.Q.; Zhang, L.X.; Liu, S.G. Remotely sensed assessment of urbanization effects on vegetation phenology in China’s 32 major cities. Remote Sens. Environ. 2016, 176, 272–281. [Google Scholar] [CrossRef] [Green Version]
- Bennie, J.; Davies, T.W.; Cruse, D.; Gaston, K.J.; Swenson, N. Ecological effects of artificial light at night on wild plants. J. Ecol. 2016, 104, 611–620. [Google Scholar] [CrossRef] [Green Version]
- Viera-Perez, M.; Hernandez-Calvento, L.; Hesp, P.A.; Santana-Del Pino, A. Effects of artificial light on flowering of foredune vegetation. Ecology 2019, 100, e02678. [Google Scholar] [CrossRef] [PubMed] [Green Version]
- Bennie, J.; Davies, T.W.; Cruse, D.; Bell, F.; Gaston, K.J.; James, J. Artificial light at night alters grassland vegetation species composition and phenology. J. Appl. Ecol. 2018, 55, 442–450. [Google Scholar] [CrossRef] [Green Version]
- Neil, K.; Wu, J. Effects of urbanization on plant flowering phenology: A review. Urban Ecosyst. 2006, 9, 243–257. [Google Scholar] [CrossRef]
- Ren, P.X.; Liu, Z.L.; Zhou, X.L.; Peng, C.H.; Xiao, J.F.; Wang, S.H.; Li, X.; Li, P. Strong controls of daily minimum temperature on the autumn photosynthetic phenology of subtropical vegetation in China. For. Ecosyst. 2021, 8, 1–12. [Google Scholar] [CrossRef]
- Jochner, S.; Menzel, A. Urban phenological studies—Past, present, future. Environ. Pollut. 2015, 203, 250–261. [Google Scholar] [CrossRef]
- Karkauskaite, P.; Tagesson, T.; Fensholt, R. Evaluation of the Plant Phenology Index (PPI), NDVI and EVI for start-of-season trend analysis of the northern hemisphere boreal zone. Remote Sens. 2017, 9, 485. [Google Scholar] [CrossRef] [Green Version]
- Zhang, Y.; Commane, R.; Zhou, S.; Williams, A.P.; Gentine, P. Light limitation regulates the response of autumn terrestrial carbon uptake to warming. Nat. Clim. Chang. 2020, 10, 739–743. [Google Scholar] [CrossRef]
- Jeong, S.J.; Schimel, D.; Frankenberg, C.; Drewry, D.T.; Fisher, J.B.; Verma, M.; Berry, J.A.; Lee, J.-E.; Joiner, J. Application of satellite solar-induced chlorophyll fluorescence to understanding large-scale variations in vegetation phenology and function over northern high latitude forests. Remote Sens. Environ. 2017, 190, 178–187. [Google Scholar] [CrossRef]
- Wang, S.H.; Ju, W.M.; Penuelas, J.; Cescatti, A.; Zhou, Y.S.; Fu, Y.S.; Huete, A.; Liu, M.; Zhang, Y.G. Urban-rural gradients reveal joint control of elevated CO2 and temperature on extended photosynthetic seasons. Nat. Ecol. Evol. 2019, 3, 1076–1085. [Google Scholar] [CrossRef] [PubMed] [Green Version]
- Wang, X.; Dannenberg, M.P.; Yan, D.; Jones, M.O.; Kimball, J.S.; Moore, D.J.P.; Leeuwen, W.J.D.; Didan, K.; Smith, W.K. Globally consistent patterns of asynchrony in vegetation phenology derived from optical, microwave, and fluorescence satellite data. J. Geophys. Res. Biogeosciences 2020, 125, e2020JG005732. [Google Scholar] [CrossRef]
- Walther, S.; Voigt, M.; Thum, T.; Gonsamo, A.; Zhang, Y.; Kohler, P.; Jung, M.; Varlagin, A.; Guanter, L. Satellite chlorophyll fluorescence measurements reveal large-scale decoupling of photosynthesis and greenness dynamics in boreal evergreen forests. Glob. Chang. Biol. 2016, 22, 2979–2996. [Google Scholar] [CrossRef] [Green Version]
- Hu, W.M.; Wang, Z.C.; Li, C.H.; Zhao, J.; Li, Y. Assessment and prediction of land ecological environment quality change based on remote sensing-a case study of the Dongting lake area in China. IOP Conf. Ser. Earth Environ. Sci. 2018, 121, 032053. [Google Scholar] [CrossRef]
- Li, X.; Xiao, J.F. Global climatic controls on interannual variability of ecosystem productivity: Similarities and differences inferred from solar-induced chlorophyll fluorescence and enhanced vegetation index. Agric. For. Meteorol. 2020, 288, 108018. [Google Scholar] [CrossRef]
- Li, X.; Xiao, J.F. A global, 0.05-degree product of solar-induced chlorophyll fluorescence derived from OCO-2, MODIS, and reanalysis data. Remote Sens. 2019, 11, 517. [Google Scholar] [CrossRef] [Green Version]
- Li, X.; Xiao, J.F. Mapping photosynthesis solely from solar-induced chlorophyll fluorescence: A global, fine-resolution dataset of gross primary production derived from OCO-2. Remote Sens. 2019, 11, 2563. [Google Scholar] [CrossRef] [Green Version]
- Zhou, Y.Y.; Smith, S.J.; Zhao, K.; Imhoff, M.; Thomson, A.; Bond-Lamberty, B.; Asrar, G.R.; Zhang, X.S.; He, C.Y.; Elvidge, C.D. A global map of urban extent from nightlights. Environ. Res. Lett. 2015, 10. [Google Scholar] [CrossRef]
- Zhao, M.; Zhou, Y.Y.; Li, X.C.; Zhou, C.H.; Cheng, W.M.; Li, M.C.; Huang, K. Building a series of consistent night-time light data (1992–2018) in Southeast Asia by integrating DMSP-OLS and NPP-VIIRS. IEEE Trans. Geosci. Remote. Sens. 2020, 58, 1843–1856. [Google Scholar] [CrossRef]
- Xu, W.T.; Wu, B.F.; Yan, C.Z.; Huang, H.P. China land cover 2000 using SPOT VGT S10 data. J. Remote. Sens. 2005, 9, 204–214. [Google Scholar] [CrossRef]
- White, M.A.; de Beurs, K.M.; Didan, K.; Inouye, D.W.; Richardson, A.D.; Jensen, O.P.; O’Keefe, J.; Zhang, G.; Nemani, R.R.; van Leeuwen, W.J.D.; et al. Intercomparison, interpretation, and assessment of spring phenology in North America estimated from remote sensing for 1982–2006. Glob. Chang. Biol. 2009, 15, 2335–2359. [Google Scholar] [CrossRef]
- Zhou, L.; Chi, Y.G.; Liu, X.T.; Dai, X.Q.; Yang, F.T. Land surface phenology tracked by remotely sensed sun-induced chlorophyll fluorescence in subtropical evergreen coniferous forests. Acta Ecol. Sin. 2020, 40, 4114–4125. [Google Scholar] [CrossRef]
- Li, P.; Peng, C.H.; Zhang, J.; Wang, M.; Zhang, J.J.; Ding, J.H.; Zhou, X.L.; Zhu, Q. Change in autumn vegetation phenology and the climate controls from 1982 to 2012 on the Qinghai-Tibet Plateau. Front. Plant Sci. 2019, 10, 1677. [Google Scholar] [CrossRef] [PubMed] [Green Version]
- Li, X.X.; Fu, Y.S.; Chen, S.Z.; Xiao, J.F.; Yin, G.D.; Li, X.; Zhang, X.S.; Geng, X.J.; Wu, Z.F.; Zhou, X.C.; et al. Increasing importance of precipitation in spring phenology with decreasing latitudes in subtropical forest area in China. Agric. For. Meteorol. 2021, 304, 108427. [Google Scholar] [CrossRef]
- Wu, J.S.; Liu, H.; Peng, J.; Ma, L. Hierarchical structure and spatial pattern of China’s urban system: Evidence from DMSP/OLS nightlight data. Acta Geogr. Sin. 2014, 69, 759–770. [Google Scholar] [CrossRef]
- Wang, X.H.; Piao, S.L.; Xu, X.T.; Ciais, P.; MacBean, N.; Myneni, R.B.; Li, L. Has the advancing onset of spring vegetation green-up slowed down or changed abruptly over the last three decades? Glob. Ecol. Biogeogr. 2015, 24, 621–631. [Google Scholar] [CrossRef]
- Shen, X.J.; Liu, B.H.; Henderson, M.; Wang, L.; Wu, Z.F.; Wu, H.T.; Jiang, M.; Lu, X.G. Asymmetric effects of daytime and nighttime warming on spring phenology in the temperate grasslands of China. Agric. For. Meteorol. 2018, 259, 240–249. [Google Scholar] [CrossRef]
- Zhu, W.Q.; Tian, H.Q.; Xu, X.F.; Pan, Y.Z.; Chen, G.S.; Lin, W.P. Extension of the growing season due to delayed autumn over mid and high latitudes in North America during 1982–2006. Glob. Ecol. Biogeogr. 2012, 21, 260–271. [Google Scholar] [CrossRef]
- Liu, Q.; Fu, Y.S.; Zeng, Z.Z.; Huang, M.T.; Li, X.R.; Piao, S.L. Temperature, precipitation, and insolation effects on autumn vegetation phenology in temperate China. Glob. Chang. Biol. 2016, 22, 644–655. [Google Scholar] [CrossRef] [PubMed]
- Richardson, A.D.; Black, T.A.; Ciais, P.; Delbart, N.; Friedl, M.A.; Gobron, N.; Hollinger, D.Y.; Kutsch, W.L.; Longdoz, B.; Luyssaert, S.; et al. Influence of spring and autumn phenological transitions on forest ecosystem productivity. Philos. Trans. R. Soc. Lond. B Biol. Sci. 2010, 365, 3227–3246. [Google Scholar] [CrossRef] [Green Version]
- Keenan, T.F.; Gray, J.; Friedl, M.A.; Toomey, M.; Bohrer, G.; Hollinger, D.Y.; Munger, J.W.; O’Keefe, J.; Schmid, H.P.; Wing, I.S.; et al. Net carbon uptake has increased through warming-induced changes in temperate forest phenology. Nat. Clim. Chang. 2014, 4, 598–604. [Google Scholar] [CrossRef]
- Piao, S.L.; Ciais, P.; Friedlingstein, P.; Peylin, P.; Reichstein, M.; Luyssaert, S.; Margolis, H.; Fang, J.Y.; Barr, A.; Chen, A.P.; et al. Net carbon dioxide losses of northern ecosystems in response to autumn warming. Nature 2008, 451, 49–52. [Google Scholar] [CrossRef]
- Li, X.C.; Zhou, Y.Y.; Asrar, G.R.; Mao, J.F.; Li, X.M.; Li, W.Y. Response of vegetation phenology to urbanization in the conterminous United States. Glob. Chang. Biol. 2017, 23, 2818–2830. [Google Scholar] [CrossRef]
- Tai, X.L.; Epstein, H.E.; Li, B. Elevation and climate effects on vegetation greenness in an arid mountain-basin system of Central Asia. Remote Sens. 2020, 12, 1665. [Google Scholar] [CrossRef]
- Jonsson, S.; Segall, P.; Pedersen, R.; Bjornsson, G. Post-earthquake ground movements correlated to pore-pressure transients. Nature 2003, 424, 179–183. [Google Scholar] [CrossRef] [PubMed]
- Zohner, C.M. Phenology and the city. Nat. Ecol. Evol. 2019, 3, 1618–1619. [Google Scholar] [CrossRef]
- Zhao, J.; Chen, S.; Jiang, B.; Ren, Y.; Wang, H.; Vause, J.; Yu, H. Temporal trend of green space coverage in China and its relationship with urbanization over the last two decades. Sci. Total Environ. 2013, 442, 455–465. [Google Scholar] [CrossRef]
- Oliveira, S.; Andrade, H.; Vaz, T. The cooling effect of green spaces as a contribution to the mitigation of urban heat: A case study in Lisbon. Build. Environ. 2011, 46, 2186–2194. [Google Scholar] [CrossRef]
- Huang, M.; Cui, P.; He, X. Study of the cooling effects of urban green space in Harbin in terms of reducing the heat island effect. Sustainability 2018, 10, 1101. [Google Scholar] [CrossRef] [Green Version]
- Hu, Z.L.; Dai, H.; Hou, F.; LI, E.Z. Spatio-temporal change of urban-rural vegetation phenology and its response to land surface temperature in Northeast China. Acta Ecol. Sin. 2020, 40, 4137–4145. [Google Scholar] [CrossRef]
- Jia, W.X.; Zhao, S.Q.; Zhang, X.Y.; Liu, S.G.; Henebry, G.; Liu, L.L. Urbanization imprint on land surface phenology: The urban–rural gradient analysis for Chinese cities. Glob. Chang. Biol. 2021, 27, 2895–2904. [Google Scholar] [CrossRef] [PubMed]
- Han, G.F.; Xu, J.H. Land surface phenology and land surface temperature changes along an urban-rural gradient in Yangtze River Delta, China. Environ. Manag. 2013, 52, 234–249. [Google Scholar] [CrossRef] [PubMed]
- Decina, S.M.; Templer, P.H.; Hutyra, L.R. Atmospheric inputs of nitrogen, carbon, and phosphorus across an Urban Area: Unaccounted fluxes and canopy influences. Earths Future 2018, 6, 134–148. [Google Scholar] [CrossRef] [Green Version]
- Do, F.C.; Goudiaby, V.A.; Gimenez, O.; Diagne, A.L.; Diouf, M.; Rocheteau, A.; Akpo, L.E. Environmental influence on canopy phenology in the dry tropics. For. Ecol. Manag. 2005, 215, 319–328. [Google Scholar] [CrossRef]
- Lian, X.H.; Jiao, L.M.; Zhong, J.; Jia, Q.Q.; Liu, J.F.; Liu, Z.J. Artificial light pollution inhibits plant phenology advance induced by climate warming. Environ. Pollut. 2021, 291, 118110. [Google Scholar] [CrossRef]
- Peng, J.D.; Zhao, H.; Chen, X.C. Effect of urbanization process on local climate in Changsha City. Meteorol. Environ. Sci. 2017, 40, 42–48. [Google Scholar] [CrossRef]
- Peng, L.L.; Luo, B.L.; Sun, J.Q. Variation of extreme precipitation during the urbanization of Changsha-Zhuzhou-Xiangtan urban agglomeration. Torrential Rain Disasters 2015, 34, 191–196. [Google Scholar] [CrossRef]
- Xiao, F.; Zhu, B.; Zhu, T. Inconsistent urbanization effects on summer precipitation over the typical climate regions in central and eastern China. Theor. Appl. Climatol. 2020, 143, 73–85. [Google Scholar] [CrossRef]
- Xin, Q.C.; Li, J.; Li, Z.M.; Li, Y.M.; Zhou, X.W. Evaluations and comparisons of rule-based and machine-learning-based methods to retrieve satellite-based vegetation phenology using MODIS and USA National Phenology Network data. Int. J. Appl. Earth Obs. Geoinf. 2020, 93. [Google Scholar] [CrossRef]
- Izar, A.; Noelia, O.; Marco, Q.; Igor, G.O.; Diego, G.; Susanna, M. Comparison of climate reanalysis and remote-sensing data for predicting olive phenology through machine-learning methods. Remote Sens. 2021, 13, 1224. [Google Scholar] [CrossRef]
- Guo, Y.H.; Fu, Y.S.; Hao, F.H.; Zhang, X.; Wu, W.X.; Jin, X.L.; Robin Bryant, C.; Senthilnath, J. Integrated phenology and climate in rice yields prediction using machine learning methods. Ecol. Indic. 2021, 120, 106935. [Google Scholar] [CrossRef]
- Guo, Y.H.; Yin, G.D.; Sun, H.Y.; Wang, H.X.; Chen, S.Z.; Senthilnath, J.; Wang, J.Z.; Fu, Y.S. Scaling effects on chlorophyll content estimations with RGB camera mounted on a UAV platform using machine-learning methods. Sensors 2020, 20, 5130. [Google Scholar] [CrossRef]
- Pope, K.S.; Dose, V.; Da Silva, D.; Brown, P.H.; Leslie, C.A.; Dejong, T.M. Detecting nonlinear response of spring phenology to climate change by Bayesian analysis. Glob. Chang. Biol. 2013, 19, 1518–1525. [Google Scholar] [CrossRef]
- Shen, M.G.; Piao, S.L.; Cong, N.; Zhang, G.X.; Jassens, I.A. Precipitation impacts on vegetation spring phenology on the Tibetan Plateau. Glob. Chang. Biol. 2015, 21, 3647–3656. [Google Scholar] [CrossRef] [PubMed] [Green Version]
Publisher’s Note: MDPI stays neutral with regard to jurisdictional claims in published maps and institutional affiliations. |
© 2021 by the authors. Licensee MDPI, Basel, Switzerland. This article is an open access article distributed under the terms and conditions of the Creative Commons Attribution (CC BY) license (https://creativecommons.org/licenses/by/4.0/).