Abstract
Synthetic aperture radar (SAR) is an important means to observe the sea surface wind field. Sentinel-1 and GF-3 are located on orbit SAR satellites, but the SAR data quality of these two satellites has not been evaluated and compared at present. This paper mainly studies the data quality of Sentinel-1 and GF-3 SAR satellites used in wind field inversion. In this study, Sentinel-1 SAR data and GF-3 SAR data located in Malacca Strait, Hormuz Strait and the east and west coasts of the United States are selected to invert wind fields using the C-band model 5.N (CMOD5.N). Compared with reanalysis data called ERA5, the root mean squared error (RMSE) of the Sentinel-1 inversion results is 1.66 m/s, 1.37 m/s and 1.49 m/s in three intervals of 0~5 m/s, 5~10 m/s and above 10 m/s, respectively; the RMSE of GF-3 inversion results is 1.63 m/s, 1.45 m/s and 1.87 m/s in three intervals of 0~5 m/s, 5~10 m/s and above 10 m/s, respectively. Based on the data of Sentinel-1 and GF-3 located on the east and west coasts of the United States, CMOD5.N is used to invert the wind field. Compared with the buoy data, the RMSE of the Sentinel-1 inversion results is 1.20 m/s, and the RMSE of the GF-3 inversion results is 1.48 m/s. The results show that both Sentinel-1 SAR data and GF-3 SAR data are suitable for wind field inversion, but the wind field inverted by Sentinel-1 SAR data is slightly better than GF-3 SAR data. When applied to wind field inversion, the data quality of Sentinel-1 SAR is slightly better than the data quality of GF-3 SAR. The SAR data quality of GF-3 has achieved a world-leading level.
1. Introduction
The sea surface wind field is one of the important ocean wave dynamic processes, and has a very significant impact on the generation of ocean waves and the movement of ocean currents [1], as well as a very significant physical significance in the field of marine meteorology. In addition, the observation of the sea surface wind field is of great significance to maritime navigation, military defense, and other aspects. Therefore, the observation of the sea surface wind field is extremely significant.
The observation of the sea surface wind field is originally conducted by using meteorological stations, anemometer towers, buoys, ships and other on-site observation methods. These methods can obtain accurate sea surface wind field information, but there are some problems: (1) The range of information obtained by meteorological stations, anemometer towers, buoys and other methods is very limited. Generally, only offshore wind field information can be obtained. These methods cannot obtain large-area wind field information; (2) The maintenance cost of equipment such as anemometer towers and buoys is high, and widespread use of equipment is difficult; (3) Ship observation takes a long time and the data obtained are only distributed on the navigation track. Therefore, traditional methods such as meteorological stations, anemometer towers, and buoys cannot meet the needs of a large-scale real-time observation of the sea surface wind field [2].
With the development of satellite remote sensing observation technology, it is possible to observe the wind field in a large area. Satellite remote sensing technology mainly includes a microwave scatterometer, radiometer and synthetic aperture radar. The scatterometer, altimeter and radiometer are first applied to the observation of the sea surface wind field, which can obtain a large area of wind field data, though their resolution is not high. Synthetic aperture radar (SAR) has a high resolution, which is not affected by light and weather conditions, and can realize all day, all-weather observation. In June 1978, the United States launched the first integrated ocean power satellite Seasat-A, which was equipped with an altimeter, a scatterometer and a synthetic aperture radar, and acquired a lot of accurate and effective information. In view of the great success of the US SAR satellite launch, the European Space Agency (ESA), the German Aerospace Center, and the Canadian Space Agency also launched remote sensing satellites equipped with synthetic aperture radars ERS-1, ERS-2, Sentinel-1, TerraSAR-X, RADARSAT-1, and RADARSAT-2, etc. China also launched the C-band synthetic aperture radar satellite GF-3. The use of a synthetic aperture radar to observe the sea surface wind field has now become the most important method.
The sea surface wind field inversion using a synthetic aperture radar is generally achieved using geophysical model functions (GMF). The geophysical model function is generally used for the sea surface wind field inversion of VV (vertical transmit and vertical receive) polarization SAR data. The most commonly used GMFs include: CMOD4 [3], CMOD-IFR2 [4], CMOD5 [5], and CMOD5.N [6]. In 1997, Stoffelen et al. [3] developed the CMOD4 function based on the launched ERS satellite scatterometer data and the European Centre for Medium-range Weather Forecasts (ECMWF) numerical simulation data. In 1998, Quilfen et al. [4] developed the CMOD-IFR2 function based on the US National Oceanic and Atmospheric Administration (NOAA) buoy data, ERS satellite scatterometer data and ECMWF numerical simulation data. Addressing the problem of low wind speed in CMOD4 and high wind speeds (greater than 25 m/s) in CMOD-IFR2 [7,8], Hersbach et al. (2007) [5] improved the CMOD4 function and developed the CMOD5 function on the basis of this. In 2010, Hersbach [6] adjusted the CMOD5 parameters based on ECMWF data under neutral atmospheric conditions and developed the CMOD5.N function.
For the wind field inversion of HH (horizontal transmit and horizontal receive) polarization SAR data, the polarization ratio model was usually used to convert the HH polarization backscatter coefficient to the VV polarization backscatter coefficient, and then the CMOD series of functions were used to perform the wind field inversion. In 1998, Thompson et al. [9] developed a polarization ratio model based on the HH polarization data of RADARSAT-1, as follows:
where PR represents the polarization ratio; represents the radar incident angle; and is an empirical parameter, ranging from 0 to 2. When = 0, it is the Bragg model; when = 0.6, it is called the Thompson model [9]; and when = 1, it is called the Kirchhoff model. In 2005, Mouche et al. [10] proposed a new polarization ratio model based on the C-band airborne real-aperture radar, which only depends on the radar incident angle, as shown below:
where PR is the polarization ratio; is the radar incidence angle; and , and are the calibration parameters of the model.
Some scholars have found that the co-polarization backscatter coefficient will show the saturation effect under high wind speed conditions, while the cross-polarization backscatter coefficient will not show the saturation effect under high wind speed conditions [11]. In 2012, Zhang and Perrie [12] developed a cross-polarization inversion model based on the RADARSAT-2 full-polarization data and named it C-2PO. In 2017, Zhang et al. [13] found that the cross-polarization backscatter coefficient is related to the radar incidence angle, and proposed the C-3PO model on the basis of C-2PO.
The Sentinel-1 satellite launched by ESA and the GF-3 satellite launched by China are SAR imaging satellites operating in orbit and are widely used in marine research. The research aim of this paper is to use the SAR data of Sentinel-1 and GF-3 satellites to perform wind field inversion using CMOD5.N. The inverted wind speed is compared with the reanalysis data ERA5 and buoy data to compare the advantages and disadvantages of the inverted wind speed of the two satellites, and to compare the quality of Sentinel-1 SAR data and GF-3 SAR data.
The paper is organized as follows. We describe our materials and methods in Section 2, including imaging area, SAR data reanalysis data, buoy data, spatio-temporal matching and wind field inversion method. In Section 3, we present our results and discussion. The conclusions are provided in Section 4.
2. Materials and Methods
This chapter mainly introduces the imaging area, Sentinel-1 SAR data, GF-3 SAR data, reanalysis data, buoy data and the methods used in the research.
2.1. Materials
2.1.1. SAR Imaging Area
Based on the China National Key R&D Program, the selected SAR imaging areas included: the Malacca Strait, the Hormuz Strait, and the east and west coasts of the United States. The Malacca Strait and the Hormuz Strait are important strategic passages for our country. The geographical location is unique, and the selection of this area is of great significance. Globally important routes are distributed around the east and west coasts of the United States, and there are many nearby buoy observation points, making it easy to obtain real wind speed information. The SAR imaging distribution is shown in Figure 1, Figure 2, Figure 3. A total of 95 scenes of Sentinel-1 data and 57 scenes of GF-3 data are selected.
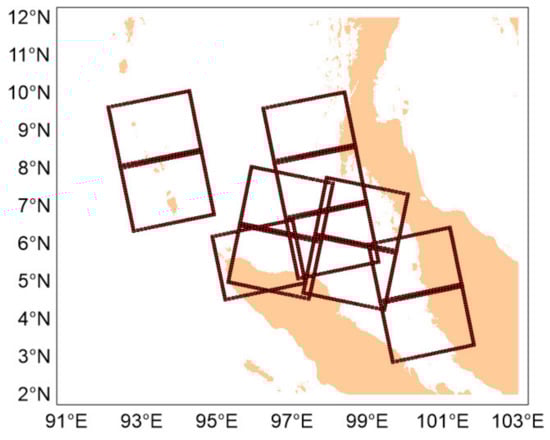
Figure 1.
SAR distribution in the Malacca Strait.
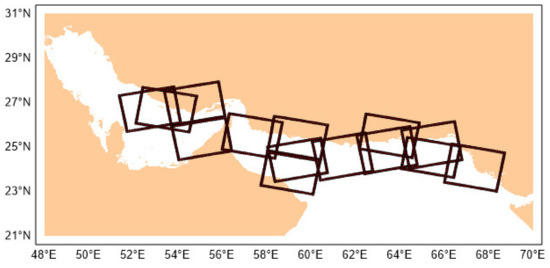
Figure 2.
SAR distribution in the Hormuz Strait.
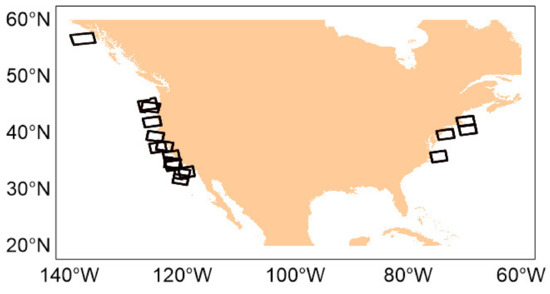
Figure 3.
SAR distribution on the east and west coasts of the United States.
2.1.2. Sentinel-1 Data
Sentinel-1 now has two satellites in orbit. Sentinel-1A was launched in April 2014 and Sentinel-1B was launched in April 2016. The Sentinel-1 satellite works in the C-band, and has a 12-day revisit period with four working modes: Stripmap (SM), Interferometric Wide swath (IW), Extra Wide swath (EW) and Wave mode (WV). The incident angle of the four modes is in the range from 15°–50°, the resolution can reach up to 5 m, and the swath width can reach 400 km.
Sentinel 1 provides three levels of data: Level-0, Level-1, and Level-2. Level-0 data is raw SAR data, which is the basis of other products. Level-1 data is for most users, including Single Look Complex (SLC) products and Ground Range Detected (GRD) products. SLC can obtain phase and amplitude information, and GRD has multi-view intensity data. Level-2 is a variety of data products, including Ocean Wind field (OWI), Ocean Swell spectra (OSW), Surface Radial Velocity (RVL). The SLC products in IW mode have a width of 250 km and a resolution of 2.7 m × 22 m to 3.5 m × 22 m (range × azimuth) [14]. In this study, Sentinel-1 data of VV polarization SLC product data in IW mode is used to provide a data source for wind field inversion.
2.1.3. GF-3 Data
GF-3 satellite is China’s first C-band multi polarization SAR imaging satellite with a resolution of 1 m, which was launched in August 2016. GF-3 satellite is an important part of China’s “Tianyan project” with an orbit height of 755 km and a revisit period of 26 days. GF-3 has 12 imaging modes. In addition to 6 stripmap modes and 2 scanSAR modes, it also has global observation imaging, wave mode, sliding spotlight and extended incident angle modes, with a resolution of up to 1 m. The swath width can reach 650 km, and the polarization modes are diverse, including single polarization, dual polarization, and full polarization.
GF-3 provides four standard products of L0, L1, L2, L3 and one industry application products of L4. Among them, SLC products of L1 are commonly used by users. The SLC products in stripmap mode have a maximum width of 100 km and a resolution of 3 m to 25 m (azimuth) [15]. In this study, GF-3 data of VV polarization SLC product data in stripmap mode are used to provide a data source for wind field inversion.
2.1.4. Reanalysis Data
ERA5 data are reanalysis data provided by European Centre for Medium-range Weather Forecasts (ECMWF), which covers the whole world. ERA5 provides reanalysis data of the global atmosphere since 1979, including wind speed data at 10 m above the sea surface, wind direction data at 10 m above the sea surface, mean wave period data, and significant wave height data, etc. ERA5 data provides hourly data (0:00 to 23:00), with a maximum spatial resolution of 0.125° × 0.125°. In this study, ERA5 data corresponding to the SAR observation area and matching time are selected. The time window for matching ERA5 data with SAR data is 1 h. The matching spatial window by bilinear interpolation is 12.5 km. The wind speed data at 10 m above the sea surface are selected as the wind speed verification data, and the wind direction data at 10 m above the sea surface are used as the external input wind direction.
2.1.5. Buoy Data
The buoy is an important means for obtaining ocean information parameters, and the various data it obtains are considered to be the most accurate data. The buoy data can be regarded as real data, which can be used for wind speed verification. This paper uses buoy data from the National Data Buoy Center (NDBC) of the National Oceanic and Atmospheric Administration (NOAA). NDBC buoys are mainly distributed on the east and west coasts of the United States, as shown in Figure 4. The time resolution of the wind speed data of the NDBC buoy is 1 h. This paper selects NDBC buoys around the east and west coasts of the United States, and their wind speed data are used as real data for wind speed verification.
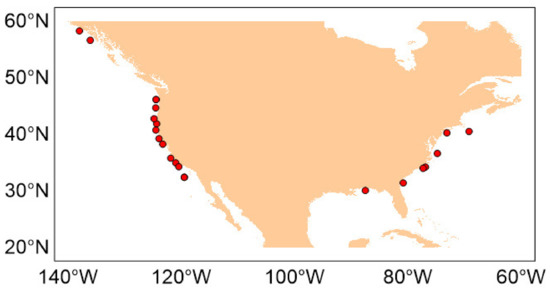
Figure 4.
NDBC buoy distribution.
Since the NDBC buoy provides wind speed data at 5 m above the sea surface [14], the wind speed inverted by the CMOD5.N function used in this study refers to the wind speed at 10 m above the sea surface. The wind speed provided by the NDBC buoy needs to be converted. The conversion formula is as follows [16]:
where represents the wind speed at the height of meters above the sea surface; represents the wind speed at the height of meters above the sea surface; and represents the length of the roughness.
2.2. Methods
2.2.1. Spatio-Temporal Matching
Spatio-temporal matching is the first step in SAR wind field inversion. Downloaded ERA5 data corresponds to SAR imaging area and imaging time, including wind speed and wind direction at 10 m above the sea surface. First, time matching is performed and the ERA5 data of the hour that are closest to the imaging time of the SAR data are selected, considering that the ERA5 data and the SAR data at this time point are at the same time node. Then, the longitude and latitude of SAR data are spatially matched with the longitude and latitude of ERA5 data, and the wind speed and direction corresponding to the longitude and latitude of SAR data are obtained by bilinear interpolation.
2.2.2. SAR Wind Field Inversion Method
The method used in the SAR wind field inversion in this study is CMOD5.N, which describes the relationship between the VV polarization backscatter coefficient and the azimuth angle of radar antenna, the radar incidence angle, and the wind speed and direction at 10 m above the sea surface. The expression is as follows [6]:
where is the backscatter coefficient of SAR VV polarization; , , are functions related to wind speed and incident angle; and φ is the relative wind direction, that is, the angle between the reference wind direction (the wind direction at 10 m above the sea surface of the ERA5 data) and the radar antenna azimuth angle.
3. Results and Discussion
3.1. Comparison of Inverted Wind Field and ERA5 Data
This study uses SAR data with imaging areas located in the Hormuz Strait, Malacca Strait, and the east and west coasts of the United States. Sentinel-1 SAR data have 95 scenes, and GF-3 SAR data have 57 scenes. The wind speed provided by ERA5 is divided into three intervals of 0~5 m/s, 5~10 m/s, and above 10 m/s for comparison. The root mean squared error (RMSE) and the scatter index (SI) are used for evaluation. The advantages and disadvantages of the wind field inverted by Sentinel-1 SAR data and GF-3 SAR data under different wind speeds are compared to evaluate the quality of the two satellites. The RMSE and the SI are defined as follows:
where represents the wind speed inverted by SAR; represents the reference wind speed, i.e., ERA5 wind speed; and and represent the average value of all and .
In this study, the backscatter coefficient of each scene is divided into 25 × 25 blocks, and each block represents a sub image. The backscatter coefficient of each sub image takes the average value as the backscattering coefficient of the sub image. The central latitude, longitude and incident angle of each sub image are used as the latitude, longitude and incident angle of the sub image. Each sub image is spatio-temporal matched with ERA5 data. The wind direction of ERA5 is used as input, and CMOD5. N is used for wind field inversion. The wind speed, incident angle and relative wind direction are input into CMOD5.N, the wind speed is traversed from 0 to 30 m/s at an interval of 1 m/s, and a set of backscatter coefficients are obtained. The wind speed corresponding to the backscatter coefficient closest to the backscatter coefficient of the sub image is the inverted wind speed. One scene of SAR data can be inverted to obtain 25 × 25 wind speeds, and the inverted wind speed is obtained after removing invalid data. The inverted wind speed is compared with the matched ERA5 wind speed, the RMSE and the SI are calculated, and the quality of Sentinel-1 SAR data and GF-3 SAR data applied to wind field inversion are compared.
3.1.1. Comparison of Inversion Results When Wind Speed of 0~5 m/s
When the wind speed of ERA5 is 0~5 m/s, the comparison result of the inversion wind speed and ECMWF data is shown in Figure 5.
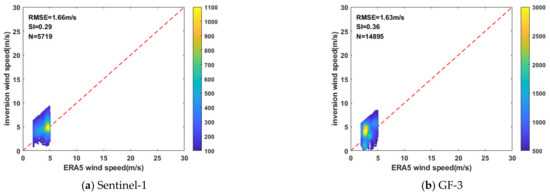
Figure 5.
SAR data inversion results of Sentinel-1 and GF-3 when the wind speed is 0~5 m/s.
When the wind speed of ERA5 is 0~5 m/s, it can be seen from the above figure that compared with ECMWF data, the RMSE of Sentinel-1 SAR data is 1.66 m/s, and the SI is 0.29; the RMSE of GF-3 SAR data is 1.63 m/s, and the SI is 0.36.
When the wind speed of ERA5 is 0~5 m/s, the wind field inversion results of GF-3 SAR data are slightly better than the inversion results of Sentinel-1 SAR data, and the wind field inversion accuracy of Sentinel-1 SAR data and GF-3 SAR data meet the recognized index requirements, that is, the RMSE is less than 2 m/s. When the wind speed is in the range of 0~5 m/s, the RMSE of the two satellite inversions is large, and the inversion effect is poor. The possible reason for this is that when the wind speed is in the range of 0~5 m/s, the wind speed is low, the sea surface roughness is small, and the backscatter coefficient is not very accurate.
3.1.2. Comparison of Inversion Results When Wind Speed of 5~10 m/s
When the wind speed of ERA5 is 5~10 m/s, the comparison result of the inversion wind speed and ECMWF data is shown in Figure 6.
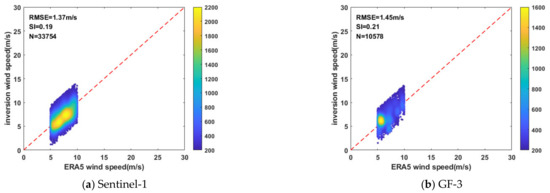
Figure 6.
SAR data inversion results of Sentinel-1 and GF-3 when the wind speed is 5~10 m/s.
When the wind speed of ERA5 is 5~10 m/s, it can be seen from the above figure that, compared with ECMWF data, the RMSE of Sentinel-1 SAR data is 1.37 m/s, and the SI is 0.19; the RMSE of GF-3 SAR data is 1.45 m/s, and the SI is 0.21.
It can be seen that when the wind speed of ERA5 is 5~10 m/s, the wind field inversion result of Sentinel-1 SAR data is slightly better than the inversion results of GF-3 SAR data. The wind field inversion accuracy of Sentinel-1 SAR data and GF-3 SAR data meets the recognized index requirements, that is, the RMSE is less than 2 m/s.
3.1.3. Comparison of Inversion Results When Wind Speed above 10 m/s
When the wind speed of ERA5 is above 10 m/s, the comparison result of the inversion wind speed and ECMWF data is shown in Figure 7.
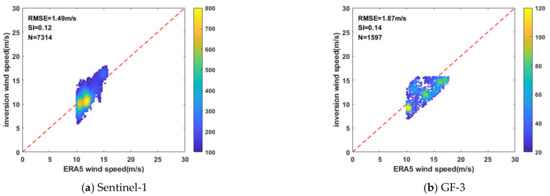
Figure 7.
SAR data inversion results of Sentinel-1 and GF-3 when the wind speed is above 10 m/s.
When the wind speed of ERA5 is above 10 m/s, it can be seen from the above figure that, compared with ECMWF data, the RMSE of Sentinel-1 SAR data is 1.49 m/s, and the SI is 0.12; the RMSE of GF-3 SAR data is 1.87 m/s, and the SI is 0.14.
When the wind speed of ERA5 is above 10 m/s, the wind field inversion results of Sentinel-1 SAR data are better than the inversion results of GF-3 SAR data, and the wind field inversion accuracy of Sentinel-1 SAR data and GF-3 SAR data meets the recognized index requirements, that is, the RMSE is less than 2 m/s. The RMSE of the inversion results of GF-3 SAR data is large, which may be due to the small number of GF-3 SAR data with high wind speed.
In summary, in the three wind speed ranges of 0~5 m/s, 5~10 m/s and above 10 m/s, the RMSE of Sentinel-1 SAR data is 1.66 m/s, 1.37 m/s, and 1.49 m/s, respectively, and the SI of Sentinel-1 is 0.29, 0.19 and 0.12 respectively; the RMSE of GF-3 SAR data is 1.63 m/s, 1.45 m/s, and 1.87 m/s, respectively, and the SI of GF-3 is 0.36, 0.21 and 0.14, respectively. The RMSE of the inversion results of Sentinel-1 SAR data and GF-3 SAR data in three wind speed ranges is less than 2 m/s, and the inversion accuracy is high. In general, under different wind speed conditions, the wind field inversion results of Sentinel-1 SAR data are slightly better than the wind field inversion results of GF-3 SAR data. When the two satellites are applied to wind field inversion, the SAR data quality of the Sentinel-1 satellite is slightly better than the SAR data quality of the GF-3 satellite.
3.2. Comparison of Inverted Wind Field and Buoy Data
Buoy observation is recognized as the most accurate observation method, and the buoy data are measured in reliable and accurate on-site data. In this study, we use ERA5 wind direction data matched with SAR data as the external input wind direction, and use CMOD5.N to invert the wind speed of Sentinel-1 and GF-3 SAR data, and compare the inverted wind speed with buoy data to further verify the quality of Sentinel-1 and GF-3 SAR data.
This study uses SAR data with imaging areas located near the east and west coasts of the United States, and uses RMSE for evaluation. A total of 20 scenes of Sentinel-1 SAR data and 10 scenes of GF-3 SAR data are used for wind speed inversion. The results of wind speed inversion and buoy data comparison are shown in Figure 8.
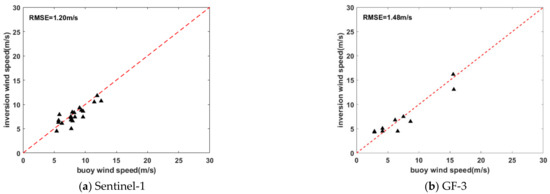
Figure 8.
Comparison of inversion results with buoy data.
As can be seen from Figure 8, compared with the buoy data, the RMSE of Sentinel-1 SAR data is 1.20 m/s, and the RMSE of GF-3 SAR data is 1.48 m/s. The RMSE of wind field inversion results from Sentinel-1 and GF-3 SAR data is less than 2 m/s, and the inversion accuracy is high. The inversion results of Sentinel-1 SAR data are slightly better than the inversion results of GF-3 SAR data.
3.3. Quality Evaluation
The RMSE of Sentinel-1 SAR data in the three wind speed ranges of 0~5 m/s, 5~10 m/s, and above 10 m/s is less than 2 m/s. The RMSE of 0~5 m/s is the largest, at 1.66 m/s; the RMSE of 5~10 m/s is the smallest, at 1.37 m/s. The SI is greater than 0.2 in the range of 0~5 m/s, which is 0.29. The SI of the other two ranges is less than 0.2. The inversion results of Sentinel-1 SAR data are poor in low wind speeds, and the inversion results are better when the wind speed is greater than 5 m/s. The RMSE of the inversion results of GF-3 SAR data in the three wind speed ranges of 0~5 m/s, 5~10 m/s, and above 10 m/s is less than 2 m/s. The RMSE in the wind speed range of above 10 m/s is the largest, at 1.87 m/s. The RMSE in the range of 5~10 m/s is the greatest, at 1.45 m/s. The maximum SI is 0.36 in the range of 0~5 m/s, and the minimum is 0.14 in the range of above 10 m/s. In general, under different wind speeds, the wind field inverted from Sentinel-1 SAR data is slightly better than the wind field inverted from GF-3 SAR data.
Compared with the buoy data, the RMSE of Sentinel-1 SAR data is 1.20 m/s (similar to the accuracy in [14]), and the RMSE of GF-3 SAR data is 1.48 m/s (as in [17], RMSE is less than 2 m/s), and both are less than 2 m/s. The accuracy is high, but the inversion result of Sentinel-1 SAR data is slightly better than GF-3 SAR data.
The RMSE of Sentinel-1 SAR data and GF-3 SAR data under different wind speed conditions is less than 2 m/s, and both have a high inversion accuracy, but the inversion results of Sentinel-1 SAR data are slightly better than GF-3 SAR data. The comparison with the buoy data shows that the inversion accuracy of Sentinel-1 and GF-3 SAR data is higher, but the inversion results of Sentinel-1 SAR data are slightly better than GF-3 SAR data. In summary, for wind field inversion, the data quality of Sentinel-1 SAR and GF-3 SAR are both high, and the data quality of Sentinel-1 SAR is slightly better than the quality of GF-3 SAR.
4. Conclusions
In this study, Sentinel-1 SAR data and GF-3 SAR data in the Hormuz Strait, the Malacca Strait, and the east and west coasts of the United States are used. The wind direction data of ERA5 are used as the external input wind direction, and the CMOD5.N function is used for the wind field inversion. The inverted wind speed is compared with the wind speed provided by ERA5 and the wind speed provided by buoys to evaluate the quality of the SAR data of Sentinel-1 and GF-3 satellites for wind field inversion. The conclusions are as follows:
- (1)
- For wind field inversion, the wind field inverted from Sentinel-1 SAR data is slightly better than the wind field inverted from GF-3 SAR data, and the quality of Sentinel-1 SAR data is slightly better than the quality of GF-3 SAR data.
- (2)
- The RMSE of wind fields inverted from Sentinel-1 SAR data and GF-3 SAR data is less than 2 m/s, which is in line with the recognized standard. The quality of SAR data from both satellites is high.
- (3)
- The SAR data quality and resolution of the GF-3 satellites independently developed by China have achieved a world-leading level. The GF-3 satellite has broad prospects in the field of marine research.
Author Contributions
Data curation, Y.W. and S.G.; investigation, Y.D.; resources, L.L. and X.Q.; writing—original draft preparation, S.G.; writing—review and editing, Y.W. All authors have read and agreed to the published version of the manuscript.
Funding
This research was funded by the National Key R&D Program of China, grant number No. 2017YFC1405600 and the National Natural Science Foundation of China, grant number No. 61931025.
Acknowledgments
Thanks for the support from the National Key R&D Program of China (grant number No. 2017YFC1405600), the National Natural Science Foundation of China (grant number No. 61931025), the National Data Buoy Center for providing buoy data, the ESA for providing Sentinel-1 satellite SAR data, the China Marine Satellite Data Satellite Service System for providing GF-3 Satellite SAR data, and the ECMWF ERA5 data provided by the European Centre for Medium-range Weather Forecasts.
Conflicts of Interest
The authors declare no conflict of interest.
References
- Liu, L. An Introduction to Satellite Oceanic Remote Sensing; Wuhan University Press: Wuhan, China, 2005. [Google Scholar]
- Yang, J.; Huang, W.G.; Zhou, C. Coastal ocean surface wind retrieval from SAR imagery. J. Remote. Sens. 2001, 1, 13–16. [Google Scholar]
- Stoffelen, A.; Anderson, D. Scatterometer data interpretation: Estimation and validation of the transfer function CMOD4. J. Geophys. Res. Ocean. 1997, 102, 5767–5780. [Google Scholar] [CrossRef]
- Quilfen, Y.; Chapron, B.; Elfouhaily, T. Observation of tropical cyclones by high-resolution scatterometry. J. Geophys. Res. Ocean. 1998, 103, 7767–7786. [Google Scholar] [CrossRef]
- Hersbach, H.; Stoffelen, A.; Haan, S.D. An improved C-band scatterometer ocean geophysical model function: CMOD5. J. Geophys. Res. Ocean. 2007, 112. [Google Scholar] [CrossRef]
- Hersbach, H. Comparison of C-Band Scatterometer CMOD5.N Equivalent Neutral Winds with ECMWF. J. Atmos. Ocean. Technol. 2010, 27, 721–736. [Google Scholar] [CrossRef]
- Wackerman, C.C.; Rufenach, C.L.; Shuchman, R.A.; Johannessen, J.A.; Davidson, K.L. Wind vector inversion using ERS-1 synthetic aperture radar imagery. IEEE Trans. Geosci. Remote. Sens. 1996, 34, 1343–1352. [Google Scholar] [CrossRef]
- Vachon, P.W.; Dobson, F.W. Validation of wind vector retrieval from ERS-1 SAR images over the ocean. Glob. Atmos. Ocean. Syst. 1996, 5, 177–187. [Google Scholar]
- Thompson, D.R.; Elfouhaily, T.M.; Chapron, B. Polarization ratio for microwave backscattering from the ocean surface at low to moderate incidence angles. IEEE Int. Geosci. Remote. Sens. Symp. IEEE 1998, 3, 1671–1673. [Google Scholar]
- Mouche, A.A.; Hauser, D.; Daloze, J.F. Dual-Polarization Measurements at C-Band Over the Ocean: Results From Airborne Radar Observations and Comparison With ENVISAT ASAR Data. IEEE Trans. Geosci. Remote. Sens. 2005, 43, 753–769. [Google Scholar] [CrossRef]
- Hwang, P.A.; Zhang, B.; Toporkov, J.V.; Perrie, W. Comparison of composite Bragg theory and quad-polarization radar backscatter from RADARSAT-2: With applications to wave breaking and high wind retrieval. J. Geophys. Res. Ocean. 2010, 115. [Google Scholar] [CrossRef] [Green Version]
- Zhang, B.; Perrie, W. Cross-Polarization Synthetic Aperture Radar: A New Potential Measurement Technique for Hurricanes. Bull. Am. Meteorol. Soc. 2012, 93, 531–541. [Google Scholar] [CrossRef] [Green Version]
- Zhang, G.; Li, X.; Perrie, W. A Hurricane Wind Speed Retrieval Model for C-Band RADARSAT-2 Cross-Polarization ScanSAR Images. IEEE Trans. Geosci. Remote. Sens. 2017, 55, 4766–4774. [Google Scholar] [CrossRef]
- Zhang, K.Y. Sea Surface Wind Field Retrieval and Offshore Wind Energy Resource Assessment Based on C-band SAR Data. Ph.D. Thesis, Zhejiang University, Zhejiang, China, 2019. [Google Scholar]
- Zhu, S. Evaluation of wind and significant wave height retrieval from Gaofen-3 SAR. Master’s Thesis, Zhejiang Ocean University, Zhejiang, China, 2020. [Google Scholar]
- Shao, W.; Li, X.M.; Lehner, S.; Guan, C. Development of polarization ratio model for sea surface wind field retrieval from TerraSAR-X HH polarization data. Int. J. Remote. Sens. 2014, 35, 4046–4063. [Google Scholar] [CrossRef]
- Ding, Y. Research on Fully Polarimetric SAR Image Processing and Ocean Surface Wind Field Inversion. Master’s Thesis, Nanjing University of Information Science and Technology, Nanjing, China, 2020. [Google Scholar]
Publisher’s Note: MDPI stays neutral with regard to jurisdictional claims in published maps and institutional affiliations. |
© 2021 by the authors. Licensee MDPI, Basel, Switzerland. This article is an open access article distributed under the terms and conditions of the Creative Commons Attribution (CC BY) license (https://creativecommons.org/licenses/by/4.0/).