In the original article [1], there was a mistake in the legend for Figure 3—The legend contains wider colour ranges and it should be shorter. The correct legend appears below. The authors apologize for any inconvenience caused and state that the scientific conclusions are unaffected. The original article has been updated.
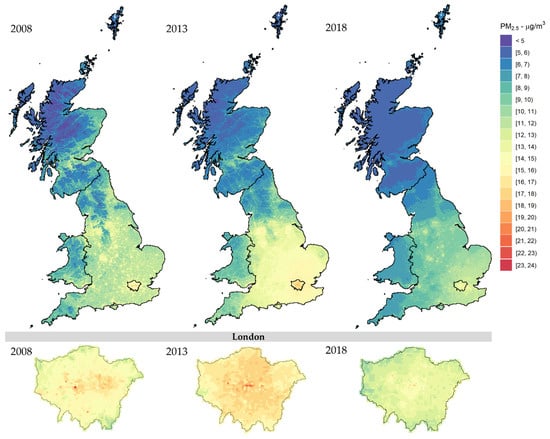
Figure 3.
Stage-4 predicted PM2.5 concentrations across Great Britain (Top) and London (Bottom) for 2008, 2013, and 2018 aggregated by annual means. All plots were built under the same colour scale.
Reference
- Schneider, R.; Vicedo-Cabrera, A.M.; Sera, F.; Masselot, P.; Stafoggia, M.; de Hoogh, K.; Kloog, I.; Reis, S.; Vieno, M.; Gasparrini, A. A Satellite-Based Spatio-Temporal Machine Learning Model to Reconstruct Daily PM2.5 Concentrations across Great Britain. Remote Sens. 2020, 12, 3803. [Google Scholar] [CrossRef] [PubMed]
Publisher’s Note: MDPI stays neutral with regard to jurisdictional claims in published maps and institutional affiliations. |
© 2021 by the authors. Licensee MDPI, Basel, Switzerland. This article is an open access article distributed under the terms and conditions of the Creative Commons Attribution (CC BY) license (https://creativecommons.org/licenses/by/4.0/).