The authors wish to make the following corrections to this paper [1].
1. Incorrect Title
There is an error in the title. The correct title of the article is “Nightlight as a Proxy of Economic Indicators: Fine-Grained GDP Inference around Chinese Mainland via Attention-Augmented CNN from Daytime Satellite Imagery”.
2. Error in Figures 3 and 5
In the original article, there was a mistake in Figure 3 and Figure 5 as published. The corrected Figure 3 and Figure 5 appear below. The authors apologize for any inconvenience caused and state that the scientific conclusions are unaffected. The original article has been updated.
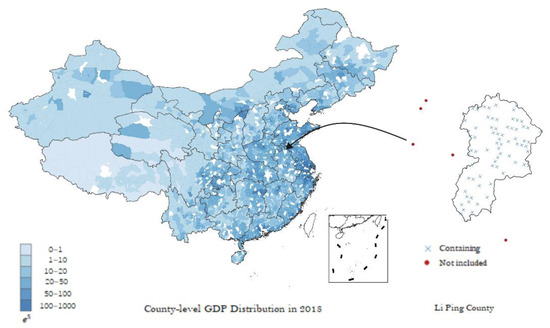
Figure 3.
The GDP distribution map of the Chinese Mainland in 2018 (some values along with the boundaries of county-level units are missing), and an example of matching center coordinates and county boundaries. Blue crosses denote center coordinates that fall into the boundary of Liping County, while red points denote centers that do not.
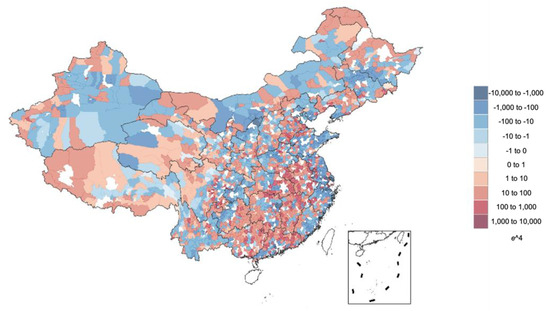
Figure 5.
The prediction error map of county-level GDP in 2018. White areas in the map represent regions where data are missing. Due to the large area of the Chinese Mainland, there are a few regions where images are either missing or of poor quality (Hainan Island, for instance). Nevertheless, the number of counties covered by the images we gained is enough for this study.
3. Incorrect Acknowledgement
There is an error in the Acknowledgement section. We apologize for this error and state that the scientific conclusions are unaffected. The correct Acknowledgement section of this article is as follows.
Acknowledgement: This work was supported by the Public Computing Cloud, Renmin University of China. We thank Linhao Dong, Ying Hao, Yafeng Wu, Yunhui Xu and Yecheng Tang, students from Renmin University of China; the author gratefully acknowledges the support of the K.C. Wong Education Foundation, Hong Kong.
Reference
- Liu, H.; He, X.; Bai, Y.; Liu, X.; Wu, Y.; Zhao, Y.; Yang, H. Nightlight as a Proxy of Economic Indicators: Fine-Grained GDP Inference around Chinese Mainland via Attention-Augmented CNN from Daytime Satellite Imagery. Remote Sens. 2021, 13, 2067. [Google Scholar] [CrossRef]
Publisher’s Note: MDPI stays neutral with regard to jurisdictional claims in published maps and institutional affiliations. |
© 2021 by the authors. Licensee MDPI, Basel, Switzerland. This article is an open access article distributed under the terms and conditions of the Creative Commons Attribution (CC BY) license (https://creativecommons.org/licenses/by/4.0/).