Article

Remote Sensing Approach for Monitoring Coastal Wetland in the Mekong Delta, Vietnam: Change Trends and Their Driving Forces

1
Department of Geography and Planning, University of New England, Armidale, NSW 2351, Australia
2
EastCoast Geospatial Consultants, Armidale, NSW 2350, Australia
3
Department of Land Management, Dong Thap University, Cao Lanh 870000, Vietnam
4
Institute of Landscape Ecology, University of Münster, Heisenbergstr. 2, 48149 Münster, Germany
*
Author to whom correspondence should be addressed.
Remote Sens. 2021, 13(17), 3359; https://doi.org/10.3390/rs13173359
Submission received: 15 July 2021 / Revised: 10 August 2021 / Accepted: 20 August 2021 / Published: 25 August 2021
(This article belongs to the Section Ecological Remote Sensing)

Abstract

:
Coastal wetlands in the Mekong Delta (MD), Vietnam, provide various vital ecosystem services for the region. These wetlands have experienced critical changes due to the increase in regional anthropogenic activities, global climate change, and the associated sea level rise (SLR). However, documented information and research on the dynamics and drivers of these important wetland areas remain limited for the region. The present study aims to determine the long-term dynamics of wetlands in the south-west coast of the MD using remote sensing approaches, and analyse the potential factors driving these dynamics. Wetland maps from the years 1995, 2002, 2013, and 2020 at a 15 m spatial resolution were derived from Landsat images with the aid of a hybrid classification approach. The accuracy of the wetland maps was relatively high, with overall accuracies ranging from 86–93%. The findings showed that the critical changes over the period 1995/2020 included the expansion of marine water into coastal lands, showing 129% shoreline erosion; a remarkable increase of 345% in aquaculture ponds; and a reduction of forested wetlands and rice fields/other crops by 32% and 73%, respectively. Although mangrove forests slightly increased for the period 2013/2020, the overall trend was also a reduction of 5%. Our findings show that the substantial increase in aquaculture ponds is at the expense of mangroves, forested wetlands, and rice fields/other crops, while shoreline erosion significantly affected coastal lands, especially mangrove forests. The interaction of a set of environmental and socioeconomic factors were responsible for the dynamics. In particular, SLR was identified as one of the main underlying drivers; however, the rapid changes were directly driven by policies on land-use for economic development in the region. The trends of wetland changes and SLR implicate their significant effects on environment, natural resources, food security, and likelihood of communities in the region sustaining for the long-term. These findings can assist in developing and planning appropriate management strategies and policies for wetland protection and conservation, and for sustainable development in the region.

Graphical Abstract

1. Introduction

Wetlands are one of the most important and valuable ecosystems on Earth and provide numerous critical ecosystem services [1,2]. These ecosystem services include: (1) provisioning of wildlife habitats, fresh water, biochemical and genetic materials as well as food, fuel, and fibres [3,4,5,6]; (2) regulating water hydrology, water purification, erosion, climate, and natural hazards [3,5,7]; (3) supporting cycling of nutrients, carbon storage, and soil formation [6,8]; and (4) cultural services such as recreational and nature educational resources [5]. Despite these important functions, wetlands have been globally threatened due to human activities and climate change, with approximately 64–74% loss since 1900 [9]. Wetland protection and conservation are thus an important priority in order to prevent further losses and maintain the vital services wetlands provide [10].
Monitoring can determine changes in wetland location, extent, and quality, and therefore plays a crucial role in wetland protection and conservation [11]. Detecting long term changes in wetlands will help scientists better understand the trends and unexpected changes in wetlands, and therefore properly evaluate their health and functions [1,12]. Comprehensive understanding of wetland dynamics, including potential driving forces, is critical for the development and planning of appropriate management strategies and policies for long-term conservation of wetland ecosystems.
Remote sensing-based approaches use remote sensing data and techniques to map and detect changes in the land features, which can assist in determining extents, rates, and patterns of change in those features. The approaches have been widely used for wetland monitoring due to several advantages, such as large-scale coverage, timely monitoring, low costs, and capacity to be integrated into GIS for further analysis [11,13,14,15]. Remotely sensed data has been recognized as a critical data source for monitoring wetland dynamics because of its capacity to provide highly consistent and spatially continuous maps of the Earth’s surface [12]. Such data provides both biophysical information and vegetation indices, which are vital parameters for evaluating and monitoring temporal patterns in land ecosystems, including wetlands [10,16,17]. The most common research themes, such as mapping wetland types, vegetation cover classification, and change detection, have been undertaken using medium spatial resolution data, particularly Landsat data, at regional scales due to the advantages in terms of temporal and spatial resolution and the free availability of the data [1]. Recent studies have proven the potential of Landsat imagery for mapping and monitoring wetland dynamics with acceptable accuracy [10,11,12,15,18,19,20,21,22,23].
Remote sensing classification techniques for mapping land features have benefited from the development and wide use of a variety of techniques, including supervised classification, unsupervised classification and non-parametric classification [24,25,26]. Among these approaches, supervised classification has been commonly applied for land feature mapping, including wetlands in recent studies [15,22,23,27,28,29,30,31,32]. Errors and inaccuracies in image classification are inevitable, and hence assessing the accuracy of classified images is essential to measure the consistency of remote sensing-acquired classification [33].
The coastal wetlands of the Mekong Delta (MD) in Vietnam provide a variety of important ecosystem services for the region [34]. However, the wetlands have been experiencing critical changes due to increases in regional anthropogenic activities, such as aquaculture and agricultural development, over-fishing, over-exploitation of natural resources [35,36,37], as well as climate change and sea level rise (SLR) [22,35,38,39,40]. Previous studies of the system have focused mainly on the uses of remote sensing-based approaches to investigate changes in land-use/land-cover [22,32,35,37,41,42] and the dynamics of mostly mangrove forests at the local (district) scales [18,19,23,43]. However, in the case of the south-west coast of the MD, where important wetland ecosystems of the region are present (i.e., peatland Melaleuca wetlands, mangrove forests, and such key human-made wetlands such as rice fields), information on wetland dynamics, and the factors that drive these dynamics, is scarce. The present study aimed to address this knowledge gap using a remote sensing-based approach. The specific objectives of our study were to: (1) map spatial distribution of wetland types in the study area in the years 1995, 2002, 2013, and 2020; (2) analyse the spatial and temporal trends in wetlands during this period; and (3) investigate the potential factors, including SLR, driving wetland changes. The outcome of the study will provide comprehensive information on the distributions and trends in wetlands in the region, which can be critical for protecting and conserving the ecosystems. In addition, a better understanding of wetland dynamics and factors influencing the wetlands in the region will assist planners and policy makers in developing appropriate strategies for long-term conservation of wetland ecosystems.

2. Materials and Methods

2.1. Study Area

The study area is located in the south-west coast of the MD, between 8°35′–9°55′ N and 104°43′–105°25′ E, spanning an area of approximately 6000 km2. The area within 20 km from the coastline includes coastal areas of Ca Mau province and parts of the Kien Giang province (An Minh and An Bien districts) (Figure 1). The area experiences a humid tropical monsoon climate with an average annual temperature of 27.5 °C, average annual rainfall of 2442 mm, and two distinguishable seasons, the dry season (December to April), and the rainy season (May to November) [32]. The region is mostly flat and located in a low-lying area of the MD, and is therefore extremely susceptible to sea level rise impacts [38].
The coastal areas were chosen because they include the typical and important wetland ecosystems of the MD, which are coastal mangrove forest and peatland Melaleuca forest wetlands. Mangrove forest in Ca Mau province, especially in Ngoc Hien district, is the largest and includes the last remaining old-growth mangrove forests in Vietnam, including the internationally acknowledged UNESCO Biosphere Reserve and RAMSAR site of Ca Mau Cape [44,45]. In addition, the Melaleuca forest of the region constitutes a large proportion of the total amount of this type of wetland in the MD. These forests are also listed in the biosphere reserves of the world by UNESCO (U Minh Ha National Park) and RAMSAR site (U Minh Thuong National Park) [46,47]. These wetlands, along with human-made wetlands, such as rice fields and aquaculture ponds, also contribute to ecosystem services and livelihoods of communities [19]. However, forest wetlands have significantly decreased in area due to factors such as agriculture and aquaculture practices as well as environmental factors such as extreme weather and SLR due to climate change.

2.2. Datasets

The present study used a variety of data including satellite imagery, ancillary data such as ground truth data, historical Google Earth images, as well as historical land-use/land-cover maps, and local land-use maps (both district and province scales) (Table 1). The ancillary data were used to identify training samples for image classification and testing samples for accuracy assessment of classified images. Ground truth data were only available for the current time, and since historical images were used to determine trends, historical data were needed for image classification and accuracy analysis. Such information was derived from historical Google Earth images (corresponding to the Landsat images) as well as high resolution local land-use/land-cover maps.
Landsat images captured in 1995, 2002, 2013, and 2020 were used to evaluate the dynamics of wetland changes over the study period in the study area. Cloud-free images each located with paths 125 and 126 and rows 053 and 054 were downloaded from the United States Geological Survey (USGS, https://earthexplorer.usgs.gov, accessed on 4 December 2020). Panchromatic (PAN) bands of the Landsat images were used to improve the spatial resolution of the multi-spectral (MS) Landsat images. The intervals of the study years were selected to analyse significant changes in wetlands in the study area; however, the intervals were also dependent on the availability of cloud-free Landsat images.
Ground truth data, including 237 random training samples, were collected in 2019 and early 2020 using a portable Global Positioning System device, Garmin GPS MONTANA 680. At each reference location, the respective wetland types and coordinates were recorded. Ground truth data, combined with existing local land-use/land-cover maps, local land-inventory maps, and historical Google Earth images, were used for image classification and accuracy assessment. Data on sea level were obtained from the National Centre for Hydro—Meteorological Forecasting (NCHMF), Vietnam, for the analysis of the relationship between SLR and wetland changes.

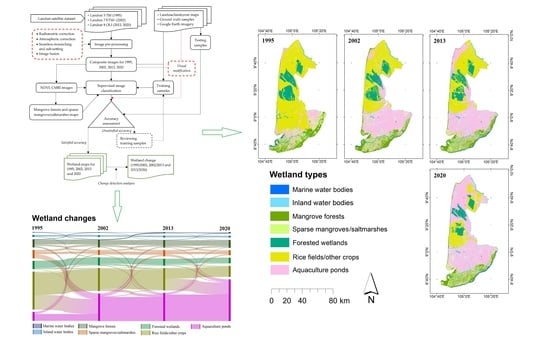
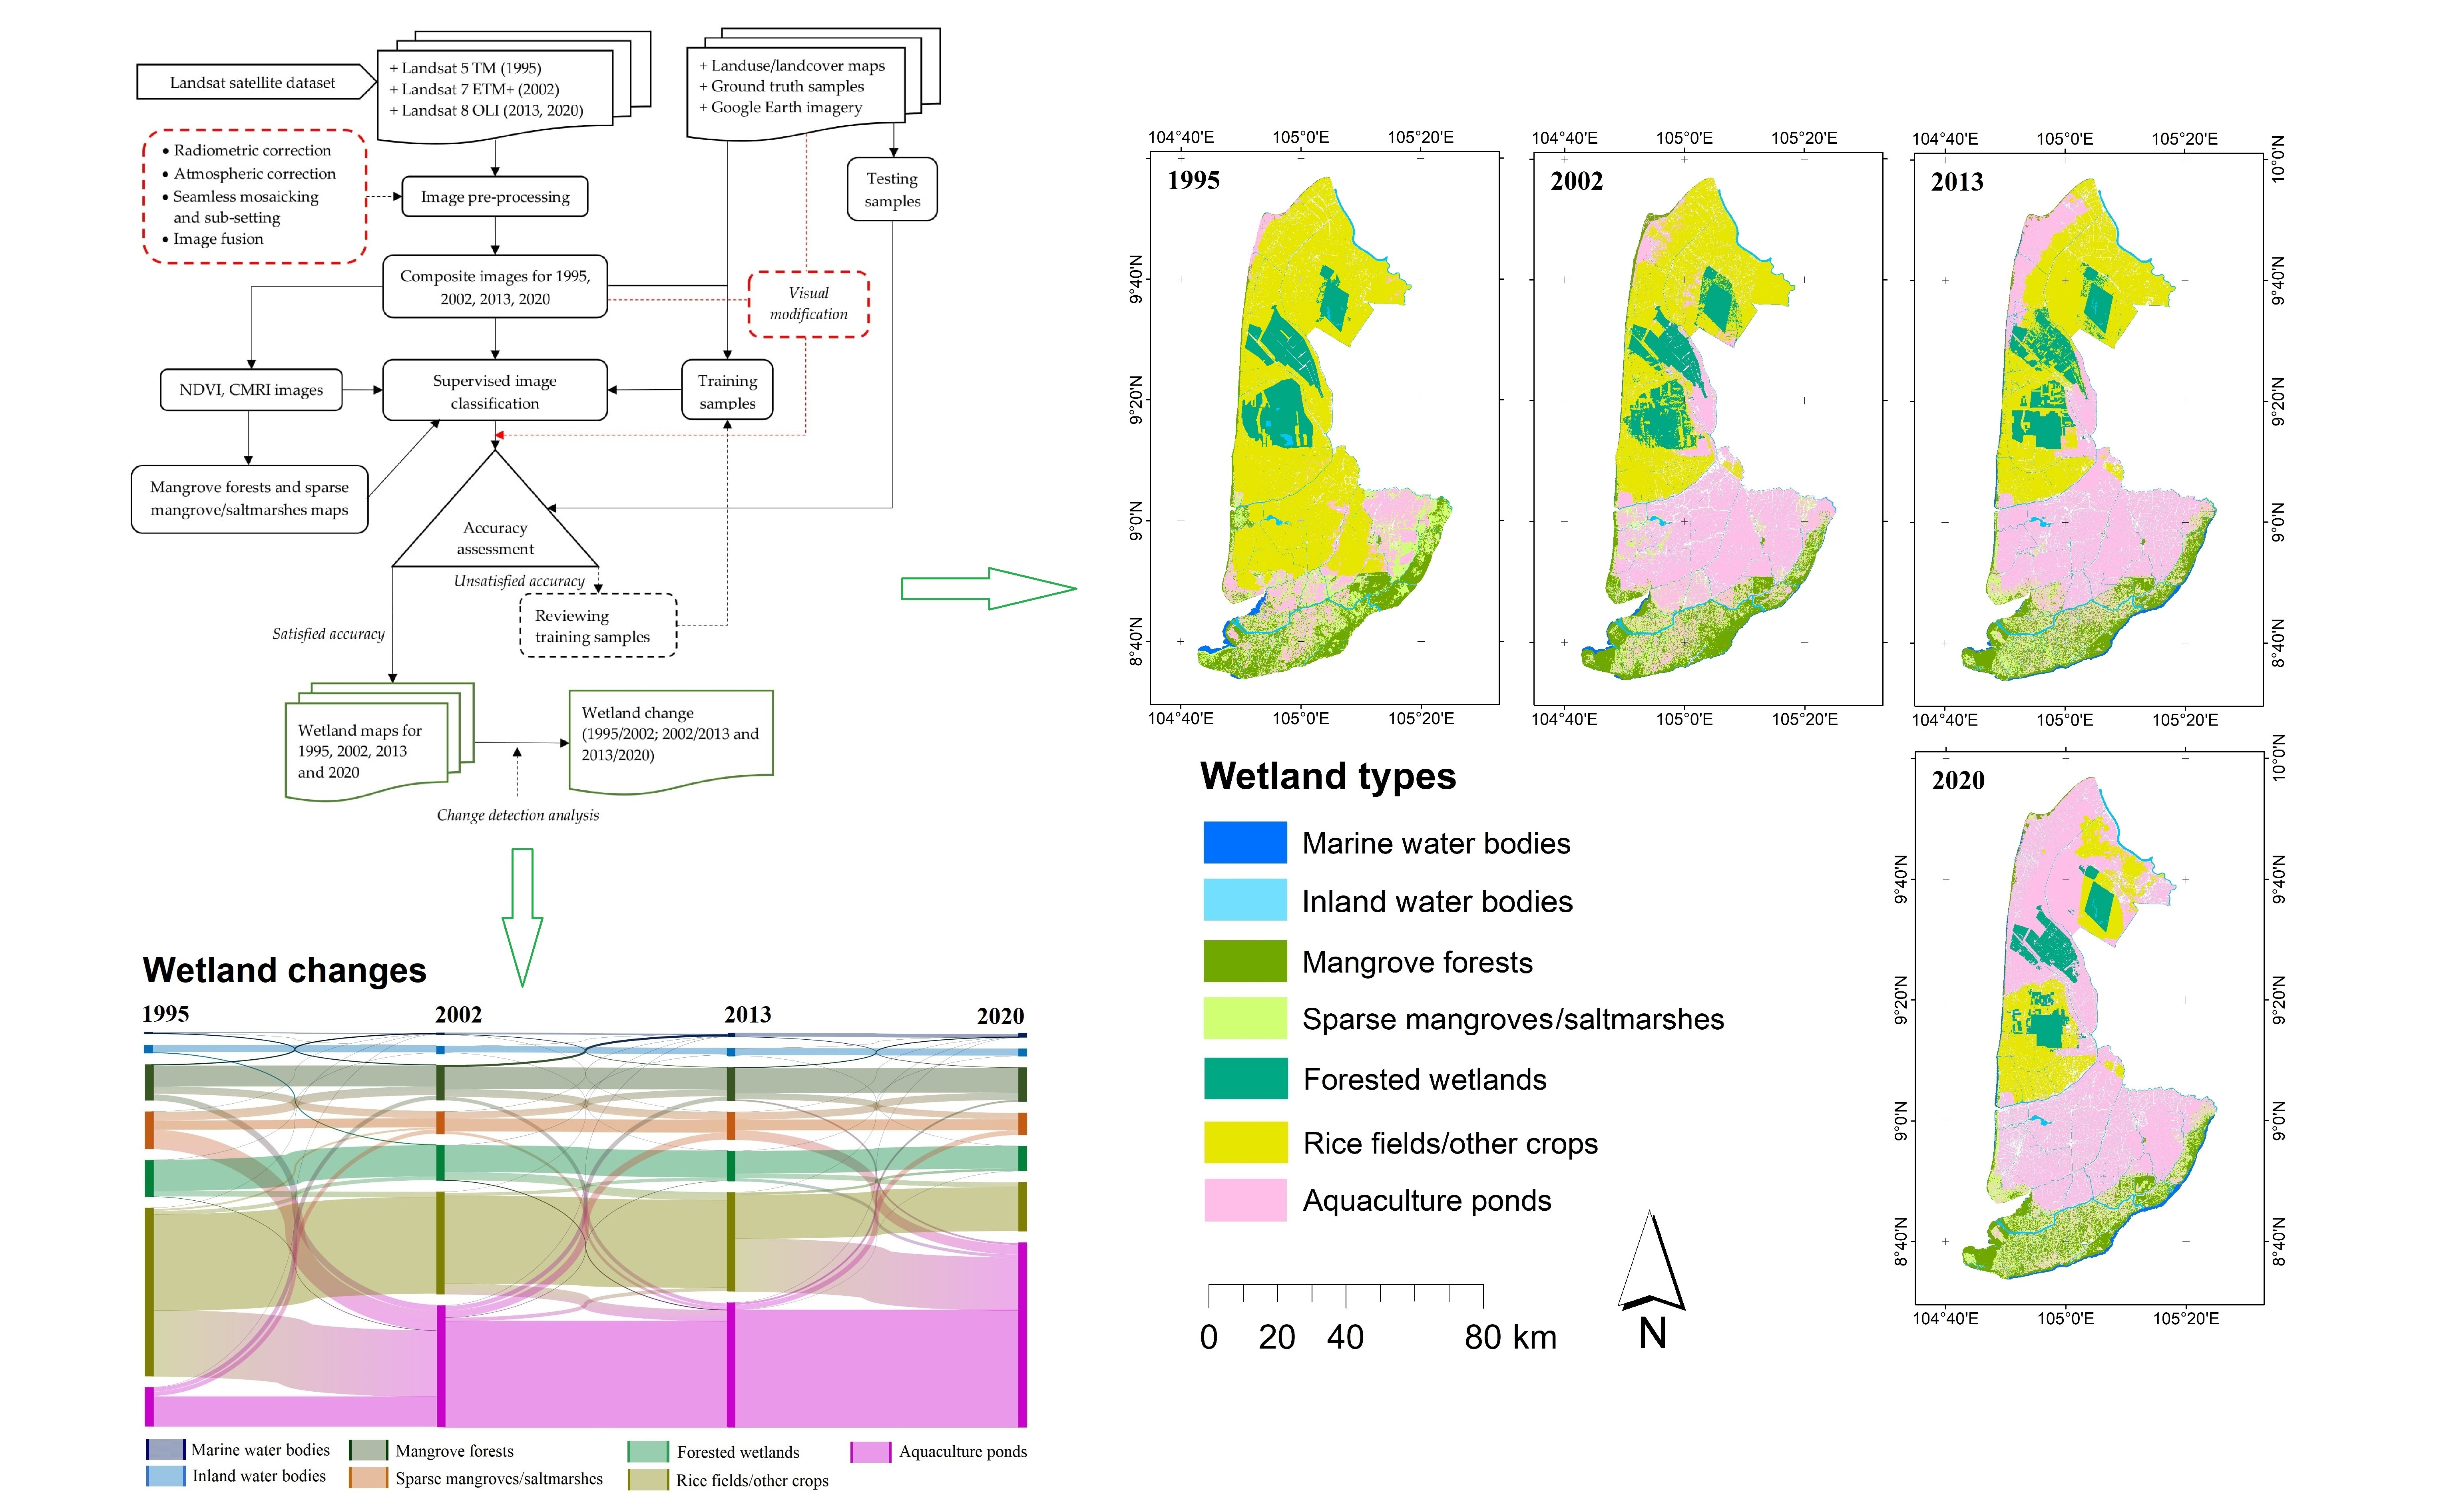
2.3. Image Pre-Processing

Image pre-processing is an important initial step used to correct for atmospheric effects and minimize geometric and radiometric errors before image classification and change detection [48,49]. Converting digital number (DN) values to radiance can improve the extraction and understanding of spectral properties of vegetation types [50]. For Landsat 5 and 7, the DN images were converted to the top of the atmosphere (TOA) reflectance images using the radiometric calibration tool in ENVI software version 5.4 [51], while for Landsat 8, an approach described in Landsat [52] was adopted to undertake the conversion (see Formula S1 in Supplementary Materials). With regard to atmospheric correction, previous studies have shown that dark object subtraction (DOS) algorithm [49,53] is an effective technique, particularly for Landsat images [49,54,55,56,57,58]; it even performs better than the Landsat Surface Reflectance Code (LaSRC) method in a particular study in Vietnam, i.e., Ngo Thi et al. [58]. Therefore, the DOS algorithm included in the ENVI software was used to undertake atmospheric correction for all images in this study. Although Landsat surface reflectance images (Level-2 product) are available from USGS, DOS was chosen to process the Landsat Level 1-product in this study due to both the absence of the surface reflectance images for some study periods (i.e., year 2013) and the applicability of the approach for various images from different platforms. The advantages of the approach (i.e., simplicity of application, open source and no requirement of climatological parameters) meant that it could also be applied in events in which surface reflectance products were unavailable for a specific image in a particular area and time. The MS reflectance images from several Landsat scenes for a particular year were mosaicked afterwards into single seamless composite images using the mosaicking function (in Basic tool) in the ENVI software. These MS composite and PAN images were clipped according to the study area.
A fusion or pan-sharpened MS image, which is produced by the combination of PAN and MS images, provides an improved image of high spatial resolution [59,60]. Pan-sharpened MS images can help mapping and monitoring wetlands since different vegetation types or wetland classes can be better classified using high spectral and spatial resolution images [61]. Component Substitution (CS) methods are common, effective, and efficient approaches for performing pan-sharpening images due to their advantages, including high fidelity of spatial information, high efficiency, ease of application, and open sources [62,63,64]. However, CS methods inevitably create spectral distortion issues and thus their consistency in term of spectral fidelity has been criticized [62,63,64]. Amongst CS methods, the Gram–Schmidt (GS) technique is widely used to create pan-sharpening images [63]. Previous studies concluded the GS can be used to pan-sharpen Landsat images with acceptable results, in terms of qualitative evaluation, and spatial and spectral distortions, for further application [65,66,67]. The technique can also enhance not only spatial resolution but also spectral contrast of fusion images thus improving the classification results compared with other techniques [61]. Given the fact that the MD landscape is characterized by many small patches of different land cover and land use types, increasing spatial resolution is helpful to minimize issues of missed classification due to low spatial resolution of remotely sensed data. The GS technique in ENVI 5.4 was therefore applied to create the pan-sharpened Landsat images. Three pan-sharpened Landsat images (for years 2002, 2013, and 2020) with a spatial resolution of 15 m of the study area were generated, while for the year 1995, MS image of the Landsat 5 TM with spatial resolution of 30 m was used due to the absence of PAN in the Landsat 5 TM sensor.

2.4. Image Classification

Based on the Ramsar classification of wetlands, the landscape composition, and wetland classification schemes of previous studies in the region, our wetland classification scheme consists of: (1) marine water bodies; (2) inland water bodies; (3) mangrove forests; (4) sparse mangroves/saltmarshes; (5) forested wetlands; (6) rice fields/other crops; and (7) aquaculture ponds. The target wetland classes were identified based on the wetland classes of the second Ramsar level. A detailed description of the wetland types is presented in Table 2.
As noted above, the land features in the MD, and in the study area in particular, are quite complex, and so a combination of classification methods, such as the semi-automatic classification method, have been utilized in previous studies [22,35,43,69]. In the present study, we developed a hybrid classification method including automatic classification and visual modification to achieve greater accuracy for image classification. The classification method used involved three main steps: (1) the use of vegetation indices to acquire mangrove forests and sparse mangroves/saltmarshes classes; (2) automatic classification of other classes; and (3) visual modification.
(1)
Application of vegetation indices for mangrove classification
Various vegetation indices, viz., Simple Ratio, Soil Adjusted Vegetation Index [70], Normalized Difference Water Index (NDWI) [71], and Normalized Difference Vegetation Index (NDVI) [72], have been developed and used for discrimination of vegetation from non-vegetation land features [73]. However, the present study aimed to classify different vegetation types, such as mangroves, forested wetlands, and rice fields, and using only supervised classification with medium spatial resolution remote sensing data can cause substantial misclassification between these types of vegetation classes [22]. Therefore, this study used a recently developed index, the Combined Mangrove Recognition Index (CMRI), which can improve the discrimination between mangrove forest and non-mangrove vegetation [50]. CMRI images were created using the equations described in Table 3, on the pre-processed Landsat images. The raster calculator (spatial analyst tool) in ArcGIS 10.4.1 was used to perform this task. Threshold values obtained for different years varied from 0.925 to 1.720 for mangrove forests, and from 0.374 to 0.925 for sparse mangroves/saltmarshes. Other factors, including whether areas were part of the low elevation coastal zone, if salinity levels were reported as suitable for mangrove occurrence, and other spatial data that confirmed the presence or absence of mangrove for each time period were also taken into consideration to validate the classified mangrove classes.
(2)
Supervised classification for delineating other classes
The remaining wetland classes were mapped using a supervised classification technique. Maximum likelihood algorithm is considered one of the most effective methods for classification of land cover types using remotely sensed data with medium spatial resolution [74,75]. This method assigns each pixel to one of different classes according to the class signatures’ means and variances, and therefore requires training samples representing the feature types [51]. For each pre-processed image, training samples, as polygons, were selected based on ground truth data, visual interpretation, Google Earth images, and local land-use/land-cover maps. The separability of the spectral signatures of the generated training samples was evaluated to ensure minimized misclassification between wetland classes [76]. Once separability was satisfied, supervised classification was undertaken in ENVI 5.4 utilizing the maximum likelihood algorithm. Afterward, we combined the classified image generated from this step with the mangrove layers, and masked non-wetland areas, including urban areas, construction lands, and other lands out from the classification.
(3)
Visual modification
Mapping rice fields by using straightforward classification techniques seems not to be effective due to seasonal variation in rice crop signatures and a shortage of cloud-free satellite images of all seasons in the tropical region which limits robust validation [22]. Accordingly, official local land-use and land-inventory maps, high resolution Google Earth images, the Landsat image series, and existing research for visual modification of classified rice field class as well as other remaining classes were used.

2.5. Accuracy Assessment and Change Detection

Accuracy assessment is one of the most important post-classification analyses used to evaluate the efficiency and reliability of the classification. It is based on the agreement level between classified images and a set of reference data [77]. In this study, accuracy assessment was undertaken using random testing samples, which were identified based on ground truth data for the year 2020. The testing samples were derived from official local land-use and land-inventory maps, historical Google Earth images, and visual interpretation for 1995, 2002 and 2013 when ground truth data were unavailable. Error matrices were used to analyse statistical correspondence between the classified images and reference data. The overall user and producer accuracies of each classified image were derived using the nonparametric Kappa statistic [78].
Wetland change detection was undertaken utilizing the overlay function in ENVI 5.4 for 1995/2002, 2002/2013 and 2013/2020 images to determine alterations taking place over the period. In addition, the types and extent of wetland changes were identified by pixel to pixel-based cross-tabular statistics performance [24,27,28,29,31,79]. It is noted that the present study focused on the changes between wetland categories, so the transformation of wetlands from and to other non-wetlands, (normally areas of rice fields and aquaculture to residential and construction) was not considered. A methodology flowchart of the present study is illustrated in Figure 2.

2.6. Analysis of Sea Level Rise and Wetland Changes Relationship

Given the fact that the coastal study area is likely to be affected by SLR [22,35,38,39,40], the present study analysed trends in sea level change and the impacts of SLR on wetlands over the study time period. We used the annual mean sea level above Hon Dau 1992 datum from 1995 to 2019 in the west sea observed at Rach Gia station, which was collected from NCHMF, Vietnam. The trend in sea level during the period was analysed using simple linear regression. The annual mean sea level for 2020 was predicted based on the sea level trend line from 1995 to 2019 due to the absence of annual mean sea level for the year 2020. To investigate the impacts of SLR on the wetland dynamics, the Pearson correlation coefficient (r) technique was used to statistically analyse the linear correlation between sea level rise and the area of each wetland type [80].

3. Results

3.1. Wetland Categories and Accuracy Assessment

Within the study period, the seven wetland categories, including marine water bodies, inland water bodies, mangrove forests, sparse mangrove/saltmarshes, forested wetlands, rice fields, and aquaculture ponds were classified from the Landsat images (Figure 3).
The accuracy assessment gave overall accuracies of 86.7%, 89.5%, 90.7%, and 93.3% for the images of years 1995, 2002, 2013, and 2020, respectively. Meanwhile, the Kappa coefficients were 0.84, 0.88, 0.89, and 0.91 for 1995, 2002, 2013, and 2020, respectively. The user and producer accuracies of the various thematic classes were over 80%, except those of inland water body areas (71.2%) and aquaculture pond areas (70.1%) for the year 1995 as shown in Table 4a–d.

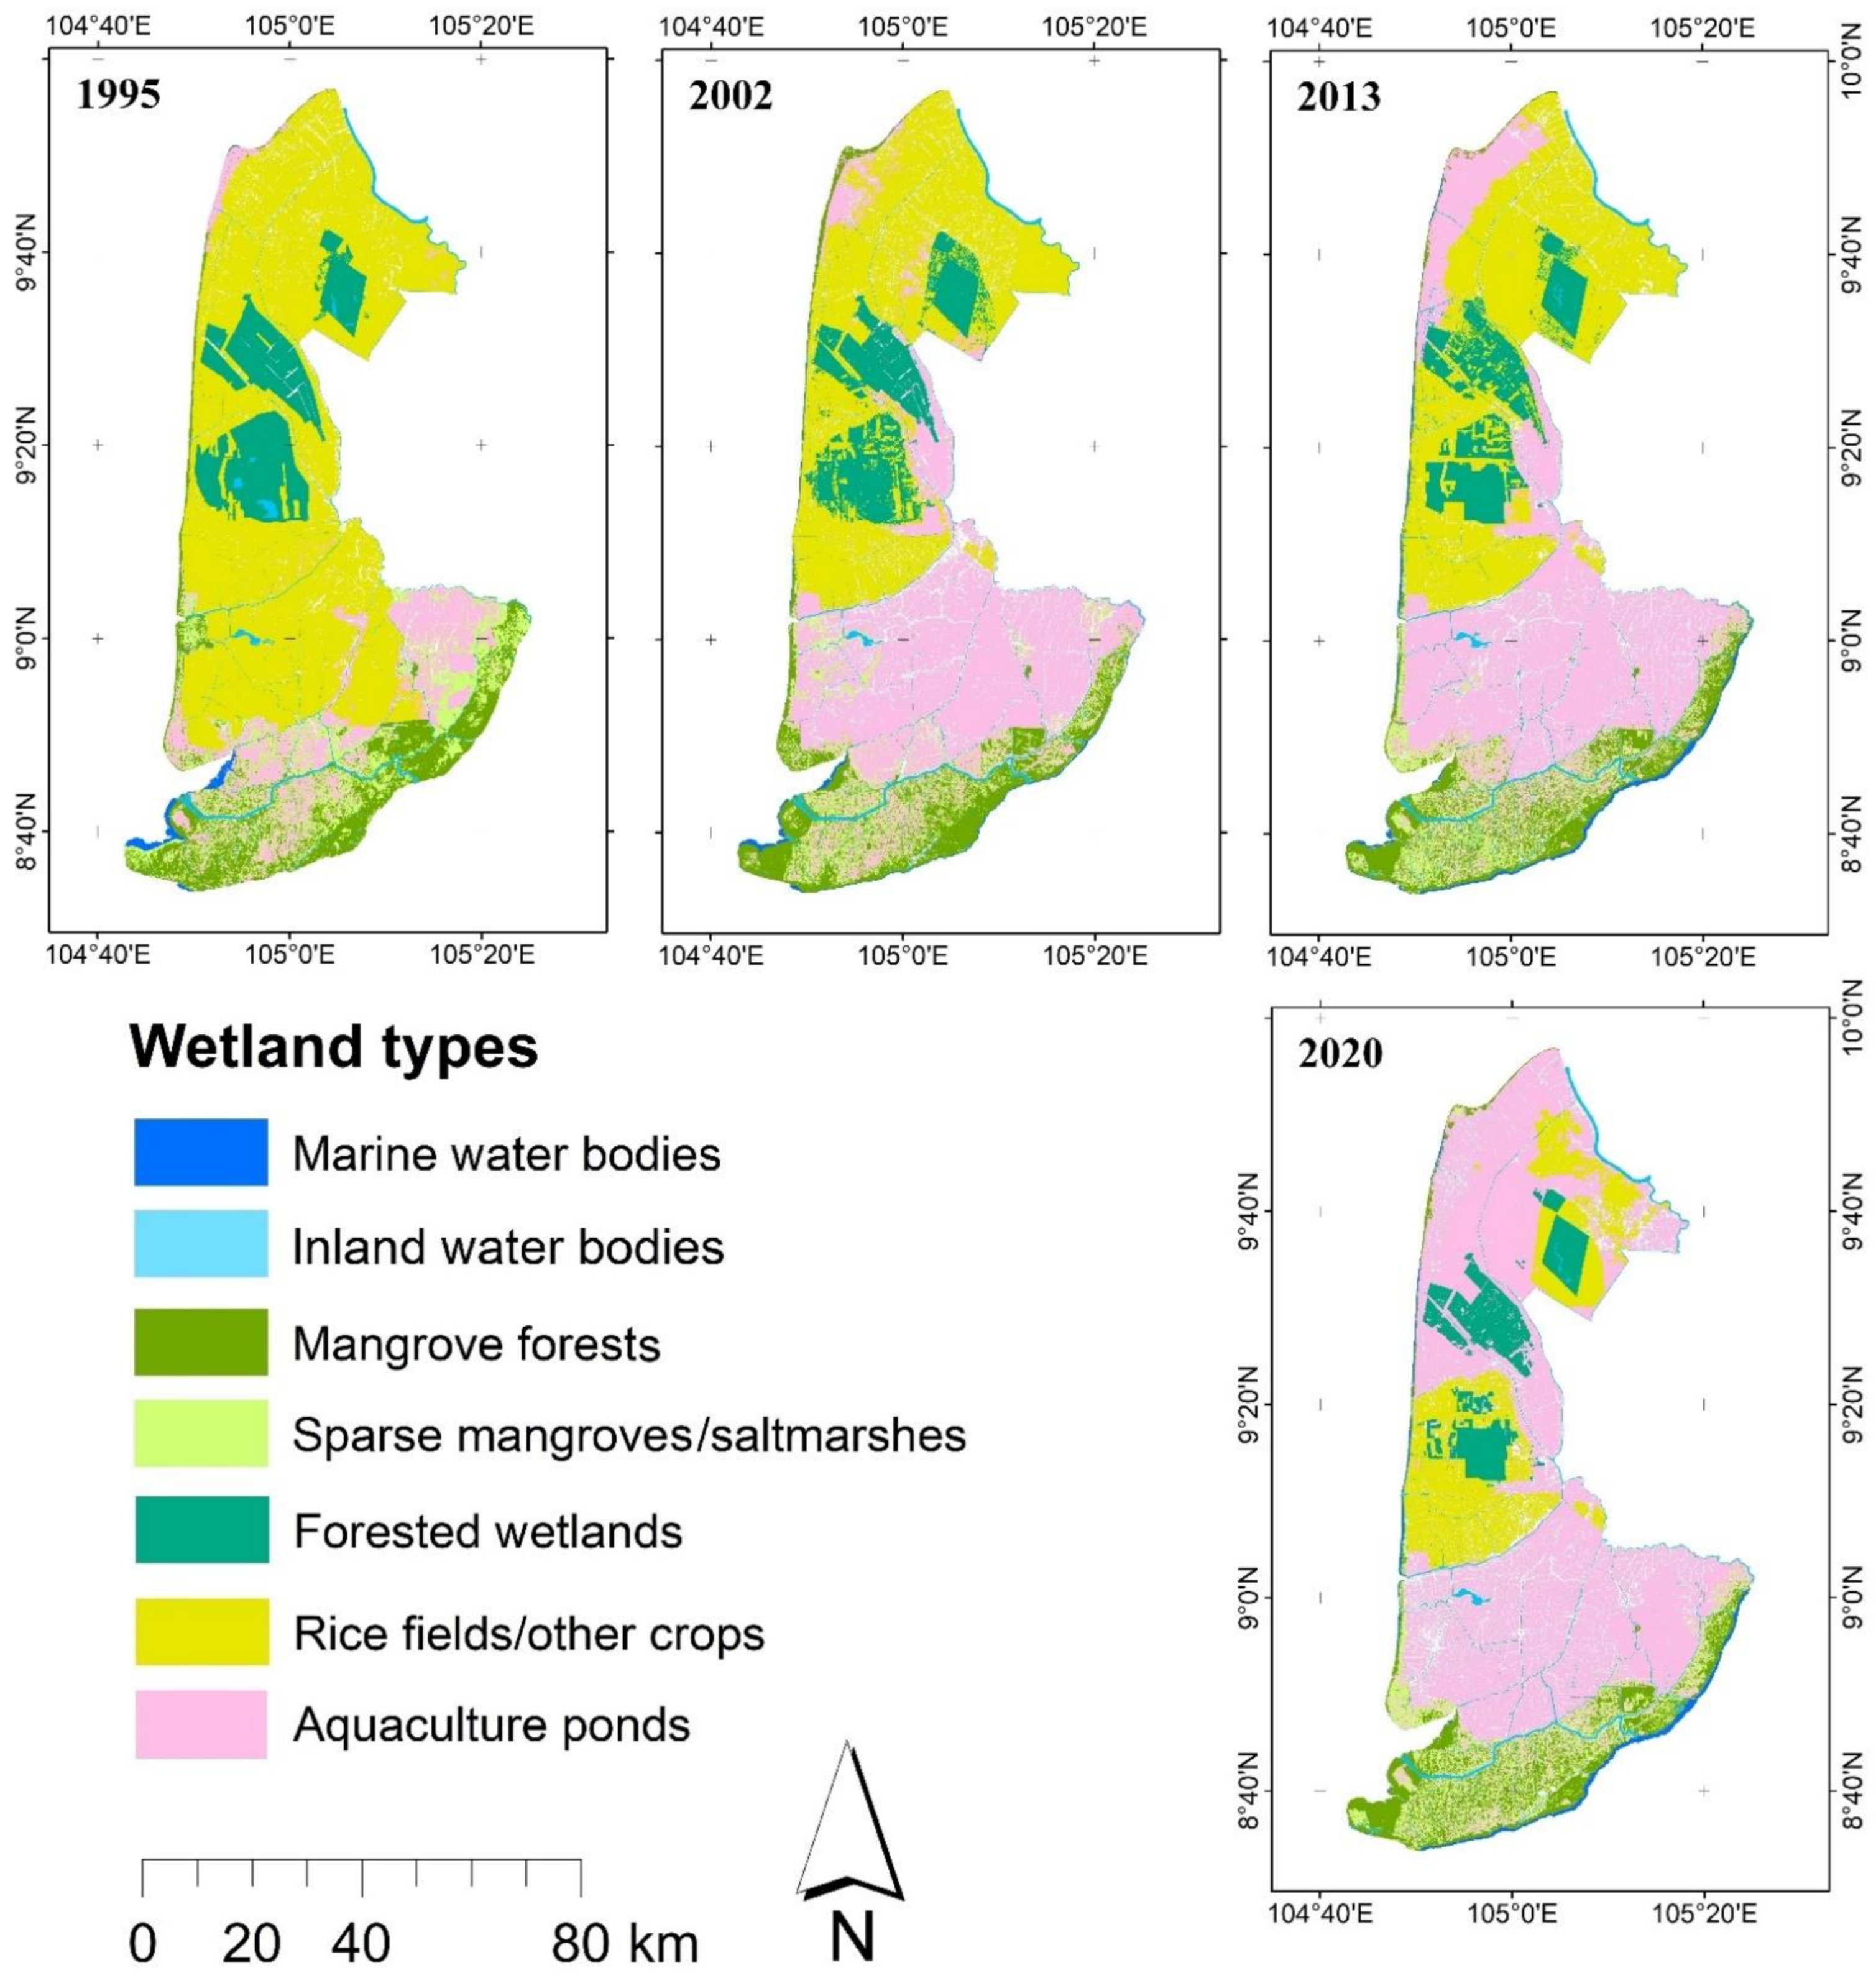
3.2. Coverage, Trend and Magnitude of Wetland Changes

The classified-wetland maps indicated that rice fields/other crops and aquaculture ponds were the most extensive wetland types in the study area, with coverage ranges between 14.5–49.5%, and 11.5–54.4%, respectively, over the study period. Marine water bodies and aquaculture ponds consistently increased over the period, while forested wetlands, mangrove forests, and rice fields/other crops showed a clear decreasing trend (Table 5).
In the period 1995/2002, major changes occurred, including decreases in rice fields/other crops areas of 1303.1 km2 (−42.9%), and sparse mangrove/saltmarshes areas of 250.8 km2 (−39.5%); and an increase in aquaculture pond areas of 1393.3 km2 (210.7%). Between 2002 and 2013, there was an expansion of marine water bodies of 33.5 km2 (86.6%) and sparse mangrove/saltmarshes of 87.0 km2 (22.7%), which contributed to reductions in forested wetlands of 87.3 km2 (−14.5%) and mangrove forests of 26.9 km2 (−4.5%). In the period 2013/2020, aquaculture ponds increased by 859.7 km2 (41.3%), whereas rice fields/other crops and sparse mangroves/saltmarshes decreased by 840.9 km2 (−50.3%) and 95.5 km2 (−20.3%), respectively. Figure 4 illustrates the changes in the various classes in the wetland area over the 25-year study period.

3.3. Wetland Transition Analysis

The wetland transition statistics for the periods 1995/2002, 2002/2013, and 2013/2020 are illustrated in the Sankey diagram in Figure 5 and Tables S1–S3 (Supplementary Materials). The figure and tables indicate both the conversion of each individual class to another and the unchanged wetland category over the study period.
Between 1995 and 2002, 1104.6 km2 of rice fields/other crops, 286.7 km2 of sparse mangroves/saltmarshes, and 108.1 km2 of mangrove forests were converted into aquaculture ponds. The conversion resulted in the remarkable increase of approximately 1393.3 km2 (210.7%) in aquaculture pond area. Marine water bodies area gained 4.0 km2 (11.6%) due mostly to the conversion of 17.7 km2 of mangrove forests. Conversely, the area of sparse mangroves/saltmarshes and rice fields/other crops were significantly reduced, largely due to their conversions to aquaculture ponds (Figure 5, Table S1).
In the period 2002/2013, the area of marine water bodies increased by 33.5 km2 (86.6%), predominantly through conversion from mangrove forests. Over the same period, sparse mangroves/saltmarshes gained 87 km2 (22.7%) through the conversion of mangrove forests and aquaculture ponds. In contrast, forested wetland area decreased by 87.3 km2 (−14.5%) due to conversion into rice fields/other crops (Figure 5, Table S2).
Between 2013 and 2020, there was a conversion of 801.5 km2 of rice fields/other crops, 61.3 km2 of sparse mangroves/saltmarshes, 39.5 km2 of forested wetlands, and 25.1 of km2 mangrove forests into aquaculture ponds, resulting in aquaculture pond area increasing again by 859.7 km2 (41.3%). In contrast, the area of rice fields/other crops decreased by 840.9 km2 (−50.3%) with much of the conversion going into aquaculture ponds. Interestingly, 123.5 km2 of sparse mangroves/saltmarshes and 32.4 km2 of aquaculture ponds were converted to mangrove forests, and so contributed to an increase in mangrove forest areas by 11.8 km2 (2.1%) for this period (Figure 5, Table S3).

3.4. Sea Level Rise and Wetland Change Trends

Data on annual mean sea level in the west sea obtained from NCHMF, Vietnam, showed a rise in sea level of approximately 14 cm between 1995 and 2019. The trend of SLR in the study area from 1995 to 2019 is shown in Figure S1 (Supplementary Materials). Annual sea level for the year 2020 in the study area was predicted to be 15.02 cm above the Hon Dau 1992 datum based on the trend line. Figure 6 shows the correlation between the SLR and wetland class areas. The findings indicate that there is a strong correlation between SLR and expansion of marine water bodies (r = 0.9491) and aquaculture ponds (r = 0.9443); and a decrease in inland water bodies (r = −0.8934), mangrove forests (r = −0.8556), sparse mangrove/saltmarshes (r = −0.7546), forested wetlands (r = −0.9596), and rice fields/other crops (r = −0.9054). The findings suggest that SLR is one of the main drivers of the increases in marine water bodies and aquaculture ponds, at the expense of other wetland class types.

4. Discussion

4.1. Classification Accuracies and Uncertaincy

In the present study, overall accuracies of all classifications were above an acceptable threshold of 85% [81]. Although producer and user accuracies of a few classes were below 80%, the majority varied between 82.1–99.2%. These accuracies are considered satisfactory for this kind of study area with complex and diverse land feature categories [32].
Because of the unavailability of complete wetland data for the region, and to further validate our classified wetland maps, we compared our results with other studies of regions within the MD. Previous studies covered different areas and time periods, but nevertheless there is general agreement in the trends revealed for the four different wetland types, including sparse mangroves, mangrove forests, rice fields/other crops, and aquaculture. In particular, Hauser et al. [19] highlighted similar change trends for sparse mangroves and mangrove forests in Ngoc Hien, Ca Mau province, in the MD (Figure 7A). Similarly, rice fields/other crops and aquaculture ponds experienced consistent trends of reduction and increase, respectively, in the MD [35] (Figure 7B). Other studies [22,32,35,82] also concluded that substantial increases occurred in aquaculture areas in the MD, especially during the period 1995/2012, which were attributed to decreases in rice fields/other crops. Finally, Tran et al. [32] and Nguyen and Brunner [69] agreed with our findings that Melaleuca wetland forests in coastal zones in the MD decreased in area during the period 1995–2011.
The present study demonstrates an accurate classification approach according to the accuracy assessment and comparison with published literature; however, inaccuracies and errors in satellite image classification are unlikely to be completely avoided [28]. Seasonality issues in the study areas are likely to contribute to inaccuracies in image classifications. Phenological changes can cause changes in the spectral characteristics of vegetation, leading to difficulty in identifying and classifying samples. This difficulty is made greater because high cloud coverage conditions of the tropical climate make it difficult to properly calibrate the spectral signatures for all seasonal states. Among the human-made wetland categories, seasonal transitions between rice fields/other crops and aquaculture ponds in the same areas also contributed to categorisation error. Another driver of classification inaccuracies and errors was the spatial resolution of the remotely sensed data used. Although the image fusion technique used in this study can improve the classification accuracy, the medium resolution of Landsat images, especially Landsat TM (1995) which has a spatial resolution of 30 m, is likely to have reduced classification accuracy. This issue exacerbated the mixing of wetland classes, which have similar spectral signatures, such as mangroves, forested wetlands, and rice fields/other crops; and water bodies and aquaculture ponds [32,35].

4.2. Wetland Change Trends and Potential Driving Forces

4.2.1. Expansion of Marine Water Bodies

The expansion of marine water bodies suggests losses of coastal lands in the study area over the study period. Our findings indicate that the annual increase in the area of marine water bodies along the coast of the study area was 5.17% (1.79 km2) for the period 1995/2020. In their study, Tran Thi et al. [83] concluded that erosion in the east coast of Ca Mau province was significant with a mean rate of 33.24 m/year; conversely, land aggradation was substantial in the west sea area (the Gulf of Thailand) with a mean rate of 40.65 m/year. These results are consistent with the finding in this study of expansion of marine water bodies along the east coast of Ca Mau province, and its transformation into mangroves in the Gulf of Thailand side (Figure 3). Importantly, the highest annual increase in the area of marine water bodies was found during the period between 2002–2013 with 7.78%, which corresponds to a period of more rapid SLR, with the annual mean sea level having increased by 7 cm between 2010 and 2011. Thus, there is a correlation between SLR and expansion of marine water bodies into the inland (Figure 6), indicating that SLR is one of the main drivers of the increase in marine water bodies and the corresponding land loss along the coast. SLR is also likely to exacerbate coastal erosion, and so induce further land losses, especially at the fringe of mangrove forests along the coast of the MD [23,83].

4.2.2. Mangrove Forest Degradation/Deforestation

Mangrove forests in coastal zones of the MD have been decreasing over recent decades [84,85]. Our findings reveal that mangrove forests overall decreased by around −4.9% (–30 km2), resulting in an annual loss of —0.20% (–1.2 km2) for the period 1995/2020, which was relatively minor compared with the preceding decades [32,45,86]. For the period 2002/2013, the annual loss of mangrove forests was –0.41%, which is consistent with the findings of other studies in Ca Mau province in the MD over a similar period [43,87]. However, mangrove forests increased for the period 2013/2020, which is in agreement with Hauser et al. [19] (Figure 7A).
Past studies have concluded that one of the main causes for the loss of mangrove forests in the MD was the expansion of aquaculture practices [22,32,35]. These conclusions are supported by our findings, which showed most mangrove forest area loss resulted from conversion to aquaculture ponds (Figure 5 and Tables S1 and S2). Various regulations and policies, such as protection of remaining mangrove forest areas and integration of aquaculture practices and mangroves, were issued since 2006 to promote mangrove conservation in the MD [43,85,88]. The increase in mangrove forest area for the period 2013/2020 reported in this study suggests that these regulations and policies have been effective.
In addition to loss of area in absolute terms, fragmentation of mangrove forests due to aquaculture practices has also been identified as a considerable threat in the MD [35,43]. In the present study, the increase in sparse mangroves due to the conversion of mangrove forests reflected significant fragmentation of core mangrove forest zones, showing forest degradation in terms of canopy density. In particular, from 2002 to 2013, 120.9 km2 (20%) of mangrove forests were transferred into sparse mangroves, leading to an increase of 87% (223 km2) in sparse mangroves (Table S2). This finding corresponds well with the results of Hauser et al. [43], which indicated around 17% of mangrove forests in Ngoc Hien District, Ca Mau province in the MD were converted to sparse mangroves over the period 2004/2013. However, the present study found that from 2013–2020, a similar area of sparse mangrove forests were converted back to mangrove forests, thanks to rehabilitation of fragmented areas (Figure 3 and Figure 4, Table S3).
Our findings also show that another cause of mangrove forest loss was the expansion of marine water into forest areas along the eastern coast of Ca Mau province, and Kien Giang coast over the study period. SLR can directly inundate the land and exacerbate shoreline erosion, leading to the expansion of marine water into inland areas, and subsequently the loss of mangrove forests in the coastal zones in the MD [22,83,89]. According to our results, 63.9 km2 (10.5%) of coastal fringe mangrove forests was converted to marine waters over the period 1995/2020. Our correlation analysis also shows a relationship between the decrease in mangrove forests and SLR (Figure 6). Therefore, SLR can be considered as one of the main drivers for the loss of coastal fringe mangrove forests [23,90]. However, importantly, the spatial pattern of mangrove loss varies across the study area because the influence of SLR is modified by coastal geomorphological processes. These processes result in substantial net loss of mangroves along the East Sea shoreline, where wave energy is high, and gains in mangrove area along the Gulf of Thailand where sediment supply is high and wave energy is low [91,92]. The sediment supplied to the Gulf of Thailand coast is derived from the erosion of the east sea shoreline. These sediments are then delivered by strong long-shore drift associated with wave refraction around Ca Mau Cape [83,91,92]. This process results in sediment accumulating in the Gulf of Thailand, aided by the mangroves themselves, which help to trap sediments, at a mean rate of 30 mg/L (May–October) and 70–80 mg/L (November–April) [83]. These aggraded lands support the growth of natural mangrove forests in this area.
Climate change is also likely to be contributing to mangrove loss directly through its effect in reducing annual precipitation and increasing seasonal variation in precipitation. In combination with increases in temperature, these changes can cause moisture stress, which can reduce seedling survival, growth rates, and productivity, contributing to reductions in mangrove area [2,93,94,95]. Climate change predictions are also for more extreme events such as floods, droughts, heat waves, and storms, all of which can also negatively impact mangrove communities [2]. This combination of climate changes is predicted to substantially reduce the area of suitable mangrove habitat in the future [40]. Other factors likely to have contributed to the decrease in mangroves in the MD include rice cultivation, wood extraction, and coastal industrialization [32,96].

4.2.3. Reduction of Forested Wetlands

The present study also found that the area of forested wetlands continuously declined over the study period, with the annual loss rate of −1.27% (−7.90 km2). These loss rates exceed the rates recorded for the MD in previous studies. For example, in the current study, 0.91% of Melaleuca forest wetlands were lost between 1995 and 2013; in contrast, over a similar period (1995–2011), Tran et al. [32] recorded only a 0.31% reduction in the area of Melaleuca forest. This contrast can be attributed to different areas covered in the respective studies, with the lower rates of loss in Tran et al. [32] reflecting the higher proportion of land in that study being within protected reserves.
Our findings show that the expansion of paddy rice cultivation and aquaculture practices were the key drivers of forested wetland loss. The classified wetland maps reveal that most of the forested wetlands outside of national parks and other conservation reserves, including in buffer zones surrounding these protected areas, were converted into rice fields/other crops and aquaculture ponds (Figure 3). This finding is consistent with previous studies that have shown that the intensification of agriculture activities, especially rice cultivation and its associated extensive network of irrigation canals, and aquaculture practices, have significantly reduced the area of forested wetlands, in particular Melaleuca forests in the MD [35,97,98].
Another important driver of the loss of forested wetlands over the study period was forest fire, which severely affects the Melaleuca forests in the U Minh Thuong and U Minh Ha national parks [99,100,101,102]. Catastrophic fires have removed significant Melaleuca forest area in the core zone of the two national parks. The most severe fires in U Minh Thuong and U Minh Ha in 2002 cleared 2,800 ha (90%) and 3,300 ha, respectively [103]. Fires destroyed and replaced the forested wetland areas with water bodies where the regeneration of forests was postponed. This corresponds to our results which show that some core-forested wetland areas in the U Minh wetlands were converted to inland water bodies (Figure 3 and Figure 5). SLR was also identified as another potential indirect driver for forested wetland loss according to the correlation analysis in the present study (Figure 6). SLR not only results in permanent inundation areas, but also induces saltwater intrusion into peatland forest areas, thus leading to forested wetland loss [102,104]. As is the case with the mangrove forest, climate change, which notably increases extreme temperature and rainfall events and prolonged droughts, is thought to have contributed to reduced area of forested wetlands, especially Melaleuca forests, in the region [100,105], with predictions that these losses will continue in the future with ongoing climate change [40].

4.2.4. Increase in Aquaculture Ponds

One of the most striking patterns revealed in this study was the dramatic increase in aquaculture ponds in the MD over recent decades. This increase was consistent over the period 1995/2020 with an annual increase rate of 13.8% (91.26 km2). The greatest increase occurred from 1995 to 2002 (Figure 4), which corresponds to the aquaculture boom periods suggested by other studies [22,32,35,82]. The substantial conversions of rice fields/other crops and mangrove forests into aquaculture ponds identified in the present study area have been matched in other regions in the MD [22,32,35,82,106,107]. The conversion to aquaculture ponds is driven by the response to saltwater intrusion, aided by policies and economics, both of which encourage the practice [32]. The problem of saltwater intrusion, in turn, is caused by a range of factors such as low-lying positions, high tidal fluctuations in the East Sea, high density of canals and river networks, and SLR [89,108]; however, the acceleration in recent years is due to SLR [109,110]. SLR can therefore be considered as a key distal driver of the expansion of aquaculture ponds in the MD [32]. This is in agreement with our findings that showed SLR to be strongly correlated with the increase in aquaculture pond area (Figure 6).

4.2.5. Decrease in Rice Fields/Other Crops

There was a consistent decrease in rice fields/other crops in the study area over the period 1995/2020, with an annual decrease rate of −2.9% (−88.2 km2). Most of this reduction was due to replacement by aquaculture ponds, which is consistent with the findings in other regions of the MD [22,32,35,82,106,107]. SLR can affect rice fields/other crops by not only directly inundating these areas [111,112], but also causing saltwater intrusion [105,112,113,114]. Other factors including hydrological regime changes due to climate change, SLR, and dam construction have been reducing the viability of some areas for rice cultivation [82,110], and this problem is projected to be exacerbated under future climate/SLR scenarios [105,109,115]. Some reductions in the area of rice fields in the MD are likely to have been caused by expansion of urban area [32,35,96,107,116].

4.3. Implications of the Wetland Changes on Ecosystems and Sustainability

Changes in wetland extent due to expansion of marine waters and aquaculture ponds at the expense of forest wetlands and paddy fields are likely to significantly affect ecosystem services and sustainable development in the region. Mangrove loss is particularly critical in the context of ongoing SLR given the capacity of mangrove communities to buffer against shoreline erosion and storm surges [90,117,118,119]. More broadly, mangrove loss and fragmentation of mangrove forests is likely to reduce the quality of coastal water and habitats for marine species that are directly or indirectly relied upon as fisheries by coastal communities [90,120,121,122]. In the case of the inland Melaleuca forested wetlands, the loss of these wetlands is likely to increase peatland erosion, subsequently reducing important functions of the forest ecosystem, such as water regulation (i.e., storage and provision of fresh water, prevention of floods due to storm surges and heavy rainfall) and prevention of acid sulphate soil formation [104].
Substantial reductions in rice field area by their conversion into aquaculture ponds also has consequences for ecosystem functioning in the MD. Rice fields provide critical ecosystem services, including balance and purification of the water resources, and provision of habitats for flora and fauna [123,124,125,126], in addition to the obvious service of rice production. The increase in aquaculture ponds is in part a response to saltwater intrusion and these areas can thus be regarded as providing an important ecosystem service in relation to mitigating the impact of saltwater intrusion. However, it is likely that aquaculture practices in response to the problem of saltwater intrusion will not be a sustainable solution in the long-term because the practices remove the critical wetlands and their associated ecosystem services in the region. It is also the case that aquaculture practices can cause pollution of freshwater resources in the region [127,128]. Integrated mangrove–shrimp, rice–fish models have been recently recognised as better solutions for long-term sustainable development, in which preservation of mangrove ecosystems and enhancement of related rice field ecosystems will be achieved [88,129,130].

5. Conclusions

The present study used Landsat images to map wetland types and analyse changes in wetland area in the south-west coastal region of the Mekong Delta, Vietnam, over the period of 1995–2020. A hybrid classification approach, which was developed for image classification, was found to be an acceptable and effective method (with overall accuracy ranges of 86.7–93.3%) for wetland mapping and detecting changes in wetland area. The main changes detected during the study period included: a consistent increase in marine water bodies/shoreline erosion; decreases in the area of wetland forests (mangroves and forested wetlands) and rice fields/other crops; and a remarkable increase in the area of aquaculture ponds. Our study showed that the significant increase in aquaculture ponds was at the expense of mangrove forests, rice fields/other crops, and forested wetlands. Shoreline erosion was also important, critically affecting coastal lands, especially mangrove forests. SLR was identified as one of the underlying main drivers of changes in wetland area in the study region; however, rapid changes in the wetland areas were also directly driven by policies on land-use for economic development. These trends in wetland area, combined with the escalation of SLR, potentially affect the environment, regional and national food security, and the livelihood of communities in the region in the long-term, and therefore negatively affect sustainable development.
Our findings provide valuable and comprehensive insight into wetland dynamics and the potential drivers of changes in important wetlands in the MD over the past 25 years. The escalation of climate change, especially SLR in combination with the increasing pressure of human activities are likely to be considerable challenges for the sustainability of wetland ecosystems, natural resources, and regional development, as well as food security. Valuable knowledge on the changes and their potential drivers combined with a critical basic dataset obtained from our findings will assist essential environmental assessments, and design of appropriate management strategies, policies, and practices for wetland protection and conservation, food security, and sustainable development of the region.

Supplementary Materials

The following are available online at https://www.mdpi.com/article/10.3390/rs13173359/s1, Formula S1: Conversion of DN images (Landsat 8 OLI) to surface reflectance images, Table S1: Wetland transition statistics (1995–2002), Table S2: Wetland transition statistics (2002–2013), Table S3: Wetland transition statistics (2013–2020), and Figure S1: Sea level trend in the west sea of the Mekong Delta, Vietnam (1995–2019).

Author Contributions

Conceptualization, A.T.N.D., L.K., M.R. and H.N.; methodology, A.T.N.D., L.K., M.R. and H.N.; software, A.T.N.D.; validation, A.T.N.D. and H.N.; formal analysis, A.T.N.D.; supervision, L.K. and M.R.; writing—original draft preparation, A.T.N.D.; writing—review and editing, M.R., L.K., and H.N.; funding acquisition, L.K. All authors have read and agreed to the published version of the manuscript.

Funding

This research received no external funding.

Institutional Review Board Statement

Not applicable.

Informed Consent Statement

Not applicable.

Data Availability Statement

Not applicable.

Acknowledgments

The authors are thankful to the University of New England in Australia for providing postgraduate research support to the first author. We also gratefully acknowledge the Ministry of Natural Resources and Environment, Vietnam, the National Centre for Hydro—Meteorological Forecasting, Vietnam, the Department of Natural Resources and Environment of Ca Mau and Kien Giang provinces, and the United States Geological Survey for data support.

Conflicts of Interest

The authors declare no conflict of interest.

References

  1. Guo, M.; Li, J.; Sheng, C.; Xu, J.; Wu, L. A review of wetland remote sensing. Sensors 2017, 17, 777. [Google Scholar] [CrossRef] [Green Version]
  2. Salimi, S.; Almuktar, S.A.; Scholz, M. Impact of climate change on wetland ecosystems: A critical review of experimental wetlands. J. Environ. Manag. 2021, 286, 112160. [Google Scholar] [CrossRef] [PubMed]
  3. Clarkson, B.R.; Ausseil, A.-G.E.; Gerbeaux, P. Wetland ecosystem services. In Ecosystem Services in New Zealand: Conditions and Trends; Manaaki Whenua Press: Lincoln, New Zealand, 2013; pp. 192–202. [Google Scholar]
  4. Scholz, M.; Lee, B.H. Constructed wetlands: A review. Int. J. Environ. Stud. 2005, 62, 421–447. [Google Scholar] [CrossRef]
  5. Mitsch, W.J.; Gosselink, J.G.; Zhang, L.; Anderson, C.J. Wetland Ecosystems; John Wiley & Sons: Hoboken, NJ, USA, 2009. [Google Scholar]
  6. Almuktar, S.A.; Abed, S.N.; Scholz, M. Wetlands for wastewater treatment and subsequent recycling of treated effluent: A review. Environ. Sci. Pollut. Res. 2018, 25, 23595–23623. [Google Scholar] [CrossRef] [PubMed] [Green Version]
  7. Mitsch, W.J.; Bernal, B.; Nahlik, A.M.; Mander, Ü.; Zhang, L.; Anderson, C.J.; Jørgensen, S.E.; Brix, H. Wetlands, carbon, and climate change. Landsc. Ecol. 2013, 28, 583–597. [Google Scholar] [CrossRef]
  8. Scholz, M.; Hedmark, Å. Constructed wetlands treating runoff contaminated with nutrients. Water Air Soil Pollut. 2010, 205, 323–332. [Google Scholar] [CrossRef]
  9. Davidson, N.C. How much wetland has the world lost? Long-term and recent trends in global wetland area. Mar. Freshw. Res. 2014, 65, 934–941. [Google Scholar] [CrossRef]
  10. Orimoloye, I.R.; Kalumba, A.M.; Mazinyo, S.P.; Nel, W. Geospatial analysis of wetland dynamics: Wetland depletion and biodiversity conservation of Isimangaliso Wetland, South Africa. J. King Saud Univ. Sci. 2020, 32, 90–96. [Google Scholar] [CrossRef]
  11. Akumu, C.E.; Pathirana, S.; Baban, S.; Bucher, D. Monitoring coastal wetland communities in north-eastern NSW using ASTER and Landsat satellite data. Wetl. Ecol. Manag. 2010, 18, 357–365. [Google Scholar] [CrossRef]
  12. Jin, H.; Huang, C.; Lang, M.W.; Yeo, I.-Y.; Stehman, S.V. Monitoring of wetland inundation dynamics in the Delmarva Peninsula using Landsat time-series imagery from 1985 to 2011. Remote Sens. Environ. 2017, 190, 26–41. [Google Scholar] [CrossRef] [Green Version]
  13. Park, N.-W.; Chi, K.-H.; Kwon, B.-D. Geostatistical integration of spectral and spatial information for land-cover mapping using remote sensing data. Geosci. J. 2003, 7, 335. [Google Scholar] [CrossRef]
  14. Ozesmi, S.L.; Bauer, M.E. Satellite remote sensing of wetlands. Wetl. Ecol. Manag. 2002, 10, 381–402. [Google Scholar] [CrossRef]
  15. Orimoloye, I.R.; Mazinyo, S.P.; Kalumba, A.; Nel, W.; Adigun, A.I.; Ololade, O.O. Wetland shift monitoring using remote sensing and GIS techniques: Landscape dynamics and its implications on Isimangaliso Wetland Park, South Africa. Earth Sci. Inform. 2019, 12, 553–563. [Google Scholar] [CrossRef]
  16. Hemba, S.; Iortyom, E.T.; Ropo, O.I.; Daniel, D.P. Analysis of the physical growth and expansion of Makurdi Town using remote sensing and GIS techniques. Imperial. J. Interdiscip. Res. 2017, 3, 821–827. [Google Scholar]
  17. Abdelaziz, R.; Abd El-Rahman, Y.; Wilhelm, S. Landsat-8 data for chromite prospecting in the Logar Massif, Afghanistan. Heliyon 2018, 4, e00542. [Google Scholar] [CrossRef] [Green Version]
  18. Son, N.-T.; Chen, C.-F.; Chang, N.-B.; Chen, C.-R.; Chang, L.-Y.; Thanh, B.-X. Mangrove mapping and change detection in Ca Mau Peninsula, Vietnam, using Landsat data and object-based image analysis. IEEE J. Sel. Top. Appl. Earth Obs. Remote Sens. 2014, 8, 503–510. [Google Scholar] [CrossRef]
  19. Hauser, L.T.; An Binh, N.; Viet Hoa, P.; Hong Quan, N.; Timmermans, J. Gap-Free Monitoring of Annual Mangrove Forest Dynamics in Ca Mau Province, Vietnamese Mekong Delta, Using the Landsat-7-8 Archives and Post-Classification Temporal Optimization. Remote Sens. 2020, 12, 3729. [Google Scholar] [CrossRef]
  20. Schaffer-Smith, D.; Swenson, J.J.; Barbaree, B.; Reiter, M.E. Three decades of Landsat-derived spring surface water dynamics in an agricultural wetland mosaic; Implications for migratory shorebirds. Remote Sens. Environ. 2017, 193, 180–192. [Google Scholar] [CrossRef] [Green Version]
  21. Reschke, J.; Hüttich, C. Continuous field mapping of Mediterranean wetlands using sub-pixel spectral signatures and multi-temporal Landsat data. Int. J. Appl. Earth Obs. Geoinf. 2014, 28, 220–229. [Google Scholar] [CrossRef]
  22. Veettil, B.K.; Quang, N.X.; Trang, N.T.T. Changes in mangrove vegetation, aquaculture and paddy cultivation in the Mekong Delta: A study from Ben Tre Province, southern Vietnam. Estuar. Coast. Shelf Sci. 2019, 226, 106273. [Google Scholar] [CrossRef]
  23. Nguyen, H.-H.; McAlpine, C.; Pullar, D.; Johansen, K.; Duke, N.C. The relationship of spatial–temporal changes in fringe mangrove extent and adjacent land-use: Case study of Kien Giang coast, Vietnam. Ocean. Coast. Manag. 2013, 76, 12–22. [Google Scholar] [CrossRef]
  24. Lu, D.; Mausel, P.; Brondizio, E.; Moran, E. Change detection techniques. Int. J. Remote Sens. 2004, 25, 2365–2401. [Google Scholar] [CrossRef]
  25. Zhang, S.Q.; Zhang, S.K.; Zhang, J.Y. A study on wetland classification model of remote sensing in the Sangjiang Plain. Chin. Geogr. Sci. 2000, 10, 68–73. [Google Scholar] [CrossRef]
  26. Al-Doski, J.; Mansorl, S.B.; Shafri, H.Z.M. Image classification in remote sensing. Dep. Civ. Eng. Fac. Eng. Univ. Putra Malays. 2013, 3, 141–147. [Google Scholar]
  27. Kogo, B.K.; Kumar, L.; Koech, R. Analysis of spatio-temporal dynamics of land use and cover changes in Western Kenya. Geocarto Int. 2021, 36, 376–391. [Google Scholar] [CrossRef]
  28. Langat, P.K.; Kumar, L.; Koech, R.; Ghosh, M.K. Monitoring of land use/land-cover dynamics using remote sensing: A case of Tana River Basin, Kenya. Geocarto Int. 2019, 36, 1470–1488. [Google Scholar] [CrossRef]
  29. Tadese, M.; Kumar, L.; Koech, R.; Kogo, B.K. Mapping of land-use/land-cover changes and its dynamics in Awash River Basin using remote sensing and GIS. Remote Sens. Appl. Soc. Environ. 2020, 19, 100352. [Google Scholar]
  30. Kariyawasam, C.S.; Kumar, L.; Kogo, B.K.; Ratnayake, S.S. Long-Term Changes of Aquatic Invasive Plants and Implications for Future Distribution: A Case Study Using a Tank Cascade System in Sri Lanka. Climate 2021, 9, 31. [Google Scholar] [CrossRef]
  31. Chhogyel, N.; Kumar, L.; Bajgai, Y. Spatio-temporal landscape changes and the impacts of climate change in mountainous Bhutan: A case of Punatsang Chhu Basin. Remote Sens. Appl. Soc. Environ. 2020, 18, 100307. [Google Scholar] [CrossRef]
  32. Tran, H.; Tran, T.; Kervyn, M. Dynamics of land cover/land use changes in the Mekong Delta, 1973–2011: A remote sensing analysis of the Tran Van Thoi District, Ca Mau Province, Vietnam. Remote Sens. 2015, 7, 2899–2925. [Google Scholar] [CrossRef] [Green Version]
  33. Owojori, A.; Xie, H. Landsat image-based LULC changes of San Antonio, Texas using advanced atmospheric correction and object-oriented image analysis approaches. In Proceedings of the 5th International Symposium on Remote Sensing of Urban Areas, Tempe, AZ, USA, 14–16 March 2005. [Google Scholar]
  34. Campbell, I.C. Biodiversity of the Mekong Delta. In The Mekong Delta System; Springer: Dordrecht, The Netherlands, 2012; pp. 293–313. ISBN 978-94-007-3962-8. [Google Scholar]
  35. Liu, X.; Chen, D.; Duan, Y.; Ji, H.; Zhang, L.; Chai, Q.; Hu, X. Understanding Land use/Land cover dynamics and impacts of human activities in the Mekong Delta over the last 40 years. Glob. Ecol. Conserv. 2020, 22, e00991. [Google Scholar] [CrossRef]
  36. VNEPA (Viet Nam Environment Protection Agency). Overview of Wetlands Status in Viet Nam Following 15 Years of Ramsar Convention Implementation; IUCN Vietnam: Hanoi, Vietnam, 2005. Available online: https://portals.iucn.org/library/sites/library/files/documents/2005-105.pdf (accessed on 10 January 2021).
  37. Funkenberg, T.; Binh, T.T.; Moder, F.; Dech, S. The Ha Tien Plain–wetland monitoring using remote-sensing techniques. Int. J. Remote Sens. 2014, 35, 2893–2909. [Google Scholar] [CrossRef] [Green Version]
  38. Nguyen, T.T.; Woodroffe, C.D. Assessing relative vulnerability to sea-level rise in the western part of the Mekong River Delta in Vietnam. Sustain. Sci. 2016, 11, 645–659. [Google Scholar] [CrossRef]
  39. Tessler, Z.D.; Vörösmarty, C.J.; Grossberg, M.; Gladkova, I.; Aizenman, H. A global empirical typology of anthropogenic drivers of environmental change in deltas. Sustain. Sci. 2016, 11, 525–537. [Google Scholar] [CrossRef] [PubMed] [Green Version]
  40. Dang, A.T.N.; Kumar, L.; Reid, M.; Anh, L.N.T. Modelling the susceptibility of wetland plant species under climate change in the Mekong Delta, Vietnam. Ecol. Inform. 2021, 64, 101358. [Google Scholar] [CrossRef]
  41. Leinenkugel, P.; Kuenzer, C.; Oppelt, N.; Dech, S. Characterisation of land surface phenology and land cover based on moderate resolution satellite data in cloud prone areas—A novel product for the Mekong Basin. Remote Sens. Environ. 2013, 136, 180–198. [Google Scholar] [CrossRef]
  42. Hong, H.T.C.; Avtar, R.; Fujii, M. Monitoring changes in land use and distribution of mangroves in the southeastern part of the Mekong River Delta, Vietnam. Trop. Ecol. 2019, 60, 552–565. [Google Scholar] [CrossRef]
  43. Hauser, L.T.; Vu, G.N.; Nguyen, B.A.; Dade, E.; Nguyen, H.M.; Nguyen, T.T.Q.; Le, T.Q.; Vu, L.H.; Tong, A.T.H.; Pham, H.V. Uncovering the spatio-temporal dynamics of land cover change and fragmentation of mangroves in the Ca Mau peninsula, Vietnam using multi-temporal SPOT satellite imagery (2004–2013). Appl. Geogr. 2017, 86, 197–207. [Google Scholar] [CrossRef]
  44. Tue, N.T.; Dung, L.V.; Nhuan, M.T.; Omori, K. Carbon storage of a tropical mangrove forest in Mui Ca Mau National Park, Vietnam. Catena 2014, 121, 119–126. [Google Scholar] [CrossRef]
  45. Van, T.; Wilson, N.; Thanh-Tung, H.; Quisthoudt, K.; Quang-Minh, V.; Xuan-Tuan, L.; Dahdouh-Guebas, F.; Koedam, N. Changes in mangrove vegetation area and character in a war and land use change affected region of Vietnam (Mui Ca Mau) over six decades. Acta Oecologica 2015, 63, 71–81. [Google Scholar] [CrossRef] [Green Version]
  46. Khanh, P.; Subasinghe, S. Identification of vegetation change of Lower U Minh National Park of Vietnam from 1975 to 2015. J. Trop. For. Environ. 2017, 7, 10–20. [Google Scholar] [CrossRef] [Green Version]
  47. Loc, H.H.; Diep, N.T.H.; Tuan, V.T.; Shimizu, Y. An analytical approach in accounting for social values of ecosystem services in a Ramsar site: A case study in the Mekong Delta, Vietnam. Ecol. Indic. 2018, 89, 118–129. [Google Scholar] [CrossRef]
  48. Bruce, C.M.; Hilbert, D.W. Pre-Processing Methodology for Application to Landsat TM/ETM+ Imagery of the Wet Tropics; Rainforest CRC: Cairns, Australia, 2006. [Google Scholar]
  49. Song, C.; Woodcock, C.E.; Seto, K.C.; Lenney, M.P.; Macomber, S.A. Classification and change detection using Landsat TM data: When and how to correct atmospheric effects? Remote Sens. Environ. 2001, 75, 230–244. [Google Scholar] [CrossRef]
  50. Gupta, K.; Mukhopadhyay, A.; Giri, S.; Chanda, A.; Majumdar, S.D.; Samanta, S.; Mitra, D.; Samal, R.N.; Pattnaik, A.K.; Hazra, S. An index for discrimination of mangroves from non-mangroves using LANDSAT 8 OLI imagery. MethodsX 2018, 5, 1129–1139. [Google Scholar] [CrossRef] [PubMed]
  51. Lillesand, T.; Kiefer, R.W.; Chipman, J. Remote Sensing and Image Interpretation; John Wiley & Sons: Hoboken, NJ, USA, 2015. [Google Scholar]
  52. USGS. Landsat 8 (L8) Data Users Handbook Version 2.0; EROS: Sioux Falls, SD, USA, 2016.
  53. Jianya, G.; Haigang, S.; Guorui, M.; Qiming, Z. A review of multi-temporal remote sensing data change detection algorithms. Int. Arch. Photogramm. Remote Sens. Spat. Inf. Sci. 2008, 37, 757–762. [Google Scholar]
  54. Lhissou, R.; El Harti, A.; Maimouni, S.; Adiri, Z. Assessment of the image-based atmospheric correction of multispectral satellite images for geological mapping in arid and semi-arid regions. Remote Sens. Appl. Soc. Environ. 2020, 20, 100420. [Google Scholar]
  55. Nazeer, M.; Nichol, J.E.; Yung, Y.-K. Evaluation of atmospheric correction models and Landsat surface reflectance product in an urban coastal environment. Int. J. Remote Sens. 2014, 35, 6271–6291. [Google Scholar] [CrossRef]
  56. Gilmore, S.; Saleem, A.; Dewan, A. Effectiveness of DOS (Dark-Object Subtraction) method and water index techniques to map wetlands in a rapidly urbanising megacity with Landsat 8 data. In Proceedings of the Research@Locate in Conjunction with the Annual Conference of Spatial Information in Australia and New Zealand, Brisbane, QLD, Australia, 10–12 March 2015; pp. 100–108. [Google Scholar]
  57. Kok, Z.H.; Shariff, A.R.B.M.; Khairunniza-Bejo, S.; Kim, H.-T.; Ahamed, T.; Cheah, S.S.; Wahid, S.A.A. Plot-Based Classification of Macronutrient Levels in Oil Palm Trees with Landsat-8 Images and Machine Learning. Remote Sens. 2021, 13, 2029. [Google Scholar] [CrossRef]
  58. Ngo Thi, D.; Ha, N.T.T.; Tran Dang, Q.; Koike, K.; Mai Trong, N. Effective Band ratio of landsat 8 images based on VNIR-SWIR reflectance spectra of topsoils for soil moisture mapping in a tropical region. Remote Sens. 2019, 11, 716. [Google Scholar] [CrossRef] [Green Version]
  59. Ehlers, M.; Klonus, S.; Johan Åstrand, P.; Rosso, P. Multi-sensor image fusion for pansharpening in remote sensing. Int. J. Image Data Fusion 2010, 1, 25–45. [Google Scholar] [CrossRef]
  60. Zhang, Y. Understanding image fusion. Photogramm. Eng. Remote Sens. 2004, 70, 657–661. [Google Scholar]
  61. Kumar, L.; Sinha, P.; Taylor, S. Improving image classification in a complex wetland ecosystem through image fusion techniques. J. Appl. Remote Sens. 2014, 8, 083616. [Google Scholar] [CrossRef] [Green Version]
  62. Yang, Y.; Wan, W.; Huang, S.; Lin, P.; Que, Y. A novel pan-sharpening framework based on matting model and multiscale transform. Remote Sens. 2017, 9, 391. [Google Scholar] [CrossRef] [Green Version]
  63. Khan, S.S.; Ran, Q.; Khan, M. Image pan-sharpening using enhancement based approaches in remote sensing. Multimed. Tools Appl. 2020, 79, 32791–32805. [Google Scholar] [CrossRef]
  64. Xu, H.; Le, Z.; Huang, J.; Ma, J. A Cross-Direction and Progressive Network for Pan-Sharpening. Remote Sens. 2021, 13, 3045. [Google Scholar] [CrossRef]
  65. Pesántez-Cobos, P.; Cánovas-García, F.; Alonso-Sarría, F. Implementing and Validating of Pan-Sharpening Algorithms in Open-Source Software. In Image and Signal Processing for Remote Sensing XXIII; International Society for Optics and Photonics: Bellingham, WA, USA, 2017. [Google Scholar]
  66. Pushparaj, J.; Hegde, A.V. Comparison of various pan-sharpening methods using Quickbird-2 and Landsat-8 imagery. Arab. J. Geosci. 2017, 10, 119. [Google Scholar] [CrossRef]
  67. Zhang, H.K.; Roy, D.P. Computationally inexpensive Landsat 8 operational land imager (OLI) pansharpening. Remote Sens. 2016, 8, 180. [Google Scholar] [CrossRef] [Green Version]
  68. Davis, T.J. The Ramsar Convention Manual: A Guide to the Convention on Wetlands of International Importance Especially as Waterfowl Habitat; Ramsar Convention Bureau: Gland, Switzerland, 1994. [Google Scholar]
  69. Nguyen, H.Q.; Brunner, J. Land Cover Change Assessment in the Coastal Areas of the Mekong Delta 2004–2009; IUCN: Hanoi, Vietnam, 2011; p. 13. [Google Scholar]
  70. Huete, A.R. A soil-adjusted vegetation index (SAVI). Remote Sens. Environ. 1988, 25, 295–309. [Google Scholar] [CrossRef]
  71. Gao, B.-C. NDWI—A normalized difference water index for remote sensing of vegetation liquid water from space. Remote Sens. Environ. 1996, 58, 257–266. [Google Scholar] [CrossRef]
  72. Pearson, R.L.; Miller, L.D. Remote mapping of standing crop biomass for estimation of the productivity of the shortgrass prairie. Remote Sens. Environ. 1972, VIII, 1355. [Google Scholar]
  73. Kuenzer, C.; Bluemel, A.; Gebhardt, S.; Quoc, T.V.; Dech, S. Remote sensing of mangrove ecosystems: A review. Remote Sens. 2011, 3, 878–928. [Google Scholar] [CrossRef] [Green Version]
  74. Wang, L.; Sousa, W.; Gong, P. Integration of object-based and pixel-based classification for mapping mangroves with IKONOS imagery. Int. J. Remote Sens. 2004, 25, 5655–5668. [Google Scholar] [CrossRef]
  75. Green, E.; Clark, C.; Mumby, P.; Edwards, A.; Ellis, A. Remote sensing techniques for mangrove mapping. Int. J. Remote Sens. 1998, 19, 935–956. [Google Scholar] [CrossRef]
  76. Gao, J.; Liu, Y. Determination of land degradation causes in Tongyu County, Northeast China via land cover change detection. Int. J. Appl. Earth Obs. Geoinf. 2010, 12, 9–16. [Google Scholar] [CrossRef]
  77. Muriithi, F.K. Land use and land cover (LULC) changes in semi-arid sub-watersheds of Laikipia and Athi River basins, Kenya, as influenced by expanding intensive commercial horticulture. Remote Sens. Appl. Soc. Environ. 2016, 3, 73–88. [Google Scholar] [CrossRef]
  78. Rosenfield, G.H.; Fitzpatrick-Lins, K. A coefficient of agreement as a measure of thematic classification accuracy. Photogramm. Eng. Remote Sens. 1986, 52, 223–227. [Google Scholar]
  79. Sinha, P.; Kumar, L. Independent two-step thresholding of binary images in inter-annual land cover change/no-change identification. ISPRS J. Photogramm. Remote Sens. 2013, 81, 31–43. [Google Scholar] [CrossRef]
  80. Ahlgren, P.; Jarneving, B.; Rousseau, R. Requirements for a cocitation similarity measure, with special reference to Pearson’s correlation coefficient. J. Am. Soc. Inf. Sci. Technol. 2003, 54, 550–560. [Google Scholar] [CrossRef]
  81. Anderson, J.R. A Land Use and Land Cover Classification System for Use with Remote Sensor Data; US Government Printing Office: Washington, DC, USA, 1976; Volume 964.
  82. Le, T.N.; Bregt, A.K.; van Halsema, G.E.; Hellegers, P.J.; Nguyen, L.-D. Interplay between land-use dynamics and changes in hydrological regime in the Vietnamese Mekong Delta. Land Use Policy 2018, 73, 269–280. [Google Scholar] [CrossRef] [Green Version]
  83. Tran Thi, V.; Tien Thi Xuan, A.; Phan Nguyen, H.; Dahdouh-Guebas, F.; Koedam, N. Application of remote sensing and GIS for detection of long-term mangrove shoreline changes in Mui Ca Mau, Vietnam. Biogeosciences 2014, 11, 3781–3795. [Google Scholar] [CrossRef] [Green Version]
  84. Veettil, B.K.; Ward, R.D.; Quang, N.X.; Trang, N.T.T.; Giang, T.H. Mangroves of Vietnam: Historical development, current state of research and future threats. Estuar. Coast. Shelf Sci. 2019, 218, 212–236. [Google Scholar] [CrossRef]
  85. Truong, T.D.; Do, L.H. Mangrove forests and aquaculture in the Mekong river delta. Land Use Policy 2018, 73, 20–28. [Google Scholar] [CrossRef]
  86. Friess, D.A. Mangrove forests. Curr. Biol. 2016, 26, R746–R748. [Google Scholar] [CrossRef] [Green Version]
  87. McEwin, A.; McNally, R. Organic Shrimp Certification and Carbon Financing: An Assessment for the Mangroves and Markets Project in Ca Mau Province, Vietnam. Available online: http://www.snv.org/public/cms/sites/default/files/explore/download/140007_mangrove_shrimp_report_single-lr.pdf (accessed on 20 December 2020).
  88. Baumgartner, U.; Kell, S.; Nguyen, T.H. Arbitrary mangrove-to-water ratios imposed on shrimp farmers in Vietnam contradict with the aims of sustainable forest management. SpringerPlus 2016, 5, 1–10. [Google Scholar] [CrossRef] [Green Version]
  89. Carew-Reid, J. Rapid Assessment of the Extent and Impact of Sea Level Rise in Viet Nam; International Centre for Environment Management (ICEM): Brisbane, QLD, Australia, 2008; Available online: http://www.icem.com.au/documents/climatechange/icem_slr/ICEM_SLR_final_report.pdf (accessed on 8 January 2021).
  90. Gilman, E.; Ellison, J.; Coleman, R. Assessment of mangrove response to projected relative sea-level rise and recent historical reconstruction of shoreline position. Environ. Monit. Assess. 2007, 124, 105–130. [Google Scholar] [CrossRef] [PubMed]
  91. Marchesiello, P.; Nguyen, N.M.; Gratiot, N.; Loisel, H.; Anthony, E.J.; San Dinh, C.; Nguyen, T.; Almar, R.; Kestenare, E. Erosion of the coastal Mekong delta: Assessing natural against man induced processes. Cont. Shelf Res. 2019, 181, 72–89. [Google Scholar] [CrossRef]
  92. Phan, H. Coastal and Seasonal Hydrodynamics and Morphodynamics of the Mekong Delta. Ph.D. Thesis, Delft University of Technology, Delft, The Netherlands, 2020. [Google Scholar] [CrossRef]
  93. Duke, N.; Ball, M.; Ellison, J. Factors influencing biodiversity and distributional gradients in mangroves. Glob. Ecol. Biogeogr. Lett. 1998, 7, 27–47. [Google Scholar] [CrossRef] [Green Version]
  94. Ellison, J.C. How South Pacific mangroves may respond to predicted climate change and sea-level rise. In Climate Change in the South Pacific: Impacts and Responses in Australia, New Zealand, and Small Island States; Springer: Dordrecht, The Netherlands, 2000; pp. 289–300. [Google Scholar]
  95. Krauss, K.W.; Lovelock, C.E.; McKee, K.L.; López-Hoffman, L.; Ewe, S.M.; Sousa, W.P. Environmental drivers in mangrove establishment and early development: A review. Aquat. Bot. 2008, 89, 105–127. [Google Scholar] [CrossRef]
  96. Tran, T.V.; Tran, D.X.; Nguyen, H.; Latorre-Carmona, P.; Myint, S.W. Characterising spatiotemporal vegetation variations using LANDSAT time-series and Hurst exponent index in the Mekong River Delta. Land Degrad. Dev. 2021, 32, 3507–3523. [Google Scholar] [CrossRef]
  97. Quan, N.H.; Toan, T.Q.; Dang, P.D.; Phuong, N.L.; Anh, T.T.H.; Quang, N.X.; Quoc, D.P.; Hanington, P.; Sea, W.B. Conservation of the Mekong Delta wetlands through hydrological management. Ecol. Res. 2018, 33, 87–103. [Google Scholar] [CrossRef]
  98. Giri, C.; Defourny, P.; Shrestha, S. Land cover characterization and mapping of continental Southeast Asia using multi-resolution satellite sensor data. Int. J. Remote Sens. 2003, 24, 4181–4196. [Google Scholar] [CrossRef]
  99. Dang, A.T.N.; Kumar, L.; Reid, M.; Mutanga, O. Fire danger assessment using geospatial modelling in Mekong delta, Vietnam: Effects on wetland resources. Remote Sens. Appl. Soc. Environ. 2021, 21, 100456. [Google Scholar]
  100. Tran, T. U Minh Peat Swamp Forest: Mekong River Basin (Vietnam). In The Wetland Book; Springer Science+Business Media: Dordrecht, The Netherlands, 2016; ISBN 978-94-007-4001-3. [Google Scholar]
  101. Van, T.T.; Tien, T.V.; Toi, N.D.L.; Bao, H.D.X. Risk of Climate Change Impacts on Drought and Forest Fire Based on Spatial Analysis and Satellite Data. In Proceedings of the 2nd International Electronic Conference on Water Sciences, Online, 16–30 November 2017; pp. 1–7. Available online: https://ecws-2.sciforum.net/ (accessed on 15 March 2021).
  102. Thanh, V.T.; Hoang, P.V.; Trong, K.; Thanh, P.H. Evaluation of current situation of melaleuca forest in the U Minh Ha national park, Vietnam under the situation of climate change and proposed solutions for conservation and sustainable development. In IOP Conference Series: Materials Science and Engineering; IOP Publishing: Bristol, UK, 2020. [Google Scholar]
  103. Tran, T.; Nguyen, T.K.D.; Le, X.T.; Tran, T.A.D. Climate Change Vulnerability Assessment U Minh Thuong National Park, Vietnam. Mekong WET–Building Resilience of Wetlands in the Lower Mekong Region; Tech. Report; International Union for Conservation of Nature: Bangkok, Thailand, 2018; pp. 1–41. [Google Scholar]
  104. Tran, D.B.; Dargusch, P.; Moss, P.; Hoang, T.V. An assessment of potential responses of Melaleuca genus to global climate change. Mitig. Adapt. Strateg. Glob. Chang. 2013, 18, 851–867. [Google Scholar] [CrossRef]
  105. Dinh, Q.T. Vietnam-Mekong Delta Integrated Climate Resilience and Sustainable Livelihoods (MD-ICRSL) Project: Environmental Assessment (English). Project Report. 2016. Available online: http://documents.worldbank.org/curated/en/855731468312052747/Regional-environmental-assessment-report (accessed on 20 April 2021).
  106. Lan, N.T.P. From rice to shrimp: Ecological change and human adaptation in the Mekong Delta of Vietnam. In Environmental Change and Agricultural Sustainability in the Mekong Delta; Springer: Dordrecht, The Netherlands, 2011; pp. 271–285. [Google Scholar]
  107. Lam-Dao, N.; Pham-Bach, V.; Nguyen-Thanh, M.; Pham-Thi, M.-T.; Hoang-Phi, P. Change detection of land use and riverbank in Mekong Delta, Vietnam using time series remotely sensed data. J. Resour. Ecol. 2011, 2, 370–374. [Google Scholar]
  108. IMHEN; Ca Mau Peoples Committee; Kien Giang Peoples Committee. Climate Change Impact and Adaptation Study in The Mekong Delta – Part A Final Report: Climate Change Vulnerability and Risk Assessment Study for Ca Mau and Kien Giang Provinces, Vietnam; Institute of Meteorology, Hydrology and Environment (IMHEN): Hanoi, Vietnam, 2011. Available online: https://www.adb.org/sites/default/files/project-document/73153/43295-012-tacr-03a.pdf (accessed on 20 March 2021).
  109. Hai, T.X.; Van Nghi, V.; Hung, V.H.; Tuan, D.N.; Lam, D.T.; Van, C.T. Assessing and Forecasting Saline Intrusion in the Vietnamese Mekong Delta Under the Impact of Upstream flow and Sea Level Rise. J. Environ. Sci. Eng. B 2019, 8, 174. [Google Scholar]
  110. Smajgl, A.; Toan, T.Q.; Nhan, D.K.; Ward, J.; Trung, N.H.; Tri, L.Q.; Tri, V.P.D.; Vu, P.T. Responding to rising sea levels in the Mekong Delta. Nat. Clim. Chang. 2015, 5, 167–174. [Google Scholar] [CrossRef]
  111. Akam, R.; Gruere, G. Rice and Risks in the Mekong Delta. 2018. Available online: https://www.oecd-ilibrary.org/docserver/bbddd17ben.pdf?expires=1629540388&id=id&accname=guest&checksum=F544DB1ED655A785770AE37551F9C746 (accessed on 10 April 2021).
  112. Son, N.; Chen, C.; Chen, C.; Chang, L.; Duc, H.; Nguyen, L. Prediction of rice crop yield using MODIS EVI−LAI data in the Mekong Delta, Vietnam. Int. J. Remote Sens. 2013, 34, 7275–7292. [Google Scholar] [CrossRef]
  113. Gopalakrishnan, T.; Hasan, M.K.; Haque, A.; Jayasinghe, S.L.; Kumar, L. Sustainability of coastal agriculture under climate change. Sustainability 2019, 11, 7200. [Google Scholar] [CrossRef] [Green Version]
  114. Gopalakrishnan, T.; Kumar, L. Potential impacts of sea-level rise upon the Jaffna Peninsula, Sri Lanka: How climate change can adversely affect the coastal zone. J. Coast. Res. 2020, 36, 951–960. [Google Scholar] [CrossRef]
  115. Dang, A.T.N.; Kumar, L.; Reid, M. Modelling the Potential Impacts of Climate Change on Rice Cultivation in Mekong Delta, Vietnam. Sustainability 2020, 12, 9608. [Google Scholar] [CrossRef]
  116. Minderhoud, P.; Coumou, L.; Erban, L.; Middelkoop, H.; Stouthamer, E.; Addink, E. The relation between land use and subsidence in the Vietnamese Mekong delta. Sci. Total. Environ. 2018, 634, 715–726. [Google Scholar] [CrossRef] [PubMed]
  117. Lee, S.Y.; Primavera, J.H.; Dahdouh-Guebas, F.; McKee, K.; Bosire, J.O.; Cannicci, S.; Diele, K.; Fromard, F.; Koedam, N.; Marchand, C. Ecological role and services of tropical mangrove ecosystems: A reassessment. Glob. Ecol. Biogeogr. 2014, 23, 726–743. [Google Scholar] [CrossRef]
  118. Barbier, E.B.; Hacker, S.D.; Kennedy, C.; Koch, E.W.; Stier, A.C.; Silliman, B.R. The value of estuarine and coastal ecosystem services. Ecol. Monogr. 2011, 81, 169–193. [Google Scholar] [CrossRef]
  119. Menéndez, P.; Losada, I.J.; Torres-Ortega, S.; Narayan, S.; Beck, M.W. The global flood protection benefits of mangroves. Sci. Rep. 2020, 10, 1–11. [Google Scholar] [CrossRef]
  120. Gilman, E.L.; Ellison, J.; Duke, N.C.; Field, C. Threats to mangroves from climate change and adaptation options: A review. Aquat. Bot. 2008, 89, 237–250. [Google Scholar] [CrossRef]
  121. Lovelock, C.E.; Cahoon, D.R.; Friess, D.A.; Guntenspergen, G.R.; Krauss, K.W.; Reef, R.; Rogers, K.; Saunders, M.L.; Sidik, F.; Swales, A. The vulnerability of Indo-Pacific mangrove forests to sea-level rise. Nature 2015, 526, 559–563. [Google Scholar] [CrossRef] [Green Version]
  122. McFadden, T.N.; Kauffman, J.B.; Bhomia, R.K. Effects of nesting waterbirds on nutrient levels in mangroves, Gulf of Fonseca, Honduras. Wetl. Ecol. Manag. 2016, 24, 217–229. [Google Scholar] [CrossRef]
  123. Eom, K.-C. Environmentally beneficial function of rice culture and paddy soil. In Rice Culture in Asia; Korean National Committee on Irrigation and Drainage (KCID): Ansan-si, Gyeonggi-do, Korea, 2001; pp. 28–35. [Google Scholar]
  124. Kim, T.-C.; Gim, U.-S.; Kim, J.S.; Kim, D.-S. The multi-functionality of paddy farming in Korea. Paddy Water Environ. 2006, 4, 169–179. [Google Scholar] [CrossRef]
  125. Czech, H.A.; Parsons, K.C. Agricultural wetlands and waterbirds: A review. Waterbirds 2002, 25, 56–65. [Google Scholar]
  126. Yoon, C.G. Wise use of paddy rice fields to partially compensate for the loss of natural wetlands. Paddy Water Environ. 2009, 7, 357. [Google Scholar] [CrossRef]
  127. Nakayama, T.; Hoa, T.T.T.; Harada, K.; Warisaya, M.; Asayama, M.; Hinenoya, A.; Lee, J.W.; Phu, T.M.; Ueda, S.; Sumimura, Y. Water metagenomic analysis reveals low bacterial diversity and the presence of antimicrobial residues and resistance genes in a river containing wastewater from backyard aquacultures in the Mekong Delta, Vietnam. Environ. Pollut. 2017, 222, 294–306. [Google Scholar] [CrossRef] [PubMed]
  128. Le, T.X.; Munekage, Y.; Kato, S.-I. Antibiotic resistance in bacteria from shrimp farming in mangrove areas. Sci. Total Environ. 2005, 349, 95–105. [Google Scholar] [CrossRef] [PubMed]
  129. Berg, H.; Söderholm, A.E.; Söderström, A.-S.; Tam, N.T. Recognizing wetland ecosystem services for sustainable rice farming in the Mekong Delta, Vietnam. Sustain. Sci. 2017, 12, 137–154. [Google Scholar] [CrossRef] [PubMed] [Green Version]
  130. Ha, T.T.P.; van Dijk, H.; Visser, L. Impacts of changes in mangrove forest management practices on forest accessibility and livelihood: A case study in mangrove-shrimp farming system in Ca Mau Province, Mekong Delta, Vietnam. Land Use Policy 2014, 36, 89–101. [Google Scholar] [CrossRef]
Figure 1. Location map of study area from the Mekong Delta, Vietnam.
Remotesensing 13 03359 g001
Figure 2. Methodology flowchart. NDVI: Normalized Difference Vegetation Index; CMRI: Combined Mangrove Recognition Index.
Remotesensing 13 03359 g002
Figure 3. Wetland maps of the study area.
Remotesensing 13 03359 g003
Figure 4. Trend and rate of change in wetland categories over the period 1995/2020.
Remotesensing 13 03359 g004
Figure 5. Sankey diagram of wetland changes over the period 1995/2020. All nodes and links are presented proportionally to absolute square kilometre (see Tables S1–S3 in Supplementary Materials for more details).
Remotesensing 13 03359 g005
Figure 6. Correlation between sea level rise relative to Hon Dau 1992 datum, and wetland categories.
Remotesensing 13 03359 g006
Figure 7. The comparison of wetland statistics between the present study and (A) Hauser et al. [19] in Ngoc Hien, Ca Mau province, the MD, Vietnam, and (B) Liu et al. [35] in the MD, Vietnam.
Remotesensing 13 03359 g007
Table 1. Description of data used in the present study.
Data TypeDataYearDate of AcquisitionSpatial Resolution (m)Sources
Remote sensing data: Level-1 Landsat imagesLandsat 5 TM
Landsat 7 ETM+
Landsat 8 OLI
Landsat 8 OLI
1995
2002
2013
2020
08/01/1995–06/03/1995
03/01/2002–20/02/2002
08/01/2013–27/02/2013
06/01/2020–23/02/2020
30 (MS)
30 (MS); 15 (PAN)
30 (MS); 15 (PAN)
30 (MS); 15 (PAN)
USGS https://earthexplorer.usgs.gov/, accessed on 4 December 2020
Ancillary dataLand-use/land-cover maps1995
2000
2005
2010
2015
Digital maps (Scale: 1:25,000)Ministry of Natural Resources and Environment (http://monre.gov.vn), accessed on 4 December 2020
Local land-use and land-inventory maps2000
2005
2010
2015
Digital mapsDepartment of Natural Resources and Environment of Ca Mau and Kien Giang provinces
Google Earth Imagery---Google Inc.
Ground truth data2019/20202019–03/2020GPS recordersField trip (237 filed observations)
Sea level data-1995–2019-NCHMF, https://nchmf.gov.vn, accessed on 4 December 2020
Table 2. Wetland classification scheme in this study based on Ramsar nomenclature.
Classified Wetland ClassesSecond Ramsar Level; Source: [68]Description
Marine water bodiesA—permanent shallow marine waters
F—estuarine waters
Open permanent salt-water bodies along the coast within the study area over the study period, which were transferred from/to mangroves or other lands in the coastal zones due to erosion, inundation or aggradation.
Inland water bodiesM—permanent rivers
N—seasonal/intermittent/irregular rivers
O—permanent freshwater lakes (over 8 ha)
Q—permanent saltwater/brackish/alkaline lakes
Large or small fresh, brackish or saltwater bodies, including lakes, rivers, and ponds.
Mangrove forestsI—intertidal forested wetlands; includes mangrove swamps, nipah swamps, and tidal freshwater swamp forestsIncludes dense mangrove forests in coastal zone, which are subjected to tidal flooding, with a minimum of 30% canopy cover; and dominated by mangrove species, such as Avicennia alba and Rhizophora apiculata.
Sparse mangroves/saltmarshesH—intertidal marshes; includes salt marshes, salt meadows, saltings, and raised salt marshes; includes tidal brackish and freshwater marshesConsists of vegetated mangrove areas and saltmarsh vegetation, normally in aquaculture ponds with crown cover of less than 30%.
Forested wetlandsXp—forested peatlands; peat-swamp forestsIncludes peat-swamp forests (dense forest, and plantation forests) dominated by Melaleuca cajuputi plant species.
Rice fields/other crops3—irrigated land; includes irrigation channels and rice fields
4—seasonally flooded agricultural land (including intensively managed or grazed wet meadow or pasture)
Includes seasonal flooded agricultural land, dominated by rice fields (other crops including pineapple, coconut, and orchard accounted for small areas compared with rice fields).
Aquaculture ponds1—aquaculture (e.g., fish/shrimp/crab) pondsArtificial water bodies with regular geometric boundary for aquaculture practices.
Table 3. Description of indices used.
Vegetation IndicesEquationsReference
Normalized Difference Vegetation Index (NDVI)(NIR − Red)/(NIR + Red)[72]
Normalized Difference Water Index (NDWI)(Green − NIR)/(Green + NIR)[71]
Combined Mangrove Recognition Index (CMRI)NDVI − NDWI[50]
Table 4. Confusion matrix of wetland maps of 1995, 2002, 2013, and 2020.
(a) Error matrix for 1995 Landsat 5 TM image
ClassGround truth (pixels)User accuracy (%)
(1)(2)(3)(4)(5)(6)(7)Total
Marine water bodies (1)10940000011396.5
Inland water bodies (2)61680000417894.4
Mangrove forests (3)002142500023989.5
Spare mangroves/saltmarshes (4)004018800022882.5
Forested wetland (5)000015210016293.8
Rice fields/other crops (6)000086807689.5
Aquaculture ponds (7)064000015021470.1
Total115236254213160781541210-
Producer accuracy (%)94.871.284.388.395.089.597.4--
Overall accuracy = 86.69%, Kappa coefficient = 0.8434
(b) Error matrix for 2002 Landsat 7 ETM+ image
ClassGround truth (pixels)User accuracy (%)
(1)(2)(3)(4)(5)(6)(7)Total
Marine water bodies (1)12520000012798.4
Inland water bodies (2)326000001627993.2
Mangrove forests (3)001252500015083.3
Spare mangroves/saltmarshes (4)002013400015487.0
Forested wetland (5)0000891009989.9
Rice fields/other crops (6)000012101011389.4
Aquaculture ponds (7)023000010913282.6
Total1282851451591011111251054-
Producer accuracy (%)99.291.286.284.388.191.087.2--
Overall accuracy = 89.47%, Kappa coefficient = 0.8763
(c) Error matrix for 2013 Landsat 8 OLI image
ClassGround truth (pixels)User accuracy (%)
(1)(2)(3)(4)(5)(6)(7)Total
Marine water bodies (1)11230000011599.1
Inland water bodies (2)833200001535593.5
Mangrove forests (3)001311900015087.3
Spare mangroves/saltmarshes (4)002610700013380.5
Forested wetland (5)000075207797.4
Rice fields/other crops (6)000058509094.4
Aquaculture ponds (7)019000010112084.2
Total12035415712680871161040-
Producer accuracy (%)93.393.883.484.993.897.787.1--
Overall accuracy = 90.67%, Kappa coefficient = 0.8864
(d) Error matrix for 2020 Landsat 8 OLI image
ClassGround truth (pixels)User accuracy (%)
(1)(2)(3)(4)(5)(6)(7)Total
Marine water bodies (1)10550000011095.5
Inland water bodies (2)23320000634097.6
Mangrove forests (3)006690007588.0
Spare mangroves/saltmarshes (4)007530006088.3
Forested wetland (5)000065406994.2
Rice fields/other crops (6)000013403597.1
Aquaculture ponds (7)02000009211282.1
Total1073577362663898801-
Producer accuracy (%)98.193.090.485.598.589.593.9--
Overall accuracy = 93.26, Kappa coefficient = 0.9125
Table 5. Wetland pattern analysis of the study area in the Mekong Delta, Vietnam (1995–2020).
Wetland TypeArea in Square Kilometre (km2)Area in Percentage (%)
19952002201320201995200220132020
Marine water bodies34.638.672.179.30.60.71.31.4
Inland water bodies141.4139.7138.9132.62.52.42.42.3
Mangrove forests611.0596.1569.2581.010.610.49.910.1
Sparse mangroves/saltmarshes634.5383.8470.8375.411.16.78.26.5
Forested wetlands621.4600.4513.1423.810.810.58.97.4
Rice fields/other crops2843.01733.71673.1832.249.530.229.114.5
Aquaculture ponds661.42054.72109.83122.811.535.836.754.4
Publisher’s Note: MDPI stays neutral with regard to jurisdictional claims in published maps and institutional affiliations.

