Abstract
The elevation angle influence on coastal GNSS-R ocean code-based altimetry for GPS signals (L1 C/A and L5) and BDS B1 signals is investigated, and the corresponding correction method is presented. The study first focuses on the coastal ocean altimetry method, including the general experiment geometry and the code delay estimation using the single-point tracking algorithm. The peak power and the maximum first derivative are used as the location of the specular point. Then, the sensitivity of the height retrieved using the above coastal ocean altimetry method to elevation angle is analyzed based on the Z-V model. It can be seen that the elevation angle has a significant influence on the height retrieval, which will affect the precision of the coastal GNSS-R ocean altimetry. Finally, two correction methods, the model-driven method and the data-driven method, are proposed. The coastal altimetry experiments demonstrate that the correction methods can correct the elevation angle influence, and the data-driven method is more effective. The experimental results show that, after correcting the elevation angle influence, the code-based altimetry precision of the GPS L1 C/A signal, L5 signal, and BDS B1 signal can be up to the meter level, decimeter level (less than 4 decimeters), and meter level with respect to a reference tide gauge (TG) data set, respectively, without smoothing over time. These results provide information to guide the sea surface height retrieval using coastal GNSS-R, especially multi-satellite observation and GNSS signal with a higher chipping rate.
1. Introduction
Global navigation satellite system reflectometry (GNSS-R) that was primarily proposed for ocean mesoscale altimetry by Martin-Neira in 1993 [1] has been significantly extended to a wide range of applications as an emerging remote sensing technology. GNSS-R uses the reflected GNSS signals from the ocean surface to retrieve various physical parameters of the Earth, such as ocean surface height [2,3], wind speed [4], sea ice [5,6,7], significant wave height [8], the vegetation [9], soil moisture [10], target detection [11], snow [12]. Compared with radar and scatterometer, GNSS-R does not require the additional transmitter and has the advantages of low power and low cost. GNSS-R could also provide higher spatial-temporal resolution through a large number of GNSS satellites. The potential for global observation of geophysical parameters using GNSS-R has been fully exploited with the implementation of spaceborne GNSS-R missions, including UK-DMC [13], UK-TDS-1 [14], CYGNSS [15], and BF-1 [16]. However, the limitation of spatial resolution leads to the low observation precision for the spaceborne GNSS-R in nearshore areas. Coastal GNSS-R can provide long-term stable and high-precision observation for specific areas and make up for the shortcomings of spaceborne GNSS-R.
Sea surface height has continuously been a major area of attention within the essential marine dynamic variables. At present, the coastal sea surface height is primarily measured by tide gauges, such as acoustic gauge, pressure gauge, and radar gauge, which have different applicable scenarios depending on the equipment cost, the installation environment, and the service life, etc. [17]. GNSS-R can also measure the sea surface height, which was initially proposed by Martín-Neira [1]. The retrieval of sea surface height using GNSS-R has already been extensively discussed and made significant progress, especially in global observations [18,19]. Two main methods for ground-based GNSS-R have been proposed to retrieve sea surface height: GNSS-interferometric/multipath and reflectometry (GNSS-I/MR) [20,21,22,23] and conventional GNSS-R (cGNSS-R) [24,25]. The GNSS-I/MR processes the signal-to-noise ratio (SNR) output by the conventional GNSS geodetic receiver for sea surface height retrieval [21,26,27,28]. Therefore, the GNSS data of the continuously operating reference stations can be used without new equipment. The precision of the GNSS-I/MR could reach centimeter-level altimetry [29], but it requires long-term observation records. Moreover, only the SNR data of GNSS satellites with low elevation angles could be used, resulting in low temporal resolution [3]. The roughness of the sea surface and the height of the antenna could also limit the GNSS-IR method. The cGNSS-R retrieves the sea surface height through the time delay between reflected and direct GNSS signals. The time delay can be obtained by tracking the code phase (known as code-based method) [30,31] or carrier phase (known as carrier-based method) [32,33] of the reflected and direct GNSS signals, respectively. The cGNSS-R configuration generally uses an up-looking right-handed circularly polarized (RHCP) antenna to receive the direct GNSS signal, and a down-looking high-gain left-handed circularly polarized (LHCP) antenna to receive the reflected GNSS signal [34]. Higher altimetry precision can be reached using the carrier phase, approximately centimeter-level, than the code delay. However, the carrier-based method requires that the carrier phase of the signals must be continuous. Therefore, that the coherent components of the reflected signal should be sufficient enough; that is, the reflective surface should be smooth (such as sea ice or inland water), which limits the use of ocean altimetry based on the GNSS-R carrier-based method [35]. Compared with the carrier-based method, several theoretical and experimental studies have indicated that the code-based method has lower requirements for signal coherence, so it has a wider range of applications.
However, the precision of sea surface height based on the code-based method is limited by the code chip length of the GNSS signals [36]. Currently, the code-based method mainly uses GPS L1 C/A signals and BDS B1 signals. The corresponding precision of sea surface height can only reach several meters [2,34]. With the gradual development and modernization of the GNSS constellation, GNSS signals with wider bandwidths and new modulation methods have been continuously upgraded and are becoming more and more abundant for GNSS-R [37,38]. The third civilian GPS L5 signal, as a new signal with advanced features, is being broadcast by 16 GPS satellites. The GPS L5 code has a bandwidth of 10.23 MHz, which is ten times the bandwidth of the GPS C/A code. Therefore, the time delay between reflected and direct signals obtained by tracking the delay waveform of the L5 signal can be more accurate; that is, the GNSS-R altimetry precision is better. In addition, the L5 signal has the opportunity to be received at higher power compared to the L1 C/A signal [39].
Furthermore, the precision of sea surface height based on the code-based method is also affected by the diffuse scattering from the sea surface; because the diffuse scattering would affect the measurement deviation of the time delay between reflected and direct GNSS signals. The diffuse scattering deviation is significantly sensitive to the elevation angle for the GNSS-R ocean altimetry of the code phase method. For different elevation angles, the diffuse scattering deviation of spaceborne GNSS-R altimetry could reach about 26.7 m [19]. The precision of the airborne GNSS-R ocean altimetry would be worse at lower elevation angles [40]. The dependence of the coastal code-based GNSS-R altimetry accuracy on the elevation angle has been found in the experimental evaluation [36,38]. The elevation angle influence for coastal GNSS-R altimetry was about 4 m in the coastal GNSS-R altimetry experiment [41]. Therefore, the elevation angle influence should be corrected to obtain a higher altimetry precision. However, there was no systematic research and demonstration about the influence of the elevation angle.
In this paper, the elevation angle influence on coastal GNSS-R ocean altimetry using the GPS signals (L1 C/A and L5) and BDS B1 signals based on code phase is theoretically and experimentally evaluated. The influence of elevation angles on coastal sea surface height retrieval is corrected by the theoretical model simulation and the data-driven model function, respectively. The rest of this paper is organized as follows. Section 2 reviews the ocean altimetry method. Section 3 investigates the elevation angle influence based on the Z-V model. Section 4 presents the correction method of elevation angle influence. Section 5 describes the field experiment performed to test the correction method in a real scenario using the GPS signals (L1 C/A and L5) and BDS B1 signals. Section 6 contains an analysis of the coastal ocean altimetry performance using the experimental data set, and Section 7 discusses the results and summarizes the main conclusions.
2. Ocean Altimetry Method
2.1. Geometry
GNSS-R operates in a noncooperative and bistatic radar configuration with GNSS satellites as transmitters and receivers located on other platforms (including ground, aircraft, and low earth orbit satellites). There are forward and backward observation geometries in GNSS-R [42,43], and the forward observation geometry is used in the GNSS-R ocean altimetry. For the typical coastal GNSS-R ocean altimetry, the general experiment geometry corresponding to one reflecting surface point is illustrated in Figure 1. and are the heights of the coastal receiver relative to the sea surface and the reference surface, respectively; is the unit vector of the direct signal; is the vector from the LHCP phase center to the RHCP phase center; is the elevation angle of GNSS satellite at the reflection point, which can be accurately computed from direct signal or the precise ephemeris of international GNSS service.
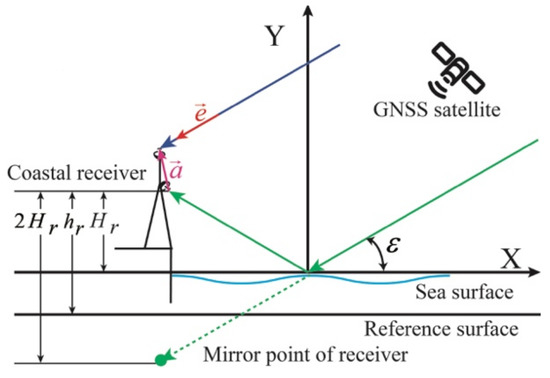
Figure 1.
Bistatic geometry of the coastal GNSS-R ocean altimetry.
The propagation path delay of the reflected signal relative to the direct signal can be expressed as
where and are the differences of ionospheric and tropospheric delays between the direct and the reflected signals, respectively, which can be neglected in the coastal GNSS-R ocean altimetry; is the propagation distance deviation caused by non-specular scattering and electromagnetic bias, which is sensitive to sea surface roughness and satellite elevation angle [44]; is the residual measurement error induced by the instrumental delays; is the geometric path delay between the reflected signal and the direct signal. For the coastal GNSS-R ocean altimetry, the curvature of the Earth is not considered because of the low receiver height, and the GNSS satellites are far enough away that it can be assumed that the paths of the direct signal and the incident signal are nearly parallel. Therefore, can be expressed as follows [33,36]
After calculating with Equation (2), the sea surface height (SSH) can be obtained by
2.2. Code Delay Estimation
In order to retrieve sea surface height, the time delay of the reflected signal relative to the direct signal is necessary to be determined first, and an accurate estimation of the time delay is important for the sea surface height retrieval. The delay can be estimated by the delay waveform using the code delay method with a wider range of applications. The delay waveform of reflected GNSS signals can be produced using the cross-correlation between reflected signals and local replicas or the direct signals. At present, two algorithms, including waveform matching and single-point tracking, have been proposed to estimate the delay. The waveform matching algorithm uses the theoretical model waveform to best match the measured waveform to get the delay, and the accuracy of the selected theoretical model determines the delay accuracy [2]. The single-point tracking algorithm obtains the delay estimation value by continuously tracking the defined characteristic points of the waveform, such as the peak of the delay waveform [45,46], the peak of the delay waveform derivative [45,47,48,49,50], and the fraction-power point [45,51]. The single-point tracking algorithm is used in this paper because of its low complexity. The characteristic points of the waveform should be easy to define and track and insensitive to the noise and sea surface roughness. Because the results obtained by the fraction-power point (such as 0.75 and 0.7) are similar to the peak of the delay waveform derivative, the fraction-power point has been excluded from this paper. In this paper, two types of characteristic points are used, which are analogous to the points explained in [45].
(1) MAX: The delay coordinate of the peak power is considered the arrival time of the reflected signal, that is, the peak of the delay waveform, which is only related to the specular delay when the surface is smooth.
(2) DER: The delay coordinate of the maximum first derivative on the delay waveform leading edge is considered the arrival time of the reflected signal, that is, the peak of the delay waveform derivative.
3. Elevation Angle Influence
The sea surface height can be retrieved from the geometric path delay between the reflected signal and the direct signal, as shown in Equations (2) and (3). The position of the true specular point on the delay waveform differs between fully coherent and incoherent scattering conditions [51]. The fully coherent scattering will have the shape of an autocorrelation waveform, in which case the true specular point is the peak power point. As the roughness of the reflection surface increases, the delay waveform will have characteristic expansion and deformation, and the position of the specular point will move down along the waveform leading edge. In this case, the peak of the delay waveform derivative may be closer to the specular point. However, the observed GNSS reflected signal is not strictly coherent or diffuse but is located on the spectrum between the two extremes.
As mentioned above, due to the non-specular scattering from the sea surface in the actual scenario, the delay obtained from the reflected waveform using the single-point tracking algorithm has a deviation compared with the specular delay, which can be called non-specular scattering deviation. The non-specular scattering deviation is sensitive to sea surface roughness, which could govern the distribution of the reflected energy.
The roughness of the reflection surface is related to the incidence angle and wavelength of the GNSS signal [52]. The higher the satellite elevation angle, the rougher the same reflecting surface will be relative to the GNSS signal, which means that the specular point is farther away from the peak power point. This phenomenon of the coastal GNSS-R ocean altimetry can be called the elevation angle influence. The theoretical scattering model, the Z-V model, is used to analyze the effect of the elevation angle on the height retrieval of the coastal receiver relative to the sea surface. The Z-V model was first derived by Zavorotny and Voronovich based on the geometric optics limit of the Kirchhoff approximation. The Z-V model is expressed as [53]
where is the time delay; is the coherent integration time; and are the received and transmitted signal power; and are the receiving and transmitting antenna gain; and are the ranges of GNSS satellite to coordinate origin and coordinate origin to receiver; and is the Doppler frequency shift; is the electromagnetic wavelength of the signal; is the PRN code autocorrelation function; is the sinc-shaped function defined as ; is the arbitrary surface point; is the bistatic radar cross-section (BRCS).
Several scattering models have been proposed to theoretically calculate the BRCS of the sea surface. The most practical tool among them until now has been the two-scale surface model, which is based on the theory that the sea surface is the superposition of a two-scale roughness surface. In the two-scale surface model, the large-scale and small-scale roughness of the sea surface is modeled as two independent random processes [43]. Therefore, the BRCS of the sea surface is computed by the sum of large-scale and small-scale BRCS, which could be estimated using the Kirchhoff approximation in the geometric optics (KAGO) and small perturbation method (SPM), respectively [54]
where and are the BRCS of the large-scale and small-scale roughness, respectively. is computed as [55]
where is the Fresnel coefficient; and stand for the horizontal and vertical component of the scattering vector ; is the probability density function of the mean square slope of the sea surface.
is computed as [56]
where is the wave number of the incident signal; and are the incident angle and the scattering angle, respectively; is the unified directional spectrum of the ocean surface, which can be obtained by using Elfouhaily spectrum; is the azimuthal angle of the incident signal relative to the wind vector; is the wind speed.
The delay waveform of the coastal reflected signals could be generated according to the above-mentioned Z-V model based on the coastal GNSS-R altimetry geometry and GPS satellite parameters. Then, the time delay of the reflected signal relative to the direct signal is estimated by the delay waveform using the above-mentioned single-point tracking algorithm. Finally, the height can be retrieved according to Equation (2). The heights of the coastal receiver relative to the sea surface versus the elevation angle for different wind speeds and signals (L1 C/A and L5) are shown in Figure 2, where the true height is 24.5 m. It can be seen that both wind speed and elevation angle have an influence on the height retrieved using MAX and DER methods. The height retrieval is heavily affected by elevation angle rather than wind speed; the retrieved height increases as the elevation angle increases. When the elevation angle is large, the retrieved height gradually becomes stable. When the elevation angle is increased to 75°, there is still a deviation between the retrieved height and the true height, which is called a fixed deviation in this paper. Furthermore, the DER method is more sensitive to elevation angle than the MAX method. For different signals, the elevation angle influence on the height retrieval for GPS L5 signal is less than GPS L1 C/A signal, and the height retrieved using GPS L5 signal is closer to the true height due to its higher bandwidth. For GPS L1 C/A signal and GPS L5 signal, there are deviations in the heights retrieved using the same single-point tracking algorithm, which is caused by the different bandwidths. Moreover, the height retrieved using the MAX is higher than the true height, which is due to the existence of incoherent scattering. The peak power point is the true specular point when the fully coherent scattering occurs, such as the pure specular reflection. When the reflecting surface is rough, the GNSS-R waveform is deformed because of incoherent scattering. The peak power point will expand backward. Therefore, the delay obtained from MAX will be greater than the actual delay. The DER method would underestimate the antenna height since it is at the delay waveform leading edge.
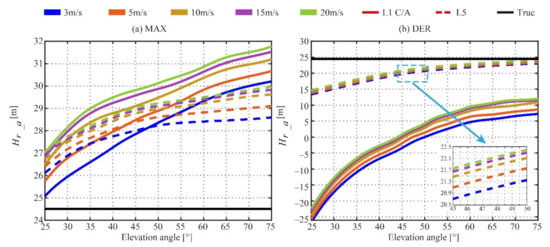
Figure 2.
Curves of the height of coastal receiver relative to the sea surface versus the elevation angle for different wind speeds and signals, obtained from the Z-V model using the MAX method (a) and the DER method (b) for GPS L1 C/A signal (solid line) and GPS L5 signal (dotted line). The true height is 24.5 m.
4. Correction of Elevation Angle Influence
As mentioned above, the elevation angle has a significant influence on height retrieval. In this paper, the elevation angle influence is expressed as follows:
where is the height of the coastal receiver relative to the sea surface obtained using MAX or DER method; is the true height; is the fixed deviation when the retrieved height versus the elevation angle gradually becomes stable; is the function of the elevation angle influence.
In order to further analyze the elevation angle influence, each of the curves (i.e., the data sets corresponding to a single wind speed value) are normalized by their approximate value at in this paper. As an example, the normalized height retrieved using the DER method for GPS L5 signal for different wind speeds versus elevation angle is illustrated in Figure 3 (the blue scatter points). It can be seen that the function of the elevation angle influence does not vary significantly with wind speed.
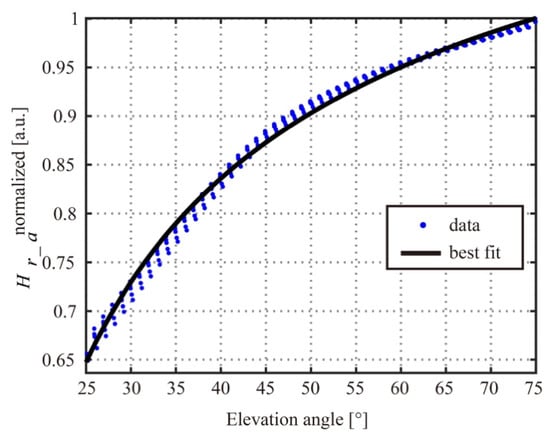
Figure 3.
(blue) The normalized height retrieved from the Z-V model using the DER method for GPS L5 signal for different wind speeds versus elevation angle, with (black) superimposed best-fit power function. The coefficients are a = −3.769, b = −0.5631, and c = 1.345.
Therefore, in order to obtain a more accurate sea surface height using the single-point tracking algorithm, the elevation angle influence should be corrected. The function of the elevation angle influence can be obtained based on the Z-V model, which can be called the model-driven method. The function of the elevation angle influence is fitted here with a power–law relationship of the form:
where , , and are the fitting coefficients, which can be obtained by least-squares fitting; in this paper because of the normalization, so that, . As an example, the best-fit power curve of the height retrieved from the Z-V model using the DER method for GPS L5 signal are shown in Figure 3 (the black solid line), where the coefficients of the best-fit power function are a = −3.769, b = −0.5631, and c = 1.345. This function can be used to model the dependence of the retrieved height on elevation angle. The same procedure has been applied to the other height retrieved using the single-point tracking algorithm for GPS signals (L1 C/A and L5) and BDS B1 signals. The fitting coefficients of the best-fit power curve are different for different single-point tracking algorithms and GNSS signals. When the height variation range of the coastal receiver relative to the sea surface is at the meter level, the function of the elevation angle influence can be considered as the same. Therefore, the meter-level tide has less influence on the correction of elevation angle influence.
When the function of the elevation angle influence is obtained by the best-fit power curve, the height of the coastal receiver relative to the sea surface after correcting the elevation angle influence can be expressed as follows:
The correction accuracy of the model-driven method above is closely related to the accuracy of the theoretical scattering model. The signal generated by the theoretical scattering model is difficult to be completely consistent with the reflected signal received in the experiment due to the error of the theoretical model and equipment. Therefore, the best-fit power curve closer to the field experiment should be obtained to better correct the elevation angle influence. Compared to the model-driven method, the function of the elevation angle influence can also be empirically derived from a large collocation study between observed measurements and independent estimates made by the tide gauge, which can be called data-driven function correction. That is, the function of the elevation angle influence is fitted using the observed normalized height and the corresponding true height. The data-driven function correction is a commonly used method for retrieval [57] and can get the function of the elevation angle influence closer to the field experiment, where the influence of the instrument is also taken into account.
5. Field Experiment
5.1. Site Description
5.1.1. GPS-R Ocean Altimetry
The experiment was conducted at a wharf (38.154° N, 119.066° E) in Dongying, Shandong Peninsula, East China, from 28 October to 2 November 2020, from 12:00 to 16:00 every day. The aerial image of the experimental site is shown in Figure 4a, provided by Google Earth. The experimental platform is located at the Bohai Sea, about 8.6 km away from the coast. There are no obstacles around the experimental site, which effectively avoids receiving multipath signals from rocks and small islands. Therefore, compared with the coast, the platform is more suitable for the coastal GNSS-R ocean altimetry experiment.
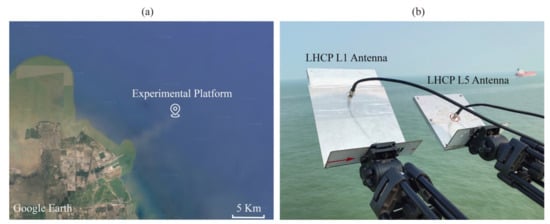
Figure 4.
GNSS-R experiment setup at Dongying, China. (a) Aerial image (Google Earth) of the experimental site. (b) Photograph of the side-looking LHCP antennas, including the GPS L1 antenna and GPS L5 antenna.
Two RHCP L1/L5 GPS antennas in the zenith direction are used to receive the direct signals. An LHCP L1 GPS antenna and an LHCP L5 GPS antenna tilted with an azimuth angle of 65° and an elevation angle of 45° toward the sea surface are used to receive the reflected signals, illustrated in Figure 4b. The antennas are installed on the wharf with an approximate height of 24.5 m above sea level.
5.1.2. BDS-R Ocean Altimetry
The experiment was conducted at the marine environmental monitoring station (36.059° N, 120.437° E) in Qingdao, Shandong Peninsula, East China, on 3 August 2018, from 10:15 to 21:51. The aerial image of the experimental site is shown in Figure 5a, provided by Google Earth. The experimental platform is located on a small island in the Huanghai Sea.
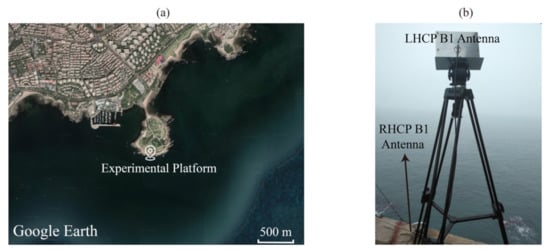
Figure 5.
GNSS-R experiment setup at Qingdao, China. (a) Aerial image (Google Earth) of the experimental site. (b) Photograph of the side-looking LHCP antenna and RHCP antenna.
An RHCP B1 BDS antenna in the zenith direction is used to receive the direct signals. An LHCP B1 BDS antenna tilted with an azimuth angle of 155° and an elevation angle of 45° toward the sea surface is used to receive the reflected signals, illustrated in Figure 5b. The antennas are installed on the wharf with an approximate height of 13 m above sea level.
5.2. Data
The raw intermediate frequency (IF) samples data of GPS-R ocean altimetry were collected during the experiment campaign using the four-channel high-frequency signal digital collector with a sampling rate of 62.0 MHz and a quantization resolution of 8 bits for both direct and reflected channels. A total of 260 sets of raw IF data were collected, and the collection time for each set was 1 min.
The raw IF samples data of BDS-R ocean altimetry were collected during the experiment campaign using the two-channel high-frequency signal digital collector with a sampling rate of 16.369 MHz and a quantization resolution of 2 bits for both direct and reflected channels. A total of 465 sets of raw IF data were collected, and the collection time for each set was 1 min.
The raw IF data sets are processed by the software receiver, which consists of close-loop processing of the direct signals and open-loop processing of the reflected signals. The main processed datasets used in our coastal GNSS-R ocean altimetry include the following two parts.
(1) The delay waveforms of the direct signals and the reflected signals: The delay waveforms are obtained using a 1-ms coherent integration time and 55,000 times incoherent integration to reduce noise. The code delay resolution of GPS-R and BDS-R is about and s, corresponding to 4.84 and 18.33 m in ranging resolution, respectively. The examples of the direct and reflected delay waveforms for GPS-R (L1 C/A signals and L5 signals) and BDS-R B1 signals are presented in Figure 6. It can be seen that the complete delay waveforms of GPS L5 signals are narrower than that of GPS L1 C/A signals and BDS-R B1 signals. The narrower autocorrelation function of the GPS L5 signals can help physically eliminate the mutual radio frequency interference between the direct signals and the reflected signals, as shown in Figure 6b, which can improve the precision of code delay estimation, especially when the height of GNSS-R receiver relative to the sea surface is low, such as the coastal GNSS-R altimetry. In order to increase the ranging resolution, the cubic spline interpolation is used to increase the delay sampling rate.
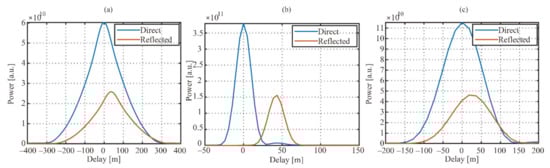
Figure 6.
Examples of the measured delay waveforms, before interpolation, of (a) GPS L1 C/A signals, (b) GPS L5 signals, and (c) BDS B1 signals. The delay waveforms of GPS and BDS are generated from the raw data collected at 14:57 on 30 October 2020 and 11:10 on 3 August 2018, respectively. The signals are transmitted by GPS PRN 24 satellite with an elevation angle of 49.72° and BDS PRN 01 satellite with an elevation angle of 44.58°.
(2) The ancillary information of satellite: including the azimuth angle and elevation angle of the GNSS transmitters, position and time information. They can be extracted from the GNSS precise ephemeris files and the raw IF metadata.
(3) The reference sea surface height data: For comparison and validation of the GNSS-R altimetry results, data from a nearby tide gauge is used. The maximum amplitude of the sea-level change caused by the tide is about 10 cm and 3 m throughout the data collection campaign of GPS-R and BDS-R, respectively.
In the process of data analysis, it was found that the backward scattered GNSS signals can also be successfully received and processed. However, the backward scattered GNSS signals cannot be used to retrieve the sea surface height by the method mentioned in Section 2. Therefore, in order to ensure the specular forward geometry, the forward scattered signals, whose specular reflection point is located in the main beam of the down-looking antenna, are selected for altimetry. The corresponding limits of the azimuth angle and elevation angle for GPS-R are set from 40 to 90° and 25 to 75°, respectively. The corresponding limits of the azimuth angle and elevation angle for BDS-R are set from 110 to 200° and 25 to 75°, respectively.
6. Ocean Altimetry Performance Analysis
6.1. GPS-R Ocean Altimetry
The performance of the above-mentioned GNSS-R ocean altimetry method is assessed by using the GPS-R experimental data set as described in Section 5. Figure 7 shows the first ocean altimetry experiment results throughout the data collection campaign for GPS-R, where Figure 7a,b is the height of the coastal receiver relative to the sea surface obtained according to Equation (2). From Figure 7, it is obvious that the elevation angle has an influence on the height retrieval, and this effect is much larger than the variation amplitude of the sea surface height (about 10 cm). Furthermore, the elevation angle influence of the GPS L1 C/A signal is greater than that of the GPS L5 signal, and the elevation angle influence of the DER method is greater than that of the MAX method, which is consistent with the conclusion of the Z-V model analysis. Therefore, the elevation angle influence should be corrected to obtain a more accurate sea surface height using the single-point tracking algorithm.
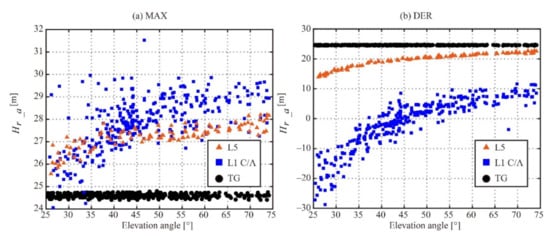
Figure 7.
Scatter plot of the first ocean altimetry results obtained using the above-mentioned GNSS-R ocean altimetry method. (a,b) are the height of the coastal receiver relative to the sea surface obtained using different signals and types of the characteristic points, according to Equation (2).
Figure 8 shows the throughout the data collection campaign, where the correction of elevation angle influence has been now implemented through the use of the best-fit power curve. The fitting coefficients have been obtained using the model-driven method by establishing a simulation scene consistent with the field experiment. It can be seen that the elevation angle influence has been corrected to a certain extent. However, the dependence on the elevation angle has not been completely eliminated. In particular, the correction effect of the elevation angle influence is poor when the elevation angle is low, which is especially obvious for the DER method. This is because the Z-V model used cannot fully recover the real reflected signal, especially the Kirchhoff approximation in a geometric optics limit would produce an incorrect result in the case of weak diffuse scattering or in the presence of coherent reflection. A weak diffuse scattering scenario would occur on the ocean surface when the elevation angle is low. What is more, there still are some offsets after correction using the model-driven method, especially for the GPS L5 signal, which is because of model errors.
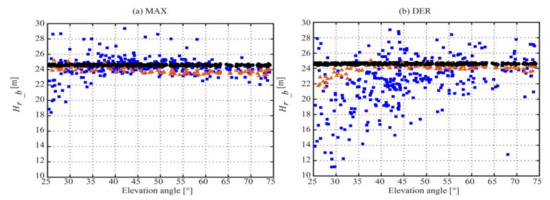
Figure 8.
Scatter plot of the ocean altimetry results obtained after correction of the elevation angle influence using the model-driven function, according to Equation (7). (a,b) are the height of the coastal receiver relative to the sea surface obtained using different signals and types of characteristic points.
In order to evaluate the performance of the data-driven method, the training and testing datasets are randomly split as 50% and 50% of the whole dataset (the first ocean altimetry results and reference data), respectively, which is similar to the deep learning or artificial neural networks. The training dataset is used to empirically derive the best-fit power curves of the normalized height versus the elevation angle. The testing dataset is used to assess the performance of the data-driven function correction for elevation angle influence. An illustration of the scatterplot of the height after the data-driven function correction versus the reference data is shown in Figure 9. It can be seen that the dependence on the elevation angle has been largely eliminated. The correction effect of the data-driven method is better than the correction effect of the model-driven method, which is in line with the previous expectations.
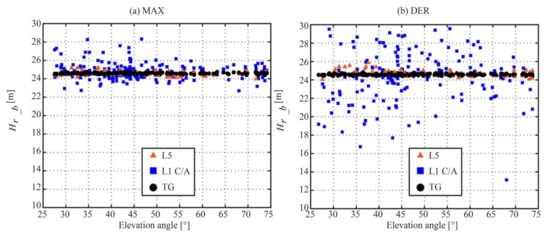
Figure 9.
Scatter plot of the ocean altimetry results obtained after correction of elevation angle influence using the data-driven function. (a,b) are the height of the coastal receiver relative to the sea surface obtained using different signals and types of characteristic points.
From Figure 8 and Figure 9, we can find that both the model-driven method and the data-driven method can correct the elevation angle influence. In order to assess the performance of the two methods, the mean bias and root-mean-square error (RMSE) differences were calculated. The values are given in Table 1. The higher altimetry precision can be obtained using the MAX method rather than the DER method for this coastal GPS-R ocean altimetry experiment due to the different sensitivity of elevation angle influence. The correction of elevation angle influence can improve the height retrieval results for both the MAX and DER methods, as well as GPS L1 C/A and L5 signals. The improvement of the DER method and GPS L5 signal is more significant. The height retrieval results corrected by the data-driven method are better than the model-driven method. The RMSE of the GPS L1 C/A signal can be improved to the meter level. The RMSE of the GPS L5 signal can achieve decimeter level (less than 4 decimeters) after the correction of elevation angle influence. It is worth noting that, because of the small amount of data, the above altimetry results of the field experiment have not been processed by smoothing over time.

Table 1.
Altimetry precision obtained using different correction methods for different signals and types of characteristic points.
6.2. BDS-R Ocean Altimetry
The performance of the above-mentioned GNSS-R ocean altimetry method is assessed by using the BDS-R experimental data set as described in Section 5. Signals from multiple BDS satellites were collected during the experiment, including geostationary earth orbit (GEO), middle earth orbit (MEO), and inclined geosynchronous orbit (IGSO). The corresponding elevation angles of BDS satellites are illustrated in Figure 10.
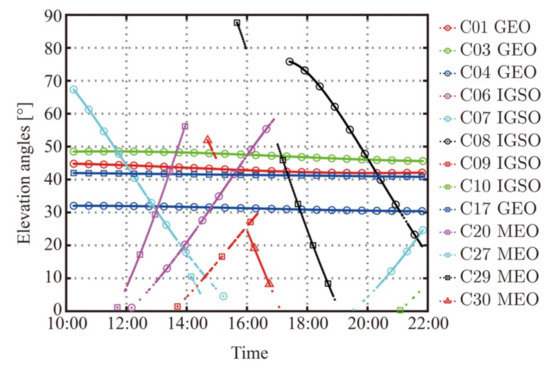
Figure 10.
Scatter plot of the elevation angles obtained using the precise ephemeris of the BDS satellites.
6.2.1. BDS-R Ocean Altimetry Based on GEO
During the experiment, the elevation angles of GEO change slightly, ranging from 1 to 3°. Therefore, the elevation angle influence could be ignored, that is, . Figure 11 shows the SSH results throughout the data collection campaign for BDS-R obtained using BDS GEO signals, according to Equation (3). The mean bias and RMSE of MAX and DER are given in Table 2. The SSH retrieved by BDS GEO has the same trend as the true SSH, which means that it can detect sea tide changes. BDS-R ocean altimetry based on GEO could obtain the same level of altimetry precision as the GPS L1 signal based on the correction of elevation angle influence.
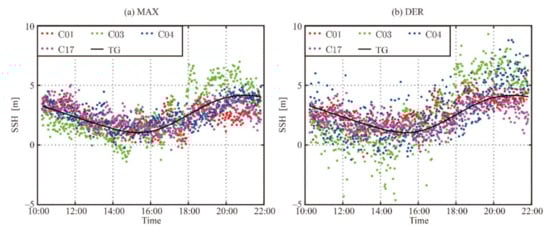
Figure 11.
Scatter plot of the SSH results obtained using the above-mentioned GNSS-R ocean altimetry method for BDS GEO signals.
Table 2.
Altimetry precision obtained using BDS GEO for different types of characteristic points.
6.2.2. BDS-R Ocean Altimetry Based on MEO/IGSO
As shown in Figure 10, the elevation angle of MEO/IGSO is constantly changing, so the BDS-R ocean altimetry based on MEO/IGSO needs to correct the elevation angle influence. Compared with GPS-R, the SSH of BDS-R had a larger variation during the experiment, about 3 m. Therefore, in order to show the elevation angle influence on BDS-R altimetry for MEO/IGSO more intuitively, Figure 12 shows the first ocean altimetry experiment results throughout the data collection campaign for BDS-R MEO/IGSO, where Figure 12a,b is the height of coastal receiver relative to the reference surface obtained according to Equation (3). Similar to GPS-R altimetry, the elevation angle has an influence on the BDS-R ocean altimetry based on MEO/IGSO, especially for the DER method. Due to the lower sampling rate of the two-channel high-frequency signal digital collector, the error of the cubic spline interpolation is relatively large, and the altimetry results have a higher degree of dispersion. Specifically, the dispersion of altimetry results for a high elevation angle is greater, which is affected by the rocks near the front of the experimental platform.
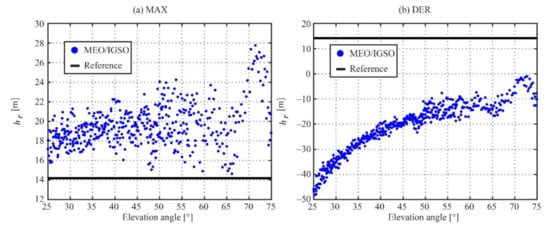
Figure 12.
Scatter plot of the first ocean altimetry results obtained using the above-mentioned GNSS-R ocean altimetry method. (a,b) are the height of the coastal receiver relative to the reference surface obtained using BDS MEO/IGSO signals, according to Equation (3).
According to the results of GPS-R altimetry in Section 6.1, the height retrieval results corrected by the data-driven method are better than the model-driven method. The data-driven method was chosen to evaluate its correction performance for BDS-R altimetry. Figure 13 illustrates the scatterplot of the height after the data-driven function correction versus the reference data. Table 3 shows the altimetry precision of MEO/IGSO before and after the elevation angle correction. It can be seen that the dependence on the elevation angle has been largely eliminated, which is similar to the results of GPS-R. The RMSE of the BDS B1 signal can be improved to the meter level. The SSH results retrieved by BDS MEO/IGSO signals after correction of elevation angle influence using the data-driven function are illustrated in Figure 14. The SSH has the same trend as the true SSH, which is similar to GEO. Since the correction cannot completely eliminate the elevation angle influence, the MEO/IGSO altimetry precision after the elevation angle correction is still slightly lower than that of GEO. However, compared with GEO, the coastal BDS-R ocean altimetry based on MEO/IGSO has a wider range of application scenarios due to flexible installation. What is more, the smoothing for a longer time, such as smoothing within 15 min before and after the measurement time, can also increase the altimetry precision, which will be investigated in future work.
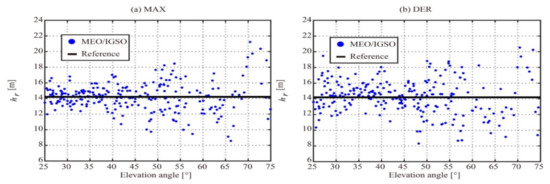
Figure 13.
Scatter plot of the ocean altimetry results obtained after correction of elevation angle influence using the data-driven function. (a,b) are the height of the coastal receiver relative to the reference surface obtained using BDS MEO/IGSO for different types of characteristic points.
Table 3.
Altimetry precision obtained using BDS MEO/IGSO for different types of characteristic points.
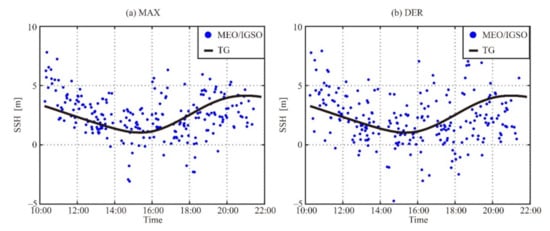
Figure 14.
Scatter plot of the ocean altimetry results obtained after correction of elevation angle influence using the data-driven function. (a,b) are the height of the coastal receiver relative to the sea surface obtained using different signals and types of characteristic points.
7. Discussion
There is a range of different instruments that can be used to monitor the sea surface height, such as acoustic gauges, pressure gauges, and radar gauges. Different methods have different advantages and applicable conditions, depending on the corresponding equipment cost, installation environment, and service life, etc. The pressure gauge may drift over time. An acoustic gauge has certain requirements for the installation’s geographical environment. A radar gauge is more expensive and has a higher power consumption. GNSS-R, an emerging earth remote sensing technology, can also measure the sea surface height. Compared to traditional gauges, GNSS-R has a low-power usage because no transmitter is required. GNSS-R could also provide higher temporal and spatial resolution observation results through a large number of GNSS satellites. The GNSS-I/MR processes and analyzes the GNSS reflected signal from the sea surface to retrieve the height of the antenna above the sea surface. The receiver does not require special modification and does not require a second antenna facing the sea surface. Therefore, it can use existing reference station receiver data, which may be cheaper than the cGNSS-R. However, only the SNR data of GNSS satellites with low elevation angles could be used. The temporal resolution is lower than the cGNSS-R. The roughness of the sea surface and the height of the antenna could also limit the GNSS-I/MR method. The code-based cGNSS-R is noisier than GNSS-IR or carrier-based method, and its power is lower, so it can work stably for a long time with a simple solar power panel. Therefore, the code-based cGNSS-R has a wider range of applications.
This paper has investigated the influence of elevation angle on coastal GNSS-R ocean code-based altimetry for GPS signals (L1 C/A and L5) and BDS B1 signals. The single-point tracking algorithm was used to estimate the time delay of the reflected signal relative to the direct signal, and two types of the characteristic points were used, including the MAX and DER. The MAX and DER methods overestimate and underestimate the antenna height, respectively, because of the existence of incoherent components and the different locations of the feature points. In order to evaluate the elevation angle influence, two coastal altimetry experiments were carried out at the wharf in Dongying from 28 October to 2 November 2020 for GPS-R, and the marine environmental monitoring station in Qingdao, on 3 August 2018, from 10:15 to 21:51 for BDS-R. Theoretical and experimental results show that the height retrieved using MAX and DER methods is significantly sensitive to the elevation angle, and the DER method is more sensitive to elevation angle than the MAX method. Therefore, the elevation angle influence should be corrected to improve the ocean altimetry precision.
The model-driven method and the data-driven method were respectively proposed to correct the elevation angle influence for GPS-R altimetry. The results showed that through the correction using the proposed methods, the mean bias and RMSE of the retrieved height could be reduced. The data-driven method could get a higher altimetry precision because the data-driven function correction of the elevation angle influence is closer to the field experiment. The altimetry precision of the GPS L5 signal was higher than that of the GPS L1 C/A signal and BDS B1 signal because of its higher chipping rate. The data-driven method was proposed to correct the elevation angle influence for BDS-R altimetry based on MEO/IGSO. The altimetry precision, similar to that of GPS L1 C/A signal and BDS GEO, was obtained.
8. Conclusions
The elevation angle influence on coastal GNSS-R ocean code-based altimetry has been investigated, and the corresponding correction method was presented. The elevation angle influence could be corrected by two correction methods, the model-driven method and the data-driven method. Compared with elevation angle, wind speed and wind direction also have a slight modulating effect on the height retrieved using the code-based method. However, the variation of ocean wind speed and wind direction during the field experiment is small, which cannot support the study of wind speed and wind direction influence. Therefore, the correction of wind speed and wind direction influence can also improve the coastal GNSS-R ocean code-based altimetry. Therefore, future improvements to the coastal ocean altimetry method will focus on the correction of wind speed and wind direction influence. More long-term stable experiments for different wind speeds and wind directions will be worked to assess the performance of wind speed and wind direction influence and smoothing over time. The elevation angle influence and the corresponding correction method of GNSS-R ocean code-based altimetry for different altitude platforms and different locations may be different. Future research on elevation angle influence on GNSS-R ocean altimetry will also focus on the different altitude platforms, such as airborne and spaceborne platforms, and different locations.
Author Contributions
Conceptualization, G.Z., Z.X., D.Y., and F.W.; methodology, G.Z. and F.W.; software, G.Z.; validation, G.Z., Z.X., and F.W.; formal analysis, G.Z.; investigation, J.X. and Z.X.; resources, D.Y.; data curation, G.Z. and F.W.; writing—original draft preparation, G.Z.; writing—review and editing, F.W. and D.Y.; visualization, G.Z., Z.X., and J.X.; supervision, D.Y.; project administration, D.Y.; funding acquisition, D.Y. and F.W. All authors have read and agreed to the published version of the manuscript.
Funding
This research was funded by the China Postdoctoral Innovation Talent Support Program (No. BX20200039), and the National Natural Science Foundation of China (No. 41774028).
Institutional Review Board Statement
Not applicable.
Informed Consent Statement
Not applicable.
Data Availability Statement
Not applicable.
Acknowledgments
The authors would like to thank Wei Liu, Yongqing Yu, Linfeng Wang, Xiang Dong, Haining Wang, and Pengfei Zhu for providing access to local tide gauge data and helping with the coastal altimetry experiment.
Conflicts of Interest
The authors declare no conflict of interest.
References
- Martin-Neira, M. A passive reflectometry and interferometry system (PARIS): Application to ocean altimetry. ESA J. 1993, 17, 331–355. [Google Scholar]
- Li, W.; Rius, A.; Fabra, F.; Cardellach, E.; Ribó, S.; Martín-Neira, M. Revisiting the GNSS-R Waveform Statistics and Its Impact on Altimetric Retrievals. IEEE Trans. Geosci. Remote Sens. 2018, 56, 2854–2871. [Google Scholar] [CrossRef]
- Larson, K.M.; Ray, R.D.; Williams, S.D. A 10-year comparison of water levels measured with a geodetic GPS receiver versus a conventional tide gauge. J. Atmos. Ocean. Technol. 2017, 34, 295–307. [Google Scholar] [CrossRef] [Green Version]
- Wang, F.; Yang, D.; Zhang, B.; Li, W.; Darrozes, J. Wind speed retrieval using coastal ocean-scattered GNSS signals. IEEE J. Sel. Top. Appl. Earth Obs. Remote Sens. 2016, 9, 5272–5283. [Google Scholar] [CrossRef]
- Yan, Q.; Huang, W. Spaceborne GNSS-R Sea Ice Detection Using Delay-Doppler Maps: First Results From the U.K. TechDemoSat-1 Mission. IEEE J. Sel. Top. Appl. Earth Obs. Remote Sens. 2016, 9, 4795–4801. [Google Scholar] [CrossRef]
- Yan, Q.; Huang, W. Sea Ice Sensing From GNSS-R Data Using Convolutional Neural Networks. IEEE Geosci. Remote Sens. Lett. 2018, 15, 1510–1514. [Google Scholar] [CrossRef]
- Li, W.; Cardellach, E.; Fabra, F.; Rius, A.; Ribó, S.; Martín-Neira, M. First spaceborne phase altimetry over sea ice using TechDemoSat-1 GNSS-R signals. Geophys. Res. Lett. 2017, 44, 8369–8376. [Google Scholar] [CrossRef]
- Alonso-Arroyo, A.; Camps, A.; Park, H.; Pascual, D.; Onrubia, R.; Martín, F. Retrieval of significant wave height and mean sea surface level using the GNSS-R interference pattern technique: Results from a three-month field campaign. IEEE Trans. Geosci. Remote Sens. 2014, 53, 3198–3209. [Google Scholar] [CrossRef] [Green Version]
- Larson, K.M.; Small, E.E. Normalized microwave reflection index: A vegetation measurement derived from GPS networks. IEEE J. Sel. Top. Appl. Earth Obs. Remote Sens. 2014, 7, 1501–1511. [Google Scholar] [CrossRef]
- Chew, C.; Shah, R.; Zuffada, C.; Hajj, G.; Masters, D.; Mannucci, A.J. Demonstrating soil moisture remote sensing with observations from the UK TechDemoSat-1 satellite mission. Geophys. Res. Lett. 2016, 43, 3317–3324. [Google Scholar] [CrossRef] [Green Version]
- Di Simone, A.; Park, H.; Riccio, D.; Camps, A. Sea target detection using spaceborne GNSS-R delay-Doppler maps: Theory and experimental proof of concept using TDS-1 data. IEEE J. Sel. Top. Appl. Earth Obs. Remote Sens. 2017, 10, 4237–4255. [Google Scholar] [CrossRef]
- Larson, K.M.; MacFerrin, M.; Nylen, T. Brief Communication: Update on the GPS reflection technique for measuring snow accumulation in Greenland. Cryosphere 2020, 14, 1985–1988. [Google Scholar] [CrossRef]
- Gleason, S.; Hodgart, S.; Sun, Y.; Gommenginger, C.; Mackin, S.; Adjrad, M.; Unwin, M. Detection and processing of bistatically reflected GPS signals from low earth orbit for the purpose of ocean remote sensing. IEEE Trans. Geosci. Remote Sens. 2005, 43, 1229–1241. [Google Scholar] [CrossRef] [Green Version]
- Foti, G.; Gommenginger, C.; Jales, P.; Unwin, M.; Shaw, A.; Robertson, C.; Rosello, J. Spaceborne GNSS reflectometry for ocean winds: First results from the UK TechDemoSat-1 mission. Geophys. Res. Lett. 2015, 42, 5435–5441. [Google Scholar] [CrossRef] [Green Version]
- Ruf, C.S.; Gleason, S.; Jelenak, Z.; Katzberg, S.; Ridley, A.; Rose, R.; Scherrer, J.; Zavorotny, V. The CYGNSS nanosatellite constellation hurricane mission. In Proceedings of the 2012 IEEE International Geoscience and Remote Sensing Symposium, Munich, Germany, 22–27 July 2012; pp. 214–216. [Google Scholar] [CrossRef]
- Jing, C.; Niu, X.; Duan, C.; Lu, F.; Di, G.; Yang, X. Sea Surface Wind Speed Retrieval from the First Chinese GNSS-R Mission: Technique and Preliminary Results. Remote Sens. 2019, 11, 3013. [Google Scholar] [CrossRef] [Green Version]
- Purnell, D.J.; Gomez, N.; Minarik, W.; Porter, D.; Langston, G. Precise water level measurements using low-cost GNSS antenna arrays. Earth Surf. Dynam. 2021, 9, 673–685. [Google Scholar] [CrossRef]
- Clarizia, M.P.; Ruf, C.; Cipollini, P.; Zuffada, C. First spaceborne observation of sea surface height using GPS-Reflectometry. Geophys. Res. Lett. 2016, 43, 767–774. [Google Scholar] [CrossRef] [Green Version]
- Li, W.; Cardellach, E.; Fabra, F.; Ribó, S.; Rius, A. Assessment of spaceborne GNSS-R ocean altimetry performance using CYGNSS mission raw data. IEEE Trans. Geosci. Remote Sens. 2019, 58, 238–250. [Google Scholar] [CrossRef]
- Larson, K.M.; Ray, R.D.; Nievinski, F.G.; Freymueller, J.T. The Accidental Tide Gauge: A GPS Reflection Case Study From Kachemak Bay, Alaska. IEEE Geosci. Remote Sens. Lett. 2013, 10, 1200–1204. [Google Scholar] [CrossRef] [Green Version]
- Larson, K.M.; Loefgren, J.S.; Haas, R. Coastal sea level measurements using a single geodetic GPS receiver. Adv. Space Res. 2013, 51, 1301–1310. [Google Scholar] [CrossRef] [Green Version]
- Larson, K.M.; Lay, T.; Yamazaki, Y.; Cheung, K.F.; Ye, L.; Williams, S.D.; Davis, J.L. Dynamic sea level variation from GNSS: 2020 Shumagin earthquake tsunami resonance and Hurricane Laura. Geophys. Res. Lett. 2021, 48, e2020GL091378. [Google Scholar] [CrossRef]
- Fagundes, M.A.R.; Mendonça-Tinti, I.; Iescheck, A.L.; Akos, D.M.; Geremia-Nievinski, F. An open-source low-cost sensor for SNR-based GNSS reflectometry: Design and long-term validation towards sea-level altimetry. GPS Solut. 2021, 25, 73. [Google Scholar] [CrossRef]
- Song, M.; He, X.; Wang, X.; Jia, D.; Xiao, R.; Shi, H.; Wu, Y. Study on the Exploration of Spaceborne GNSS-R Raw Data Focusing on Altimetry. IEEE J. Sel. Top. Appl. Earth Obs. Remote Sens. 2020, 13, 6142–6154. [Google Scholar] [CrossRef]
- Zhang, Y.; Tian, L.; Meng, W.; Gu, Q.; Han, Y.; Hong, Z. Feasibility of code-level altimetry using coastal BeiDou reflection (BeiDou-R) setups. IEEE J. Sel. Top. Appl. Earth Obs. Remote Sens. 2015, 8, 4130–4140. [Google Scholar] [CrossRef]
- Anderson, K.D. Determination of water level and tides using interferometric observations of GPS signals. J. Atmos. Ocean. Technol. 2000, 17, 1118–1127. [Google Scholar] [CrossRef]
- Purnell, D.; Gomez, N.; Chan, N.H.; Strandberg, J.; Holland, D.M.; Hobiger, T. Quantifying the Uncertainty in Ground-Based GNSS-Reflectometry Sea Level Measurements. IEEE J. Sel. Top. Appl. Earth Obs. Remote Sens. 2020, 13, 4419–4428. [Google Scholar] [CrossRef]
- Loefgren, J.S.; Haas, R.; Scherneck, H.G. Sea level time series and ocean tide analysis from multipath signals at five GPS sites in different parts of the world. J. Geodyn. 2014, 80, 66–80. [Google Scholar] [CrossRef] [Green Version]
- Roussel, N.; Ramillien, G.; Frappart, F.; Darrozes, J.; Gay, A.; Biancale, R.; Striebig, N.; Hanquiez, V.; Bertin, X.; Allain, D. Sea level monitoring and sea state estimate using a single geodetic receiver. Remote Sens. Environ. 2015, 171, 261–277. [Google Scholar] [CrossRef]
- Löfgren, J.S.; Haas, R.; Johansson, J.M. Monitoring coastal sea level using reflected GNSS signals. Adv. Space Res. 2011, 47, 213–220. [Google Scholar] [CrossRef] [Green Version]
- Li, W.; Cardellach, E.; Fabra, F.; Ribo, S.; Rius, A. Lake level and surface topography measured with spaceborne GNSS-reflectometry from CYGNSS mission: Example for the lake Qinghai. Geophys. Res. Lett. 2018, 45, 13332–13341. [Google Scholar] [CrossRef]
- Helm, A. Ground-based GPS altimetry with the L1 OpenGPS receiver using carrier phase-delay observations of reflected GPS signals; Deutsches GeoForschungsZentrum GFZ Potsdam: Potsdam, Germany, 2008. [Google Scholar]
- Liu, W.; Beckheinrich, J.; Semmling, M.; Ramatschi, M.; Vey, S.; Wickert, J.; Hobiger, T.; Haas, R. Coastal sea-level measurements based on gnss-r phase altimetry: A case study at the onsala space observatory, sweden. IEEE Trans. Geosci. Remote Sens. 2017, 55, 5625–5636. [Google Scholar] [CrossRef]
- Martín-Neira, M.; Caparrini, M.; Font-Rossello, J.; Lannelongue, S.; Vallmitjana, C.S. The PARIS concept: An experimental demonstration of sea surface altimetry using GPS reflected signals. IEEE Trans. Geosci. Remote Sens. 2001, 39, 142–150. [Google Scholar] [CrossRef] [Green Version]
- Semmling, A.M.; Leister, V.; Saynisch, J.; Zus, F.; Heise, S.; Wickert, J. A phase-altimetric simulator: Studying the sensitivity of Earth-reflected GNSS signals to ocean topography. IEEE Trans. Geosci. Remote Sens. 2016, 54, 6791–6802. [Google Scholar] [CrossRef]
- Wu, J.; Chen, Y.; Gao, F.; Guo, P.; Wang, X.; Niu, X.; Wu, M.; Fu, N. Sea Surface Height Estimation by Ground-Based BDS GEO Satellite Reflectometry. IEEE J. Sel. Top. Appl. Earth Obs. Remote Sens. 2020, 13, 5550–5559. [Google Scholar] [CrossRef]
- Pascual, D.; Camps, A.; Martin, F.; Park, H.; Arroyo, A.A.; Onrubia, R. Precision bounds in GNSS-R ocean altimetry. IEEE J. Sel. Top. Appl. Earth Obs. Remote Sens. 2014, 7, 1416–1423. [Google Scholar] [CrossRef]
- Carreno-Luengo, H.; Camps, A.; Ramos-Perez, I.; Rius, A. Experimental evaluation of GNSS-reflectometry altimetric precision using the P (Y) and C/A signals. IEEE J. Sel. Top. Appl. Earth Obs. Remote Sens. 2014, 7, 1493–1500. [Google Scholar] [CrossRef]
- Savas, C.; Falco, G.; Dovis, F. A Comparative Performance Analysis of GPS L1 C/A, L5 Acquisition and Tracking Stages Under Polar and Equatorial Scintillations. IEEE Trans. Aerosp. Electron. Syst. 2020, 57, 227–244. [Google Scholar] [CrossRef]
- Fabra, F.; Cardellach, E.; Ribó, S.; Li, W.; Rius, A.; Arco-Fernández, J.C.; Nogués-Correig, O.; Praks, J.; Rouhe, E.; Seppänen, J.; et al. Is Accurate Synoptic Altimetry Achievable by Means of Interferometric GNSS-R? Remote Sens. 2019, 11, 505. [Google Scholar] [CrossRef] [Green Version]
- Zhang, Y.; Liu, F.; Gu, Q.; Meng, W.; Hong, Z.; Han, Y. Study of accurate ocean-altimetry with GNSS-R. In Proceedings of the 2013 IEEE International Geoscience and Remote Sensing Symposium—IGARSS, Melbourne, Australia, 21–26 July 2013; pp. 1410–1413. [Google Scholar]
- King, L.S.; Unwin, M.; Rawlinson, J.; Guida, R.; Underwood, C. Processing of Raw GNSS Reflectometry Data From TDS-1 in a Backscattering Configuration. IEEE J. Sel. Top. Appl. Earth Obs. Remote Sens. 2020, 13, 2916–2924. [Google Scholar] [CrossRef]
- Zhang, G.; Yang, D.; Yu, Y.; Wang, F. Wind Direction Retrieval Using Spaceborne GNSS-R in Nonspecular Geometry. IEEE J. Sel. Top. Appl. Earth Obs. Remote Sens. 2020, 13, 649–658. [Google Scholar] [CrossRef]
- Ghavidel, A.; Schiavulli, D.; Camps, A. Numerical computation of the electromagnetic bias in GNSS-R altimetry. IEEE Trans. Geosci. Remote Sens. 2015, 54, 489–498. [Google Scholar] [CrossRef] [Green Version]
- Cardellach, E.; Rius, A.; Martín-Neira, M.; Fabra, F.; Nogués-Correig, O.; Ribó, S.; Kainulainen, J.; Camps, A.; D’Addio, S. Consolidating the precision of interferometric GNSS-R ocean altimetry using airborne experimental data. IEEE Trans. Geosci. Remote Sens. 2014, 52, 4992–5004. [Google Scholar] [CrossRef]
- Rius, A.; Aparicio, J.M.; Cardellach, E.; Martín-Neira, M.; Chapron, B. Sea surface state measured using GPS reflected signals. Geophys. Res. Lett. 2002, 29. [Google Scholar] [CrossRef] [Green Version]
- Rius, A.; Cardellach, E.; Martin-Neira, M. Altimetric analysis of the sea-surface GPS-reflected signals. IEEE Trans. Geosci. Remote Sens. 2010, 48, 2119–2127. [Google Scholar] [CrossRef]
- Mashburn, J.; Axelrad, P.; Lowe, S.T.; Larson, K.M. An assessment of the precision and accuracy of altimetry retrievals for a Monterey Bay GNSS-R experiment. IEEE J. Sel. Top. Appl. Earth Obs. Remote Sens. 2016, 9, 4660–4668. [Google Scholar] [CrossRef]
- Hajj, G.A. Theoretical description of a bistatic system for ocean altimetry using the GPS signal. Radio Science 2003. [Google Scholar] [CrossRef]
- Mashburn, J.; Axelrad, P.; Lowe, S.T.; Larson, K.M. Global Ocean Altimetry With GNSS Reflections From TechDemoSat-1. IEEE Trans. Geosci. Remote Sens. 2018, 56, 4088–4097. [Google Scholar] [CrossRef]
- Mashburn, J.; Axelrad, P.; Zuffada, C.; Loria, E.; O’Brien, A.; Haines, B. Improved GNSS-R ocean surface altimetry with CYGNSS in the seas of Indonesia. IEEE Trans. Geosci. Remote Sens. 2020, 58, 6071–6087. [Google Scholar] [CrossRef]
- Beckmann, P.; Spizzichino, A. The Scattering of Electromagnetic Waves from Rough Surfaces; Artech House, Inc.: Norwood, MA, USA, 1987. [Google Scholar]
- Zavorotny, V.U.; Voronovich, A.G. Scattering of GPS signals from the ocean with wind remote sensing application. IEEE Trans. Geosci. Remote Sens. 2000, 38, 951–964. [Google Scholar] [CrossRef] [Green Version]
- Soisuvarn, S.; Jelenak, Z.; Said, F.; Chang, P.S.; Egido, A. The GNSS reflectometry response to the ocean surface winds and waves. IEEE J. Sel. Top. Appl. Earth Obs. Remote Sens. 2016, 9, 4678–4699. [Google Scholar] [CrossRef]
- Guan, D.; Park, H.; Camps, A.; Wang, Y.; Onrubia, R.; Querol, J.; Pascual, D. Wind direction signatures in GNSS-R observables from space. Remote Sens. 2018, 10, 198. [Google Scholar] [CrossRef] [Green Version]
- Voronovich, A.G. Wave Scattering from Rough Surfaces; Springer Science & Business Media: Berlin, Germany, 2013; Volume 17. [Google Scholar]
- Ruf, C.S.; Balasubramaniam, R. Development of the CYGNSS geophysical model function for wind speed. IEEE J. Sel. Top. Appl. Earth Obs. Remote Sens. 2018, 12, 66–77. [Google Scholar] [CrossRef]
Publisher’s Note: MDPI stays neutral with regard to jurisdictional claims in published maps and institutional affiliations. |
© 2021 by the authors. Licensee MDPI, Basel, Switzerland. This article is an open access article distributed under the terms and conditions of the Creative Commons Attribution (CC BY) license (https://creativecommons.org/licenses/by/4.0/).