Abstract
Land use/land cover (LULC) changes have been observed in the Gaborone dam catchment since the 1980s. A comprehensive analysis of future LULC changes is therefore necessary for the purposes of future land use and water resource planning and management. Recent advances in geospatial modelling techniques and the availability of remotely sensed data have become central to the monitoring and assessment of both past and future environmental changes. This study employed the cellular automata and Markov chain (CA-Markov) model combinations to simulate future LULC changes in the Gaborone dam catchment. Classified Landsat images from 1984, 1995, 2005 and 2015 were used to simulate the likely LULCs in 2015 and 2035. Model validation compared the simulated and observed LULCs of 2015 and showed a high level of agreement with Kappa variation estimates of Kno (0.82), Kloc (0.82) and Kstandard (0.76). Simulation results indicated a projected increase of 26.09%, 65.65% and 55.78% in cropland, built-up and bare land categories between 2015 and 2035, respectively. Reductions of 16.03%, 28.76% and 21.89% in areal coverage are expected for shrubland, tree savanna and water body categories, respectively. An increase in built-up and cropland areas is anticipated in order to meet the population’s demand for residential, industry and food production, which should be taken into consideration in future plans for the sustainability of the catchment. In addition, this may lead to water quality and quantity (both surface and groundwater) deterioration in the catchment. Moreover, water body reductions may contribute to water shortages and exacerbate droughts in an already water-stressed catchment. The loss of vegetal cover and an increase in built-up areas may result in increased runoff incidents, leading to flash floods. The output of the study provides useful information for land use planners and water resource managers to make better decisions in improving future land use policies and formulating catchment management strategies within the framework of sustainable land use planning and water resource management.
1. Introduction
Land use/land cover (LULC) changes are a crucial driver of environmental change, and are increasingly becoming a global concern due to their impact on the local, regional and global environments [1,2]. Anthropogenic activities such as increasing population, urbanisation, deforestation, etc., are known to largely drive these changes [3,4]. In addition to anthropogenic activities, biophysical factors also drive environmental changes [5], e.g., climate variability. In semi-arid areas in particular, the effects of LULC changes on water resources are of great concern, as these areas are known to be more vulnerable to both natural and human-induced changes [6]. This often results in modifications in the hydrological cycle [7,8,9] by disrupting hydrological processes such as the interception of water by vegetation, soil water content, runoff quantity, surface evapotranspiration, base flow, groundwater recharge, percolation and the quality of water and sediments [10,11,12,13,14,15]. This therefore changes the hydrological regime and rainfall-runoff mechanisms of an area [16]. It is, however, recognized that the documentation and modeling of LULC patterns offer a better understanding of past and future LULC patterns and their related implications [17,18,19,20] and also guide future land use policies [21]. For water resources in semi-arid areas, this ensures the sustainability of catchments through proactive planning and management [22].
Remote sensing and geographic information systems (GIS) have over the years demonstrated a great potential in understanding landscape dynamics [10] and offer valuable techniques in the wider context of environmental monitoring [23]. Additionally, a number of models to simulate future LULC changes have also been developed. The models provide suitable tools for identifying spatial patterns in LULC. One widely used model with great accuracy is the integrated cellular automata (CA) and Markov chain model (CA-Markov) [6,20,24]. The robustness of the CA-Markov model offers a convenient approach to the spatial and temporal dynamic modelling of LULC changes in complex systems [25,26,27,28]. The model’s ability to integrate geospatial and remotely sensed data and biophysical and socio-economic data enables a more comprehensive simulation of LULC changes from patterns to processes [29]. Numerous studies have successfully employed the CA-Markov model in LULC simulations for different purposes. For instance, Naboureh et al. [30] and Permatasari et al. [4] applied the CA-Markov model to predict land cover changes for the purposes of development planning, informing and formulating land use policies in Jiangle County, China, and Penajam Paser Utara Regency, Indonesia, respectively. In addition, in Zimbabwe, the CA-Markov model was used to simulate future LULCs in the Shashe sub-catchment, in order to detect their impact on the wetland area [6]. Another study by Regmi et al. [31] compared the CA-Markov model with the GEOMOD model to predict future LULC changes in the Phewa Lake Watershed, Nepal, and found that the integration of the CA and Markov models was effective in projecting future LULC scenarios compared to GEOMOD. Considering the model’s vast applications in the field of LULC change analysis and its ability to broaden understandings about complex spatial systems, to the best of our knowledge, no study in Botswana has employed the CA-Markov model to simulate future LULCs, particularly in the country’s important catchments. Therefore, this work will be among the first to test the applicability of the CA-Markov model to simulate future LULC patterns for the Gaborone dam catchment, Botswana, and their implications on future water resource management in the catchment.
The Gaborone dam catchment is one of the most important supply areas of freshwater for the metropolitan city of Gaborone. As a result of rural–urban migration and the population increase in the city of Gaborone, the catchment has been undergoing LULC changes since the 1980s [32]. Additionally, water supply challenges arising from shortfalls in Gaborone dam water levels have also been noted [33]. Moreover, the catchment is a typical representation of an environmentally fragile area due to its semi-arid state; as a result, LULC changes might affect its water quantity and quality. It is therefore necessary to understand the spatio-temporal characteristics of future LULCs for the improved sustainability of the catchment. Based on the background described above, this study simulated future LULC changes and analyzed the expected spatio-temporal patterns for the year 2035 in the Gaborone dam catchment using the CA-Markov model. The output of this study provides useful information for land use planners and water resource managers to make better decisions in improving future land use policies and formulating catchment management strategies within the framework of sustainable land use planning and water resource management. Similarly, the results of the study will assist in lessening the potential effects of LULC modifications in land systems [34,35]. Furthermore, the results of the study can be used for the hydrological assessment of the catchment with particular emphasis on the streamflow response.
2. Materials and Methods
2.1. Description of the Study Area
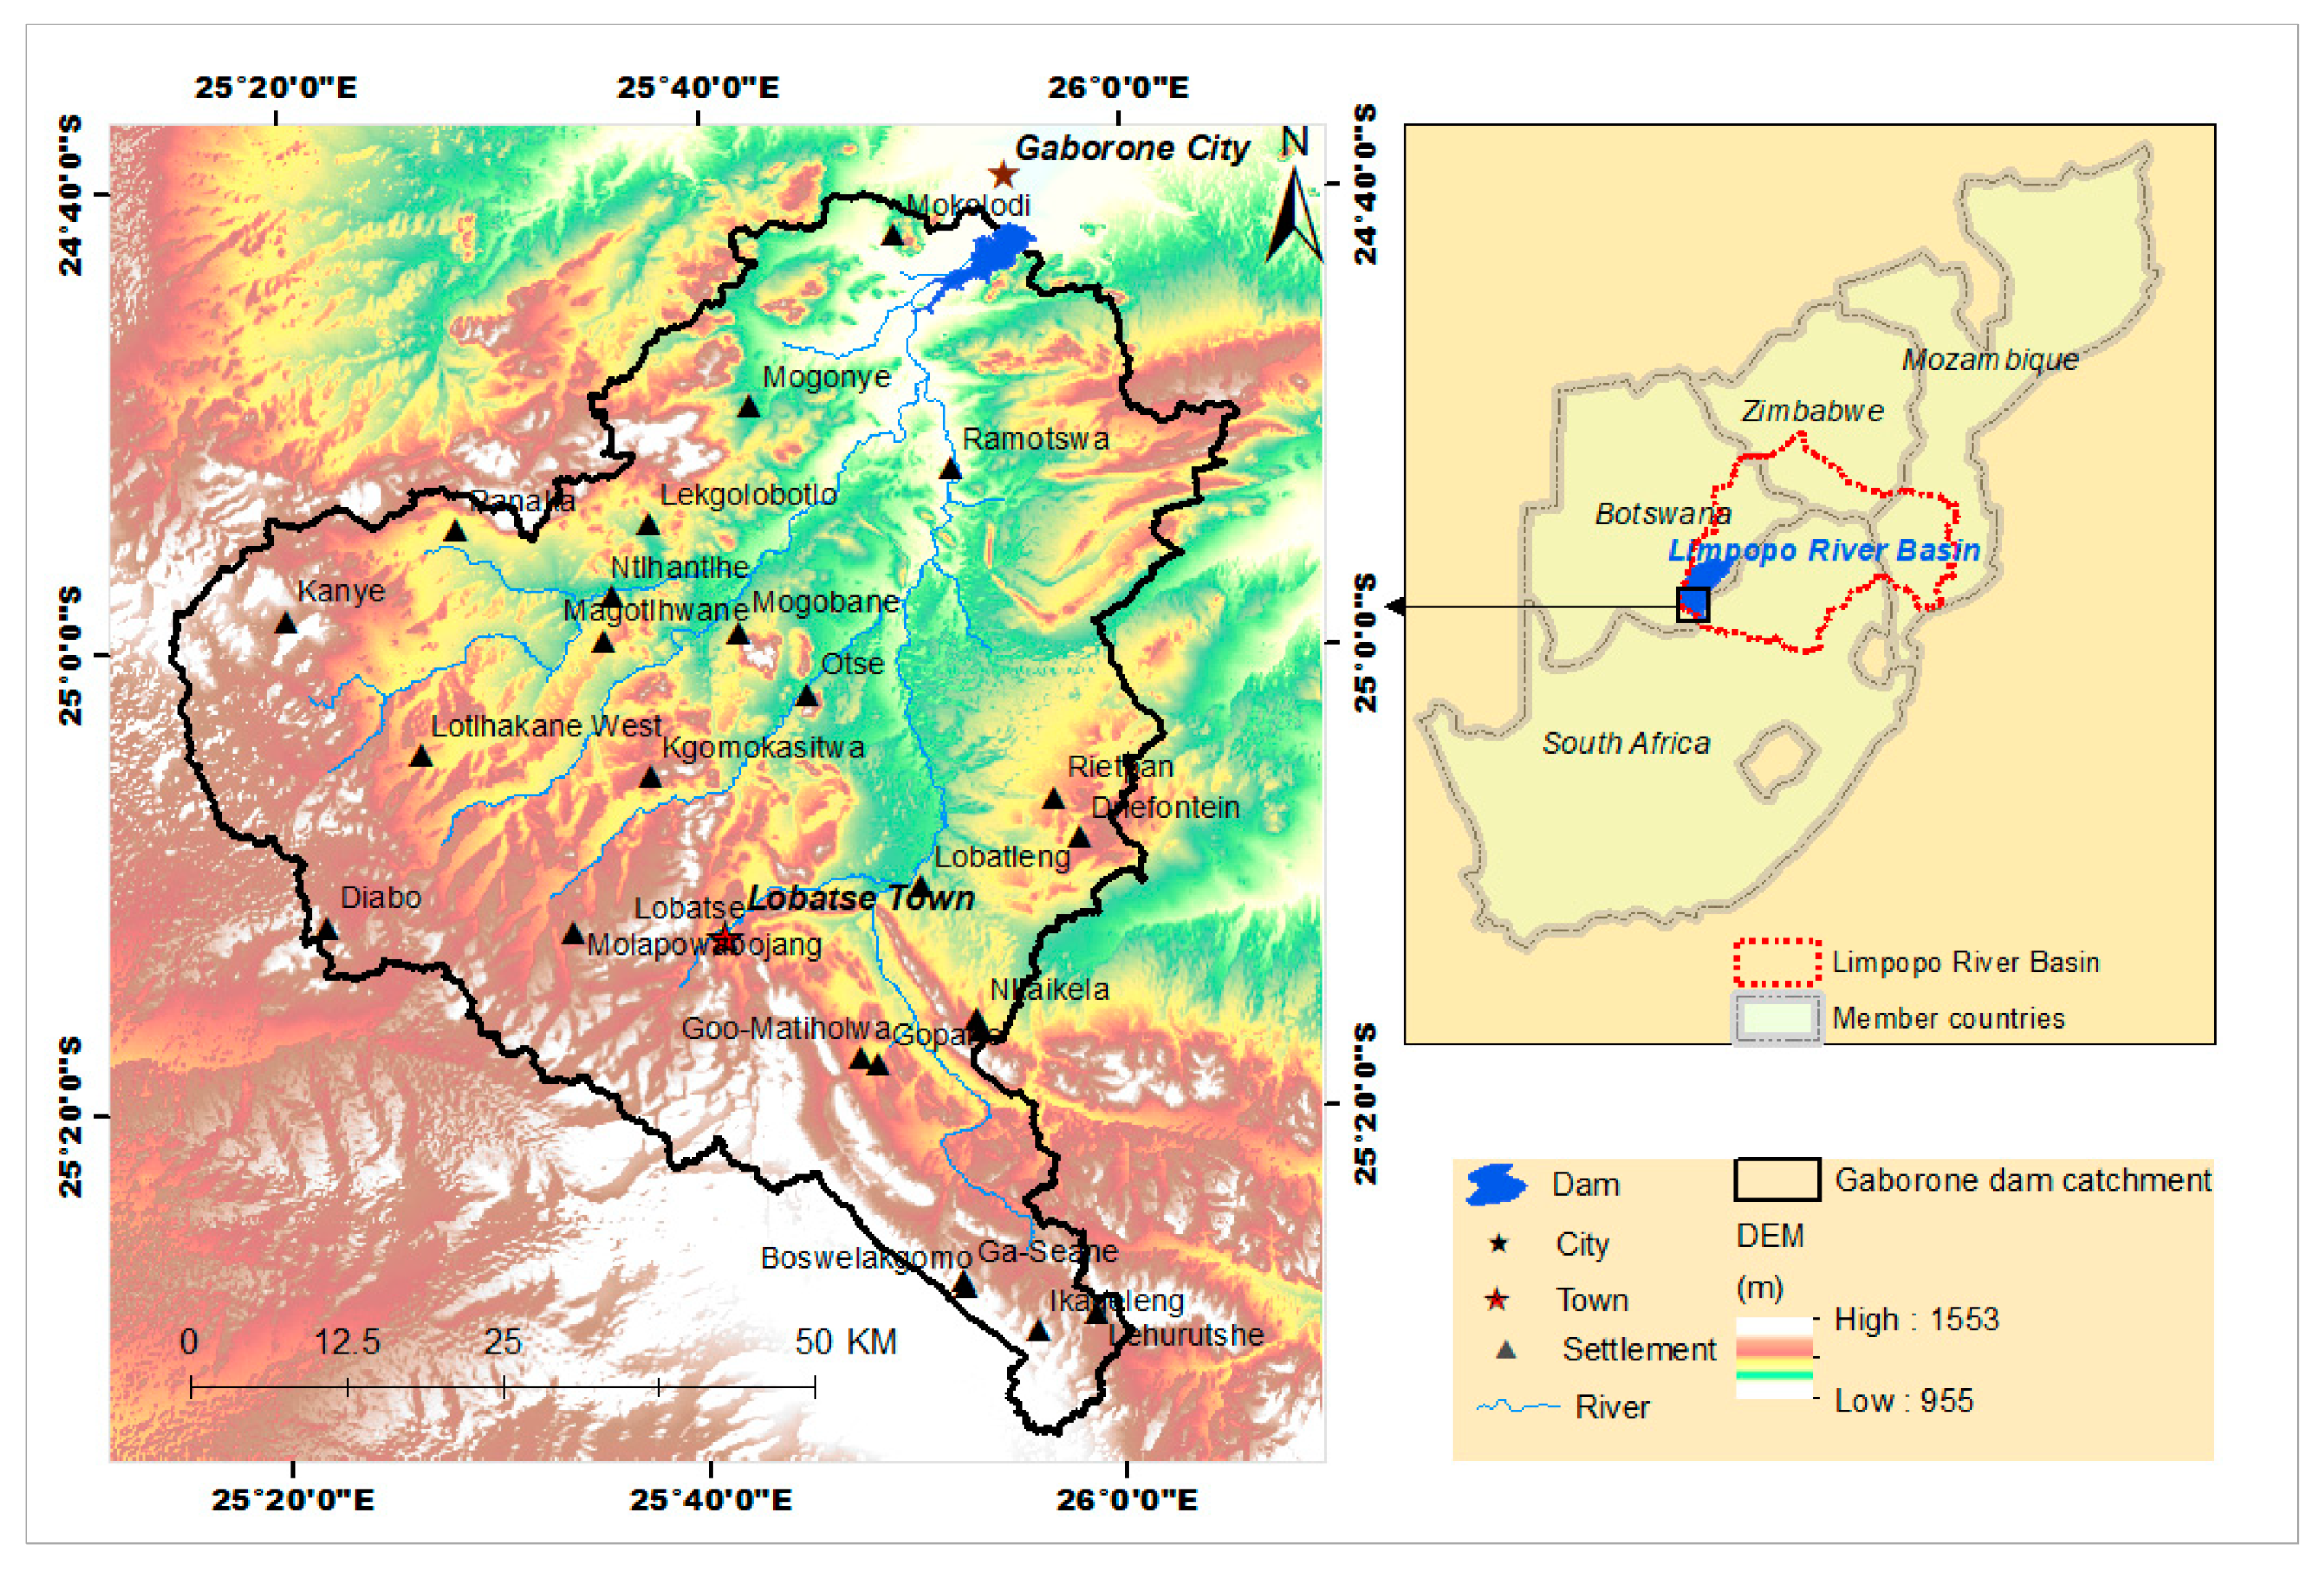
The transboundary Gaborone dam catchment, with a total area of 4000 km2 (Figure 1), is located in the southeastern part of Botswana and the northwest of South Africa. It is an upstream sub-catchment of the Notwane catchment, which forms the headwaters of the Limpopo River Basin in Southern Africa (a transboundary basin between Botswana, South Africa, Zimbabwe and Mozambique). The Notwane River, an ephemeral river [36], forms the main drainage channel, among other tributaries such as the Metsemaswaane and Taung Rivers. The Gaborone dam acts as the catchment outlet. Geographically, the catchment is bordered by latitudes −24.98° to −25.55° and longitudes 25.24° to 26.07°. The catchment experiences a semi-arid climate with long sunny days and dry winter conditions on most days. Summers are hot and winters are cool, with the temperature averaging 33 °C and 20 °C, respectively. The annual rainfall received in the catchment is between 475 mm and 525 mm, with the bulk of the precipitation occurring in the summer months of December to February. Annual evaporation rates are estimated at about 2000 mm [37]. The area covering the catchment is one of the most densely populated in the country [12], with an estimated population of about 474,860 in 2011 and a projected 835,625 people expected to be living within the catchment area by 2024 [38]. Water use in the catchment area is mainly domestic and the demand for water has been growing, mainly due to the increasing population and expansion in industries. The catchment is largely rural, with agriculture as a major livelihood activity for household subsistence. Built-up areas (settlements) and areas of agriculture are the predominant land uses, with agricultural activities making up the largest land use [32]. The vegetation in the catchment can be described as the hard veldt type, consisting of tree and shrub savanna.
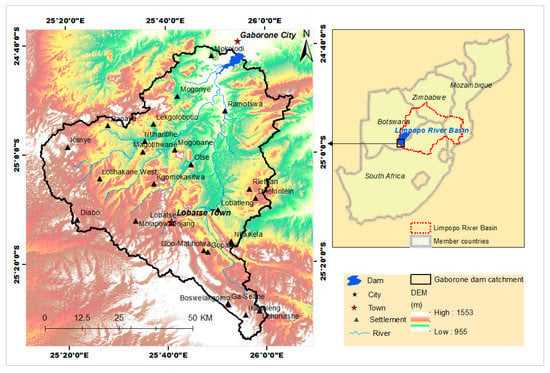
Figure 1.
Locational map of the study area.
2.2. LULC Data Sources and Classification
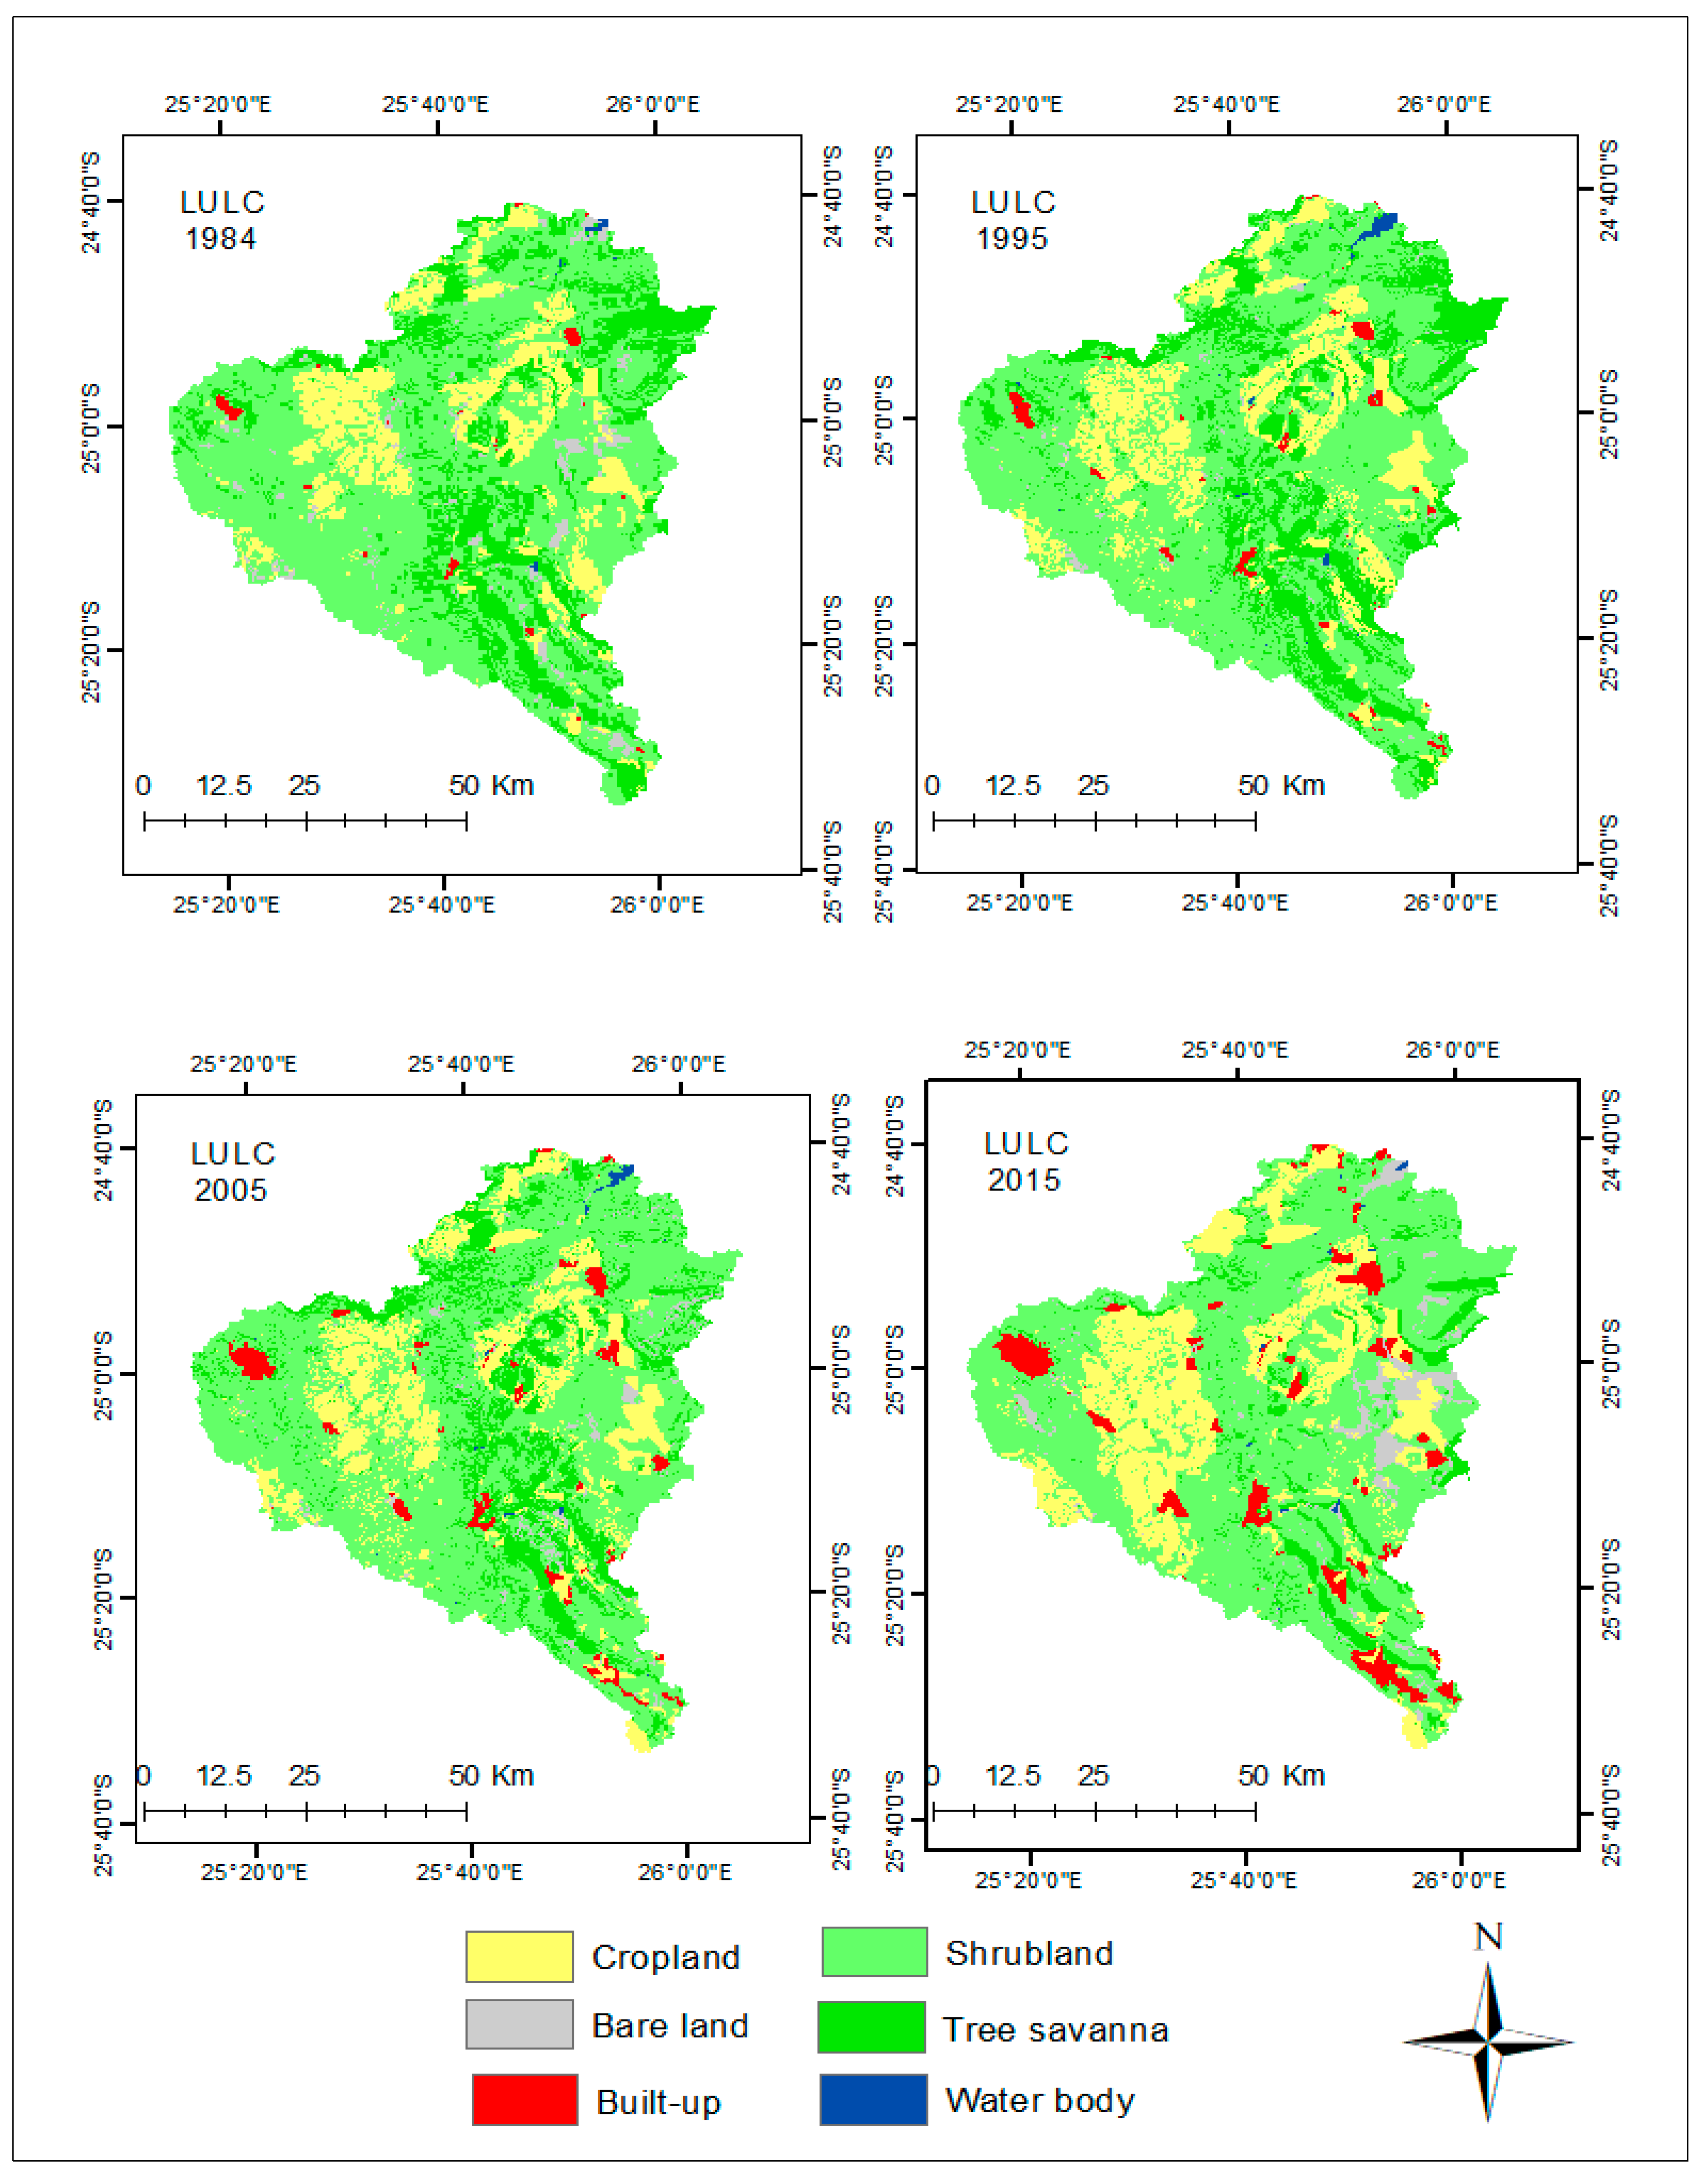
The simulation of future LULCs in the Gaborone dam catchment was based on baseline LULC data (1984–2015) for the catchment, as described in Matlhodi et al. [32]. Therefore, this study is an extension of the previous study done in the catchment. In their previous work, Matlhodi et al. [32] acquired the dry season images of the Landsat Thematic Mapper (TM) and Operational Land Imager (OLI) for the years 1984, 1995, 2005 and 2015 (Table 1) from the United States Geological Survey (USGS) Earth Explorer (http://earthexplorer.usgs.gov, accessed on 10 March 2021). Supervised classification using the maximum likelihood classifier (MLC) algorithm in ERDAS Imagine 2015 was employed to measure the spatial and temporal patterns in LULCs in the catchment. Six major LULC categories (cropland, bare land, shrub land, built-up, tree savanna and water body) were identified based on the Food and Agricultural Organization (FAO) LULC classification system [39]. The classification results are shown in Figure 2. The overall classification accuracy ranged between 80% and 86%, with Kappa coefficients greater than 0.75 [32], implying an acceptable accuracy for LULC classification.

Table 1.
Landsat image characteristics used for the study [32].
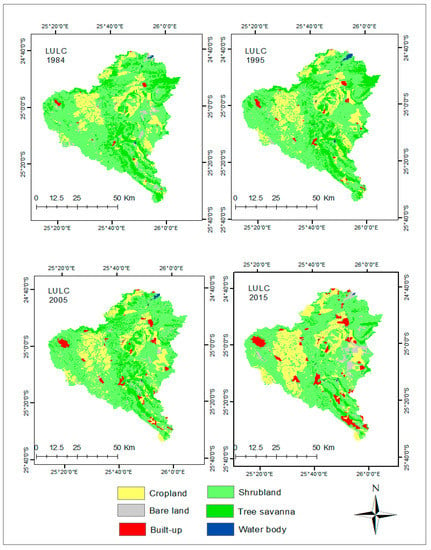
Figure 2.
Classified Landsat images for 1984, 1995, 2005 and 2015 for the Gaborone dam catchment [32].
2.3. A Model Approach
For this study, the CA-Markov model was used to simulate future LULCs. CA-Markov is a change/time series model, integrating the standard Markov model and cellular automata (CA) for the prediction and modelling of future LULC changes. In the CA-Markov model, the Markov chain model, a discrete-temporal stochastic model, simulates LULC change probabilities using a transition probability matrix [40,41,42]. The transition probability between two states (t1 and t2) are then used to determine the transition trend among the different LULC states [19,43]. A disadvantage of the Markov chain model is its inability to provide a spatial distribution of the LULC occurrences, but rather an estimate of the magnitude of these changes [24,44]. Cellular automata (CA) however, have the ability to change and control complex spatially distributed processes, with a strong ability to simulate the spatio-temporal characteristics of complex systems [45,46]. The model is based on the interaction of the cellular space, grid size, cell neighborhood and transition rules [47,48,49] to generate rich patterns and effectively represent non-linear spatially stochastic LULC change processes [50]. The models are expressed as shown in Equations (1)–(3) (Markov chain model) [26,51,52] and Equation (4) (CA) [53].
where Pij is the state transition probability matrix and n is the LULC type number; S is LULC status and t; t + 1 is the time point.
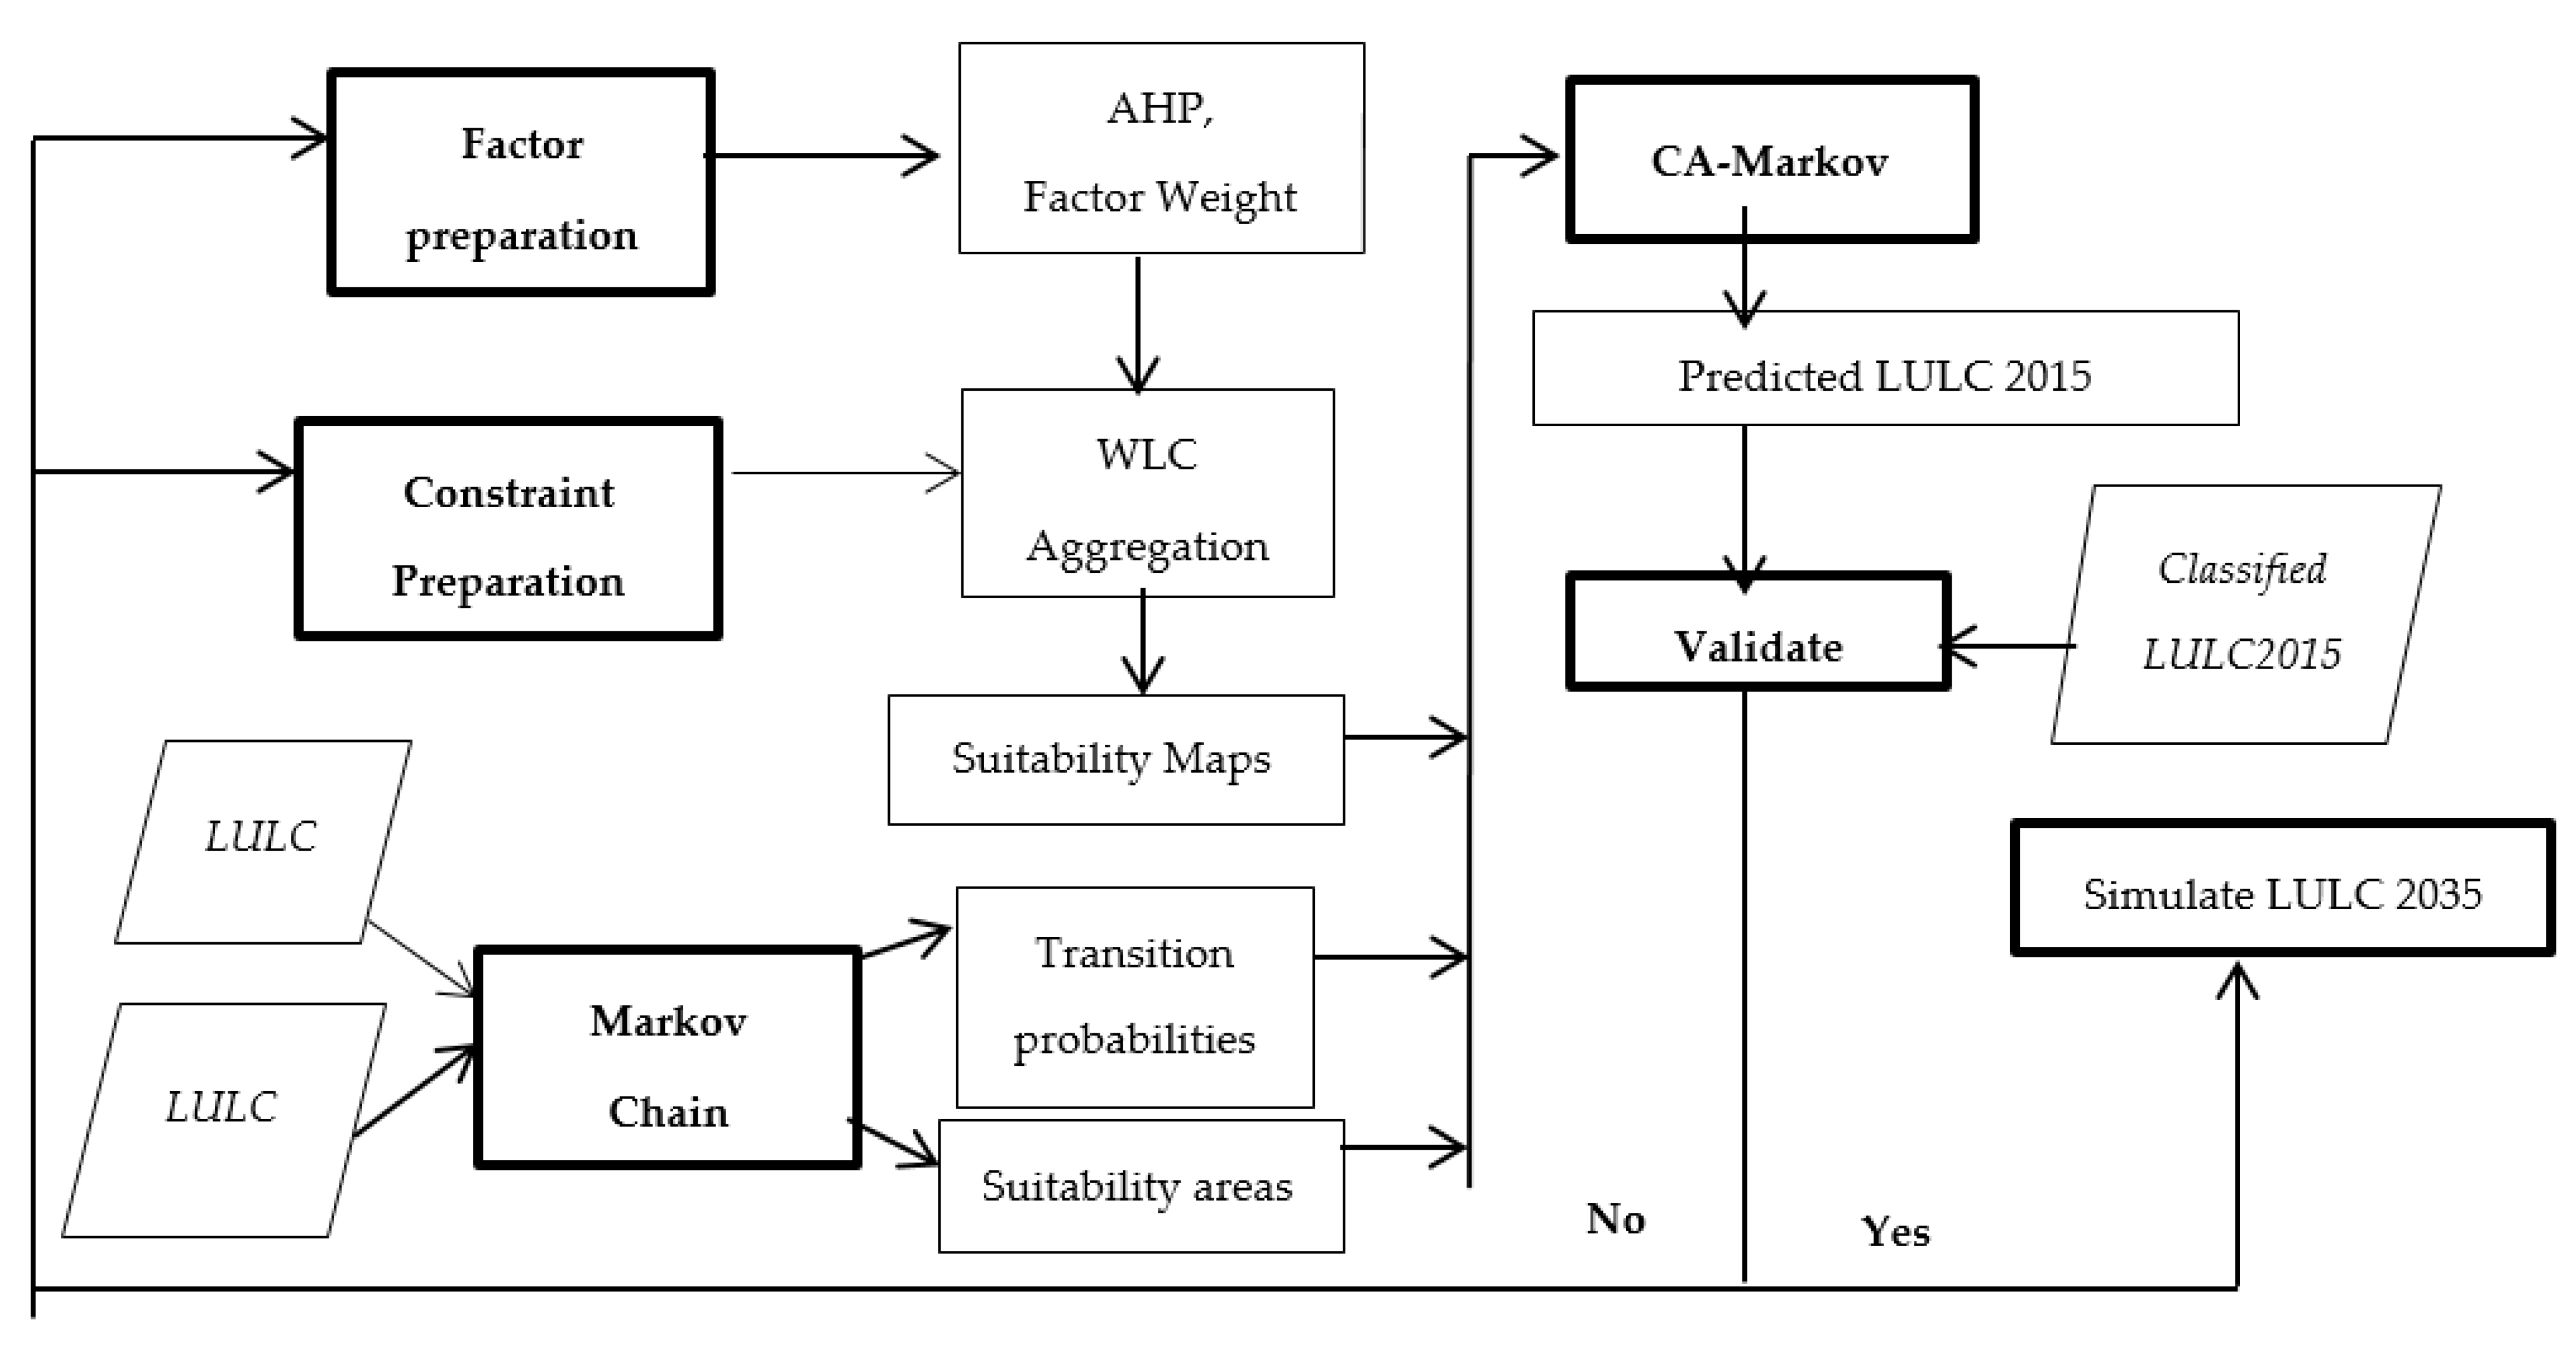
where S(t + 1) and S(t) are respectively the states of all cells at t + 1 and t, N is the neighborhoods of cells and f(.) is the transition function that defines the changes of states based on predefined rules [54]. The methodological framework used in this study is presented in Figure 3.
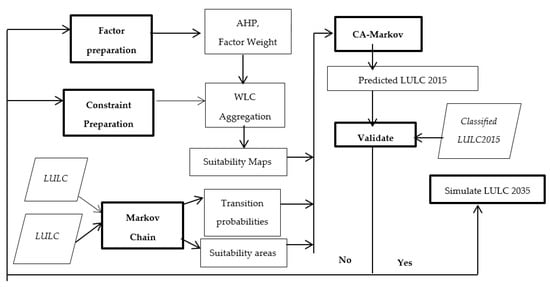
Figure 3.
Modelling framework for LULC change simulation.
2.4. LULC Modelling with CA-Markov Model
The CA-Markov model in IDRISI was employed in this study to simulate future LULCs in the Gaborone dam catchment. The LULC data as derived in Matlhodi et al. [32] (see in Section 2.2) were first used to derive the transition area files and transition probabilities between 1984–1995, 1995–2005 and 2005–2015 for each LULC category using the Markov module. Transition area files carry the area of cells expected to change in the next time period, whereas the transition probabilities show the possibilities that a pixel of a given LULC category will remain the same or change to any other category in the next time period [55].
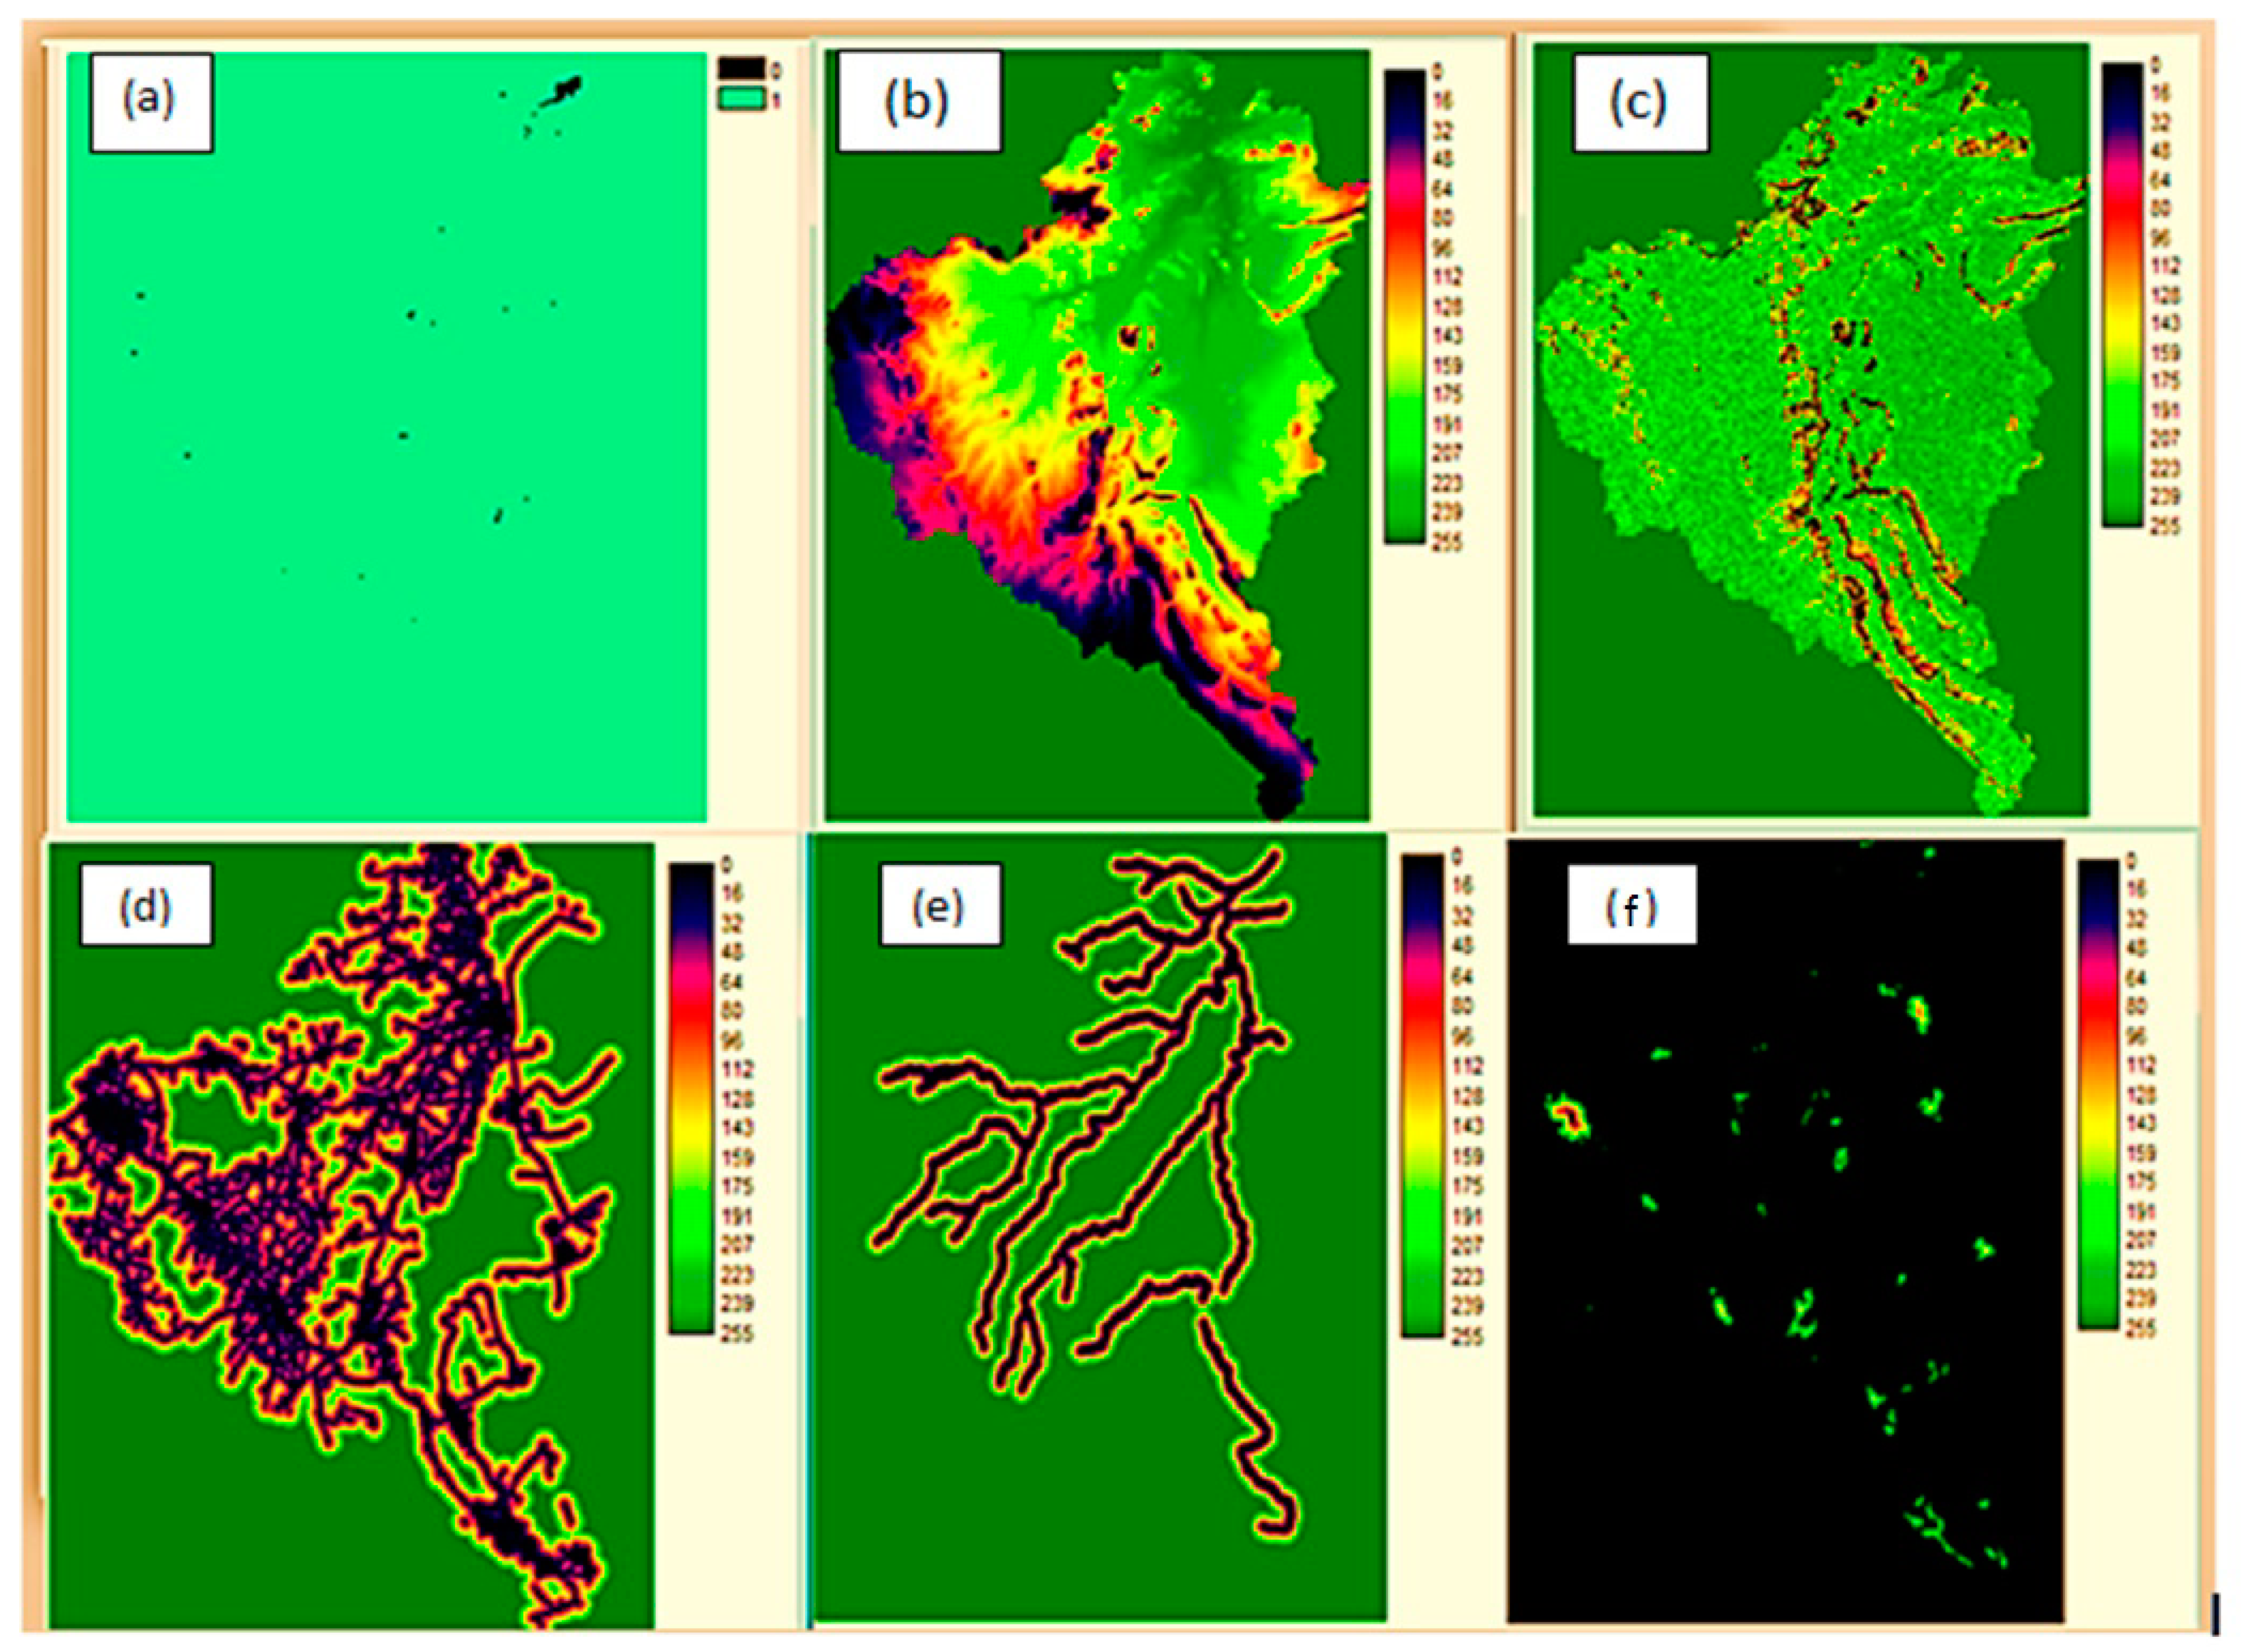
We also derived the transition suitability maps for each LULC category using a collection of factors and constraints. This was done using multi-criteria analysis (MCE) and based on expert understanding of the interactions and influence of the factors on LULC [17]. Constraints are criteria that limit LULC change and are expressed in the form of Boolean images (0 to 1), with the value of ‘0’ representing areas restricted for suitability analysis (e.g. water bodies), whereas ‘1’ represents areas suitable for suitability analysis. Factors, on the other hand, are mostly distance criteria and give a degree of suitability for an area to change [56] (e.g., distance to roads or rivers [26,57]). Other factors include slope (which determines the land’s usefulness for humans) and elevation, which is a good predictor for areas suitable for agriculture [58]. Factors were then subjected to standardisation through fuzzy membership functions, where factors were stretched from 0–255 using different fuzzy functions and control points, e.g., as sigmoidal, J-shaped and linear [58], as shown in Table 2. The analytic hierarchy process (AHP) function was then used to derive weights for each factor based on the relative importance of the factor in influencing the suitability of a certain landscape surface for a given LULC type [59]. The factors and constraints used are shown in Figure 4.

Table 2.
Factors, constraints, membership functions and control points used for the preparation of suitability maps (modified from Gidey et al. [61] and Hyandye and Martz [25]).
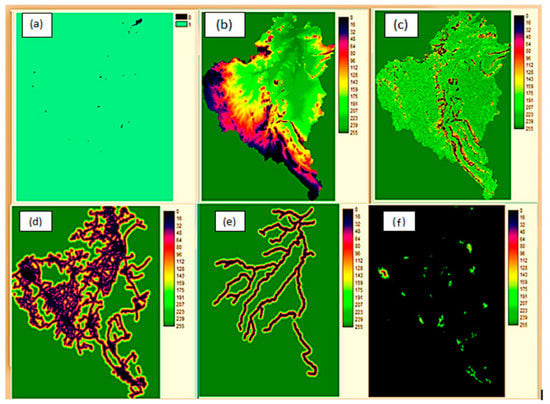
Figure 4.
Factor and constraint maps—water body (a); elevation (b); slope (c); distance to roads (d); distance to rivers (e) distance to built-up areas (f).
The LULC of 2015 was then simulated using the LULC of 2005 as the base map, transition area matrix and the transition probabilities of 1995–2005 for model validation purposes. A 5 × 5 contingency filter was employed to generate a spatially explicit contiguity-weighting factor to change the state of cells based on the adjacent cellular state [60].
2.5. CA-Markov Model Validation
As stated by Eastman [55], the usefulness of any predictive change model depends on the output of the validation process. In this study, the performance of the CA-Markov model was assessed using Kappa indices, which include the Kappa for no information (Kno), Kappa for location (Klocation) and Kappa standard (Kstandard), as described in Table 3 [26,62]. Kappa indices discriminate between errors of quantity and errors of location between two qualitative maps [27,63] and are calculated using Equations (5)–(7) [64]. The result is usually between 0 and 1. The level of agreement for Kappa indices is as follows: Kappa ≤ 0.5 indicates rare agreement; 0.5 ≤ Kappa ≤ 0.75 indicates a medium level of agreement; 0.75 ≤ Kappa < 1 indicates a high level of agreement; and Kappa = 1 denotes perfect agreement [62,65].

Table 3.
Definitions of Kappa indices.
Using the “validate” module the classified LULC of 2015 and the simulated LULC of 2015 were compared. With acceptable Kappa indices, the CA-Markov model was thus adoptable for simulation of the LULC map of 2035 using the 2005–2015 transition probabilities and the 2015 classified map as the basis map.
where no information is defined by N(n), medium grid cell-level information by M(m), N(m) and P(m), and perfect grid cell-level information across the landscape by P(p).
3. Results
3.1. CA-Markov Model Validation
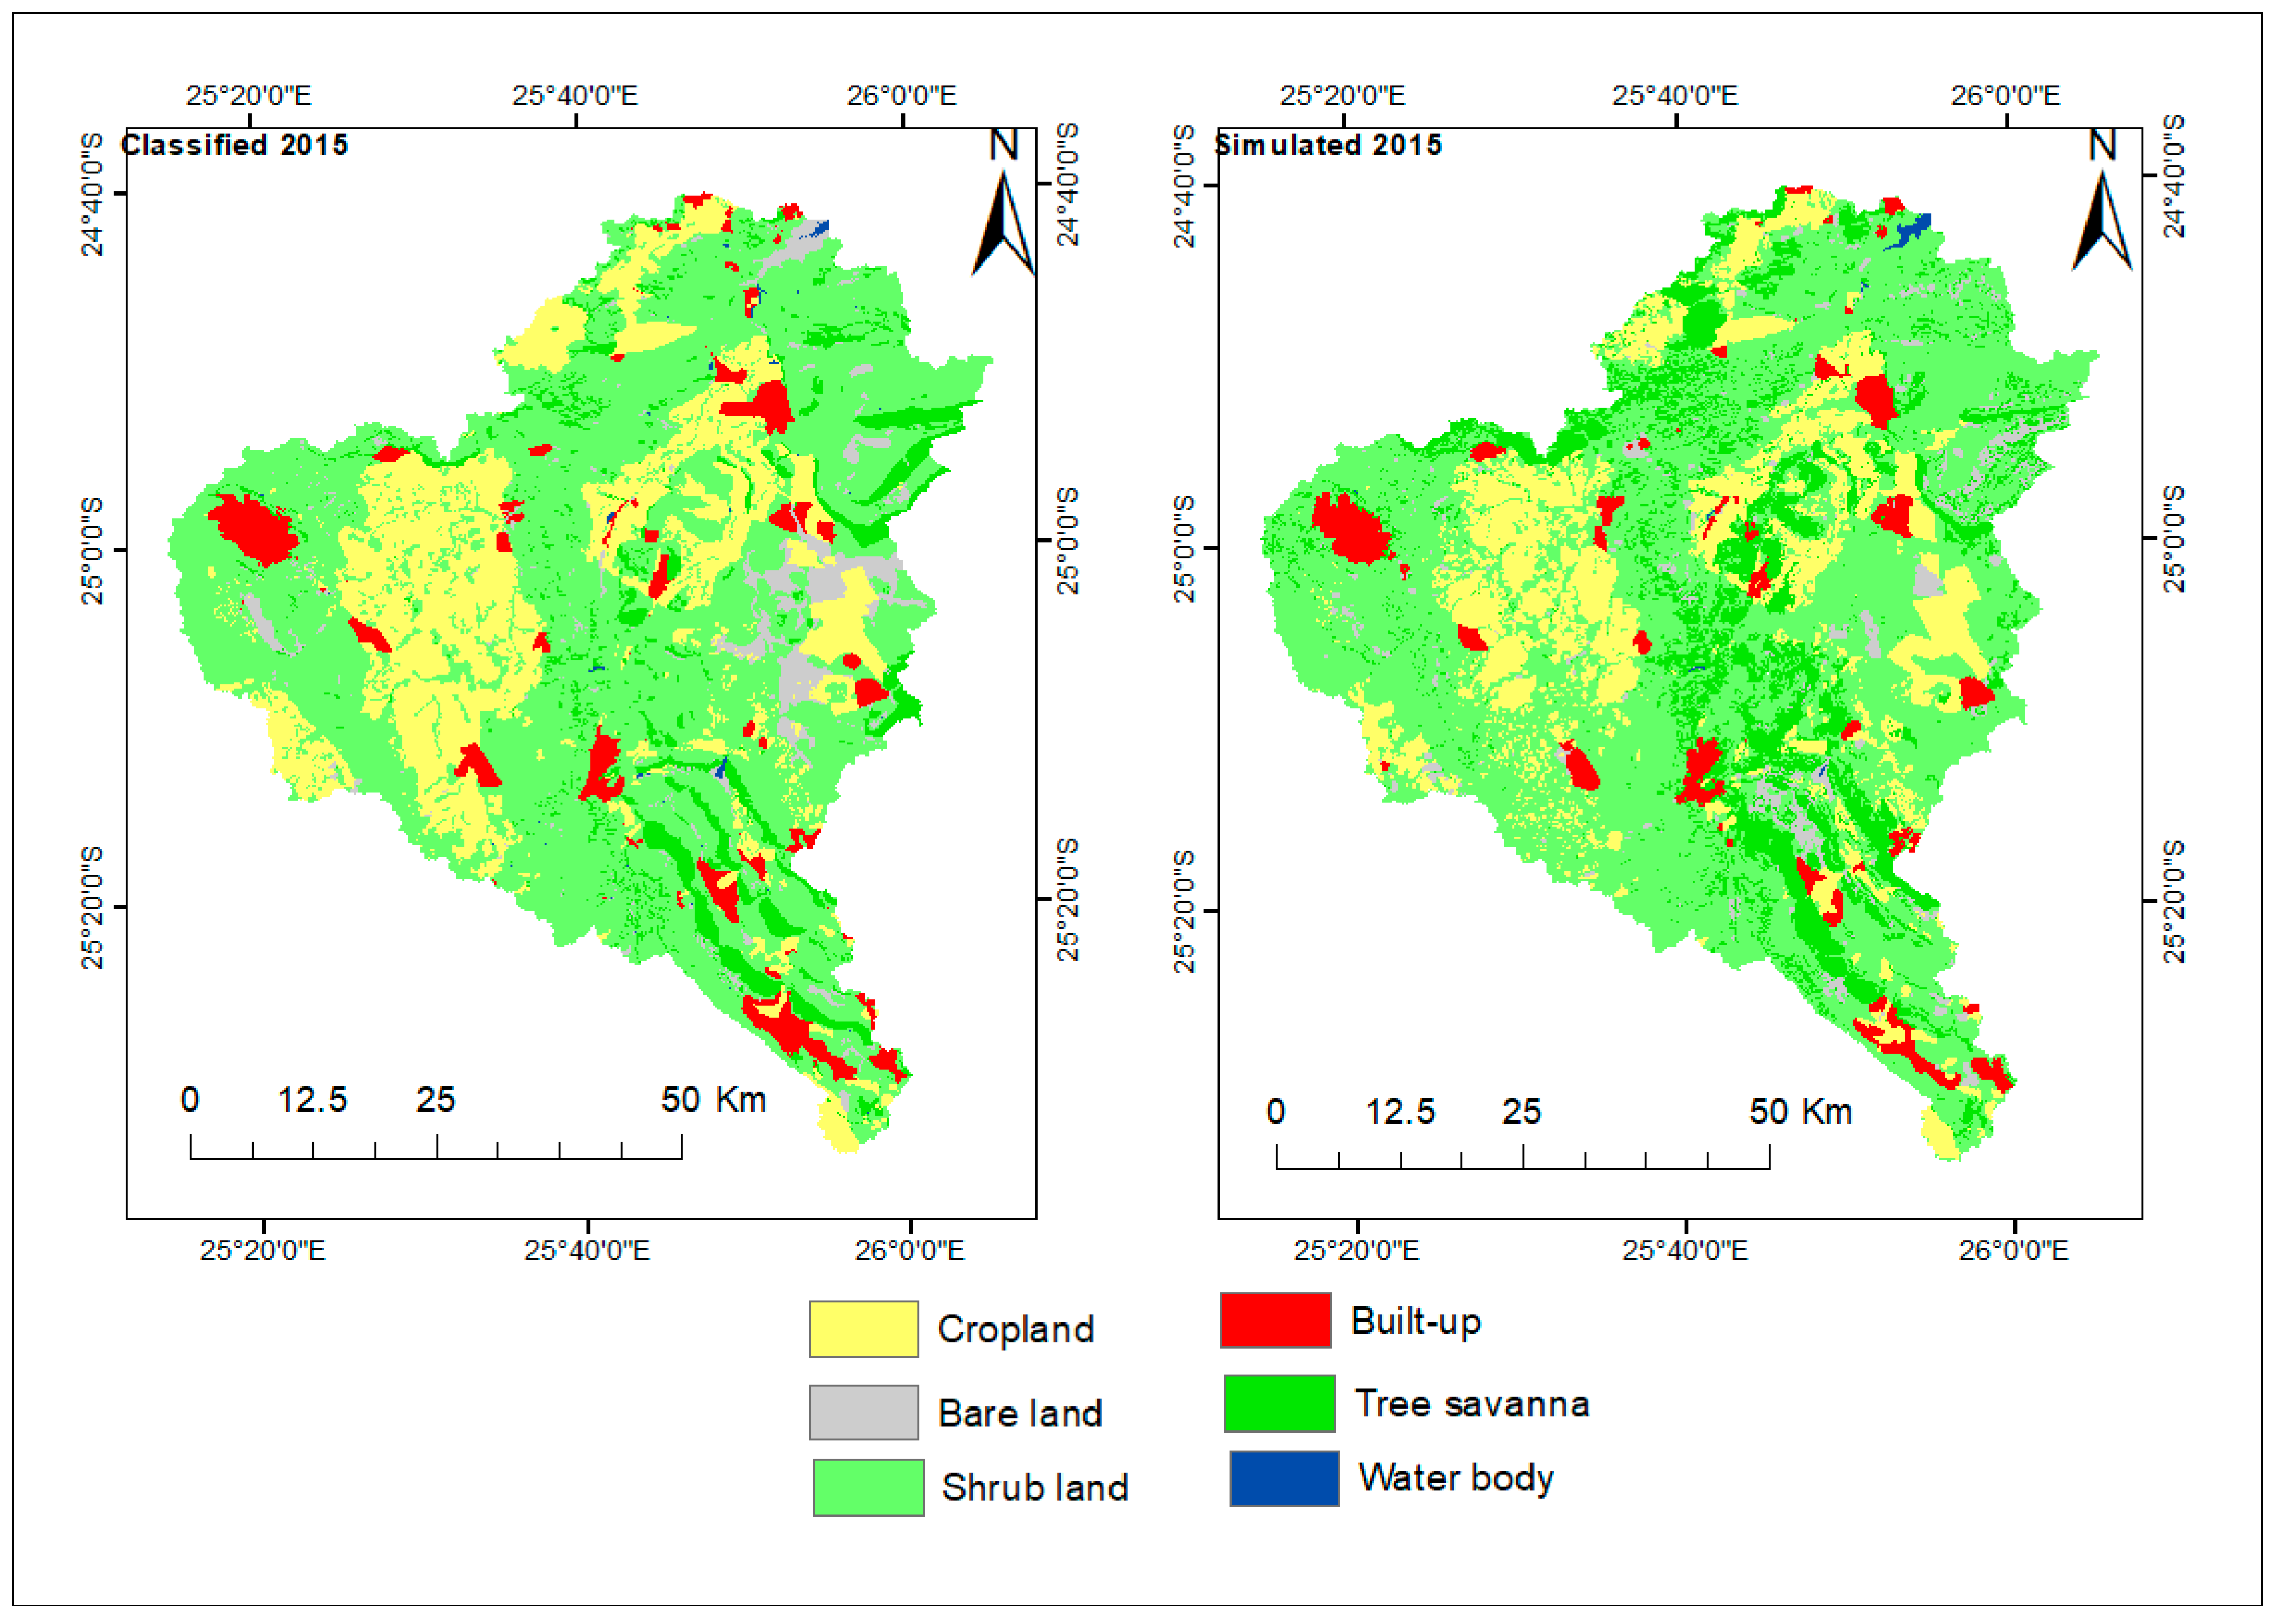
To facilitate the simulation of future LULCs in the Gaborone dam catchment using the CA-Markov model and in order to validate the CA-Markov model’s ability to simulate future LULCs, the LULC for 2015 (Figure 5) was first simulated using area transition files and transition probabilities between the LULCs of 1995–2005. We then compared the simulated and classified LULCs for 2015 using Kappa variations. The simulation revealed Kappa variation estimates as follows 0.82 for Kno, 0.82 for Klocation and 0.76 for Kstandard, revealing a high level of agreement. This shows the model’s reliability and strength in simulating future LULC changes in the Gaborone dam catchment. In addition, visual analysis revealed that the LULC categories in the simulated LULC for 2015 relatively corresponded to the classified LULC categories for 2015. It also revealed a slight overestimation of the tree savanna and water body categories, whereas built-up and cropland categories were shown to be marginally under simulated. This is also cemented by the difference calculated between the classified and simulated LULCs for 2015, as presented in Table 4. The difference revealed an underestimation of about 20.07%, 23.98%, 3.64% and 14.74% in the cropland, bare land, shrubland and built-up categories, respectively. However, the model was shown to overestimate LULC categories such as tree savanna (144.16%) and water body (3.34%). This observatory analysis is also reported in Mashapa et al. [66].
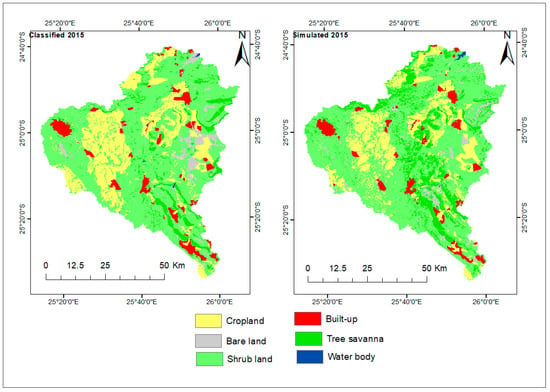
Figure 5.
Classified and simulated LULC maps for 2015.

Table 4.
LULC change analysis between the classified and simulated LULCs for 2015.
3.2. Past LULC Changes and Markovian Probability Transition Matrices
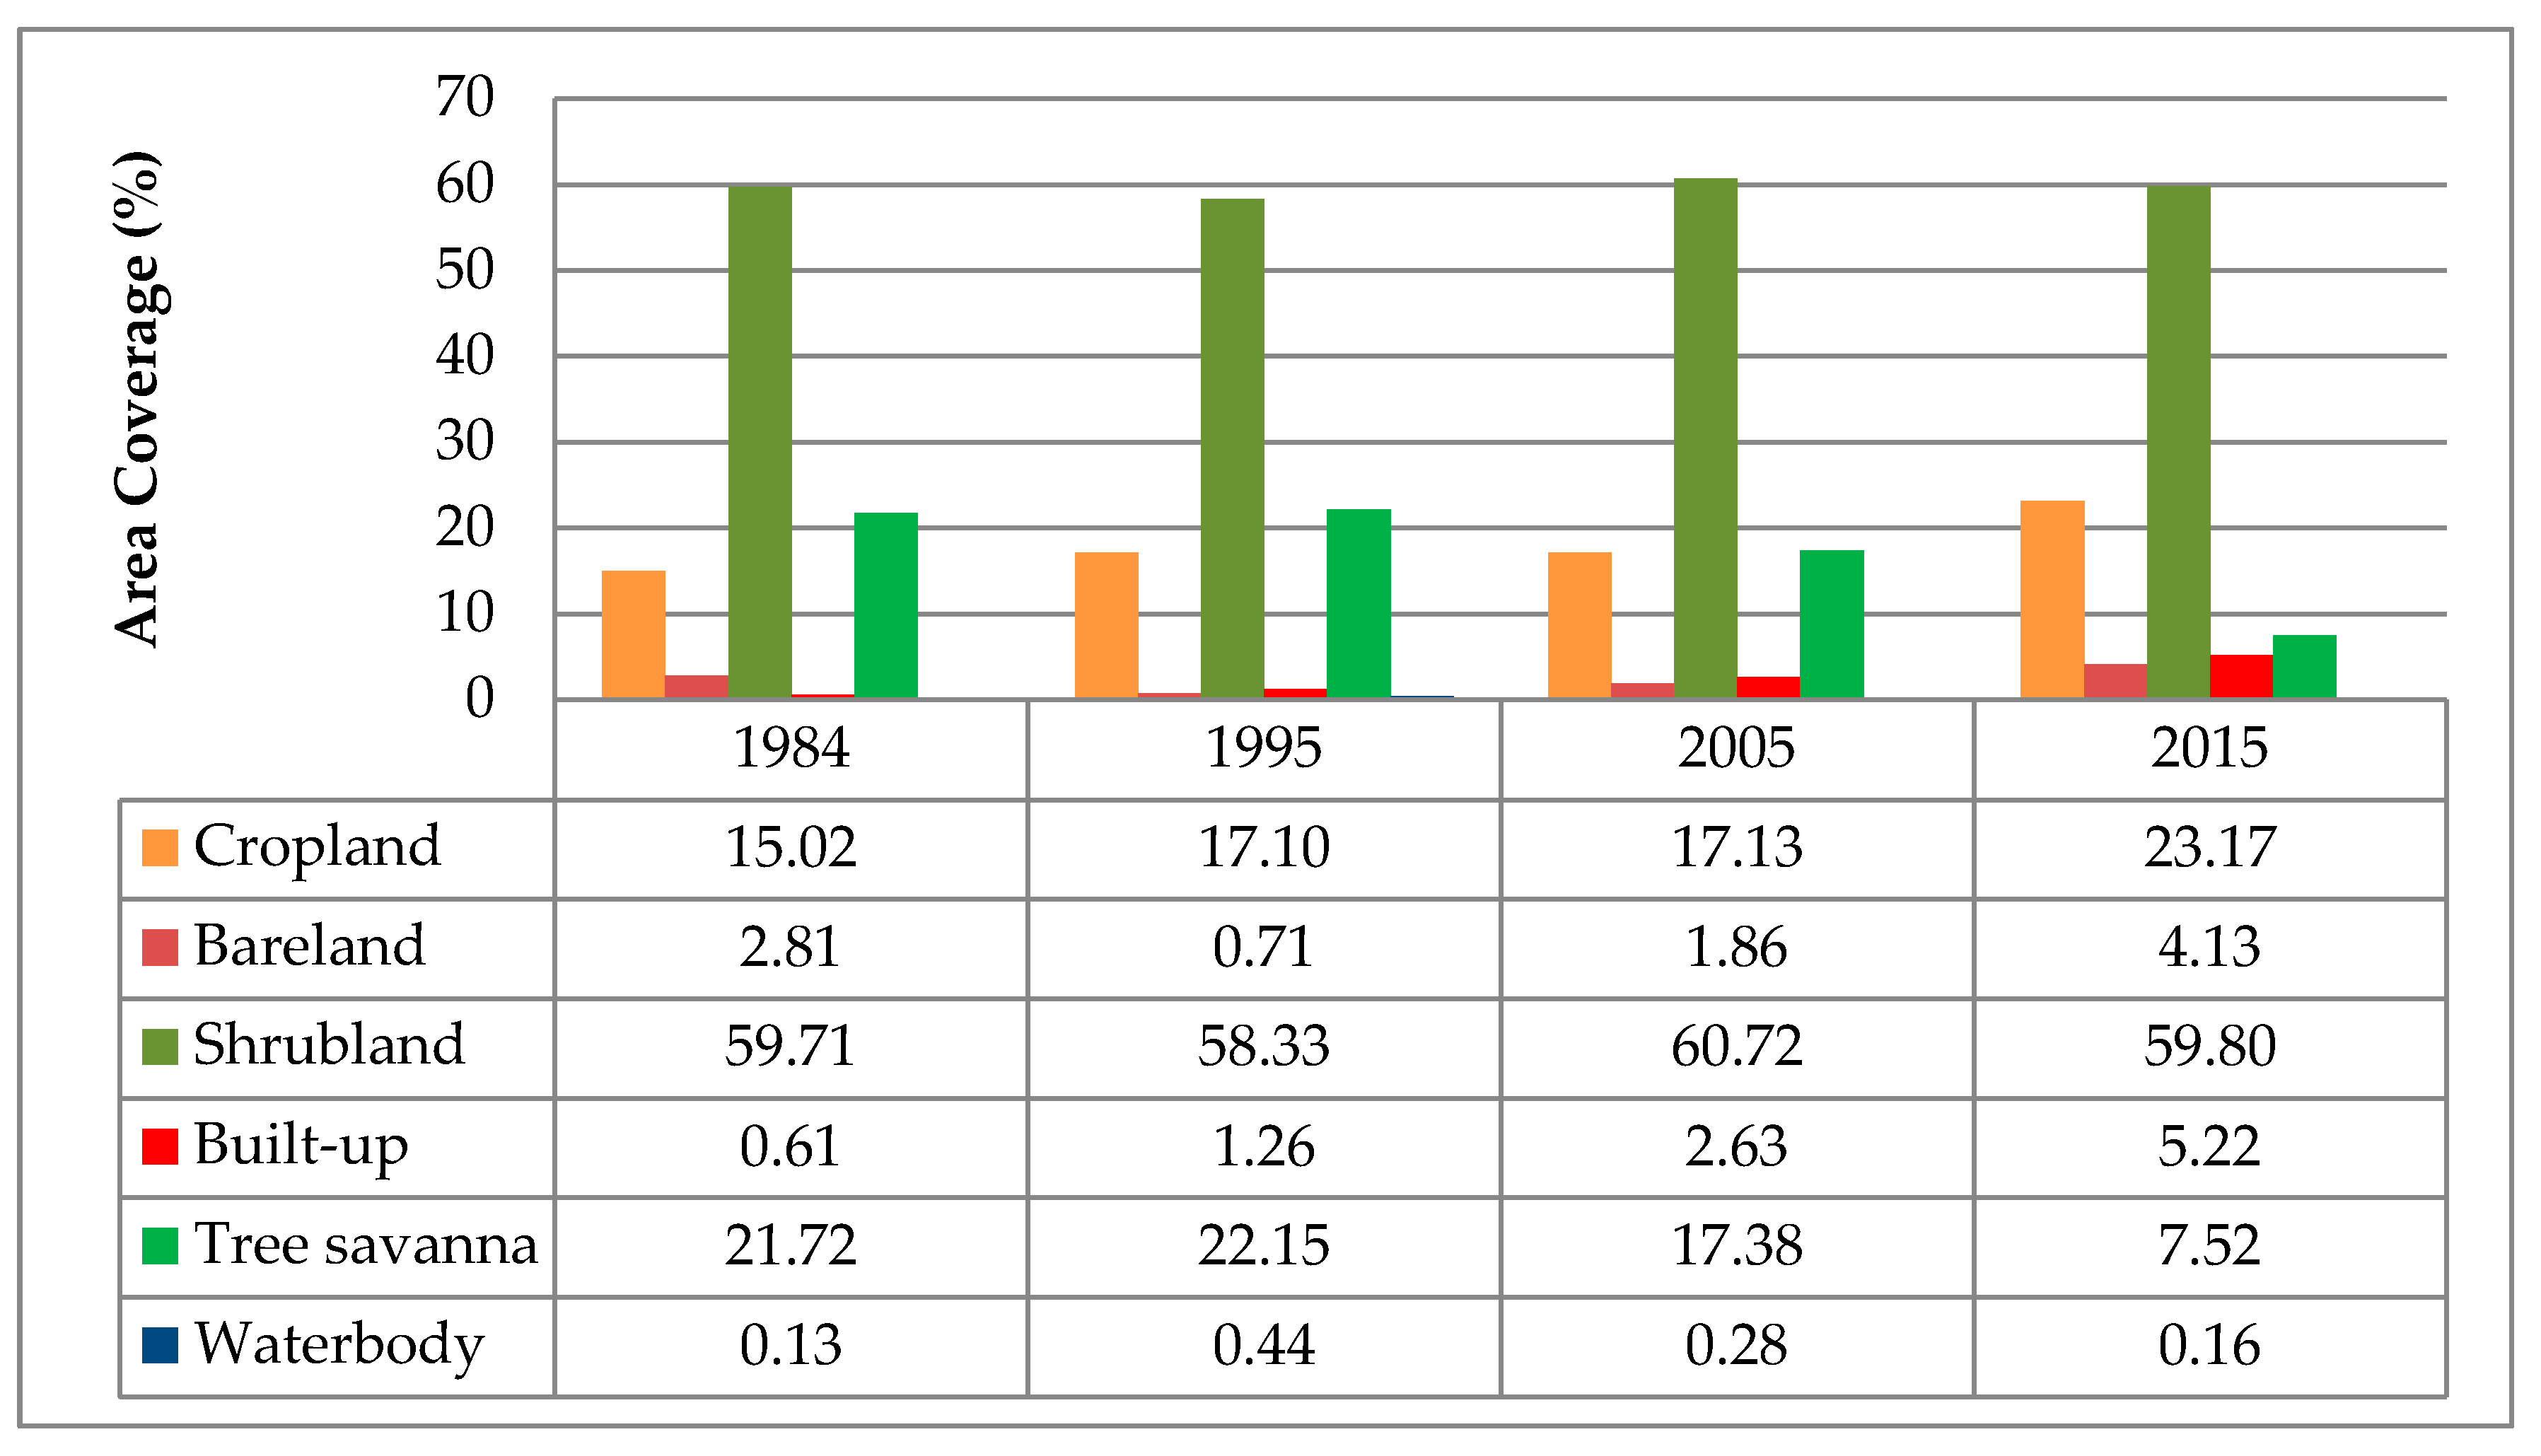
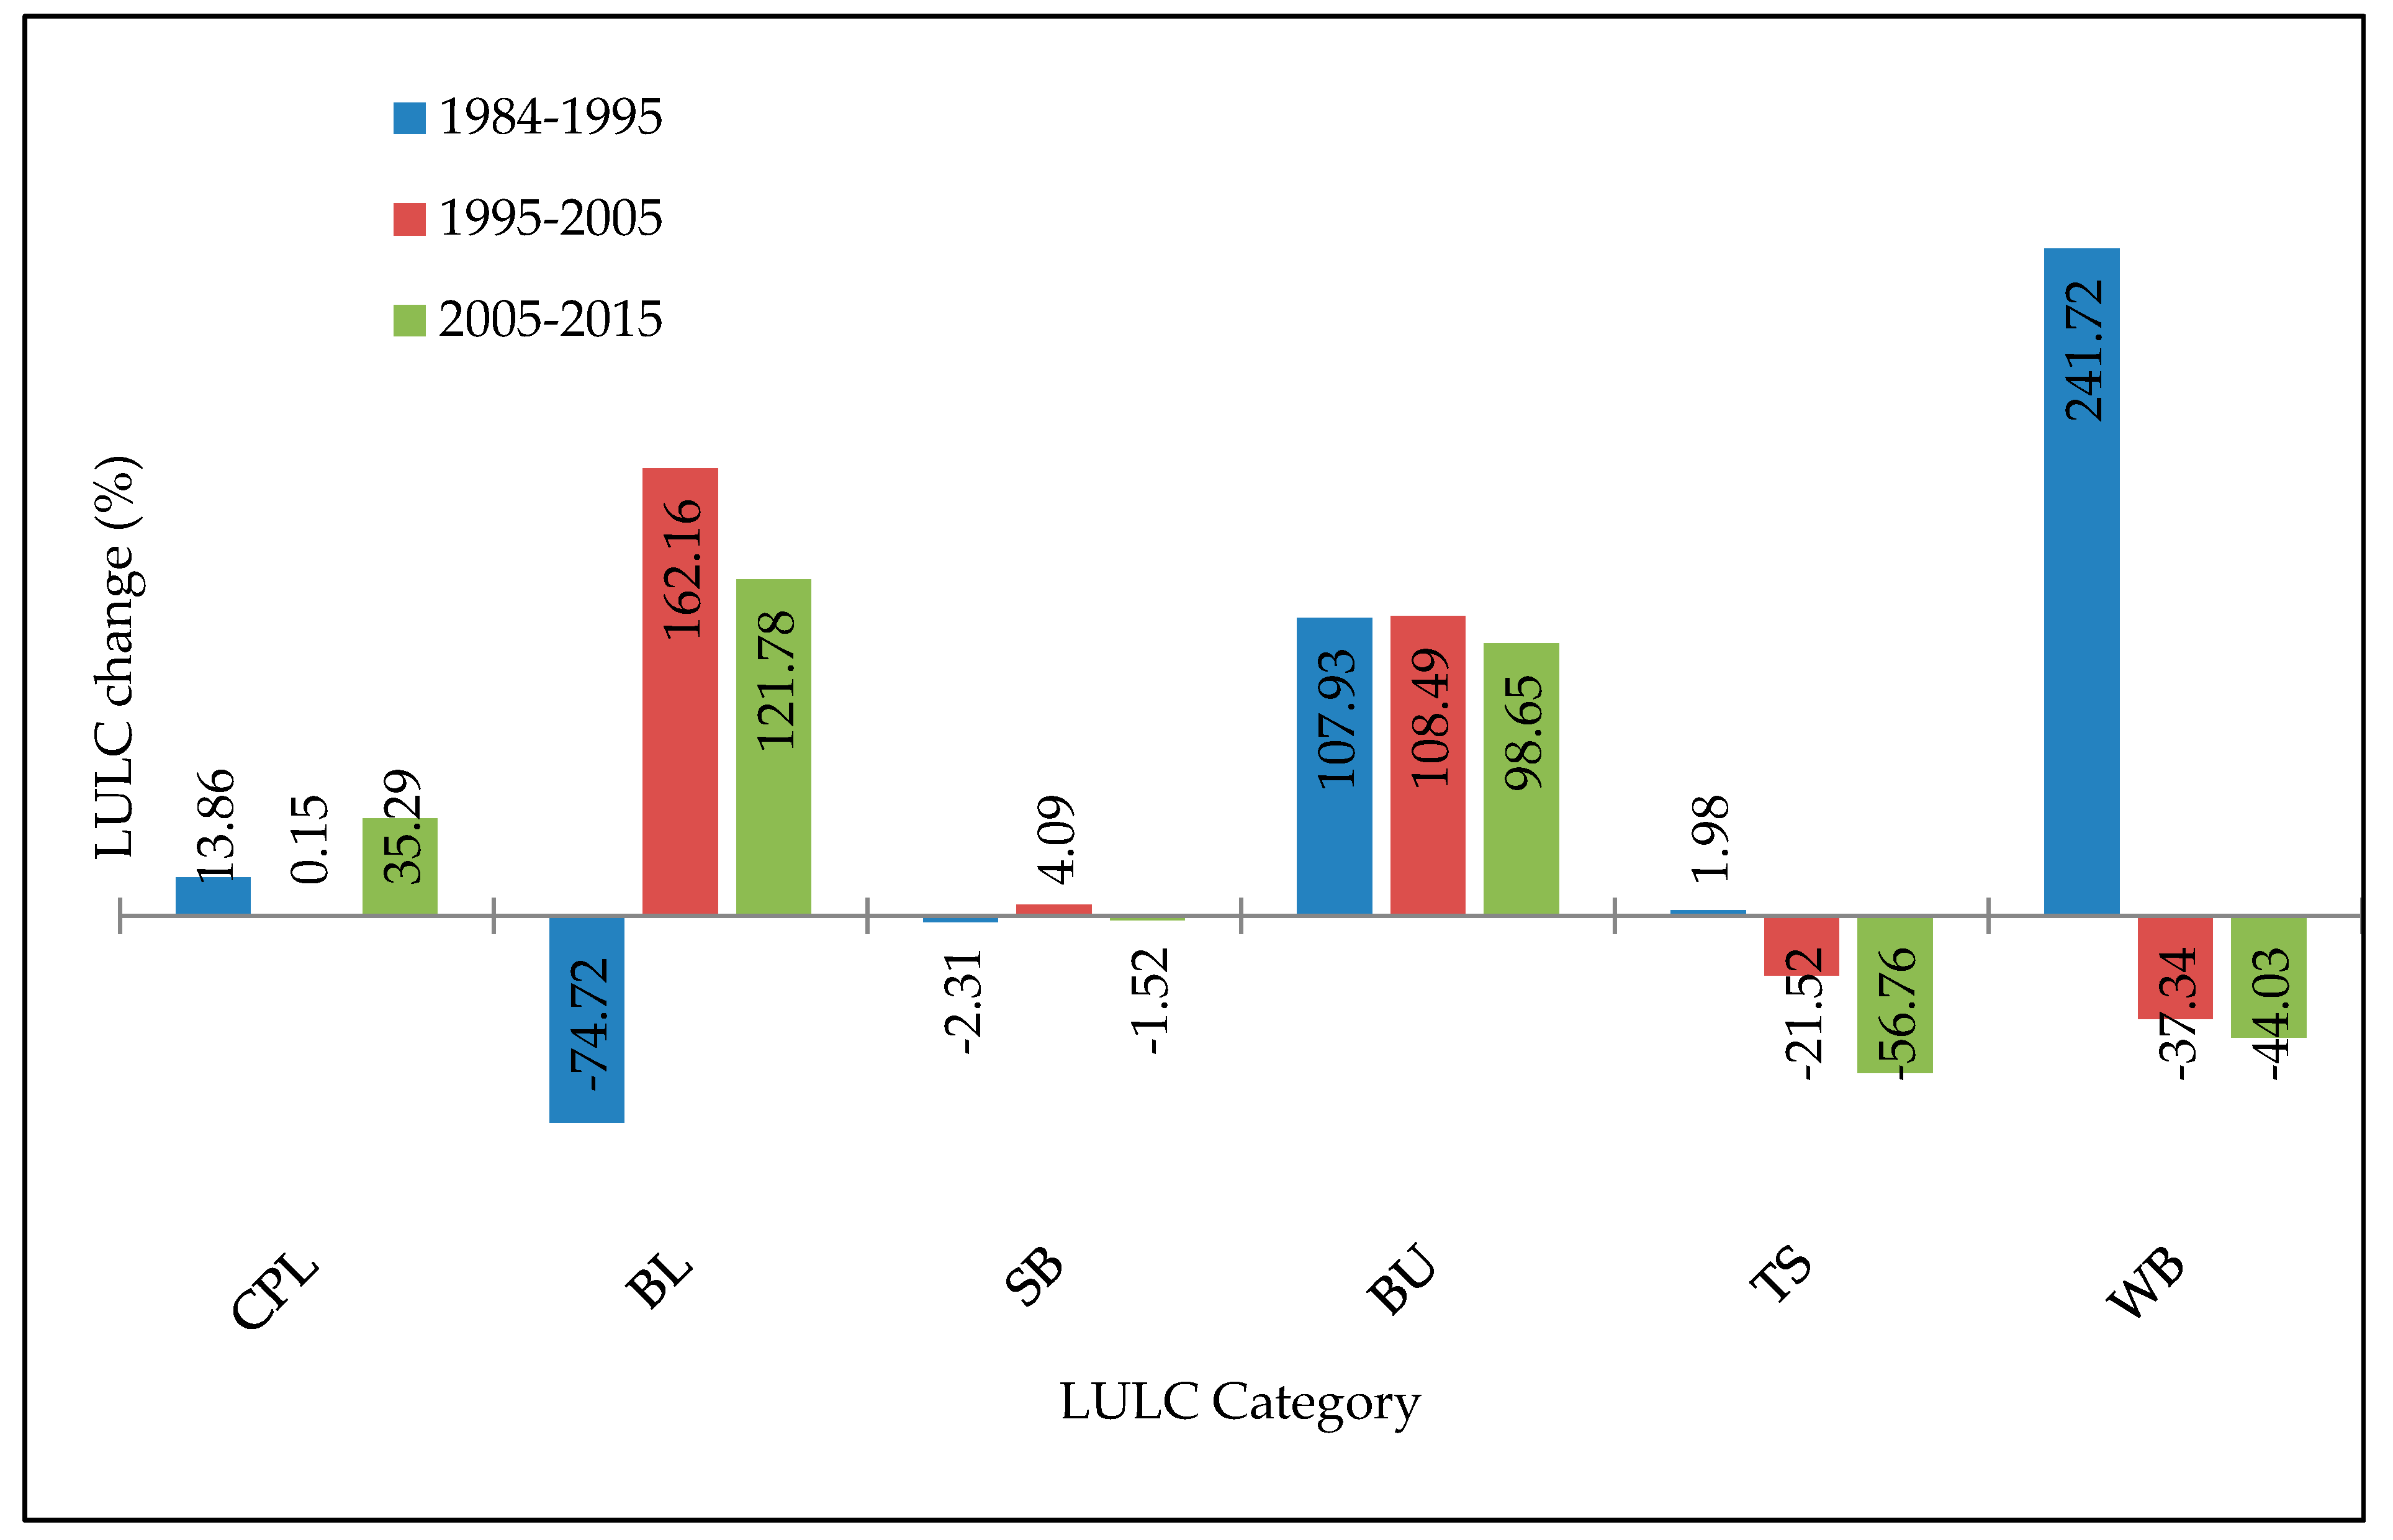
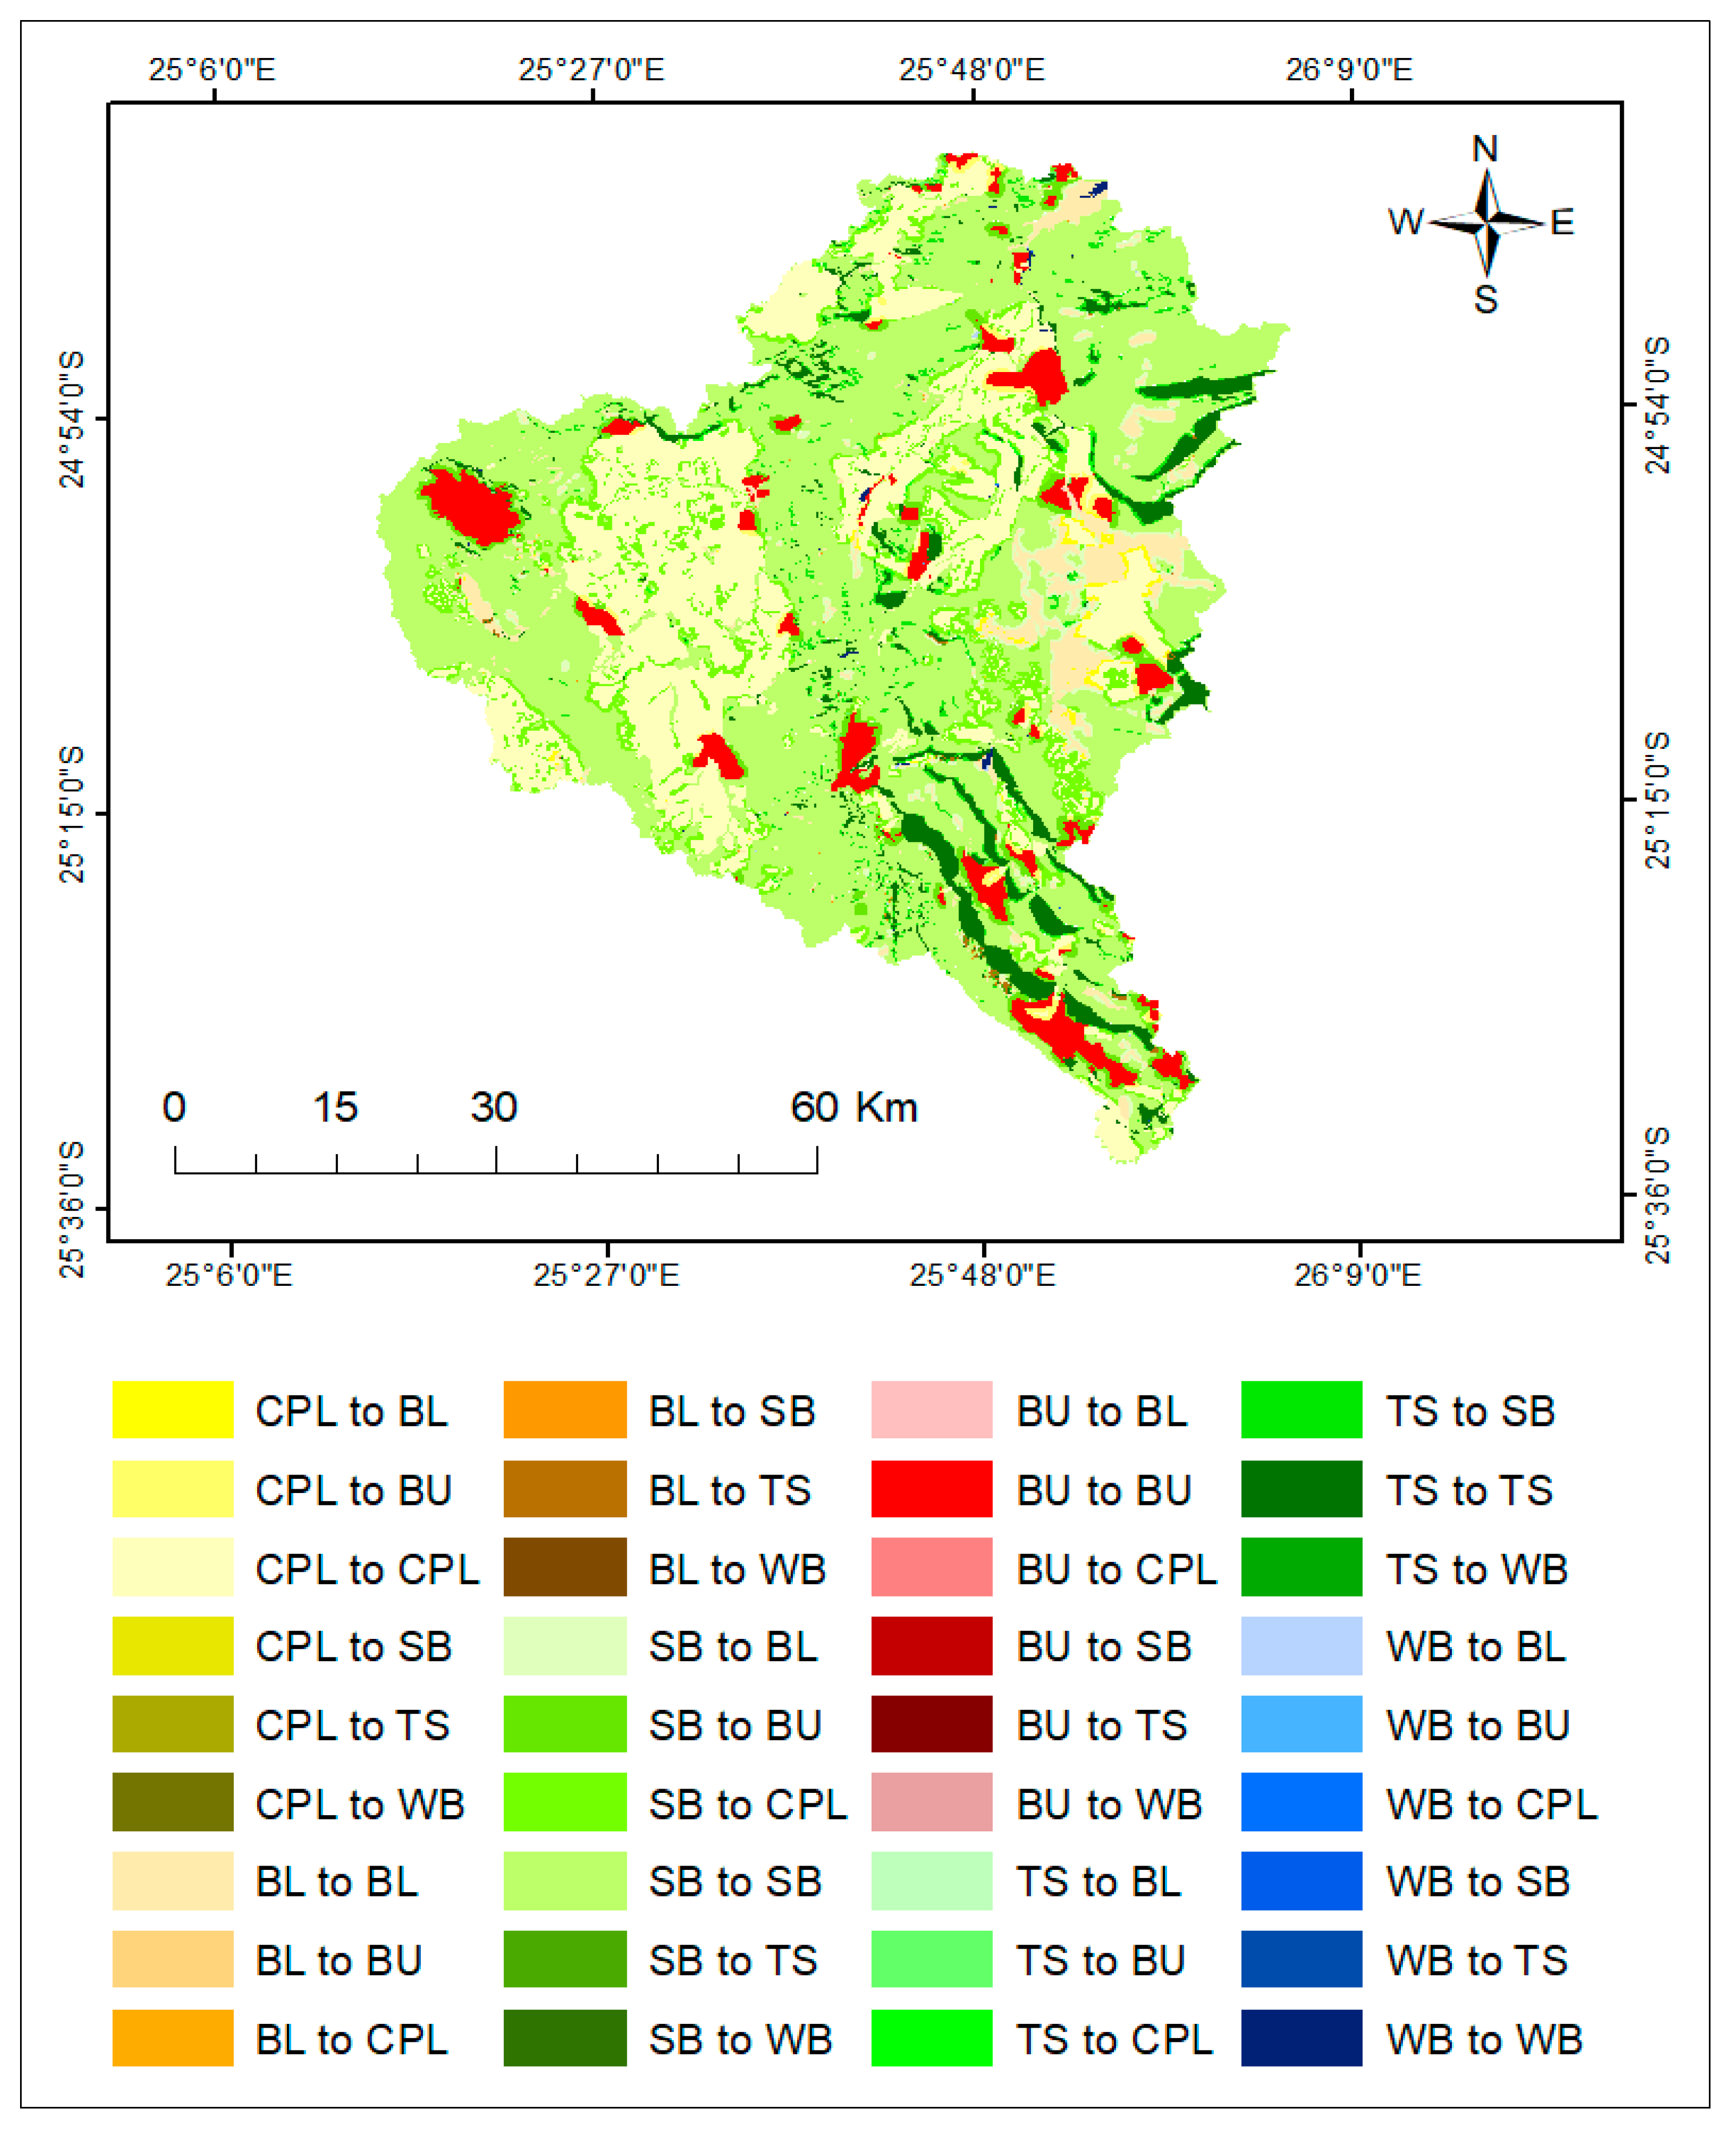
Building on the first phase of the research analysis presented in Matlhodi et al. [32], six LULC classes were identified, namely, cropland, bare land, shrubland, built-up, tree savanna and water body [39] in 1984, 1995, 2005 and 2015. LULC change analysis, as shown in Figure 6, indicate a general increase in croplands, built-up and bare lands, whereas tree savanna and water body were observed to be decreasing between 1984 and 2015. Croplands, built-up and bare land categories covered about 15.02%, 2.81% and 0.61% in 1984 and 23.17%, 4.13% and 5.22% in 2015, respectively. The shrubland category, on the other hand, was shown to be consistent over the 31-year period, taking up 59.71% and 59.80% of the catchment area in 1984 and 2015, respectively. Even though tree savanna and water body categories were shown to be decreasing, an increase in these categories was observed in the period 1984–1995. LULC change analysis, as shown in Figure 7, indicated water bodies to have had the highest increase in the period 1984–1995, followed by bare land in the period 1995–2005. However, the bare land category was shown to have decreased by 74.72% in the period 1984–1995. The tree savanna category decreased by 21.52% and 56.76% in the periods 1995–2005 and 2005–2015, respectively. The increase in tree savanna and water body categories in the period 1984–1995 could be a result of the high rains received in the early 1990s. It has been reported that in semi-arid areas the health of the two categories are highly dependent on moisture availability at a particular time [32]. In contrast, the drought periods of the early 1980s and 2014–2016 experienced in Southern Africa contributed to the low areal coverages of water bodies in the Gaborone dam catchment, at about 0.13% (1984) and 0.16% (2015) [67].
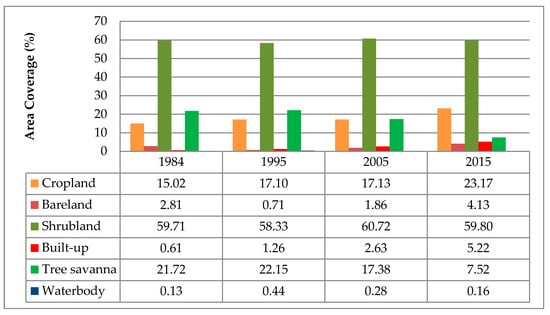
Figure 6.
LULC area coverages in the Gaborone dam catchment from 1984 to 2015 (modified from [32]).
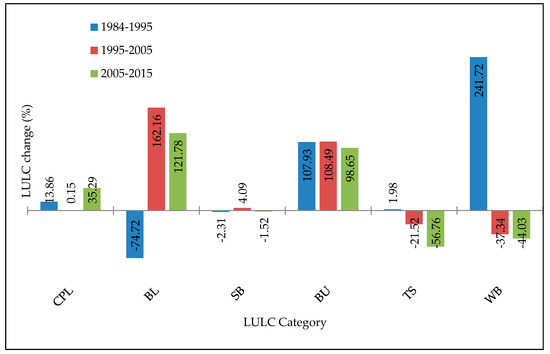
Figure 7.
LULC changes in the Gaborone dam catchment from 1984 to 2015 [32]. NB: CPL—cropland; BL—bare land; SB—shrubland; BU—built-up; TS—tree savanna; WB—water body.
The Markovian transition probabilities presented in Table 5 show the probability of each class in the LULC maps remaining the same or changing to another class in the next period (i.e., 1984–1995, 1995–2005 and 2005–2015). That is, a given LULC type might change from one category of LULC to any other at any given time. This shows how the LULC change is not uni-directional in nature [61]. Diagonal values in the transition probability matrix represent the probability that each land use category remains the same from time 0 to time 1 [34]. For example, the built-up category was shown to be highly resistant to change to other categories, with its >70% likelihood of remaining the same in the periods 1984–1995 and 1995–2005. The highest percentage (>80%) of values in the built-up category to remain unchanged was recorded in the period 2005–2015. Categories such as cropland and shrubland were also shown to be persistent, with more than 60% of them likely to remain unchanged in the next period, whereas other categories were shown to be less persistent, and as a result were more likely to change to other LULC categories in the ensuing period. These include bare land and tree savanna, of which about <25% and <60% of them will remain unchanged in the next period. The water body category instead showed both high and low likelihoods of remaining unchanged during the 31-year period, with more than 79% of this category remaining unchanged in the period 1984–1995. In addition to showing persistence, the transition probability matric also shows how each LULC category changes to another. For instance, 70% or more of the tree savanna category was likely to be changed to the shrubland category in the period 2005–2015. Additionally, about 71% of the bare land category was highly likely to convert to shrublands in the period 1984–1995, indicating its less likely persistence during those periods. The high transitional potential of tree savanna to shrub lands, as explained by Mashapa et al. [66], is due to relatively close proximity of the two categories, suggesting that the CA-Markov model’s simulation accuracy increases with the proportion of a given LULC category relative to others.

Table 5.
Markov probability transition matrices for 1984–1995, 1995–2005 and 2005–2015 LULCs in the Gaborone dam catchment.
3.3. Simulation of LULC Changes for 2035
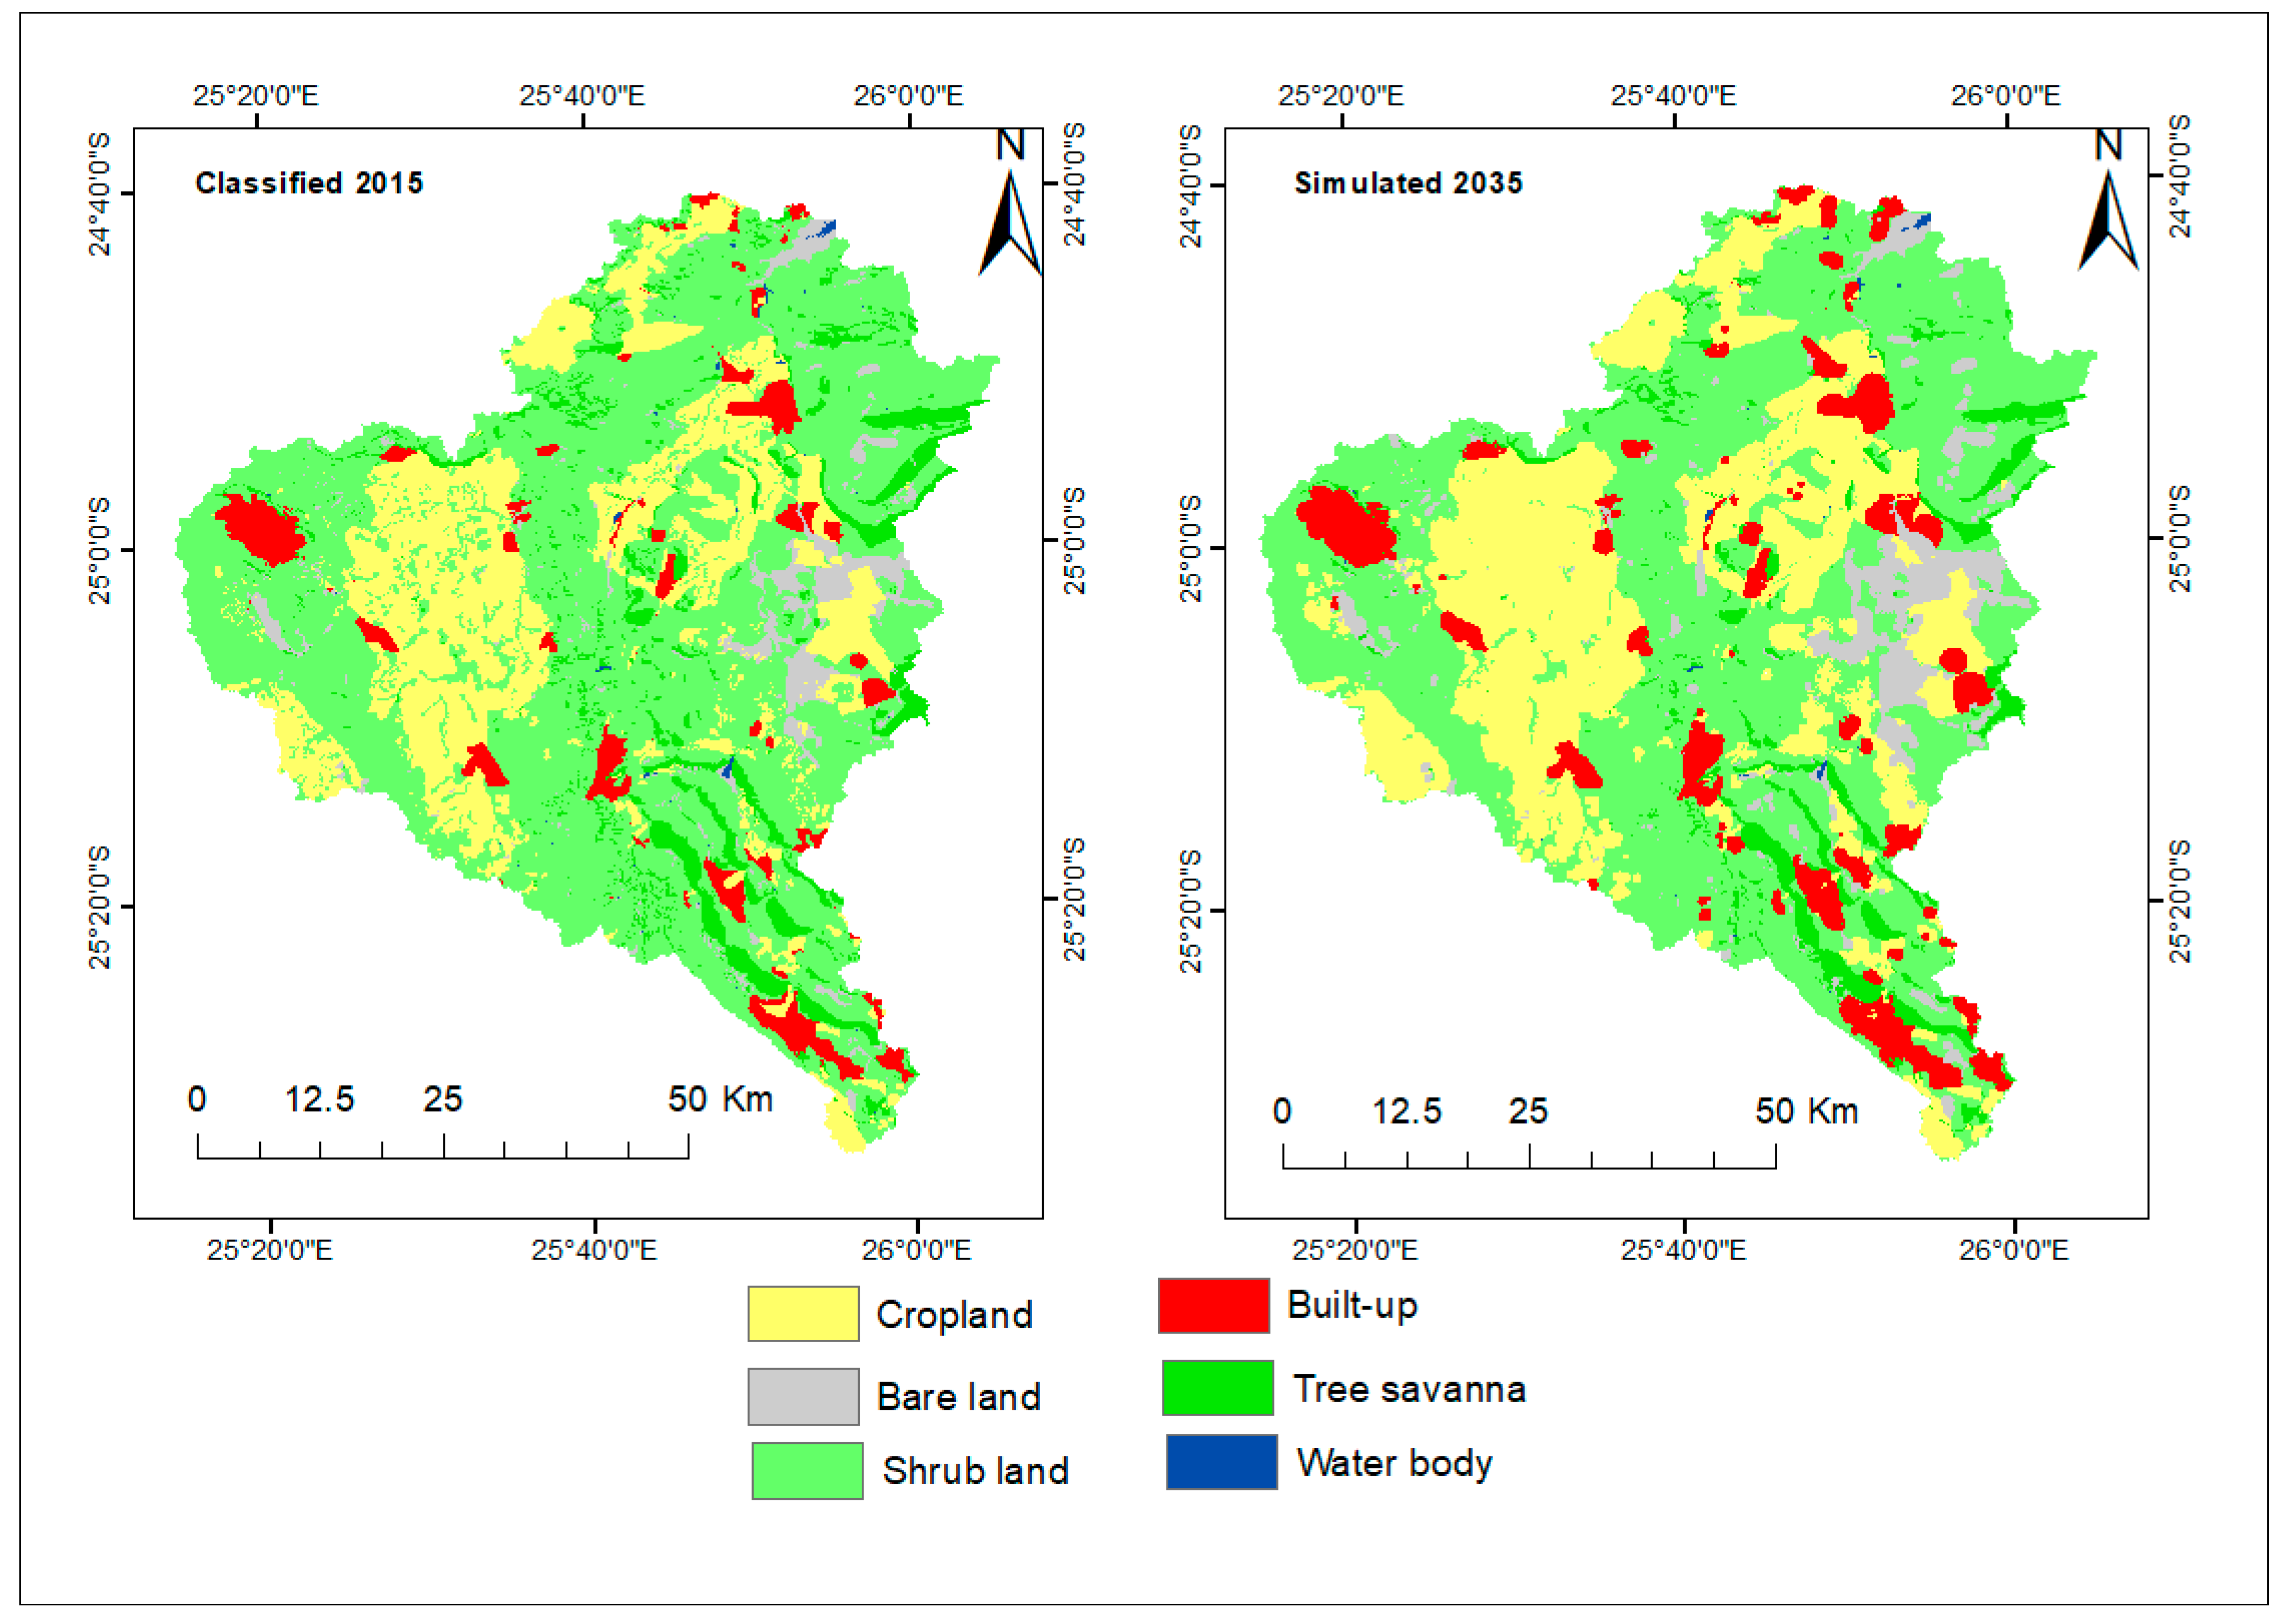
The 2035 LULC for the Gaborone dam catchment was simulated using the 2015 LULC as the base map, the 2005–2015 transition probabilities and the generated suitability images, and the results are presented in Figure 8. The respective descriptive statistics of LULC showing the areal coverage and spatio-temporal changes between 2015 and 2035 LULCs are shown in Table 6. LULC change analysis revealed that 23.17% of the total land area in the catchment was croplands in 2015 and is expected to register a 26.9% growth by 2035. Similarly, built-up areas are anticipated to double in proportion, rising from 227.15 km2 (5.22%) in 2015 to 376.29 km2 (8.65%) in 2035. A projected increase in the bare land category is expected from 179.79 km2 (4.13%) in 2015 to 280.07 km2 (6.44%) in 2035. Modelling results further indicated that shrubland, tree savanna and water body categories are expected to decrease over the next 20 years. In particular, shrublands will decrease by 416.84 km2 (16.03%). Even the tree savanna and water body categories areal coverage were found to decrease by about 94.01 km2 (28.76%) and 1.48 km2 (21.89%), respectively.
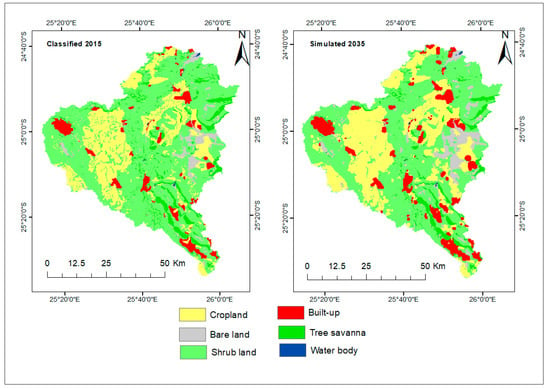
Figure 8.
LULC distribution in the Gaborone dam catchment for 2015 (classified) and 2035 (simulated).

Table 6.
LULC change distribution from 2015–2035.
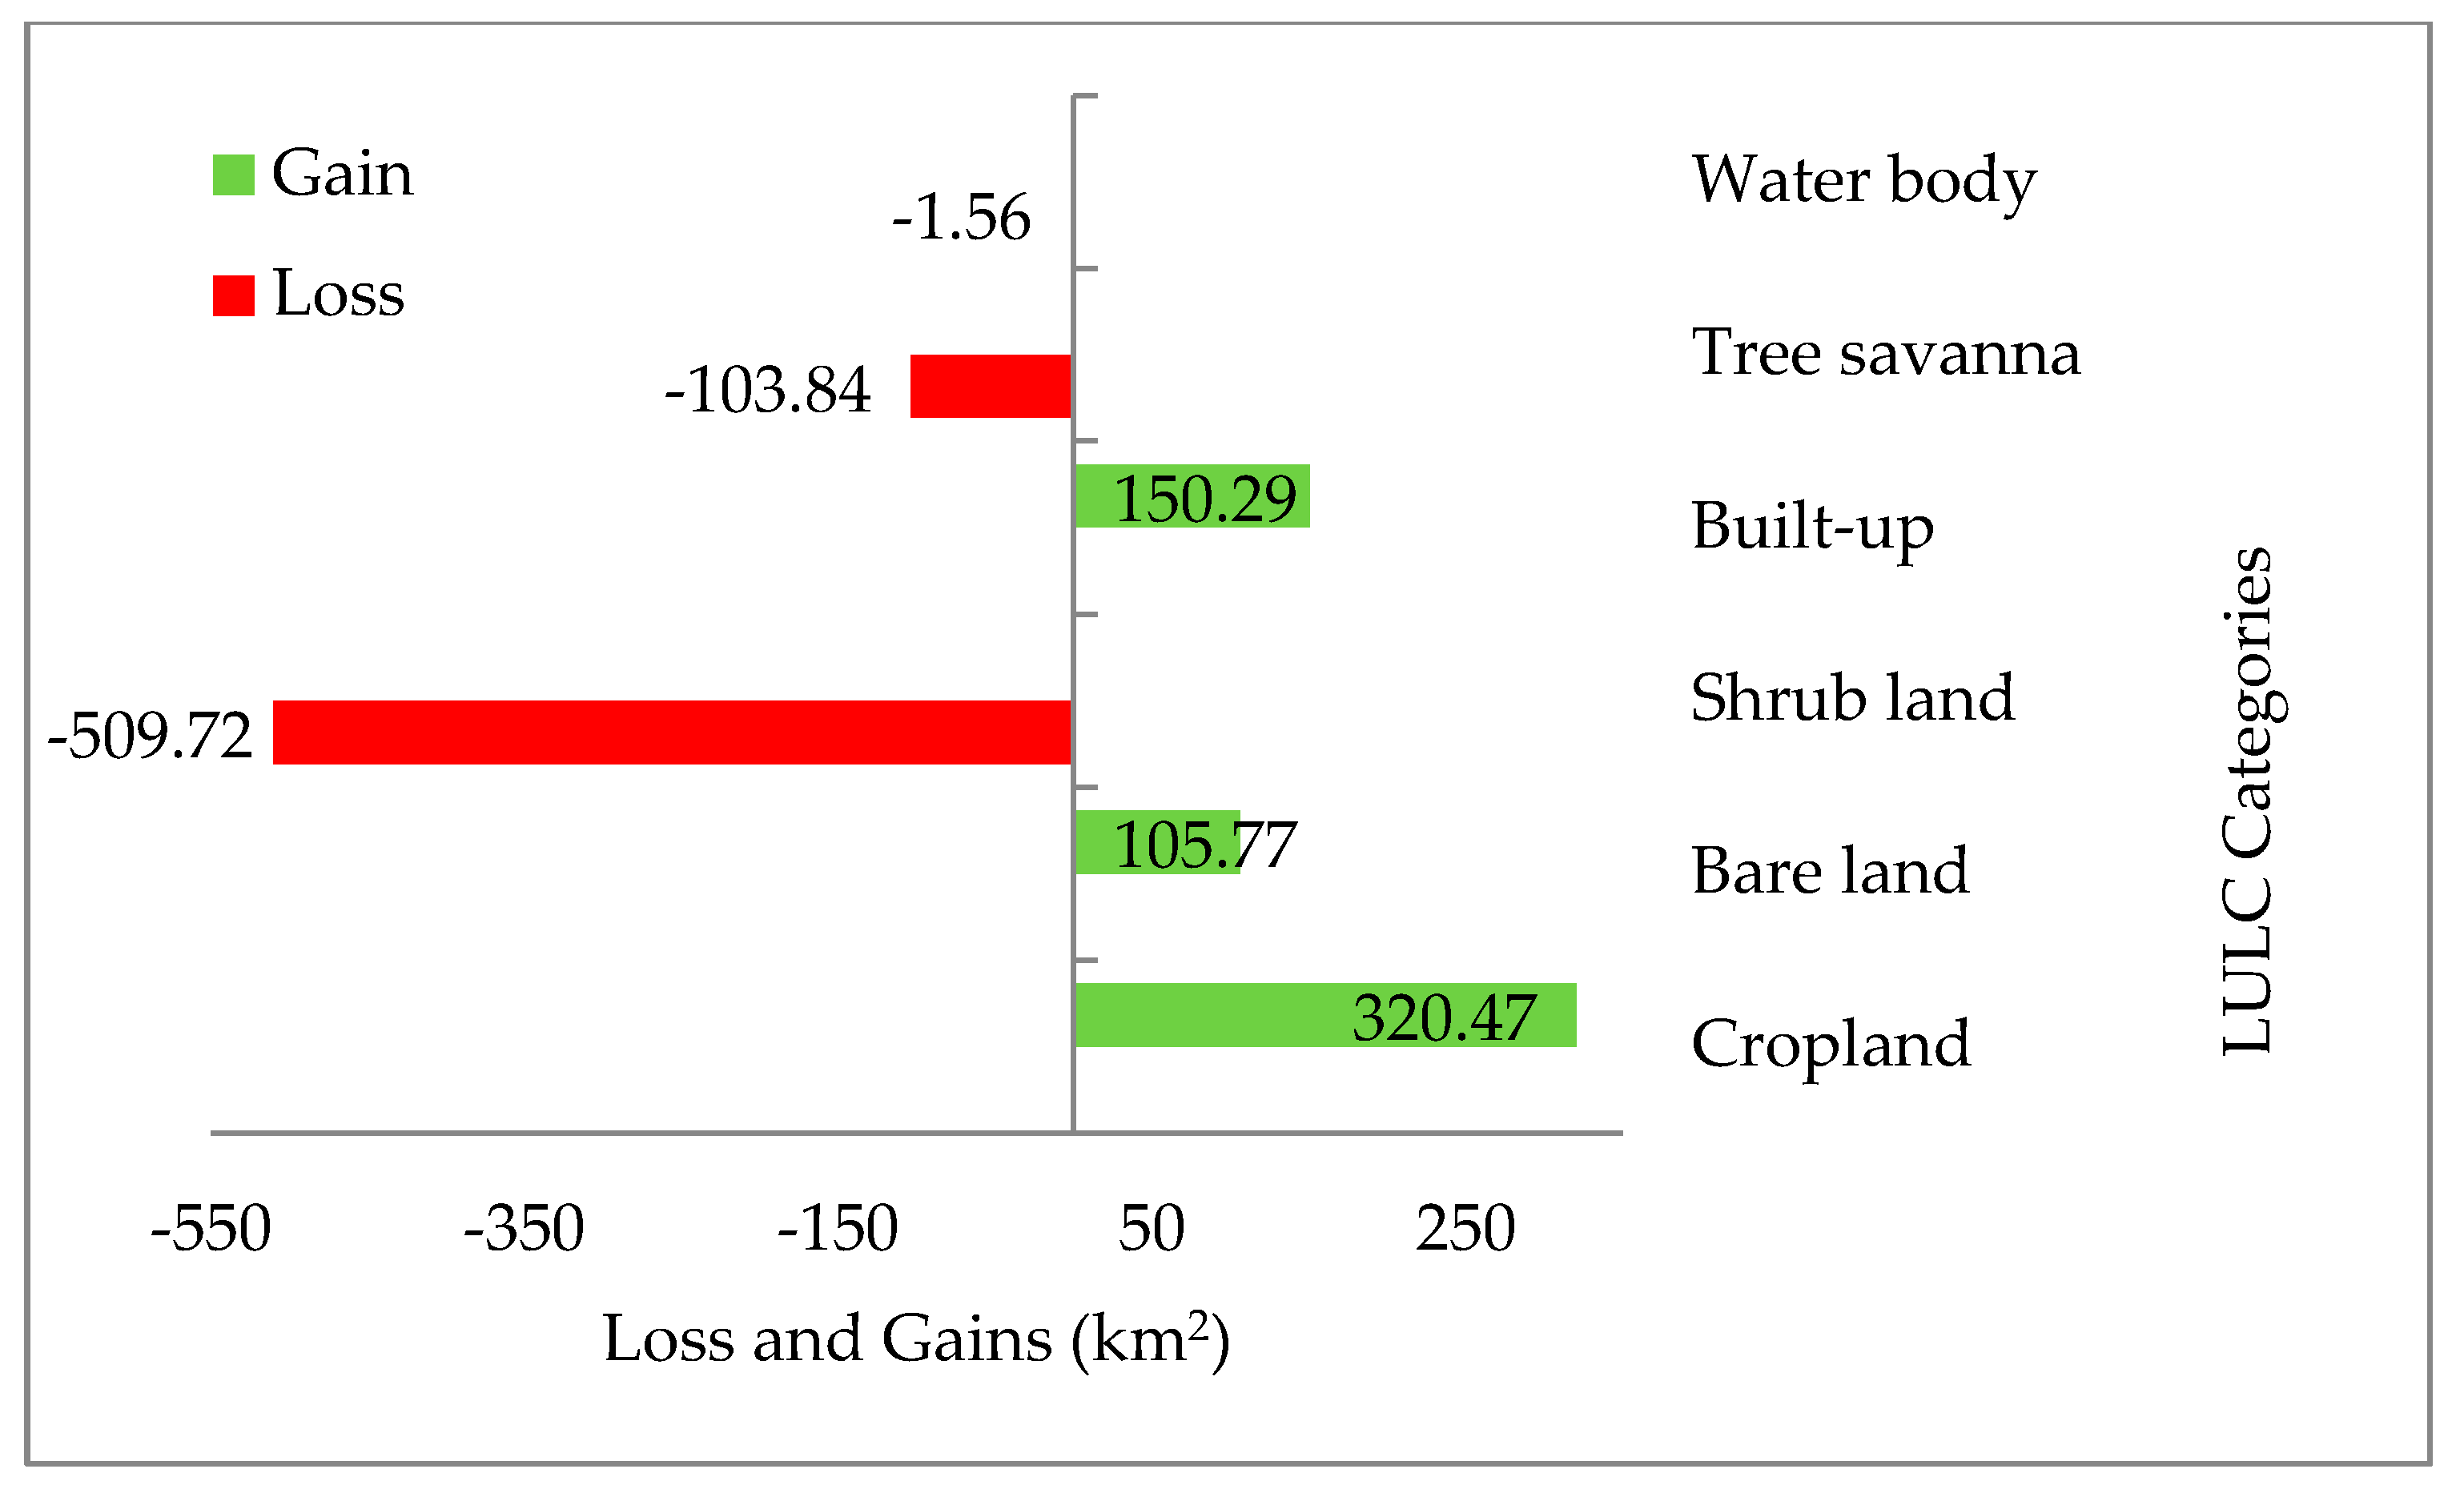
As the environment continues to change due to human pressures, LULC categories are expected to convert into other categories. Figure 9 and Figure 10 show the projected losses and gains in LULC categories in the catchment. The results reveal that built-up, bare land and cropland categories are expected to be the main gaining LULC categories by 2035. For instance, areas of about 311.9 km2, 108.87 km2 and 83.79 km2 in shrubland are projected to change into cropland, built-up and bare land categories, respectively. Moreover, tree savanna is projected to lose about 91.67 km2 of its area coverage to the shrubland category. The tree savanna and water body categories’ expected gains are insignificant compared to the other categories. The observed LULC changes in the catchment may lead to high surface runoff, low infiltration and evapotranspiration as a result of impervious surfaces due to the expansion in built-up areas and the loss of vegetal cover. Thus, the current and ongoing trends in LULCs will eventually result in significant environmental dilapidation and devastation in future. Moreover, as the area is a semi-arid catchment, this calls for appropriate management and use of land with a particular emphasis on sustainable water resource management.
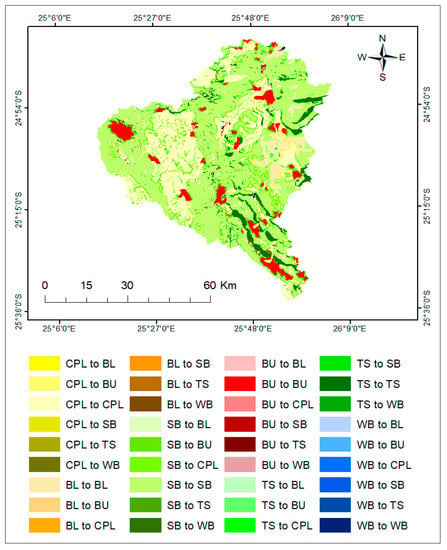
Figure 9.
Projected losses and gains between 2015 and 2035. NB: CL—cropland, BL—bare land, SB;—shrubland, BU—built-up, TS—tree savanna, WB—water body.
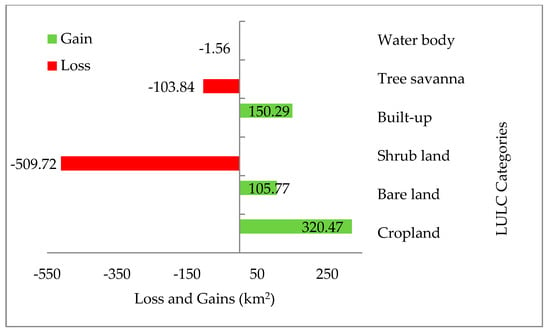
Figure 10.
Transition change matrix from 2015–2035 (km2) (losses and gains).
4. Discussion
4.1. CA-Markov Model Validation
Our simulation of future LULCs in the Gaborone dam catchment employed the CA-Markov model. To test the model’s performance in simulating LULCs, model validation was done by comparing the classified and simulated LULCs of 2015. Kappa variations between 0.76 and 0.82 were recorded, indicating a high level agreement [62,65,68] and the suitability of CA-Markov to accurately simulate future LULCs in the Gaborone dam catchment. However, the model was shown to overestimate water body and tree savanna areas and underestimate cropland, built-up, bare land and shrubland LULC categories. Acceptable Kappa indices for the CA-Markov model have also been reported by other researchers (e.g., Munthali et al. [20], Hyandye and Martz [25] and Maviza and Ahmed [24], in the Dedza district, Malawi; Usangu catchment, Tanzania; and Upper Mzingwane sub-catchment, Zimbabwe, respectively). Therefore, the CA-Markov model is suitable for the accurate prediction of future spatio-temporal LULC changes in the Gaborone dam catchment.
4.2. Simulation of LULC Changes for 2035
LULC is expected to continue to change in the Gaborone dam catchment area, with expansions and contractions in the different LULC categories, which might have implications on the environment, particularly water resources. Expansions are expected in the croplands, built-up and bare land categories, whereas the tree savanna, water body and shrubland categories are projected to decrease by 2035. This will have implications on the catchment’s ecological integrity and water resources [69]. Expansions in built-up areas in the catchment is an indication of population growth, largely driven by rural-urban migration to the city of Gaborone, as settlements surrounding cities and towns tend to absorb the city’s overspill, as also noted in other developing countries (e.g., Gidey et al. [61], Maviza and Ahmed [24] and Munthali et al. [20]). For the Gaborone dam catchment, this means major settlements are slowly urbanizing and taking up an urban or town setting, with improved amenities thus attracting more people. Due to population growth and agricultural subsidy schemes such as the Integrated Support Program for Arable Agricultural Development (ISPAAD; 2008) [70], which is still in place, an increase in cropland is expected. The ISPAAD has so far led to an increase in cultivated acreage [71]. Vegetal cover loss, on the other hand, is mostly due to expansions in cropland and built-up areas. However, in semi-arid areas like the Gaborone dam catchment, vegetal cover loss can also be attributed to climate variability [25] as vegetation health in these areas is naturally moisture- and temperature-dependent [24,72,73], with high rainfall years signifying healthy vegetation. Continued vegetal cover loss may lead to forage reductions for those practicing pastoral farming, resulting in bare land expansions and land degradation due to animal overstocking.
The water body category was observed to be decreasing in the Gaborone dam catchment since the 1980s [32]. Fluctuations in water levels in the catchment have been observed, with the Gaborone dam in 2015 reported to have dried up, with water levels reaching below 5%, which exacerbated water supply shortages and droughts, resulting in water supply restrictions in the city of Gaborone and surrounding areas. Thus, LULC changes upstream of the catchment may disturb water components such as runoff and base flow [14,74] and could lower the dam water levels [75]. Furthermore, climate variability, as a characteristic of semi-arid areas, affects water availability and with projected mean annual reductions in rainfall over Botswana [76,77,78], a decline in water bodies is thus certain.
4.3. Implications of LULC Changes on Water Resources
Changes in LULC have been noted to have implications on the environment, in particular the water resources of semi-arid areas. The impact of LULC changes on the hydrological regime is, however, a complex process and depends on the land use types, the size of the affected areas and their landscape location. Among the LULC changes, deforestation is the most prevalent and is considered a major cause of changes in hydrological processes such as evapotranspiration, surface runoff, infiltration and rainfall interception [79,80]. Expansions in cropland and built-up areas have been associated with a decrease in vegetal cover in most areas of the world [79], and this has led to a decrease in the infiltration capacity of soils due to soil compaction in agricultural lands and increases in impervious surfaces in urban areas. Croplands are known to result in reductions in evapotranspiration, as crops transpire at relatively shorter intervals than forests/woodlands [81]. Nonetheless, these LULC categories show low porosity and a high release of water into the catchment outlet, leading to high water yields. Vegetal cover loss likewise leads to less infiltration, implying low groundwater recharges and baseflow [82], low evapotranspiration rates, high surface runoff and peak flows [79]. However, semi-arid areas are characterised by high temperatures and rainfall variability, so surface water evaporation is still high. For instance, surface water evaporation in Botswana is estimated at about 2000 mm per year [37], which exceeds the annual rainfall received (<600 mm), adding to the low water yield in these catchments. With high evapotranspiration, there is a decrease in baseflow and subsequently in streamflow and water yield. A decrease in water yield may result in water scarcity, distressing the water supply.
Another subject of interest is the impact of small farm dams on water yield and runoff. These structures have been found to lead to reductions in streamflow yield [83], annual runoff volumes, peak flows and increased periods of low flows [84]. Within the Gaborone dam catchment, for instance, there is evidence of an increasing number of small farm dams over the last few decades [85,86,87], which have been reported to lead to a 25% reduction in runoff and a 30% decline in yield at the Gaborone dam [85,86]. Additionally, small farm dams have been found to result in substantial evaporation losses [87]. Therefore, their cumulative impact on downstream yield is significant and should be considered for future water resource management. Future predictions on the effects of small farm dams warn of a significant decrease in streamflows under agricultural intensification [84].
Apart from water quantity, changes in LULC also affect the quality of water resources. Agro-chemicals, due to expansions in croplands, could leak or leach through the soil, causing pollution of nearby water sources. Settlements, especially in developing countries, lack proper sanitation and waste disposal facilities (both household and industrial) and this could result in the pollution of water sources. Groundwater pollution is found to be prevalent (e.g., in Botswana and South Africa) with high quantities of nitrates, faecal coliforms and caffeine. The village of Ramotswa (within the Gaborone dam catchment; see Figure 1) has experienced the worst cases of groundwater pollution due to nitrate and faecal coliform pollution, as stated by [67,88,89], from the use of unlined pit latrines, septic tanks and dumpsites [88]. In South Africa, the presence of nitrates, chlorides and phosphates are attributed to farming and wastewater treatment facilities [90]. With the projected LULC changes in the Gaborone dam catchment, water resources are expected to continue to be impacted; therefore, it is important that appropriate measures are taken to avert the impacts of LULC changes on water resources, especially in these water-stressed catchments.
The CA-Markov model showed great efficiency in modelling the spatio-temporal LULC changes in the Gaborone dam catchment, implying that the area is prone to change and requires extensive land use planning and water resource management by both Botswana and South Africa. Past LULC changes, used together with LULC drivers/factors, have shown their applicability in simulating future LULC changes, as observed by [34,48,91], and should be documented for future reference. However, since this study was limited in the use of driving factors, and because future LULC patterns are uncertain, factors such as population growth, climate variability, natural hazards and socio-economic developments should also be considered in order to enhance our understanding of LULC change processes.
5. Conclusions
This study attempted to simulate future LULC changes in the Gaborone dam catchment, Botswana, from 2015 to 2035 using the CA-Markov model, which assisted in giving a better understanding of possible LULC changes within the study area. The Gaborone dam catchment is expected to continue to experience LULC changes in the future, mainly expansions in the cropland, built-up areas and bare land categories. Cropland, built-up and bare land categories are expected to cover about 29.22%, 8.65% and 6.44% of the catchment area in 2035, as compared to 23.17%, 5.22% and 4.13% in 2015, respectively. On the other hand, categories such as shrubland, tree savanna and water bodies are projected to decrease. Reductions in vegetal cover will occur due to expansions in cropland and built-up areas. Urbanisation and population growth stemming from rural-urban migrations to the city of Gaborone are expected to result in built-up expansions, whereas agricultural subsidy schemes will lead to expansions in croplands in the catchment. Apart from human drivers of LULC change, as a semi-arid area, climate variability may have implications on moisture and temperature variations, which determine vegetal cover health and water body expanses. The decline of potential water sources may also increase water supply challenges in the already water-stressed catchment and exacerbate droughts. The projected changes in LULCs in the Gaborone dam catchment will have implications on water resources, such as reductions in streamflows, catchment water yield (groundwater and surface water) and evapotranspiration and water quality. Therefore, this requires land use planers and water resource managers to take cognizance of the impacts of the changing LULCs in the catchment on water resources for improved future water resource management. This study showed that the CA-Markov model has the ability to simulate LULC changes in the Gaborone dam catchment by providing realistic LULC patterns for the year 2035. However, the consideration of other LULC-forcing factors, such as climate, socio-economic and census dynamics, which was beyond the scope of this work, could further enhance our understanding of the LULC changes in rapidly urbanizing cities such as Gaborone city. The output of this study provides useful information to land use planners and water resource managers to make better decisions in improving future land use policies and formulating catchment management strategies within the framework of sustainable land use planning and integrated water resources management (IWRM). The results can also be used in hydrological assessments of the catchment for the sustainability of the Gaborone dam.
Author Contributions
Conceptualisation, methodology, validation, formal analysis, investigation, data curation, writing-original draft preparation and final report, B.M.; supervision and writing-review and editing, P.K.K., B.P.P. and J.G.M.; funding acquisition, P.K.K. All authors have read and agreed to the published version of the manuscript.
Funding
This work was supported by the Southern African Science Service Center for Climate Change and Adaptive Land Management (SASSCAL) Task 337 and the Wetland Assessment and Monitoring of transboundary basins in Southern Africa (WeMAST Project) funded under the Global Monitoring for Environment and Security (GMES) and Africa Support Programme between the African Union and the European Union, in the area of space science and technology and a key priority under the EU-Africa partnership.
Acknowledgments
This study is part of an ongoing research being undertaken for PhD work of the first author. The authors would like to acknowledge support and funding from the Southern African Science Service Center for Climate Change and Adaptive Management (SASSCAL) and the Wetland Assessment and Monitoring of transboundary basins in Southern Africa (WeMAST Project) funded under the Global Monitoring for Environment and Security (GMES) and Africa Support Programme between the African Union and the European Union.
Conflicts of Interest
The authors declare no conflict of interest regarding the publication of this manuscript.
References
- Karki, S.; Thandar, A.M.; Uddin, K.; Tun, S.; Aye, W.M.; Aryal, K.; Kandel, P.; Chettri, N. Impact of land use land cover change on ecosystem services: A comparative analysis on observed data and people’s perception in Inle Lake, Myanmar. Environ. Syst. Res. 2018, 7, 25. [Google Scholar] [CrossRef]
- Tolessa, T.; Senbeta, F.; Kidane, M. The impact of land use/land cover change on ecosystem services in the central highlands of Ethiopia. Ecosyst. Serv. 2017, 23, 47–54. [Google Scholar] [CrossRef]
- Benzer, N. Using the geographical information system and remote sensing techniques for soil erosion assessment. Pol. J. Environ. Stud. 2010, 19, 881–886. [Google Scholar]
- Permatasari, R.J.; Damayanti, A.; Indra, T.L.; Dimyati, M. Prediction of Land Cover Changes in Penajam Paser Utara Regency Using Cellular Automata and Markov Model. In Earth and Environmental Science; IOP Conference Series; IOP Publishing: Semarang, Indonesia, 2021. [Google Scholar]
- Hossain, F.; Moniruzzaman, M. Environmental Change Detection through Remote Sensing Technique: A Study of Rohingya Refugee Camp Area (Ukhia and Teknaf Sub-district), Cox’s Bazar, Bangladesh. Environ. Chall. 2021, 100024. [Google Scholar] [CrossRef]
- Sibanda, S.; Ahmed, F. Modelling historic and future land use/land cover changes and their impact on wetland area in Shashe sub-catchment, Zimbabwe. Model. Earth Syst. Environ. 2021, 7, 57–70. [Google Scholar] [CrossRef]
- Dibaba, W.T.; Demissie, T.A.; Miegel, K. Watershed Hydrological Response to Combined Land Use/Land Cover and Climate Change in Highland Ethiopia: Finchaa Catchment. Water 2020, 12, 1801. [Google Scholar] [CrossRef]
- Shi, Y.; Xiao, J.; Shen, Y.; Yamaguchi, Y. Quantifying the spatial differences of landscape change in the Hai River Basin, China, in the 1990s. Int. J. Remote. Sens. 2011, 33, 4482–4501. [Google Scholar] [CrossRef]
- Zhang, K.; Ruben, G.B.; Li, X.; Li, Z.; Yu, Z.; Xia, J.; Dong, Z. A comprehensive assessment framework for quantifying climatic and anthropogenic contributions to streamflow changes: A case study in a typical semi-arid North China basin. Environ. Model. Softw. 2020, 104704. [Google Scholar] [CrossRef]
- Armin, M.; Majidian, M.; Kheybari, V.G. Land Use/Land Cover Change Detection and Prediction in the Yasouj City Suburbs in Kohgiluyeh Va Boyerahmad Province in Iran. Arid. Ecosyst. 2020, 10, 203–210. [Google Scholar] [CrossRef]
- Brasil, J.B.; De Andrade, E.M.; Palácio, H.A.D.Q.; Medeiros, P.H.A.; Dos Santos, J.C.N. Characteristics of precipitation and the process of interception in a seasonally dry tropical forest. J. Hydrol. Reg. Stud. 2018, 19, 307–317. [Google Scholar] [CrossRef]
- Franchi, F.; Ahad, J.M.E.; Geris, J.; Jhowa, G.; Petros, A.K.; Comte, J.-C. Modern sediment records of hydroclimatic extremes and associated potential contaminant mobilization in semi-arid environments: Lessons learnt from recent flood-drought cycles in southern Botswana. J. Soils Sediments 2019, 20, 1632–1650. [Google Scholar] [CrossRef]
- Mohan, C.; Western, A.W.; Wei, Y.; Saft, M. Predicting groundwater recharge for varying land cover and climate conditions—A global meta-study. Hydrol. Earth Syst. Sci. 2018, 22, 2689–2703. [Google Scholar] [CrossRef]
- Mulungu, D.M.; Kashaigili, J.J. Dynamics of land use and land cover changes and implications on river flows in Simiyu River catchment, Lake Victoria Basin in Tanzania. Nile Basin Water Sci. Eng. J. 2012, 5, 23–35. [Google Scholar]
- Teklay, A.; Dile, Y.T.; Setegn, S.G.; Demissie, S.S.; Asfaw, D.H. Evaluation of static and dynamic land use data for watershed hydrologic process simulation: A case study in Gummara watershed, Ethiopia. Catena 2019, 172, 65–75. [Google Scholar] [CrossRef]
- Li, L.; Jiang, D.; Li, J.; Liang, L.; Zhang, L. Advances in hydrological response to land use/land cover change. J. Nat. Resour. 2007, 22, 211–224. [Google Scholar]
- Behera, M.D.; Borate, S.N.; Panda, S.N.; Behera, P.R.; Roy, P.S. Modelling and analyzing the watershed dynamics using Cellular Automata (CA)–Markov model—A geo-information based approach. J. Earth Syst. Sci. 2012, 121, 1011–1024. [Google Scholar] [CrossRef]
- Islam, M.S.; Ahmed, R. Land use change prediction in Dhaka city using GIS aided Markov chain modeling. J. Life Earth Sci. 2011, 6, 81–89. [Google Scholar] [CrossRef]
- Mosammam, H.M.; Nia, J.T.; Khani, H.; Teymouri, A.; Kazemi, M. Monitoring land use change and measuring urban sprawl based on its spatial forms: The case of Qom city. Egypt. J. Remote Sens. Space Sci. 2017, 20, 103–116. [Google Scholar]
- Munthali, M.; Mustak, S.; Adeola, A.; Botai, J.; Singh, S.; Davis, N. Modelling land use and land cover dynamics of Dedza district of Malawi using hybrid Cellular Automata and Markov model. Remote. Sens. Appl. Soc. Environ. 2020, 17, 100276. [Google Scholar] [CrossRef]
- Rahman, M.T.U.; Tabassum, F.; Rasheduzzaman, M.; Saba, H.; Sarkar, L.; Ferdous, J.; Uddin, S.Z.; Islam, A.Z. Temporal dynamics of land use/land cover change and its prediction using CA-ANN model for southwestern coastal Bangladesh. Environ. Monit. Assess. 2017, 189, 565. [Google Scholar] [CrossRef]
- Hewett, C.J.; Wilkinson, M.E.; Jonczyk, J.; Quinn, P.F. Catchment systems engineering: An holistic approach to catchment management. Wiley Interdiscip. Rev. Water 2020, 7, e1417. [Google Scholar] [CrossRef]
- Kotaridis, I.; Lazaridou, M. Environmental Change Detection Study in the Wider Area of Lignite Mines. Civil Eng. Archit. 2018, 6, 108–114. [Google Scholar] [CrossRef]
- Maviza, A.; Ahmed, F. Analysis of past and future multi-temporal land use and land cover changes in the semi-arid Upper-Mzingwane sub-catchment in the Matabeleland south province of Zimbabwe. Int. J. Remote Sens. 2020, 41, 5206–5227. [Google Scholar] [CrossRef]
- Hyandye, C.; Martz, L.W. A Markovian and cellular automata land-use change predictive model of the Usangu Catchment. Int. J. Remote. Sens. 2017, 38, 64–81. [Google Scholar] [CrossRef]
- Memarian, H.; Balasundram, S.K.; Talib, J.B.; Sung, C.T.B.; Sood, A.M.; Abbaspour, K. Validation of CA-Markov for simulation of land use and cover change in the Langat Basin, Malaysia. Sci. Res. 2012, 4, 542–554. [Google Scholar] [CrossRef]
- Singh, S.K.; Mustak, S.; Srivastava, P.K.; Szabó, S.; Islam, T. Predicting spatial and decadal LULC changes through cellular automata Markov chain models using earth observation datasets and geo-information. Environ. Process. 2015, 2, 61–78. [Google Scholar] [CrossRef]
- Zhang, L.; Walker, G.R.; Dawes, W.R. Water balance modelling: Concepts and applications. In Regional Water and Soil Assessment for Managing Sustainable Agriculture in China and Australia; ACIAR Monograph Series; ACIAR: Canberra, Australia, 2002; Volume 84, pp. 31–47. [Google Scholar]
- Weng, Q. Land use change analysis in the Zhujiang Delta of China using satellite remote sensing, GIS and stochastic modelling. J. Environ. Manag. 2002, 64, 273–284. [Google Scholar] [CrossRef] [PubMed]
- Naboureh, A.; Moghaddam, M.H.R.; Feizizadeh, B.; Blaschke, T. An integrated object-based image analysis and CA-Markov model approach for modeling land use/land cover trends in the Sarab plain. Arab. J. Geosci. 2017, 10, 259. [Google Scholar] [CrossRef]
- Regmi, R.R.; Saha, S.K.; Subedi, D.S. Geospatial Analysis of Land Use Land Cover Change Modeling in Phewa Lake Watershed of Nepal by Using GEOMOD Model. Himal. Phys. 2017, 6, 65–72. [Google Scholar] [CrossRef]
- Matlhodi, B.; Kenabatho, P.K.; Parida, B.P.; Maphanyane, J.G. Evaluating Land Use and Land Cover Change in the Gaborone Dam Catchment, Botswana, from 1984–2015 Using GIS and Remote Sensing. Sustainability 2019, 11, 5174. [Google Scholar] [CrossRef]
- WUC. Annual Report 2015/16; Water Utilities Corporation: Gaborone, Botswana, 2016. [Google Scholar]
- Halmy, M.W.A.; Gessler, P.E.; Hicke, J.A.; Salem, B.B. Land use/land cover change detection and prediction in the north-western coastal desert of Egypt using Markov-CA. Appl. Geogr. 2015, 63, 101–112. [Google Scholar] [CrossRef]
- Verburg, P.H.; Kok, K.; Pontius, R.G.; Veldkamp, A. Modeling Land-Use and Land-Cover Change, in Land-Use and Land-Cover Change; Springer: Berlin/Heidelberg, Germany, 2006; pp. 117–135. [Google Scholar]
- Alemaw, B.; Keaitse, E.; Chaoka, T. Management of water supply reservoirs under uncertainties in arid and urbanized environments. J. Water Resour. Prot. 2016, 8, 990. [Google Scholar] [CrossRef][Green Version]
- Altchenko, Y.; Lefore, N.; Villholth, K.G.; Ebrahim, G.; Genco, A.; Pierce, K.; Woolf, R.; Mosetlhi, B.B.; Moyo, T.; Kenabatho, P. Resilience in the Limpopo Basin: The Potential Role of the Transboundary Ramotswa Aquifer-Baseline Report; USAID: Pretoria, Southern Africa, 2016. [Google Scholar]
- Statistics-Botswana. Botswana Population Projections 2011–2026; Government Printers: Gaborone, Botswana, 2015. [Google Scholar]
- FAO. Africover Land cover Classification. In Environment and Natural Resources Service; Organisation, F.a.A., Ed.; Food and Agriculture Organisation: Rome, Italy, 1997. [Google Scholar]
- Eastman, J.R. IDRISI Andes Guide to GIS and Image Processing; Clark University: Worcester, MA, USA, 2006; p. 328. [Google Scholar]
- Mishra, M.; Mishra, K.; Subudhi, A.; Phil, M. Urban sprawl mapping and land use change analysis using remote sensing and GIS: Case study of bhubaneswar city, orissa. In Proceedings of the Geo-Spatial World Forum, Hyderabad, India, 18–21 January 2011. [Google Scholar]
- Tavangar, S.; Moradi, H.; Bavani, A.M.; Gholamalifard, M. A futuristic survey of the effects of LU/LC change on stream flow by CA–Markov model: A case of the Nekarood watershed, Iran. Geocarto Int. 2019, 1–17. [Google Scholar] [CrossRef]
- Wu, L.; Shi, P.; Gao, H. State Estimation and Sliding-Mode Control of Markovian Jump Singular Systems. IEEE Trans. Autom. Control. 2010, 55, 1213–1219. [Google Scholar] [CrossRef]
- Yang, X.; Zheng, X.-Q.; Lv, L.-N. A spatiotemporal model of land use change based on ant colony optimization, Markov chain and cellular automata. Ecol. Model. 2012, 233, 11–19. [Google Scholar] [CrossRef]
- Guan, D.; Li, H.; Inohae, T.; Su, W.; Nagaie, T.; Hokao, K. Modeling urban land use change by the integration of cellular automaton and Markov model. Ecol. Model. 2011, 222, 3761–3772. [Google Scholar] [CrossRef]
- Yang, X.; Zheng, X.-Q.; Chen, R. A land use change model: Integrating landscape pattern indexes and Markov-CA. Ecol. Model. 2014, 283, 1–7. [Google Scholar] [CrossRef]
- Al-Sharif, A.A.A.; Pradhan, B. Monitoring and predicting land use change in Tripoli Metropolitan City using an integrated Markov chain and cellular automata models in GIS. Arab. J. Geosci. 2014, 7, 4291–4301. [Google Scholar] [CrossRef]
- Keshtkar, H.; Voigt, W. A spatiotemporal analysis of landscape change using an integrated Markov chain and cellular automata models. Model. Earth Syst. Environ. 2016, 2, 1–13. [Google Scholar] [CrossRef]
- Liang, X.; Liu, X.; Li, D.; Zhao, H.; Chen, G. Urban growth simulation by incorporating planning policies into a CA-based future land-use simulation model. Int. J. Geogr. Inf. Sci. 2018, 32, 2294–2316. [Google Scholar] [CrossRef]
- Liu, Z.; Verburg, P.H.; Wu, J.; He, C. Understanding Land System Change Through Scenario-Based Simulations: A Case Study from the Drylands in Northern China. Environ. Manag. 2016, 59, 440–454. [Google Scholar] [CrossRef]
- Ma, C.; Zhang, G.; Zhang, X.; Zhao, Y.; Li, H. Application of Markov model in wetland change dynamics in Tianjin Coastal Area, China. Procedia Environ. Sci. 2012, 13, 252–262. [Google Scholar] [CrossRef]
- Wang, Y.; Yu, X.; He, K.; Li, Q.; Zhang, Y.; Song, S. Dynamic simulation of land use change in Jihe watershed based on CA-Markov model. Trans. Chin. Soc. Agric. Eng. 2011, 27, 330–336. [Google Scholar]
- Sang, L.; Zhang, C.; Yang, J.; Zhu, D.; Yun, W. Simulation of land use spatial pattern of towns and villages based on CA–Markov model. Math. Comput. Model. 2011, 54, 938–943. [Google Scholar] [CrossRef]
- Berberoğlu, S.; Akın, A.; Clarke, K.C. Cellular automata modeling approaches to forecast urban growth for adana, Turkey: A comparative approach. Landsc. Urban Plan. 2016, 153, 11–27. [Google Scholar] [CrossRef]
- Eastman, J.R. IDRISI Taiga Guide to GIS and Image Processing; Clark Labs Clark University: Worcester, MA, USA, 2009. [Google Scholar]
- Mishra, V.; Rai, P.; Mohan, K. Prediction of land use changes based on land change modeler (LCM) using remote sensing: A case study of Muzaffarpur (Bihar), India. J. Geogr. Inst. Jovan Cvijic SASA 2014, 64, 111–127. [Google Scholar] [CrossRef]
- Gashaw, T.; Tulu, T.; Argaw, M.; Worqlul, A.W. Evaluation and prediction of land use/land cover changes in the Andassa watershed, Blue Nile Basin, Ethiopia. Environ. Syst. Res. 2017, 6, 17. [Google Scholar] [CrossRef]
- Ruben, G.B.; Zhang, K.; Dong, Z.; Xia, J. Analysis and Projection of Land-Use/Land-Cover Dynamics through Scenario-Based Simulations Using the CA-Markov Model: A Case Study in Guanting Reservoir Basin, China. Sustainability 2020, 12, 3747. [Google Scholar] [CrossRef]
- Malczewski, J. GIS-based multicriteria decision analysis: A survey of the literature. Int. J. Geogr. Inf. Sci. 2006, 20, 703–726. [Google Scholar] [CrossRef]
- Li, Z.; Deng, X.; Yin, F.; Yang, C. Analysis of Climate and Land Use Changes Impacts on Land Degradation in the North China Plain. Adv. Meteorol. 2015, 2015, 1–11. [Google Scholar] [CrossRef]
- Gidey, E.; Dikinya, O.; Sebego, R.; Segosebe, E.; Zenebe, A. Cellular automata and Markov Chain (CA_Markov) model-based predictions of future land use and land cover scenarios (2015–2033) in Raya, northern Ethiopia. Modeling Earth Syst. Environ. 2017, 3, 1245–1262. [Google Scholar] [CrossRef]
- Singh, S.K.; Laari, P.B.; Mustak, S.; Srivastava, P.K.; Szabó, S. Modelling of land use land cover change using earth observation data-sets of Tons River Basin, Madhya Pradesh, India. Geocarto Int. 2018, 33, 1202–1222. [Google Scholar] [CrossRef]
- Subedi, P.; Subedi, K.; Thapa, B. Application of a Hybrid Cellular Automaton—Markov (CA-Markov) Model in Land-Use Change Prediction: A Case Study of Saddle Creek Drainage Basin, Florida. Appl. Ecol. Environ. Sci. 2013, 1, 126–132. [Google Scholar] [CrossRef]
- Omar, N.Q.; Ahamad, M.S.S.; Hussin, W.M.A.W.; Samat, N.; Ahmad, S.Z.B. Markov CA, Multi Regression, and Multiple Decision Making for Modeling Historical Changes in Kirkuk City, Iraq. J. Indian Soc. Remote. Sens. 2013, 42, 165–178. [Google Scholar] [CrossRef]
- Pontius, G.J.; Schneider, L.C. Land-cover change model validation by an ROC method for the Ipswich watershed, Massachusetts, USA. Agric. Ecosyst. Environ. 2001, 85, 239–248. [Google Scholar] [CrossRef]
- Mashapa, C.; Gandiwa, E.; Muboko, N.; Mhuriro-Mashapa, P. Land Use and Land Cover Changes in a Human-Wildlife Mediated Landscape of Save Valley Conservancy, South-Eastern Lowveld of Zimbabwe. J. Anim. Plant Sci. 2021, 31. [Google Scholar] [CrossRef]
- McGill, B.M.; Altchenko, Y.; Hamilton, S.K.; Kenabatho, P.K.; Sylvester, S.R.; Villholth, K.G. Complex interactions between climate change, sanitation, and groundwater quality: A case study from Ramotswa, Botswana. Hydrogeol. J. 2019, 27, 997–1015. [Google Scholar] [CrossRef]
- Pontius, R.; Millones, M. Death to Kappa: Birth of quantity disagreement and allocation disagreement for accuracy assessment. Int. J. Remote Sens. 2011, 32, 4407–4429. [Google Scholar] [CrossRef]
- Yang, C.; Wu, G.; Chen, J.; Li, Q.; Ding, K.; Wang, G.; Zhang, C. Simulating and forecasting spatio-temporal characteristic of land-use/cover change with numerical model and remote sensing: A case study in Fuxian Lake Basin, China. Eur. J. Remote. Sens. 2019, 52, 374–384. [Google Scholar] [CrossRef]
- Motlhwa, G.; James, M.Y.; Yunxian, Y. Effects of Integrated Support Programme for Arable Agricultural Development (ISPAAD) on the Income of Sorghum Farmers: Evidence from Kweneng District, Botswana. Asian J. Agric. Ext. Econ. Sociol. 2019, 1–10. [Google Scholar] [CrossRef]
- Seleka, T.B.; Mmopelwa, D. Effects of Input Subsidies on Subsistence Crop Acreage Diversity in Botswana. In BIDPA Working Paper; Botswana Institute for Development and Policy Analysis (BIDPA): Gaborone, Botswana, 2018. [Google Scholar]
- Chagumaira, C.; Rurinda, J.; Nezomba, H.; Mtambanengwe, F.; Mapfumo, P. Use patterns of natural resources supporting livelihoods of smallholder communities and implications for climate change adaptation in Zimbabwe. Environ. Dev. Sustain. 2015, 18, 237–255. [Google Scholar] [CrossRef]
- Gandhi, G.M.; Parthiban, S.; Thummalu, N.; Christy, A. Ndvi: Vegetation Change Detection Using Remote Sensing and Gis—A Case Study of Vellore District. Procedia Comput. Sci. 2015, 57, 1199–1210. [Google Scholar] [CrossRef]
- Monteiro, J.A.; Kamali, B.; Srinivasan, R.; Abbaspour, K.; Gücker, B. Modelling the effect of riparian vegetation restoration on sediment transport in a human-impacted Brazilian catchment. Ecohydrology 2016, 9, 1289–1303. [Google Scholar] [CrossRef]
- Yang, Y.; Tian, F. Abrupt change of runoff and its major driving factors in Haihe River Catchment, China. J. Hydrol. 2009, 374, 373–383. [Google Scholar] [CrossRef]
- James, R.; Washington, R. Changes in African temperature and precipitation associated with degrees of global warming. Clim. Chang. 2012, 117, 859–872. [Google Scholar] [CrossRef]
- Kenabatho, P.; Parida, B.; Moalafhi, D. The value of large-scale climate variables in climate change assessment: The case of Botswana’s rainfall. Phys. Chem. Earth Parts A/B/C 2012, 50, 64–71. [Google Scholar] [CrossRef]
- Moise, A.F.; Hudson, D.A. Probabilistic predictions of climate change for Australia and southern Africa using the reliability ensemble average of IPCC CMIP3 model simulations. J. Geophys. Res. Space Phys. 2008, 113, 15. [Google Scholar] [CrossRef]
- Hassaballah, K.; Mohamed, Y.; Uhlenbrook, S.; Biro, K. Analysis of streamflow response to land use and land cover changes using satellite data and hydrological modelling: Case study of Dinder and Rahad tributaries of the Blue Nile (Ethiopia–Sudan). Hydrol. Earth Syst. Sci. 2017, 21, 5217–5242. [Google Scholar] [CrossRef]
- Obahoundje, S.; Ofosu, E.A.; Akpoti, K.; Kabo-Bah, A.T. Land Use and Land Cover Changes under Climate Uncertainty: Modelling the Impacts on Hydropower Production in Western Africa. Hydrology 2017, 4, 2. [Google Scholar] [CrossRef]
- Yan, B.; Fang, N.; Zhang, P.; Shi, Z. Impacts of land use change on watershed streamflow and sediment yield: An assessment using hydrologic modelling and partial least squares regression. J. Hydrol. 2013, 484, 26–37. [Google Scholar] [CrossRef]
- Huang, J.; Wu, P.; Zhao, X. Effects of rainfall intensity, underlying surface and slope gradient on soil infiltration under simulated rainfall experiments. Catena 2013, 104, 93–102. [Google Scholar] [CrossRef]
- Neal, B.; Nathan, R.J.; Schreider, S.; Jakeman, A.J. Identifying the Separate Impact of Farm Dams and Land Use Changes on Catchment Yield. Australas. J. Water Resour. 2002, 5, 165–176. [Google Scholar] [CrossRef]
- Thompson, J.C. Impact and Management of Small Farm Dams in Hawke’s Bay, New Zealand, in School of Geography, Environment and Earth Sciences 2012; Victoria University of Wellington: Wellington, New Zealand, 2012. [Google Scholar]
- DWA. A Study on the Impact of Small Dam Construction on Downstream Water Resources; Department of Water Affairs: Gaborone, Botswana, 1992. [Google Scholar]
- DWA. A Study on the Impact of Small Dam Construction on Downstream Water Resources (Updated); Department of Water Affairs: Gaborone, Botswana, 2014. [Google Scholar]
- Meigh, J. The impact of small farm reservoirs on urban water supplies in Botswana. Nat. Resour. Forum 1995, 19, 71–83. [Google Scholar] [CrossRef]
- Ranganai, R.T.; Gotlop-Bogatsu, Y.; Maphanyane, J.; Tladi, B. Hydrochemical and Geophysical evaluation of groundwater pollution in the Ramotswa wellfield, SE Botswana. BIE2001 Tech. Pap. 2001, 193–200. [Google Scholar]
- Vogel, H.; Keipeile, K.; Kgomanyane, J.; Zwikula, T.; Pontsho, M.; Mafa, B.; Matthes, L.; Staudt, M.; Beger, K.; Güth, T. Groundwater Quality Case Studies in Botswana; Groundwater Pollution in Africa; Taylor & Francis: London, UK, 2006; pp. 253–264. [Google Scholar]
- Adelana, S.; Xu, Y. Contamination and Protection of the Cape Flats Aquifer, South Africa. In Groundwater Pollution in Africa; Xu, U., Ed.; Taylor and Francis/Balkema: Leiden, The Netherlands, 2006; Volume 13, p. 978. [Google Scholar]
- Luo, G.; Amuti, T.; Zhu, L.; Mambetov, B.T.; Maisupova, B.; Zhang, C. Dynamics of landscape patterns in an inland river delta of Central Asia based on a cellular automata-Markov model. Reg. Environ. Chang. 2015, 15, 277–289. [Google Scholar] [CrossRef]
Publisher’s Note: MDPI stays neutral with regard to jurisdictional claims in published maps and institutional affiliations. |
© 2021 by the authors. Licensee MDPI, Basel, Switzerland. This article is an open access article distributed under the terms and conditions of the Creative Commons Attribution (CC BY) license (https://creativecommons.org/licenses/by/4.0/).

