Abstract
In this work, we present a new methodology integrating data from multiple sources, such as observations from the Landsat-8 (L8) and Sentinel-2 (S2) satellites, with information gathered in field campaigns and information derived from different public databases, in order to characterize the water demand of crops (potential and estimated) in a spatially and temporally distributed manner. This methodology is applied to a case study corresponding to the basin of the Longaví River, located in south-central Chile. Potential and estimated demands, aggregated at different spatio-temporal scales, are compared to the streamflow of the Longaví River, as well as extractions from the groundwater system. The results obtained allow us to conclude that the availability of spatio-temporal information on the water availability and demand pairing allows us to close the water gap—i.e., the difference between supply and demand—allowing for better management of water resources in a watershed.
1. Introduction
In a context of increasing water scarcity and climate change, water resource management policies have focused on ensuring food and energy for the world’s growing populations [1,2]. This has caused a profound imbalance between water supply and demand, and an unequal water resources distribution between users [3], leading to increasing conflicts over water [4], and has forced authorities to take extreme decisions, including watershed closures [5,6].
Water scarcity occurs when the demand exceeds the water availability in time and/or space due to a combination of natural processes and human actions [7]. Globally, the impact of groundwater and surface water extraction relative to the sustainable extraction volume is largely unknown, mainly due to a lack of data [8,9].
Accessing, analyzing and understanding reliable data on the availability, demand and use conditions of water, soil type and land use, and water distribution networks, among other aspects, could provide an information baseline allowing us to transit from management based on water availability to a system based on narrowing the gap between water availability and water demand [10].
Spatio-temporal characterization of the pair water availability–water demand can help support decision making for water management generally, and especially for irrigation management in watersheds with high agricultural land use, achieving rational distribution, control and use of water resources [11]. Thus, the development of tools based on appropriate information technologies for water management generally, and irrigation particularly, must integrate and process data of different types, and from multiple sources at different scales. It must also generate results in an easily used format, allowing for analyzing situations and exploring different scenarios for informed decision making based on the best evidence and experience, allowing for sustainable and rational water management.
Regarding the water demand in basins characterized by a highly agricultural land use, evapotranspiration () links the water balance and energy balance at the Earth’s surface [12]. is also a key component for estimating the water demand. , in this case, is considered an important indicator of climate change and the water cycle [13], and characterizing its long-term variation is crucial for determining crop water requirements.
Satellite image-based technologies which have been used to estimate crop , in a spatio-temporally distributed way, have allowed for improving evidence-based decision making, reducing the gap between crop water demand and available water and diminishing uncertainty in decision making [9,14,15].
The behavior of the pair water availability–water demand as a strategy for improving the spatio-temporal water distribution has been a research question in various works. In Kolokytha et al. [16], the authors strongly emphasized the importance of determining and characterizing the water availability and demand in a basin in order to carry out precise decisions regarding future water management, especially where there is already high stress due to water shortages within the context of climate change. In [8], the authors proposed a methodology which allowed for an ex post analysis of water management strategies at the parcel scale. They integrated information derived from observations by the satellites Landsat-8 () and Sentinel-2 () with field data, in order to estimate in time and space the water consumption of a blueberry field. The proposed focus was based on the comparison of water volumes applied to the crop, potential demand (amount of water to reach maximum performance) and water availability at the level of agricultural exploitation, and their impact on crop production. The principal result was the determination that water management at the study site was inadequate, impacting production volumes. The authors concluded that having information on the water availability–demand binomial would allow for increased agricultural production.
An approximation to larger spatial scales in quantifying the water availability–demand binomial was presented in [9]. In this study, the authors proposed integrating in situ information on water management of crops within the study area with time series, through integrating images from and . Using this information, they performed a seasonal water balance of different crops present in the study area. Finally, they compared the crop water demands (consumed and potential) against the water availability. The authors concluded that having the information necessary to determine the existing gap between water availability and demand improves management of the water volumes applied in different irrigation season stages, with a positive impact on agricultural production and water allocation to users. This work was carried out at a local scale () and based on prior agricultural soil and land use knowledge. However, if it were possible to characterize the use of agricultural soil at larger scales, systematically gathering its spatio-temporal variability, and allowing researchers to comprehend its change dynamic, the same methodology could be used to carry out an ex post analysis of water management at the basin level, which would allow people to have an important information source for water distribution management and planning [17].
At the watershed level, the Sen2-Agri project [18], from the European Space Agency (ESA), is aimed at providing validated algorithms to the international community for generating agriculture observation products at a spatial resolution of 10 m, using a methodology based on the random forest (RF) algorithm [19], for analyzing image observations from the satellite [20,21]. Its use has been validated for generating maps of principal crops in Central Europe, with overall accuracy (OA) results above 85%. Studies have also been conducted in other parts of the world. In [22], a study was carried out on the plains of Haouz, Morocco, to evaluate Sen2-Agri’s potentiality to generate agricultural soil use maps in zones with highly fragmented and heterogeneous land parcels. The crops selected for the classification process were cereals (in winter), melons (in summer) and three types of fruit trees (olives, oranges and apricots). Results showed a crop classification OA of 85.6%. This high OA value is principally due to the low number of classes used to train the Sen2-Agri model. In [23], Sen2-Agri products were evaluated for agricultural scenarios in India. The authors considered six crop types (pearl millet, fodder, maize, pomegranate, soybean and sugarcane) and reported an average OA of 70%, with the lowest OA values for pearl millet and fodder (61%) and the highest for soybean (86%).
In Chile, agriculture uses around 85% of freshwater resources. On the other hand, there has been a significant decline in precipitation—solid and liquid—since 2010 [24,25]. Under this scenario of increasing scarcity, decision-makers require better information for better decisions. Even though precipitation-related datasets are becoming more available, there is a significant information gap regarding the actual and future water demands for different water uses, enabling water demand management [9,26].
In this study, we integrated data from multiple sources to allow a spatio-temporal characterization of the agricultural water use and thus allow for management and decision making based on the evidence of the available and required water resources within a basin. To achieve this aim, open source software called Sen2-Agri was used to characterize the land use and time series of the potential crop water demand, as well as the surface energy balance (SEB), in order to determine the time series of water used by crops during the agricultural season. To improve the temporal resolution of the water used by crops’ crop water demand, we carried out a harmonization strategy for leaf area index (LAI) maps drawn from L8 and S2 images. The proposed methodology was applied to a watershed of 676 km2, of which approximately 73% is in agricultural use, for around 4000 producers, where over 80% are small farmers exploiting lands smaller than 12 ha.
2. Materials and Methods
The methodology considered the estimation of 3 main variables in its workflow: (1) potential water demand of crops (), corresponding to the amount of water to reach maximum yields; (2) estimated water use of crops (), corresponding to estimation of evapotranspirated water from crops; and (3) water availability (), corresponding to the water volume available in the basin. Comparing and approaches the water supply conditions of crops, that is, whether a given crop receives the required amount of water to reach a high productivity level. Comparing with lets us know the potential water supply gap. Finally, the relation between and allows for analyzing the expected or actual scarcity conditions. Furthermore, the definition of an updated crop pattern within the basin allows for defining maximum demand zones or time periods when the water demand would peak.
2.1. Study Site
The study site is located in the Maule Region, Chile (3608′S, 7140′W), and covers the entire basin of the Longaví River, with an area of 676 km2. The Longaví River is born in an upper watershed in the Andes Mountains, with a north–south orientation at 2000 masl. It runs for 120 km and presents a pluvio-nival component. Its annual mean flow, measured at the Quiriquina gauging station, is 2670 m3/min [27].
The region has a Mediterranean climate, with hot dry summers (December to March). Annual average precipitation is 1051 mm. A total of 85% of annual precipitation occurs between the months of May and August, while the maximum water demand for agricultural activities—which use about 85% of the national water resources—occurs between September and March [24,28]. The temperature regime of this zone is characterized by a median temperature of 19 C with extremes of 30 C, during the summer period. During the winter period, median minimum temperatures are 7 C [29]. Soils originate from volcanic ash deposits and clayey sediments on rock.
The climate regime supports the construction of winter storage infrastructure and water distribution during the the spring–summer season (SONDJF). Storage and distribution infrastructure in the Longaví River watershed consists of a storage reservoir with a capacity of 60 million m3, and 22 main canals with their respective derivations. This watershed is managed by the Longaví River Oversight Board [30] (Figure 1). River boards are water user organizations (WUO) using water from a single source, having the duty to administer and distribute the water volume according to water rights, to use and conserve common exploitation works and to carry out other tasks assigned to them by the law.
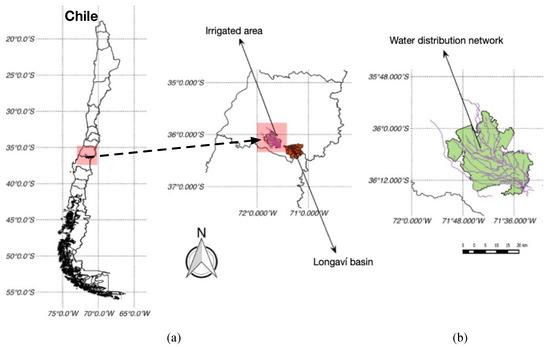
Figure 1.
(a) The study site is located in Maule, Chile (S and W, Zone 19, Datum ), covering the entire basin of the Longaví River, with an area of 676 km2. (b) The water distribution network in the Longaví River watershed consists of a storage reservoir with a capacity of 60 Mm3, and 22 main canals with their respective derivations.
2.2. Image Acquisition
The study period corresponds to the farming season which began in the month of September 2019, and ended in March 2020. For this season, 36 satellite images were obtained: 10 images from the satellite and the other 26 from the satellite (Table 1).

Table 1.
Dates of images used during 2019–2020 season.
2.3. Characterization of Agricultural Soil Use via Integration of Sentinel-2 Images and In Situ Information
To characterize the agricultural land use for the entire study area, the open source software system called Sen2-Agri was used [31]. This software allows for automatically carrying out the procedure of downloading and conditioning images, as well as generating the classification of agricultural covers for a specific time frame.
Figure 2 depicts the process to obtain a seasonal series of using an automatic learning strategy [32], as well as an updated layer of agricultural land use using the RF algorithm [12].
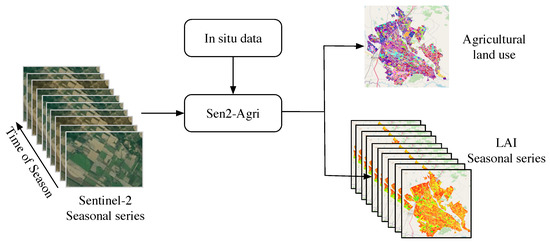
Figure 2.
Workflow of land use mapping using Sen2-Agri.
Classification models using RF require in situ data for the model training stage. In this sense, a series of field campaigns were carried out from November 2019 to February 2020 to identify and record the principal crop patterns present in the study zone. During these trips, hand-drawn maps were made of all boundaries of farm fields in the basin, using images of the start, middle and end of farming seasons as base information along with statistical information from the Instituto Nacional de Estadística de Chile [33]. The 30 main crops in the zone were also characterized based on the information raised from 2545 farm fields (polygons) during the 8890 ha field trips, corresponding to 18% of the total area of farm uses. All of this information was organized with QGis 3.14 software.
Every identified farm cover was tagged based on the nomenclature proposed by CORINE Land Cover [34] and registered on a dataset, of which 75% was used for training models via Sen2-Agri, and 25% was used for validation. For the RF classifier, used by Sen2-Agri, a configuration of 100 decision trees was used, with a maximum depth of 25 and a minimum sample number in every tree node of 25. Finally, the overall accuracy (OA) of the classification was evaluated [35]. A more detailed description of the process carried out by Sen2-Agri can be found in [19].
Sen2-Agri also allows users to generate leaf area index () maps. To obtain these, an automatic learning strategy is used to build a non-linear regression model from surface reflectance values obtained from images [32]. These reflectance values are simulated using the ProSail model described in [36].
2.4. Multi-Source Data Integration for Crop Water Demand Estimation
To estimate water demand for crops present in the study zone, data from multiple public information sources were integrated with dissimilar characteristics from both a spatio-temporal viewpoint and a format perspective, as seen hereinafter.
2.4.1. Potential Water Demand
Figure 3 shows the workflow for estimating . Outputs from Sen2-Agri, agricultural land use and , as shown in Figure 2, along with theoretical crop coefficient () values [2], allow estimating an adjusted crop coefficient value () (Equation (2)). The output of this process is crop evapotranspiration () by combining ground-based meteorological data and adjusted crop coefficients.
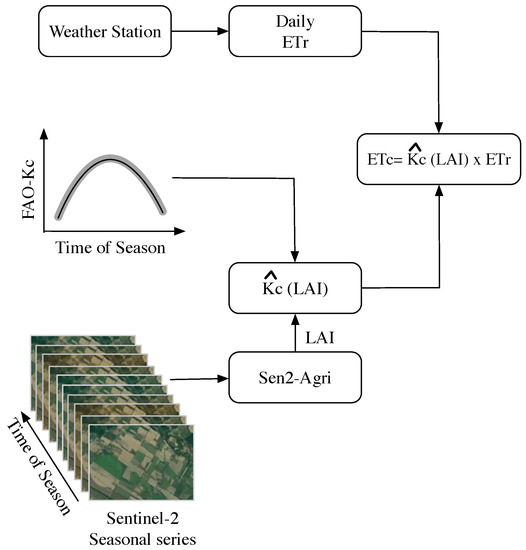
Figure 3.
Workflow to estimate for different crop patterns.
For this, crop evapotranspiration () was calculated, adjusted to the condition of phenological development of each of the studied crops [9], which was called adjusted ().
To determine the value of for each crop (k), and for each day of the season (i), we used relation (1):
where is the reference evapotranspiration for day i, estimated with data from the Longaví-Norte meteorological station that is representative of the study area, which delivers daily data on precipitation, temperature, relative humidity and atmospheric pressure and is operated by the National Agrometorological Network [37]; is the adjusted crop coefficient, calculated for each crop (k), for the days which have images (l). The values of were obtained via a linear relationship between , established in FAO bulletin 66 [2], and the maps generated from images via Sen2-Agri [38]. For the construction of the linear relationship, only the theoretical minimum and maximum (start and end of analyzed farm season) and the maps closest to the date which produced minimum and maximum values were considered. Linear relationships were determined for each crop in the study area (k crops), obtaining the corresponding relation coefficients (, ). These coefficients were used to calculate an adjusted crop coefficient value () via Equation (2):
In the analyzed system, water is distributed via open canals; therefore, we assumed that all necessary irrigation water travels happen via these canals. Thus, based on values and considering the conveyance efficiency () of each water system canal, we can calculate the of water for each canal, for each day of the study zone farm season (3).
where n is the total of crops considered in the study. If one particular canal has no k crop types present, has a value of zero.
2.4.2. Estimation of Water Use
For for crops, the was calculated via a spatially distributed model of surface energy balance (SEB) [39,40], following the protocol proposed by [41]. The SEB model entries were the images captured by the satellite (Table 1) during the farm season and in situ data captured by the Longaví-Norte meteorological station [37].
For each date with images available, maps were obtained as an intermediate SEB process outcome. Thus, and maps were integrated via linear-type relations for each of the k crops present in the study zone (4).
where is the evapotranspiration of crop k determined for capture date l of the image via the SEB model. The coefficients and are the constants of the linear relation generated between and for each one of the k crop types present in the study zone.
As a way of improving the temporal resolution of the maps obtained from images, we carried out a harmonization strategy for maps drawn from and images, using the methodology described in [9]. Thus, map pairs obtained from and which were captured on the same day during the season were selected and integrated via a linear relation for each one of the crop k types. This relation allowed for creating maps from harmonized for . This procedure is formalized in Equation (5).
where corresponds to the maps obtained from the linear relation (harmonization), and and are the constants of the linear relation for each crop present in the study zone.
In this way, using the harmonization equation of Equation (5), it was possible to construct a harmonized time series, called , composed of and maps for the entire study period.
Based on the time series of and the coefficients obtained from Equation (4), a harmonized time series was determined for every day when or images were available (6).
where n is a particular date of the dates comprising the time series of . It should be emphasized that for calculating , one must consider the coefficient values of and closest to the date n being determined.
Based on the values of , and the values of , one can calculate the coefficients of every crop (), adjusted to the local study zone conditions, for every day where data exist for the series (7):
2.5. Water Availability
The water resource assignment and distribution system in Chile is based on the Water Code. The key pieces are the so-called surface water rights () which grant a real right of use to the proprietors who extract water from surface water and groundwater sources. Furthermore, water distribution is conducted within the so-called water user organizations (WUO) proportionally to the water volume of the .
The water system of the Longaví River feeds a network made up of twenty main canals. Each canal is constituted by a water community which has assigned surface water rights () on the river flow [4].
The availability of water resources in the basin () is the amount of exploitable water including the surface flow (), and available groundwater (). In this way, water availability for each main canal is represented by Equation (10):
where is the availability of water for day i in canal j, is the daily surface flow of the Longaví River measured at Quiriquina station [27], is the sum of all SWR involved in the basin, according to official records of the General Water Directorate of Chile [42], and and are surface water rights and available groundwater for canal j, respectively.
From the preceding, the daily available surface flow per canal () is defined considering and the , as shown in Equation (11):
3. Results and Discussion
Figure 4 shows the thematic map of agricultural land use obtained from the classification process at the farm level.
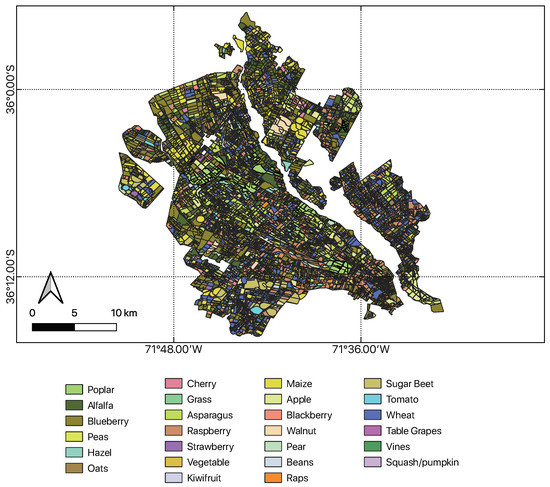
Figure 4.
Classification map, at parcel scale, of agricultural land use in study zone.
The OA of the classification was 57%. The precision value is below that obtained by [23] (accuracy ≈ 0.70). One possible reason for the precision value obtained in the classification is the farm fragmentation in size (80% are small farmers using less than 12 ha) and the variety of cover types present in our study area (the 30 principal types of crops were considered). One strategy for improving classification precision is increasing the number of samples used for training RF models included in Sen2-Agri. This would involve increasing the operational complexity and cost of field operations. Thus, for future studies, we recommend analyzing the impact of the classification quality regarding the quality of results obtained in estimating potential crop water demands (). Of the 49,591 ha in the total area, 41.9% is perennial crops, 35.3% is fruits, 48.6% is forage and 4.1% is forest plantations (specifically, poplars).
For determining , formalized in Equation (10), the surface flow () time series was used, obtained from [27]. Updates were also conducted for available information on the of each principal canal. Table 2 shows the for the 2019–2020 season (season in study) obtained from the General Water Directorate of Chile [42] and consolidated with information available from the Longaví River Oversight Group [30].
Table 2.
Irrigation area and surface water rights () for each main channel belonging to the agricultural basin Río Longaví.
Groundwater rights () were obtained from 562 water rights records in the Chilean National Water Record [43], for the municipalities of Retiro, Parral and Longaví. The average annual flow of all these groundwater water rights is 946.8 m3/min.
In Figure 5, we can see , and per ha for each of the main canals, by using Equation (10). The main canal Quinta Alto A was the canal with the greatest amount of total water available ( and ) per surface unit during the farm season. This canal also has a larger volume compared to the other canals. The opposite situation arises with the main canal La Tercera, with the lowest volume of water available for the season, having to satisfy almost 50% of its water requirements from . Similarly, the main canals Copihue, Robles Viejos and Rosas La Piedad are shown to have groundwater contributions higher than the surface water availability.
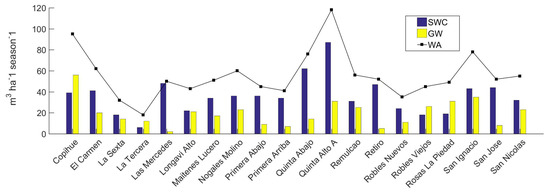
Figure 5.
Total water availability (), surface water () and groundwater () per ha for each canal during the 2019–2020 season.
In Figure 6, we can observe the time series of images from (10 images) and (26 images) which were used to generate the synthetic time series. For the analyzed season, there was a coincidence in the and image capture for the dates 25 December 2019 and 14 March 2020. These dates were used to obtain the coefficients and for the harmonization equation (Equation (5)). Thus, coefficients were obtained for each of the 30 crops in the study zone, with which it was possible to build a time series of , composed of a total of 34 images. Figure 6 allows us to see both and image capture dates, along with the dates of the time series which could be built.
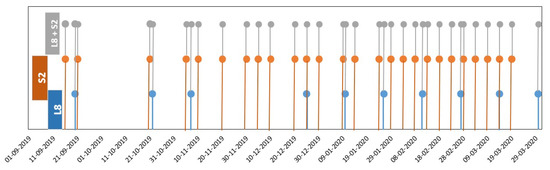
Figure 6.
Representation of the time series of and images used to generate the synthetic time series of () for the study zone during the 2019–2020 season.
Based on the time series, it was possible to estimate the (Equation (3)) and the (Equation (9)) for each of the principal canals in the study zone. Figure 7 shows the and of accumulated water during the farm season, for each canal. Comparing the with the , all of the main canals present an average water deficit of 5% during the season. The largest differences were presented in the Longaví Alto (21.6%), Remulcao (10.5%) and Robles Viejos (7.6%) main canals. Meanwhile, the lowest deficit appears for the Quinta Alto A canal (1%). This situation may be due to bad irrigation management within farms, which may have direct repercussions on yields. Another explanation is that the available water volumes in given periods were significantly lower than the demand, meaning that farmers were obliged to generate water stress in the crops at the cost of diminishing yields and economic income.
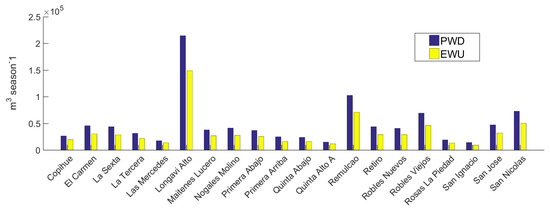
Figure 7.
Potential water demand () and estimated water use () accumulated in the farm season, for each main canal.
Figure 8 presents the curves for , , and integrated for all canals, and for each of the days in the studied season (September 2019 to March 2020).
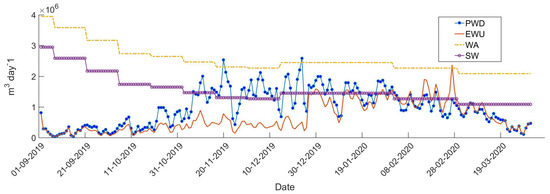
Figure 8.
Potential water demand (), estimated water use (), water availability () and surface water availability (), integrated for all canals, and for each day of the studied season (September 2019 to March 2020).
The start of the irrigation season (September and October) is also the snowmelt season, when the Longaví River has its maximum flow, and from an operational point of view, the River Board does not impose restrictions on water allocation for each canal. This coincides with the low evapotranspiration of crops in this time due to their incipient phenological development. Consequently, the is greater than and , implying an operational condition called “free river”, where water apportionment is conducted without any restrictions by the Longaví River Board. As the irrigation season goes on, the demand increases, due to the crops’ phenological condition, and water availability diminishes. This condition appears from the beginning of November to the middle of December, where exceeds the amount of and, on some days, . During this period, the Longaví River Board imposes certain water allocation restrictions, exclusively considering an availability criterion, without considering availability or the crops’ or . This type of restriction has a direct impact on crops’ potential development and production. From the second week of December on, the storage reservoir comes into operation, increasing water availability. This has an important effect on crop development from the last week of December, as reflected by .
The integration of information and multiple data sources allows basin water managers to visualize and carry out an ex post analysis of the behavior of , , and . This gives them tools to make evidence-based decisions, allowing them to shrink the gap between water availability and demand. This can directly impact farm productivity and increase water users’ satisfaction throughout the basin. For example, it is possible to evaluate the option of starting reservoir operation ahead of time, to adjust it to maximum demand periods or to analyze the feasibility of implementing storage measures within farms [44,45,46]. Another analysis element is shown in Figure 9 regarding water use efficiencies for each principal canal, obtained from Equation (12).
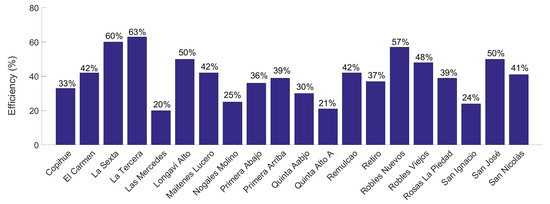
Figure 9.
Efficiency () of water use by main canal.
The average water use efficiency of the Longaví River Oversight Board was 40% for the 2019–2020 farming season. The most efficient main canals were La Tercera at 63%, La Sexta at 60% and Robles Viejos at 57%. The lowest efficiency was for the Las Mercedes main canal at 20%.
4. Conclusions
Integrating data from multiple sources makes it possible to carry out management and decision making based on the evidence of the available and required water resources within a basin. Comparing the water demand—potential and estimated use—from crops present in an area and water availability, in space and time, can allow for improvements in farms’ productivity while ensuring the availability of water resources for all users. Integration of data from and allowed for spatio-temporal characterization of both and . This information, along with the data from multiple public data sources, provides a synoptic vision of water resource behavior for managers to make operational decisions based on empirical evidence.
Author Contributions
Conceptualization, M.L.-S. and F.d.l.H.; methodology, M.L.-S., V.G., M.S.-V. and A.G.-P.; software, A.G.-P. and V.G. validation, A.G.-P., V.G. and M.L.-S.; data curation, M.L.-S., M.S.-V. and A.G.-P.; writing—original draft preparation, M.L.-S. and V.G.; writing—review and editing, M.L.-S., D.R., M.S.-V. and C.G.-M. All authors have read and agreed to the published version of the manuscript.
Funding
This research was funded by the Water Research Center For Agriculture and Mining, CRHIAM (ANID/FONDAP/15130015) and the project : An intelligent management tool for water allocation (Fondef-IT18I0008).
Institutional Review Board Statement
Not applicable.
Informed Consent Statement
Not applicable.
Acknowledgments
The authors thanks the support of Junta de Vigilancia del Río Longaví, Chile.
Conflicts of Interest
The authors declare no conflict of interest.
References
- Fan, Y.; Massey, R.; Park, S.C. Multi-crop production decisions and economic irrigation water use efficiency: The effects of water costs, pressure irrigation adoption, and climatic determinants. Water 2018, 10, 1637. [Google Scholar] [CrossRef]
- Steduto, P.; Hsiao, T.C.; Fereres, E.; Raes, D. Crop Yield Response to Water; Food and Agriculture Organization of the United Nations: Rome, Italy, 2012; Volume 1028. [Google Scholar]
- Wang, X.-j.; Zhang, J.-y.; Gao, J.; Shahid, S.; Xia, X.-h.; Geng, Z.; Tang, L. The new concept of water resources management in China: Ensuring water security in changing environment. Environ. Dev. Sustain. 2018, 20, 897–909. [Google Scholar] [CrossRef]
- Rivera, D.; Godoy-Faúndez, A.; Lillo, M.; Alvez, A.; Delgado, V.; Gonzalo-Martín, C.; Menasalvas, E.; Costumero, R.; García-Pedrero, Á. Legal disputes as a proxy for regional conflicts over water rights in Chile. J. Hydrol. 2016, 535, 36–45. [Google Scholar] [CrossRef]
- Expósito, A.; Berbel, J. Drivers of irrigation water productivity and basin closure process: Analysis of the Guadalquivir river basin (Spain). Water Resour. Manag. 2019, 33, 1439–1450. [Google Scholar] [CrossRef]
- Molle, F.; Wester, P.; Hirsch, P. River basin closure: Processes, implications and responses. Agric. Water Manag. 2010, 97, 569–577. [Google Scholar] [CrossRef]
- Rosa, L.; Chiarelli, D.D.; Rulli, M.C.; Dell’Angelo, J.; D’Odorico, P. Global agricultural economic water scarcity. Sci. Adv. 2020, 6, eaaz6031. [Google Scholar] [CrossRef]
- Holzapfel, E.; Lillo-Saavedra, M.; Rivera, D.; Gavilán, V.; García-Pedrero, A.; Gonzalo-Martín, C. A satellite-based ex post analysis of water management in a blueberry orchard. Comput. Electron. Agric. 2020, 176, 105635. [Google Scholar] [CrossRef]
- Gavilán, V.; Lillo-Saavedra, M.; Holzapfel, E.; Rivera, D.; García-Pedrero, A. Seasonal Crop Water Balance Using Harmonized Landsat-8 and Sentinel-2 Time Series Data. Water 2019, 11, 2236. [Google Scholar] [CrossRef]
- Khan, M.; Islam, M.; Hafeez, M.; Flugel, W. Decision Support System for an efficient irrigation water management in semi arid environment. AGUFM 2009, 2009, H21A-0828. [Google Scholar]
- Jaiswal, R.K.; Yadav, R.N.; Lohani, A.K.; Tiwari, H.L.; Yadav, S. Water balance modeling of Tandula (India) reservoir catchment using SWAT. Arab. J. Geosci. 2020, 13, 1–13. [Google Scholar] [CrossRef]
- Gonzalo-Martín, C.; Lillo-Saavedra, M.; García-Pedrero, A.; Lagos, O.; Menasalvas, E. Daily Evapotranspiration Mapping Using Regression Random Forest Models. IEEE J. Sel. Top. Appl. Earth Obs. Remote Sens. 2017, 10, 5359–5368. [Google Scholar] [CrossRef]
- Han, J.; Wang, J.; Zhao, Y.; Wang, Q.; Zhang, B.; Li, H.; Zhai, J. Spatio-temporal variation of potential evapotranspiration and climatic drivers in the Jing-Jin-Ji region, North China. Agric. For. Meteorol. 2018, 256–257, 75–83. [Google Scholar] [CrossRef]
- Malik, W.; Dechmi, F. DSSAT modelling for best irrigation management practices assessment under Mediterranean conditions. Agric. Water Manag. 2019, 216, 27–43. [Google Scholar] [CrossRef]
- Trentacoste, E.R.; Puertas, C.M.; Sadras, V.O. Effect of irrigation and tree density on vegetative growth, oil yield and water use efficiency in young olive orchard under arid conditions in Mendoza, Argentina. Irrig. Sci. 2015, 33, 429–440. [Google Scholar] [CrossRef]
- Kolokytha, E.; Malamataris, D. Integrated Water Management Approach for Adaptation to Climate Change in Highly Water Stressed Basins. Water Resour. Manag. 2020, 34, 1173–1197. [Google Scholar] [CrossRef]
- Tadese, M.; Kumar, L.; Koech, R.; Kogo, B.K. Mapping of land-use/land-cover changes and its dynamics in Awash River Basin using remote sensing and GIS. Remote Sens. Appl. Soc. Environ. 2020, 19, 100352. [Google Scholar] [CrossRef]
- ESA. Detailed Description of the Sen2-Agri System, European Space Agency (ESA). 2019. Available online: http://www.esa-sen2agri.org/operational-system/system-description/ (accessed on 1 December 2020).
- Inglada, J.; Arias, M.; Tardy, B.; Hagolle, O.; Valero, S.; Morin, D.; Dedieu, G.; Sepulcre, G.; Bontemps, S.; Defourny, P.; et al. Assessment of an operational system for crop type map production using high temporal and spatial resolution satellite optical imagery. Remote Sens. 2015, 7, 12356–12379. [Google Scholar] [CrossRef]
- Defourny, P.; Bontemps, S.; Bellemans, N.; Cara, C.; Dedieu, G.; Guzzonato, E.; Hagolle, O.; Inglada, J.; Nicola, L.; Rabaute, T.; et al. Near real-time agriculture monitoring at national scale at parcel resolution: Performance assessment of the Sen2-Agri automated system in various cropping systems around the world. Remote Sens. Environ. 2019, 221, 551–568. [Google Scholar] [CrossRef]
- Kussul, N.; Shelestov, A.; Lavreniuk, M.; Kolotii, A.; Vasiliev, V. Land Cover and Land Use Monitoring Based on Satellite Data within World Bank Project. In Proceedings of the 2019 10th International Conference on Dependable Systems, Services and Technologies (DESSERT), Leeds, UK, 5–7 June 2019; pp. 127–130. [Google Scholar]
- Moumni, A.; Sebbar, B.e.; Simonneaux, V.; Ezzahar, J.; Lahrouni, A. Evaluation Of Sen2agri System Over Semi-Arid Conditions: A Case Study Of The Haouz Plain In Central Morocco. In Proceedings of the 2020 Mediterranean and Middle-East Geoscience and Remote Sensing Symposium (M2GARSS), Tunis, Tunisia, 9–11 March 2020; pp. 343–346. [Google Scholar]
- Vijayasekaran, D. SEN2-AGRI–Crop Type Mapping Pilot Study Using Sentinel-2 Satellite Imagery in India. Int. Arch. Photogramm. Remote Sens. Spat. Inf. Sci. 2019. [Google Scholar] [CrossRef]
- Valdés-Pineda, R.; Pizarro, R.; García-Chevesich, P.; Valdés, J.B.; Olivares, C.; Vera, M.; Balocchi, F.; Pérez, F.; Vallejos, C.; Fuentes, R.; et al. Water governance in Chile: Availability, management and climate change. J. Hydrol. 2014, 519, 2538–2567. [Google Scholar] [CrossRef]
- Garreaud, R.D.; Alvarez-Garreton, C.; Barichivich, J.; Boisier, J.P.; Christie, D.; Galleguillos, M.; LeQuesne, C.; McPhee, J.; Zambrano-Bigiarini, M. The 2010–2015 megadrought in central Chile: Impacts on regional hydroclimate and vegetation. Hydrol. Earth Syst. Sci. 2017, 21, 6307–6327. [Google Scholar] [CrossRef]
- Brooks, D.B. An operational definition of water demand management. Int. J. Water Resour. Dev. 2006, 22, 521–528. [Google Scholar] [CrossRef]
- CR2. Explorador Climático, Center for Climate and Resilience Research. 2020. Available online: http://explorador.cr2.cl/ (accessed on 30 March 2021).
- Aitken, D.; Rivera, D.; Godoy-Faúndez, A.; Holzapfel, E. Water scarcity and the impact of the mining and agricultural sectors in Chile. Sustainability 2016, 8, 128. [Google Scholar] [CrossRef]
- DCM. Servicios Climáticos, Dirección Meteorológica de Chile (DMC). 2020. Available online: https://climatologia.meteochile.gob.cl/ (accessed on 30 March 2021).
- JVRL. Junta de Vigilancia Río Longaví y sus Afluentes. 2020. Available online: https://www.juntariolongavi.cl/ (accessed on 1 April 2021).
- Bontemps, S.; Arias, M.; Cara, C.; Dedieu, G.; Guzzonato, E.; Hagolle, O.; Inglada, J.; Matton, N.; Morin, D.; Popescu, R.; et al. Building a data set over 12 globally distributed sites to support the development of agriculture monitoring applications with Sentinel-2. Remote Sens. 2015, 7, 16062–16090. [Google Scholar] [CrossRef]
- Weiss, M.; Baret, F.; Leroy, M.; Hautecœur, O.; Bacour, C.; Prevol, L.; Bruguier, N. Validation of neural net techniques to estimate canopy biophysical variables from remote sensing data. Agron.-Scie. Prod. Veg. Environ. 2002, 22, 547–554. [Google Scholar] [CrossRef]
- INE. Geodatos Abiertos, Instituto Nacional de Estadística (INE). 2020. Available online: https://www.ine.cl/herramientas/portal-de-mapas/geodatos-abiertos (accessed on 31 March 2020).
- Büttner, G.; Feranec, J.; Jaffrain, G.; Mari, L.; Maucha, G.; Soukup, T. The CORINE land cover 2000 project. EARSeL eProceedings 2004, 3, 331–346. [Google Scholar]
- Congalton, R.G. A review of assessing the accuracy of classifications of remotely sensed data. Remote Sens. Environ. 1991, 37, 35–46. [Google Scholar] [CrossRef]
- Feret, J.B.; François, C.; Asner, G.P.; Gitelson, A.A.; Martin, R.E.; Bidel, L.P.; Ustin, S.L.; Le Maire, G.; Jacquemoud, S. PROSPECT-4 and 5: Advances in the leaf optical properties model separating photosynthetic pigments. Remote Sens. Environ. 2008, 112, 3030–3043. [Google Scholar] [CrossRef]
- RAN. Agromet, Red Agroclimática Nacional (RAN). 2020. Available online: https://www.agromet.cl/ (accessed on 20 November 2020).
- Pereira, A.R.; de Camargo, M.B.P.; Nova, N.A.V. Coeficiente de cultivo de cafezais com base no índice de área foliar para irrigação de precisão. Bragantia 2011, 70, 946–951. [Google Scholar] [CrossRef]
- Bastiaanssen, W.G.; Menenti, M.; Feddes, R.A.; Holtslag, A.A. A remote sensing surface energy balance algorithm for land (SEBAL): 1. Formulation. J. Hydrol. 1998, 212–213, 198–212. [Google Scholar] [CrossRef]
- Allen, R.G.; Tasumi, M.; Trezza, R. Satellite-Based Energy Balance for Mapping Evapotranspiration with Internalized Calibration (METRIC)—Model. J. Irrig. Drain. Eng. 2007, 133, 380–394. [Google Scholar] [CrossRef]
- Fonseca-Luengo, D.; Lillo-Saavedra, M.; Lagos, L.O.; García-Pedrero, A.; Gonzalo-Martín, C. Use of Machine Learning to Improve the Robustness of Spatial Estimation of Evapotranspiration; Lecture Notes in Computer Science (including Subseries Lecture Notes in Artificial Intelligence and Lecture Notes in Bioinformatics); Springer: Berlin, Germany, 2017; Volume 10657 LNCS, pp. 237–245. [Google Scholar]
- DGA. Derechos de Aprovechamiento de Aguas Registrados en la Dirección General de Aguas de Chile (DGA). 2020. Available online: https://dga.mop.gob.cl/productosyservicios/derechos_historicos/Paginas/default.aspx (accessed on 10 June 2020).
- IDE Chile. Cuencas Banco Nacional de Aguas de Chile, Infraestrucutra de Datos Geoespaciales (IDE). 2020. Available online: https://www.ide.cl/index.php/medio-ambiente/item/1635-cuencas-banco-nacional-de-aguas (accessed on 3 April 2021).
- Kuschel-Otárola, M.; Rivera, D.; Holzapfel, E.; Palma, C.D.; Godoy-Faúndez, A. Multiperiod optimisation of irrigated crops under different conditions of water availability. Water 2018, 10, 1434. [Google Scholar] [CrossRef]
- Kuschel-Otárola, M.; Rivera, D.; Holzapfel, E.; Schütze, N.; Neumann, P.; Godoy-Faúndez, A. Simulation of Water-Use Efficiency of Crops under Different Irrigation Strategies. Water 2020, 12, 2930. [Google Scholar] [CrossRef]
- Kuschel-Otárola, M.; Schütze, N.; Holzapfel, E.; Godoy-Faúndez, A.; Mialyk, O.; Rivera, D. Estimation of yield response factor for each growth stage under local conditions using AquaCrop-OS. Water 2020, 12, 1080. [Google Scholar] [CrossRef]
Publisher’s Note: MDPI stays neutral with regard to jurisdictional claims in published maps and institutional affiliations. |
© 2021 by the authors. Licensee MDPI, Basel, Switzerland. This article is an open access article distributed under the terms and conditions of the Creative Commons Attribution (CC BY) license (https://creativecommons.org/licenses/by/4.0/).