Abstract
Surface solar radiation (SSR) is the main factor affecting the earth’s climate and environment and its variations and the reason for these variations are an important part of climate change research. In this research, we investigated the long-term variations of SSR during 1984–2016 and the quantitative influences of atmospheric aerosols, anthropogenic emissions, and meteorological conditions on SSR over China’s mainland. The results show the following: (1) The annual average SSR values had a decline trend at a rate of −0.371 Wm−2 yr−1 from 1984 to 2016 over China. (2) The aerosol optical depth (AOD) plays the main role in inducing variations in SSR over China, with r values of −0.75. Moreover, there are marked regional differences in the influence of anthropogenic emissions and meteorological conditions on SSR trends. (3) From a regional perspective, AOD is the main influencing factor on SSR in northeast China (NEC), Yunnan Plateau and surrounding regions (YPS), North China (NC), and Loess Plateau (LP), with r values of −0.65, −0.60, −0.89, and −0.50, respectively. However, the main driving factors for SSR in northwest China (NWC) are “in cloud optical thickness of all clouds” (TAUTOT) (−0.26) and black carbon (BC) anthropogenic emissions (−0.21). TAUTOT (−0.39) and total precipitable water vapor (TQV) (−0.29) are the main influencing factors of SSR in the middle-lower Yangtze Plain (MYP). The main factors that influence SSR in southern China (SC) are surface pressure (PS) (−0.66) and AOD (−0.43). This research provides insights in understanding the variations of SSR and its relationships with anthropogenic conditions and meteorological factors.
1. Introduction
Solar radiation incident at the earth’s surface is the most important energy source for the environment, and has profound influences on the physical and biochemical processes including water cycle, climate change and plant photosynthesis [1]. Meanwhile, when solar radiation passes through the atmosphere, it undergoes radiation damping processes affected by geographical factors (latitude, longitude, and elevation, etc.), astronomical factors (solar zenith angle, etc.), atmospheric composition (aerosols, water vapor, ozone, etc.) [2,3], and human activities (anthropogenic emissions) between the atmosphere and the earth’s surface. The rapidly growing global demands for energy and the exhaustion of fossil energy have triggered more attention to the development of solar energy [4,5,6]. Therefore, an accurate and clear analysis of the spatial and temporal variations and driving factors of surface solar radiation (SSR) is vital to the optimized utilization of the solar energy resource.
Numerous studies have been carried out on the long-term variations of surface solar radiation (SSR, a synonym for “global solar radiation”) using SSR measurements at regional and global scales. These results revealed that a significant decadal transition on SSR have been observed around the world [7], with a decreased trend (“solar dimming”) since the 1950s, followed by an increased trend since the 1980s (“solar brightening”) [8,9,10,11,12]. Since the mid-1980s, the evidence for widespread increases in SSR at globally distributed stations (GEBA) has been further emphasized in the works by Gilgen et al. [13] and Ohmura [14]. Consistent with the global trend, the SSR records have demonstrated a similar transition of SSR in China [15,16,17]. Numerous studies had been conducted that revealed the variations of SSR in China using the data from ground SSR measurement stations at a national scale. For example, Liang et al. [18] calculated the trend of SSR from 1961 to 2000 in China using SSR records from 42 stations, and computed a decline rate of −0.52 Wm−2 yr−1. Che et al. [19] analyzed the average annual SSR in China from 1961 to 2000 at 64 stations. Qian et al. [15] pointed out that a decreasing trend of −0.31 Wm−2 yr−1 was found at 85 stations averaged in China from 1955 to 2000. Wang et al. [20] analyzed the trend of SSR over China using the data of 47 stations (1961–2013). The results indicated that the SSR values showed a decline trend (−0.83 ± 0.06 Wm−2 yr−1) during 1961–1989 and an increased trend (0.21 ± 0.07 Wm−2 yr−1) during 1990–2013. Although there have been many studies on SSR based on measurements, the universality of the results remains in doubt, due to poor density of the solar radiation stations.
In contrast with radiation measurement stations, the number of China Meteorological Administration (CMA) meteorological stations are up to the thousands. The meteorological measurements from CMA stations can be better used to estimate the long-term SSR with high density in China. The long-term trend of SSR (−0.23 Wm−2 yr−1) in China from 1961 to 2000 was calculated by [21], using the data from 456 stations based on a the Yang’s hybrid model, which suggested that the trend of SSR in China had reached a relatively stable state since 1990s and the increasing trend was not significant any more. Feng et al. [22] calculated the trend of SSR from 1980 to 2014 in China by using meteorological observation data from nearly 2400 stations and found a decline rate of −0.72 Wm−2 yr−1. However, these CMA stations are still too sparse to support solar energy research and applications in western China, especially in Tibet Plateau (TP).
Remote sensing can provide SSR products with high spatio-temporal continuity covering China, for example, the Global Energy and Water Cycle Experiment Surface Radiation Budget (GEWEX-SRB) [23] and the International Satellite Cloud Climatology Project Flux Data (ISCCP-FD) [24] can supply solar radiation records over China. Wu et al. [25] calculated the trend of SSR in China from 1984 to 2004 using GEWEX-SRB SSR products at the rate of −0.21 Wm−2 yr−1 during 1984–1994 and −0.50 Wm−2 yr−1 during 1994–2004. These global satellite products can provide long-term series of SSR records in China, but their spatial resolutions are too coarse to meet the requirements of practical applications such as site selection of solar power stations and design of heating systems. Recently, a high-resolution (5 km, 3 h) global SSR product of the Global Land Surface Satellite (GLASS) was released, but the dataset spanned only three years [26]. Tang et al. [27] constructed a high-resolution SSR (5 km, 1 h) dataset by combining MODIS and MTSAT data but it contained data spanning eight years. However, the uncertainty of global satellite SSR products is due to the lack of time-varying aerosol records and high-quality cloud data, which severely limit the development of long-term and high-resolution satellite SSR products.
Reanalysis products such as the Modern-Era Retrospective Analysis for Research and Applications (MERRA-2) and the European Centre for Medium-Range Weather Forecasts (ECMWF) fifth generation (ERA5) are alternative SSR data sources with acceptable accuracy and high spatial-temporal continuity covering China’s mainland. Compared with its predecessor MERRA, the Modern-Era Retrospective Analysis for Research and Applications, version 2 (MERRA-2) provides several improvements to the representation of the stratosphere and improved representations of cryospheric processes [28]. However, the spatial resolution of MERRA-2 is coarser than ERA5. ERA5 is the latest global atmospheric reanalysis produced by the European Centre for Medium-Range Weather Forecasts (ECMWF) with a resolution of 10 km, 3 h. Compared to ERA-Interim, the representation of atmospheric processes in ERA5 has been further improved [29]. However, neither satellite retrievals nor reanalysis can accurately reproduce the decadal variations of SSR in China [20], which highlights the importance of spatial and temporal coverage of datasets and data quality control. Tang et al. [30] produced a long-term (1983–2017) SSR dataset with high spatial and temporal resolution (10 km, 3 h) to analyze the variations of SSR in China based on new ERA5 reanalysis data and the International Satellite Cloud Climatology Project (ISCCP) HXG cloud products. The accuracy of the SSR dataset constructed by [30] was generally better than the other global satellite SSR products, such as the Earth’s Radiant Energy System (CERES), the global energy and water cycle experiment surface radiation budget (GEWEX-SRB), and the ISCCP flux dataset (ISCCP-FD), and therefore, this SSR dataset could be used to analyze the variations of SSR over China and its causes in a more refined spatio-temporal scale.
Exploring driving factors of SSR is the basis of a comprehensive understanding of its variations [31]. In China, Xia et al. [32] indicated that aerosol kept an increasing trend during 1960–1980, especially in southeast China, and speculated that this increase could account for part of decrease in SSR over China. Wang et al. [33] found that aerosol concentrations had a significant influence on the variability of SSR. However, Lin et al. [34] demonstrated that the aerosol direct effect could only explain 20% of the decadal variations of SSR over China. Tang et al. [35] pointed out that the aerosol direct effect could not fully explain the annual variability of SSR over China during 1980–2010. The variations of SSR in China were likely caused by cloud characteristics and interaction with aerosols. Clouds can influence the transmission of solar radiation through the atmosphere and regulate the energy balance of the whole earth’s atmosphere system [36]. Aerosols and clouds, as well as water vapor also have a strong absorption effect on solar short wave radiation [1]. At the same time, water vapor can indirectly affect SSR by generating and influencing clouds. Yang et al. [37] found that an increase in water vapor contributed to a large-scale dimming over China from 1985 to 2000.
In this research, we attempt to analyze the variations of the SSR in China using a high-resolution SSR dataset and explore the dominant driving forces behind the spatial and temporal variations of SSR in different regions of China from 1984 to 2016, avoiding a “one size fits all” approach. The dataset of high-resolution and quality global SSR was used to analyze the variation of SSR in China. We also discussed the differences of long-term variations of China and the TP using various data sources in this research, and briefly analyzed the reasons for the different results.
In Section 2, we introduce the processing methods, the data setup used, and the theoretical knowledge in detail. In Section 3, we present the results and analysis. In Section 4, we summarize different studies on the variation of SSR in China and TP, and briefly analyze the reasons for the different results, and in Section 5, we provide a summary of the most important conclusions of this research.
2. Materials and Methods
2.1. Place and Data
2.1.1. Place
China is located at 73°33′E–135°05′E, 3°51′N–53°33′N with a total land area of 9.6 million square meters, which is a vast and complex terrain. Therefore, SSR showed a significant spatial difference in China. According to the ecological geographical division of China and the nine agricultural divisions of China provided by the Resource and Environment Science and Data Center of Chinese Academy of Sciences (http://www.resdc.cn/), we divided China’s mainland into different climatic regions (Figure 1), including northeast China (NEC), northwest China (NWC), Inner Mongolia (IM), Tibet Plateau (TP), North China (NC), Loess Plateau (LP), middle-lower Yangtze Plain (MYP), Sichuan and surrounding regions (SBS), Yunnan Plateau and surrounding regions (YPS), and southern China (SC).
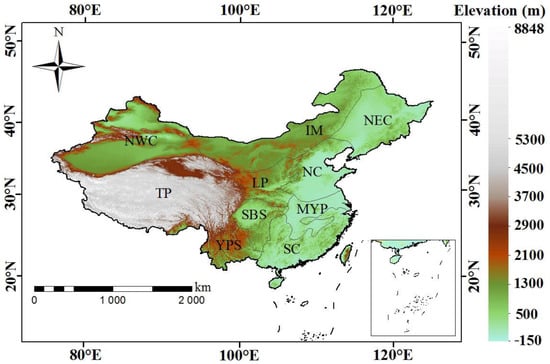
Figure 1.
The climate regions and topographic features of China.
2.1.2. Data
Two types of data were used in this research. The first was the “dataset of high-resolution (3 h, 10 km) global surface solar radiation”, which was constructed by Tang et al. [30] and provided by the National Tibetan Plateau Data Center (http://data.tpdc.ac.cn). This dataset was used to reveal the spatial and temporal variability of the SSR in China from 1984 to 2016. The accuracy of this dataset was generally better than the SSR products of ISCCP-FD, GEWEX-SRB, and CERES. The second was the MERRA-2 monthly mean atmospheric aerosols, meteorological conditions (in cloud optical thickness of all clouds (TAUTOT), total precipitable water vapor (total precipitable water vapor (TQV)) and surface pressure (PS)) and anthropogenic emission (SO2EMAN, SO4EMAN, OCEMAN, and BCEMAN) from 1984 to 2016, which were used to analyze the relationship among the driving factors and SSR. MERRA-2 was provided by the National Aeronautics and Space Administration (NASA) and global modeling and assimilation Office (GMAO) for the satellite age with a spatial resolution of 0.5° × 0.625° (latitude × longitude) [28], which covered satellite observations from 1980 to the present. Detailed information on all the datasets is displayed in Table 1.

Table 1.
Description of the datasets used in this research.
2.2. Methodology
The spatial and temporal variations of SSR, meteorological conditions, and anthropogenic emissions from 1984 to 2016 over China’s mainland were calculated using the Mann–Kendal trend test (MK) and Sen’s slope method.
The MK trend test method is a nonparametric statistical test applied to hydrometeorology, which is used to test the trend of long-term series data [38]. This method assumes that the data time series has a monotonic increase or decrease, and it does not need to follow a certain distribution.
For long time series Xi, i = 1, 2, 3, 4, …, i, …, j, …, n, , the test statistic s is defined as:
where s is a normal distribution. When s is a positive number, it indicates an upward trend, a negative number indicates a downward trend, and a zero value indicates no change in trend. The variance of s is calculated by the following formula:
Finally, Z is calculated to evaluate the significance of the temporal trend of the data time series as:
where positive and negative values of Z indicate increasing trend and decreasing trend, respectively. When the absolute value of Z is greater than 1.28, 1.64, and 2.32, it means that it has passed the significance test with a confidence of 90%, 95%, and 99%, respectively.
The Sen’s slope is used to calculate the time trend of data time series data [39]. The Sen’s slope is the median value of the data time series data, which can reduce the interference of noise. It can be calculated by the following formula:
The calculation of Q is:
Xj, Xk are the values of X at times j and k, respectively (j > k). When there is only one group of time series, N = n(n − 1)/2; when there are multiple groups of time series, N < n(n − 1)/2.
The linear correlation is a statistical analysis method, which was used to calculate the statistical relationships among SSR and the driving factors in this research. For two groups of meteorological elements X1, X2, …, Xn and Y1, Y2, …, Yn, the calculation formula of correlation coefficient rxy is as follows [40]:
3. Results
3.1. Trends of Surface Solar Radiation (SSR) over China
The annual average variability of SSR over China from 1984 to 2016 is shown in Figure 2 and Figure 3. The monthly average SSR values over China gradually increased from January to July, but decreased from August to December, due to the seasonal changes of the solar zenith angle in China [41]. The monthly average SSR values in China from January to December are 101.44 Wm−2, 128.17 Wm−2, 165.80 Wm−2, 204.1 Wm−2, 228.50 Wm−2, 233.89 Wm−2, 235.02 Wm−2, 216.68 Wm−2, 184.49 Wm−2, 147.70 Wm−2, 114.68 Wm−2, and 95.65 Wm−2, respectively. The SSR values show a gradual decreasing trend from western China to eastern China. The highest annual average values of SSR occurs in TP (about 222.01 Wm−2), because of the weak radiation dumping processes there. TP is always the highest-value region of SSR, with the range of monthly mean SSR values of 141.02–286.07 Wm−2. NWC and IM are also areas with high SSR values, because of the relatively dry air conditions in western China. The annual average SSR values in NWC and IM are 193.27 and 181.96 Wm−2, respectively. It should be noted that in NWC and IM, the SSR values change dramatically in winter and summer, with relatively high SSR values in summer, and relatively low SSR values in winter. The ranges for the monthly average SSR values in NWC and IM are 281.88–86.64 Wm−2 and 267.70–75.30 Wm−2, respectively, whereas relatively lower annual SSR values were found in SBS (132.44 Wm−2) and MYP (150.05 Wm−2), owing to the frequent cloud cover and abundant precipitation there. The ranges for the monthly average SSR values in SBS and MYP are 210.90–70.36 Wm−2 and 210.23–88.13 Wm−2, respectively. NEC is also an area with low annual SSR values (161.20 Wm−2) with monthly radiation in the range of 238.06–65.99 Wm−2, owing to the fact that NEC lies in a high latitude area and the surface receives weaker solar radiation.
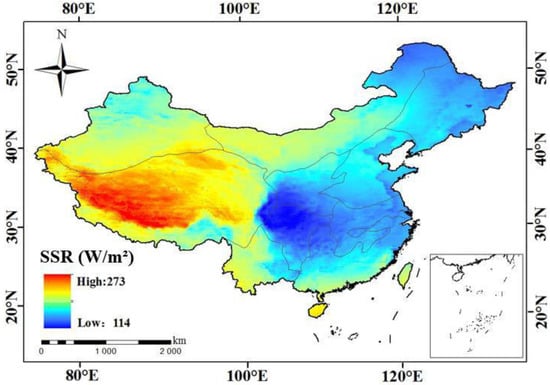
Figure 2.
The annual average spatial distribution of surface solar radiation (SSR) over China from 1984 to 2016.
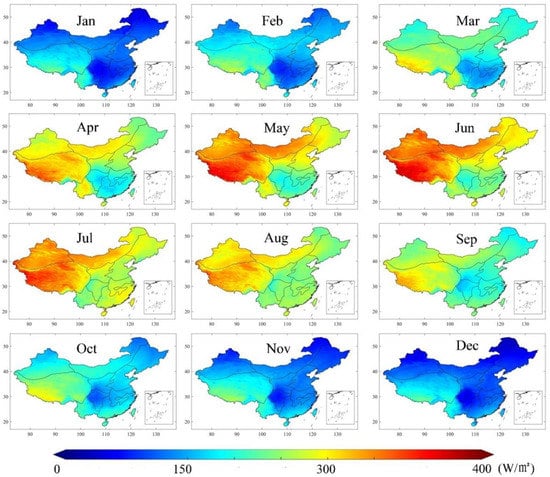
Figure 3.
Monthly average spatial distribution of SSR over China from 1984 to 2016.
The spatial variations of SSR in China during 1984–2016 are shown in Figure 4. A significant decline trend was found in SC, MYP, SBS, and YPS. The Sen’s slope values for SC, MYP, SBS, and YPS are −0.822, −0.714, −0.637, and −0.579, respectively, while the MK values are −3.722, 3.971, −3.950, and −3.607, respectively. The decline trend of SSR in NC and LP are also significant with Sen’s slope values of −0.449 and −0.340, respectively and MK values of −3.812 and−2.672, respectively. This result is related to the rapid urbanization in these areas with higher air pollutant, i.e., the emissions into the atmospheric environment from human activities, resulting in more attenuation of solar radiation. Slightly negative trends of SSR are found in NEC, NWC, and IM, with Sen’s slope values of −0.155, −0.160, and −0.104, respectively and MK values of −1.652, −1.225, and −1.135, respectively. The SSR values in TP also show a decline trend, to a certain extent, with Sen’s slope and MK values of −0.250 and −1.872, respectively.
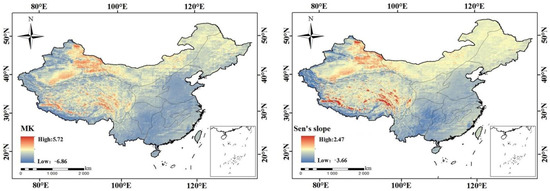
Figure 4.
The Mann–Kendal trend test (MK) and Sen’s slope for SSR over China from 1984 to 2016.
The stated trends of the averaged SSR in China from 1984 to 2016 are illustrated in Figure 5a. During the entire research period (1984–2016), there is a slightly negative trend (−0.371 Wm−2 yr−1), with annual average SSR values of 171.74–190.92 Wm−2. Averaged over the China’s mainland, the SSR decreases from 1984 to 1992 at a rate of around −2.168 Wm−2 yr−1, then, increases from 1993 to 1999 with a rate of around 0.569 Wm−2 yr−1, then, decreases from 2000 to 2008 at a rate of around −0.370 Wm−2 yr−1, and then decreases after 2008 with a rate of around −0.191 Wm−2 yr−1. As seen in Figure 5a, low SSR is shown in 1992 (173.94 Wm−2), corresponding to the Pinatubo eruption, in June 1991, over the Filipinas Islands [42]. This volcanic eruption released a large amount of smoke and ash into the atmosphere, resulting in the rise in aerosol particle concentration. Volcanic aerosols presented a significant influence on SSR for a few years, after the eruption. Although the effect of a volcanic eruption on SSR disappears in a few years, the long-term trend of SSR may not change [8,43]. The “solar brightening” was similar in most countries of the world from 1990 to 2000. However, after 2000s, the values of SSR in China began to decrease gradually. This can largely be explained by the rapidly growing sulfur emissions in Asia that exceeded those of western countries [44]. It is worth noting that SSR dropped to a low value in 2003, which may be due to the Popocatepetl volcano, in 2003, which erupted three times on that day, with intense activity in Mexico. This decline trend of SSR did not persist, but it was transformed into a weak “solar brightening” in 2008, which could be related to the 2008 Olympic Games in Beijing, when a series of energy conservation and emission reduction policies were advocated [45].
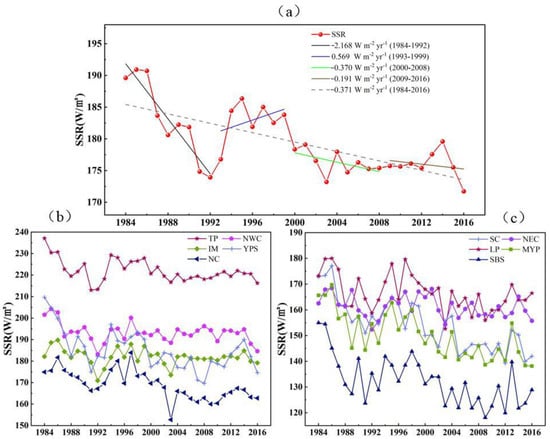
Figure 5.
(a) Stated trend analysis of SSR over China from 1984 to 2016; (b,c) Temporal trends of SSR in ten typical regions from 1984 to 2016.
The SSR values in different climatic regions of China show a decline trend from 1984 to 2016 (Figure 5b,c), which is similar to the trends of SSR over China’s mainland. SSR in the different climatic regions decreases from 1984 to 1992, but increased from 1993 to 1999. During 2000–2008, much of China showed a decline trend, except for NWC (0.394 Wm−2 yr−1) and IM (0.017 Wm−2 yr−1) that presented a weak increase. We found that some regions showed a decreasing trend; only LP, SBS, SC, and MYP showed an increasing trend in 2013–2016.
3.2. Factor Analysis of the Long-Term Variability of SSR
The annual variations of meteorological conditions (aerosol optical depth (AOD), TAUTOT, TQV, and PS) and SSR from 1984 to 2016 are illustrated in Figure 6a. SSR decreased during 1988–1992, the corresponding AOD declined weakly from 1984 to 1988, and rapidly increased from 1988 to 1992, reaching a peak value of 0.36 in 1992, which was due to the eruption of the Pinatubo volcano in 1991 [46]. This means the role of various nature factors cannot be underestimated. The temporal variation of TAUTOT, TQV, and PS fluctuated smoothly, therefore, the variation of AOD may be the main factor of SSR change from 1992 to 1999. With “population grow” and rapid economic development in China [4], the annual average AOD values rose from 0.25 (in 2000) to 0.32 (in 2007). Significantly, the AOD increased rapidly to a high value, on the contrary, SSR decreased to a low value. This may be due to the Popocatepetl volcano that erupted in 2003, erupting three times on that day with intense activity. The AOD fluctuated slightly from 2008 to 2016 and it showed a decline trend. Meanwhile, the increasing trends of four anthropogenic emissions were curbed in 2005 (Figure 6b). Therefore, the values of SSR maintained a stable and slightly increasing trend during 2005–2014, but the SSR values began to decline again in 2015, a fact that may be due to the growth of TAUTOT and TQV during 2013–2016. Furthermore, the fluctuation of PS was not significant from 1984 to 2016, with annual average PS values from 832.43 hpa (in 1984) to 834.34 hpa (in 2016).
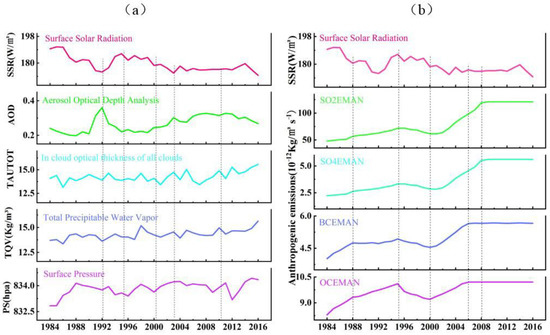
Figure 6.
Annual variations of driving factors in China from 1984 to 2016. (a) Meteorological conditions; (b) Anthropogenic emissions.
With the rapid development of the global economy, human activities increasingly release micro particles and greenhouse gases into the atmosphere, which, in turn, gradually change the climate trend and energy flow in the atmosphere [31,47]. The temporal trends of anthropogenic emissions (SO2, SO4, BC, and OC) and SSR from 1984 to 2016 are illustrated in Figure 6b. During 1984–1995, the emissions of four pollutants maintained an increasing trend, corresponding to the decline trends in SSR. The over-increased trends of anthropogenic emissions were controlled in 2005. The Chinese government issued a series of laws and regulations. A quantitative emission control target on SO2 emissions was put in effect by the 11th 5-Year Plan of China (http://www.gov.cn), in 2006, and it is the most influential regulation.
At the same time, the annual correlation coefficients among SSR and the driving factors were calculated in this research. We found that AOD had a cardinal role in the variations of SSR during 1984–2016 with a significant correlation (−0.75). The result indicates that changes in aerosol loading were the main cause for the variations of SSR in China, Similar conclusions have been shown by [16,48]. Correlations among the four pollutants anthropogenic emission and SSR was also high with r values of −0.71 (SO2), −0.73 (SO4), −0.62 (OC), and −0.62 (BC), respectively. This result demonstrates that the impact of human activities on SSR is not negligible and also has profound influence.
As shown in Table 2, AOD and SSR show opposite trends in China. There was an increasing trend of AOD, and more significantly, NC (0.0094), SBS, and SC were also areas with significant increased trend (0.0093). However, lower Sen’s slope values of AOD were found in IM and NWC, i.e., 0.0004 and 0.0007, respectively. Compared with other regions, the trend of meteorological conditions and anthropogenic emissions were not found to be significant in IM and NWC, corresponding to the weakly decreased trend of SSR. The Sen’s slope of TAUTOT showed a significant increased trend in TP (0.0702), while the increasing trend of BC, OC, SO4, and SO2 were the smallest in TP, but the trend of SSR decreased to some extent. The reason is probably due to the high-altitude plateau terrain, the low population density, and the infrequent industrial activities in TP. The other reason is that the TAUTOT growth might account for a decline in SSR in TP [49]. TQV showed an increased trend over China; the highest Sen’s slope of TQV was found in SC (0.0598). The reason may be that SC lies in the subtropical monsoon climate zone with frequent rain and cloudy weather. High Sen’s slope values of BC are observed in the NC, SBS, MYP, i.e., 0.185 × 10⁻¹², 0.142 × 10⁻¹², and 0.127 × 10⁻¹², respectively. Similarly, high Sen’s slope values of OC are also observed in the NC, SBS, and MYP, i.e., 0.155 × 10⁻¹², 0.142 × 10⁻¹², and 0.129 × 10⁻¹², respectively. A significant spatial correlation exists between the mass concentrations of BC and OC. The increase trends of BC and OC have spatially similar aggregation characteristics. Eastern China is the main emissions area of SO2 and SO4 [50]. Thus, NC is the area with significant increasing trends of SO2 and SO4. The Sen’s slopes of SO2 and SO4 are 0.444 × 10⁻¹² and 0.096 × 10⁻¹² in NC, respectively. Therefore, we found that SSR decreased faster in areas with a significant increase in anthropogenic emissions.
Table 2.
The Sen’s slopes of SSR and driving factors in different regions of China.
As shown in Figure 7, the results revealed that the AOD was the dominant factor of SSR over NEC with r values of −0.65, followed by BC (−0.51) and OC (−0.48). The large amount of coal burning in the northeast industrial base and the population concentration in NEC, as well as this region has become a high energy consumption area, leads to more pollutant emissions. Although the content of BC in the atmosphere is small, it has a strong light absorption capacity, because it can absorb short wave radiation and release long wave radiation [51]. Meanwhile, OC can directly affect and reduce visibility by scattering light, and indirectly affect the radiation balance by absorbing some hygroscopic chemical components [52]. The TAUTOT and BC had a certain impact on the variation of SSR in NWC, because in these remote areas the air is relatively clean; therefore, a change in cloud characteristics would affect SSR budget of the region [47]. Furthermore, biomass burning has become the main fuel over NWC, the biomass combustion has a greater contribution to the emission of black carbon, which greatly contributes to BC emissions; BC has a strong absorption of solar radiation in the earth’s atmosphere.
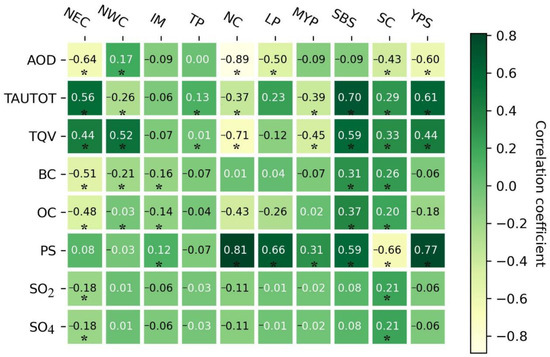
Figure 7.
Correlations among various driving factors and spatial trend of SSR in different regions of China (* statistically significant result at the 5% significance level).
The correlations among SSR and various factors was found to be relatively low in TP. TP is characterized by high altitude and high atmospheric transmittance, which result in lower solar radiation attenuation. The AOD had a considerable effect on SSR in NC with r values of −0.89, owing to the strong aerosol radiative forcing effect. The AOD and OC played dominant roles in LP, with r values of −0.50 and −0.26, respectively. It is particularly noteworthy that coal mining in LP has led to a high number dioxide aerosol particles in this area. The main driving factors for the variation of SSR in the MYP have been found to be TAUTOT and TQV with r values of −0.39 and −0.29, respectively. MYP is located in the subtropical monsoon climate area, resulting in frequent rain and freezing weather. The principal factors for the variations of SSR in SC were PS and AOD with r values of −0.66 and −0.43, respectively. The main influencing factor of YPS was AOD with r values of −0.60. YPS has a mountain terrain with low wind speed, factors that are opposed to diffusion of pollutants in this region.
4. Discussion
The annual variations of SSR in China obtained by scholars using various data sources in different time periods is shown in the Table 3. Liang et al. [18] calculated the trend of SSR from 1961 to 2000 using the SSR records at 42 radiation stations in China and found a decline rate of −0.52 Wm−2 yr−1. Che et al. [19] analyzed the annual average SSR values from 1961 to 2000 in China and found a decline trend of −0.45 Wm−2 yr−1 at 64 radiation stations. Yang et al. [37] analyzed the interannual variations of SSR in China during 1958–1999 and 1985–2016 through data from 95 radiation stations, with the decline rate of −0.74 ± 0.04 Wm−2 yr−1 and −0.49 ± 0.03 Wm−2 yr−1, respectively. Tang et al. [21] calculated the trend of SSR over China at −0.23 Wm−2 yr−1 from 1961 to 2000. At the same time, Wu et al. [25] calculated the trend of SSR in China during 1984–1994 and 1994–2004 by using satellite SSR products. Feng et al. [22] used the meteorological data from nearly 2400 meteorological stations and reanalysis data to analyze the changes of SSR in China from 1980 to 2014 and found a trend of −0.72 and −0.87 Wm−2 yr−1, respectively. The SSR trend calculated by different data sources is slightly different. In this research, we calculated that the trend of SSR in China from 1984 to 2016 was −0.371 Wm−2 yr−1. The result is much lower than that from reanalysis data.
Table 3.
Primary results of different scholars on the variations in SSR over China.
The above results show different trends of SSR over China. Satellite-derived SSR products have good global coverage but may be affected by undetected low clouds, sensor calibration, and changes of satellites [53]. Furthermore, the reanalysis seems to overestimate the trend of the multiyear SSR over China. Therefore, it is of vital importance to select high-resolution SSR data to research the trend of SSR in China.
The annual variation of SSR in TP obtained by scholars using different data in different time periods are shown in Table 4. Because of the sparse distribution of radiation stations in TP, meteorological data were widely used to analyze the changes of SSR in TP. Tang et al. [21] found a significant transition from “brightening” to “dimming” in 1978 over TP, which was different from the trend in China during this period. An increasing trend about 0.17 ± 0.19 Wm−2 yr−1 was found over the TP during 1961–1978. You et al. [54] investigated the variations of SSR at TP between 1960 and 2009 based on radiation observational data, reanalysis data (NCEP/NCAR), and ensemble simulations with the global climate model ECHAM5-HAM, and found SSR trends of −0.10, 0.11, and −0.054 Wm−2 yr−1, respectively. Reanalysis data seem to accurately capture the decadal variability of SSR, due to missing records of aerosols in the reanalysis assimilation model. Tang et al. [55] calculated the trend of SSR over TP during 1961–1978 (0.035 Wm−2 yr−1) and during 1978–2010 (−0.22 Wm−2 yr−1) using data from 96 CMA stations; these results were in general agreement with the conclusion of Tang et al. [21]. However, we calculated that the trend of SSR in TP was −0.25 Wm−2 yr−1 from 1984 to 2016, which was smaller than the conclusion of [55]. The reason a “dimming” started in TP around 1978 is still unclear. Some scholars have pointed that it was related to the increased local aerosol emissions [15,56]. However, Tang et al. [21] thought that aerosol loads were very low in the TP, indicating that cloud changes might have contributed altering solar radiation. Meanwhile, Yang et al. [57] used ground radiation observations to evaluate the performance of different satellite radiation products in TP. The results showed that the differences between high-resolution and coarse-resolution satellite products were usually larger in highly variable terrain (for example, the Himalayas), and the errors of satellite products were spatially dependent. Using satellite data to analyze the variation of SSR in TP causes a large error, which is produced by neglecting elevation effects [58].
Table 4.
Primary results of different scholars on the variations in SSR over TP.
5. Conclusions
In this research, we revisited the spatio-temporal variation of SSR across China and revealed the effects of the meteorological conditions and anthropogenic emissions on the long-term variations of SSR. The SSR in China showed a decreasing trend from 1984 to 2016 with a decline rate of −0.371 Wm−2 yr−1. The transition from “solar dimming” to “solar brightening” in China was significant, i.e., the SSR values decreased by a rate of around −2.168 Wm−2 yr−1 from 1984 to 1992, and then showed a significant increased trend during 1993–1999 with a rate of around 0.569 Wm−2 yr−1. Additionally, the SSR values decreased again from 2000 to 2008 at a rate of around −0.370 Wm−2 yr−1, and finally declined by a rate of around −0.191 Wm−2 yr−1 after 2008. The average SSR values showed a gradually decreasing trend from the west to the east of China. The highest annual average value of SSR occurred in TP (about 222.01 Wm−2), and the lowest annual average values of SSR occurred in SBS (132.44 Wm−2).
The AOD played a dominant role in inducing the variations of SSR at an annual scale (r = −0.75). The results revealed that regions dominated by AOD, such as NEC, NC, and LP, were generally characterized by large populations, concentrated industrial bases, rapid urban development, and traces of large amounts of coal burning. The AOD was the main influencing factor on SSR in NEC, YPS, NC, and LP with r values of −0.64, −0.60, −0.89, and −0.50, respectively. The topography of YPS makes it difficult for pollutants to diffuse. The main driving factors for SSR in NWC are TAUTOT and BC, due to the remoteness of these areas where the air is relatively clean, and the minimal changes on cloud characteristics affect the variation of SSR. Meanwhile, biomass combustion is also common in NWC. The main influencing factors of SSR in MYP were TAUTOT and TQV, with r values of −0.39 and −0.29, respectively. Because MYP has a subtropical climate, the climate leads to frequent cloud cover as well as abundant water vapor, which has an attenuation effect on SSR.
We have preliminarily discussed the spatial and temporal variation of SSR and its driving factors, but the data used in this research cannot fully simulate the real atmospheric situation and the selected driving factors are not comprehensive enough. The mechanisms among SSR and driving factors are relatively complex, which still needs to be further studied together with other air molecules to make a more comprehensive spatial and temporal analysis of SSR.
Author Contributions
H.F. and W.Q. designed the research; H.F. and X.Y. performed the experiments and analyzed the data; H.F. wrote the manuscript; L.W., M.Z. and W.Q. revised the manuscript. All authors have read and agreed to the published version of the manuscript.
Funding
This work was financially supported by National Natural Science Foundation of China (no. 42001016), the Special Fund for Basic Scientific Research of Central Colleges, China University of Geosciences, Wuhan (no. 111-162301182738).
Data Availability Statement
The data presented in this study are available on request from the corresponding author. The “global high-resolution surface solar radiation dataset” is provided by National Tibetan Plateau Data Center (http://data.tpdc.ac.cn).
Acknowledgments
We are grateful to the National Tibetan Plateau Data Center (http://data.tpdc.ac.cn) for providing the “global high-resolution surface solar radiation dataset” and NASA GMAO for providing the MERRA-2 dataset.
Conflicts of Interest
The authors declare no conflict of interest.
References
- Wild, M. Global dimming and brightening: A review. J. Geophys. Res. 2009, 114, D00D16. [Google Scholar] [CrossRef]
- Bilbao, J.; Román, R.; Miguel, A. Turbidity coefficients from normal direct solar irradiance in Central Spain. Atmos. Res. 2014, 143, 73–84. [Google Scholar] [CrossRef]
- Bilal, M.; Nichol, J.E.; Bleiweiss, M.P.; Dubois, D. A Simplified high resolution MODIS Aerosol Retrieval Algorithm (SARA) for use over mixed surfaces. Remote Sens. Environ. 2013, 136, 135–145. [Google Scholar] [CrossRef]
- Qin, W.; Wang, L.; Lin, A.; Zhang, M.; Xia, X.; Hu, B.; Niu, Z. Comparison of deterministic and data-driven models for solar radiation estimation in China. Renew. Sustain. Energy Rev. 2018, 81, 579–594. [Google Scholar] [CrossRef]
- Wang, L.; Lu, Y.; Zou, L.; Feng, L.; Wei, J.; Qin, W.; Niu, Z. Prediction of diffuse solar radiation based on multiple variables in China. Renew. Sustain. Energy Rev. 2019, 103, 151–216. [Google Scholar] [CrossRef]
- Jacovides, C.P.; Tymvios, F.S.; Assimakopoulos, V.D.; Kaltsounides, N.A. Comparative study of various correlations in estimating hourly diffuse fraction of global solar radiation. Renew. Energy 2006, 31, 2492–2504. [Google Scholar] [CrossRef]
- Kambezidis, H.D.; Kaskaoutis, D.G.; Kharol, S.K.; Moorthy, K.K.; Satheesh, S.K.; Kalapureddy, M.C.R.; Badarinath, K.V.S.; Sharma, A.R.; Wild, M. Multi-decadal variation of the net downward shortwave radiation over south Asia: The solar dimming effect. Atmos. Environ. 2012, 50, 360–372. [Google Scholar] [CrossRef]
- Wild, M.; Gilgen, H.; Roesch, A.; Ohmura, A.; Long, C.N.; Dutton, E.G.; Forgan, B.; Kallis, A.; Russak, V.; Tsvetkov, A. From dimming to brightening: Decadal changes in solar radiation at Earth’s surface. Science 2005, 308, 847–850. [Google Scholar] [CrossRef]
- Pinker, R.T.; Zhang, B.; Dutton, E.G. Do satellites detect trends in surface solar radiation? Science 2005, 308, 850. [Google Scholar] [CrossRef]
- Stanhill, G. Global dimming: A new aspect of climate change. Weather 2005, 60, 11–14. [Google Scholar] [CrossRef]
- Stanhill, G.; Cohen, S. Global dimming: A review of the evidence for a widespread and significant reduction in global radiation with discussion of its probable causes and possible agricultural consequences. Agric. Meteorol. 2001, 107, 255–278. [Google Scholar] [CrossRef]
- Stanhill, G. Solar Irradiance, air pollution and temperature changes in the Arctic. Philos. Trans. R. Soc. A Math. Phys. Eng. Sci. 1995, 352, 247–258. [Google Scholar]
- Gilgen, H.; Roesch, A.; Wild, M.; Ohmura, A. Decadal changes in shortwave irradiance at the surface in the period from 1960 to 2000 estimated from Global Energy Balance Archive Data. J. Geophys. Res. Atmos. 2009, 114, D00D08. [Google Scholar] [CrossRef]
- Ohmura, A. Observed long-term variations of solar irradiance at the Earth’s surface. In Solar Variability and Planetary Climates; Calisesi, Y., Bonnet, R.M., Gray, L., Langen, J., Lockwood, M., Eds.; Springer: New York, NY, USA, 2007; pp. 111–128. [Google Scholar] [CrossRef]
- Qian, Y.; Kaiser, D.P.; Leung, L.R.; Xu, M. More frequent cloud-free sky and less surface solar radiation in China from 1955 to 2000. Geophys. Res. Lett. 2006, 33. [Google Scholar] [CrossRef]
- Wang, K.C.; Dickinson, R.E.; Wild, M.; Liang, S. Atmospheric impacts on climatic variability of surface incident solar radiation. Atmos. Chem. Phys. 2012, 12, 9581–9592. [Google Scholar] [CrossRef]
- He, Y.; Wang, K.; Zhou, C.; Wild, M. A Revisit of Global Dimming and Brightening Based on the Sunshine Duration. Geophys. Res. Lett. 2018, 45, 4281–4289. [Google Scholar] [CrossRef]
- Liang, F.; Xia, X.A. Long-term trends in solar radiation and the associated climatic factors over China for 1961–2000. Ann. Geophys. 2005, 23, 2425–2432. [Google Scholar] [CrossRef]
- Che, H.Z.; Shi, G.Y.; Zhang, X.Y.; Arimoto, R.; Zhao, J.Q.; Xu, L.; Wang, B.; Chen, Z.H. Analysis of 40 years of solar radiation data from China, 1961–2000. Geophys. Res. Lett. 2005, 32. [Google Scholar] [CrossRef]
- Wang, Y.; Wild, M. A new look at solar dimming and brightening in China. Geophys. Res. Lett. 2016, 43. [Google Scholar] [CrossRef]
- Tang, W.; Yang, K.; Qin, J.; Cheng, C.C.K.; He, J. Solar radiation trend across China in recent decades: A revisit with quality-controlled data. Atmos. Chem. Phys. 2011, 11, 393–406. [Google Scholar] [CrossRef]
- Feng, F.; Wang, K.C. Determining Factors of Monthly to Decadal Variability in Surface Solar Radiation in China: Evidences From Current Reanalyses. J. Geophys. Res. Atmos. 2019, 124, 9161–9182. [Google Scholar] [CrossRef]
- Pinker, R.T.; Laszlo, I. Modeling surface solar Irradiance for satellite spplications on a global scale. J. Appl. Meteorol. Clim. 1992, 31, 194–211. [Google Scholar] [CrossRef]
- Zhang, Y.; Rossow, W.B.; Lacis, A.A.; Oinas, V.; Mishchenko, M.I. Calculation of radiative fluxes from the surface to top of atmosphere based on ISCCP and other global data sets: Refinements of the radiative transfer model and the input data. J. Geophys. Res. Atmos. 2004, 109. [Google Scholar] [CrossRef]
- Wu, F.; Fu, C. Assessment of GEWEX/SRB version 3.0 monthly global radiationdataset over China. Meteorol. Atmos. Phys. 2011, 112, 155. [Google Scholar] [CrossRef]
- Zhang, X.; Liang, S.; Zhou, G.; Wu, H.; Zhao, X. Generating global land surface satellite incident shortwave radiation and photosynthetically active radiation products from multiple satellite data. Remote Sens. Environ. 2014, 152, 318–332. [Google Scholar] [CrossRef]
- Tang, W.; Qin, J.; Yang, K.; Liu, S.; Lu, N.; Niu, X. Retrieving high-resolution surface solar radiation with cloud parameters derived by combining MODIS and MTSAT data. Atmos. Chem. Phys. 2016, 16, 2543–2557. [Google Scholar] [CrossRef]
- Gelaro, R.; McCarty, W.; Suarez, M.J.; Todling, R.; Molod, A.; Takacs, L.; Randles, C.; Darmenov, A.; Bosilovich, M.G.; Reichle, R.; et al. The Modern-Era Retrospective Analysis for Research and Applications, Version 2 (MERRA-2). J. Clim. 2017, 30, 5419–5454. [Google Scholar] [CrossRef]
- Hoffmann, L.; Günther, G.; Li, D.; Stein, O.; Wu, X.; Griessbach, S.; Heng, Y.; Konopka, P.; Müller, R.; Vogel, B.; et al. From ERA-Interim to ERA5: The considerable impact of ECMWF’s next-generation reanalysis on Lagrangian transport simulations. Atmos. Chem. Phys. 2019, 19, 3097–3124. [Google Scholar] [CrossRef]
- Tang, W.; Yang, K.; Qin, J.; Li, X.; Niu, X. A 16-year dataset (2000–2015) of high-resolution (3 h, 10 km) global surface solar radiation. Earth Syst. Sci. Data 2019, 11, 1905–1915. [Google Scholar] [CrossRef]
- Ramanathan, V.; Crutzen, P.J.; Kiehl, J.T.; Rosenfeld, D. Aerosols, climate, and the hydrological cycle. Science 2001, 294, 2119. [Google Scholar] [CrossRef]
- Xia, X.A.; Wang, P.C.; Chen, H.B.; Liang, F. Analysis of downwelling surface solar radiation in China from National Centers for Environmental Prediction reanalysis, satellite estimates, and surface observations. J. Geophys. Res. Atmos. 2006, 111. [Google Scholar] [CrossRef]
- Wang, K.; Dickinson, R.E.; Liang, S. Clear sky visibility has decreased over land globally from 1973 to 2007. Science 2009, 323, 1468. [Google Scholar] [CrossRef] [PubMed]
- Lin, C.; Yang, K.; Huang, J.; Tang, W.; Qin, J.; Niu, X.; Chen, Y.; Chen, D.; Lu, N.; Fu, R. Impacts of wind stilling on solar radiation variability in China. Sci. Rep. 2015, 5, 15135. [Google Scholar] [CrossRef] [PubMed]
- Tang, W.; Yang, K.; Qin, J.; Niu, X.L.; Lin, C.G.; Jing, X.W. A revisit to decadal change of aerosol optical depth and its impact on global radiation over China. Atmos. Environ. 2017, 150, 106–115. [Google Scholar] [CrossRef]
- Liepert, B.G. Recent changes in solar radiation under cloudy conditions in Germany. Int. J. Clim. 1997, 17, 1581–1593. [Google Scholar] [CrossRef]
- Yang, S.; Wang, X.L.; Wild, M. Causes of dimming and brightening in China inferred from homogenized daily clear-sky and all-sky in situ surface solar radiation records (1958–2016). J. Clim. 2019, 32, 5901–5913. [Google Scholar] [CrossRef]
- Weatherhead, E.C.; Reinsel, G.C.; Tiao, G.C.; Meng, X.-L.; Choi, D.; Cheang, W.-K.; Keller, T.; DeLuisi, J.; Wuebbles, D.J.; Kerr, J.B.; et al. Factors affecting the detection of trends: Statistical considerations and applications to environmental data. J. Geophys. Res. Atmos. 1998, 103, 17149–17161. [Google Scholar] [CrossRef]
- Sen, P.K. Estimates of the regression coefficient based on Kendall’s Tau. J. Am. Stat. Assoc. 1968, 63, 1379–1389. [Google Scholar] [CrossRef]
- Kendall, M.G. A new measure of rank correlation. Biometrika 1938, 30, 81–93. [Google Scholar] [CrossRef]
- Fröhlich, C. Variability of the solar “constant” on time scales of minutes to years. J. Geophys. Res. Atmos. 1987, 92, 796–800. [Google Scholar] [CrossRef]
- Nagel, D.; Herber, A.; Thomason, L.W.; Leiterer, U. Vertical distribution of the spectral aerosol optical depth in the Arctic from 1993 to 1996. J. Geophys. Res. Atmos. 1998, 103, 1857–1870. [Google Scholar] [CrossRef]
- Ohvril, H.; Teral, H.; Neiman, L.; Kannel, M.; Uustare, M.; Tee, M.; Russak, V.; Okulov, O.; Jõeveer, A.; Kallis, A.; et al. Global dimming and brightening versus atmospheric column transparency, Europe, 1906–2007. J. Geophys. Res. Atmos. 2009, 114. [Google Scholar] [CrossRef]
- Streets, D.G.; Yan, F.; Chin, M.; Diehl, T.; Mahowald, N.; Schultz, M.; Wild, M.; Wu, Y.; Yu, C. Anthropogenic and natural contributions to regional trends in aerosol optical depth, 1980–2006. J. Geophys. Res. Atmos. 2009, 114, 16. [Google Scholar] [CrossRef]
- He, Q.; Zhang, M.; Huang, B. Spatio-temporal variation and impact factors analysis of satellite-based aerosol optical depth over China from 2002 to 2015. Atmos. Environ. 2016, 129, 79–90. [Google Scholar] [CrossRef]
- Langmann, B. On the role of climate forcing by volcanic sulphate and volcanic ash. Adv. Meteorol. 2014, 2014, 340123. [Google Scholar] [CrossRef]
- Wild, M. Enlightening global dimming and brightening. Bull. Am. Meteorol. Soc. 2012, 93, 27–37. [Google Scholar] [CrossRef]
- Wang, Y.W.; Yang, Y.H. China’s dimming and brightening: Evidence, causes and hydrological implications. Ann. Geophys. 2014, 32, 41–55. [Google Scholar] [CrossRef]
- Yang, K.; Ding, B.H.; Qin, J.; Tang, W.J.; Lu, N.; Lin, C.G. Can aerosol loading explain the solar dimming over the Tibetan Plateau? Geophys. Res. Lett. 2012, 39, L20710. [Google Scholar] [CrossRef]
- Saikawa, E.; Naik, V.; Horowitz, L.W.; Liu, J.F.; Mauzerall, D.L. Present and potential future contributions of sulfate, black and organic carbon aerosols from China to global air quality, premature mortality and, radiative forcing. Atmos. Environ. 2009, 43, 2814–2822. [Google Scholar] [CrossRef]
- Andreae, M.O.; Gelencsér, A. Black carbon or brown carbon? The nature of light-absorbing carbonaceous aerosols. Atmos. Chem. Phys. 2006, 6, 3131–3148. [Google Scholar] [CrossRef]
- Chan, Y.C.; Simpson, R.W.; McTainsh, G.H.; Vowles, P.D.; Cohen, D.D.; Bailey, G.M. Source apportionment of visibility degradation problems in Brisbane (Australia) using the multiple linear regression techniques. Atmos. Environ. 1999, 33, 3237–3250. [Google Scholar] [CrossRef]
- Evan, A.T.; Heidinger, A.K.; Vimont, D.J. Arguments against a physical long-term trend in global ISCCP cloud amounts. Geophys. Res. Lett. 2007, 34. [Google Scholar] [CrossRef]
- You, Q.; Sanchez-Lorenzo, A.; Wild, M.; Folini, D.; Fraedrich, K.; Ren, G.; Kang, S. Decadal variation of surface solar radiation in the Tibetan Plateau from observations, reanalysis and model simulations. Clim. Dyn. 2013, 40, 2073–2086. [Google Scholar] [CrossRef]
- Tang, W.; Yang, K.; Qin, J.; Min, M. Development of a 50-year daily surface solar radiation dataset over China. Sci. China Earth Sci. 2013, 56, 1555–1565. [Google Scholar] [CrossRef]
- Qian, Y.; Wang, W.; Leung, L.R.; Kaiser, D.P. Variability of solar radiation under cloud-free skies in China: The role of aerosols. Geophys. Res. Lett. 2007, 34. [Google Scholar] [CrossRef]
- Yang, K.; Pinker, R.T.; Ma, Y.; Koike, T.; Wonsick, M.M.; Cox, S.J.; Zhang, Y.; Stackhouse, P. Evaluation of satellite estimates of downward shortwave radiation over the Tibetan Plateau. J. Geophys. Res. Atmos. 2008, 113. [Google Scholar] [CrossRef]
- Yang, K.; Koike, T.; Stackhouse, P.; Mikovitz, C.; Cox, S.J. An assessment of satellite surface radiation products for highlands with Tibet instrumental data. Geophys. Res. Lett. 2006, 33. [Google Scholar] [CrossRef]


Publisher’s Note: MDPI stays neutral with regard to jurisdictional claims in published maps and institutional affiliations. |
© 2020 by the authors. Licensee MDPI, Basel, Switzerland. This article is an open access article distributed under the terms and conditions of the Creative Commons Attribution (CC BY) license (http://creativecommons.org/licenses/by/4.0/).