Article

Victoria Land, Antarctica: An Improved Geodynamic Interpretation Based on the Strain Rate Field of the Current Crustal Motion and Moho Depth Model

1
Dipartimento di Ingegneria Civile, Chimica, Ambientale e dei Materiali (DICAM), Università di Bologna, 40136 Bologna, Italy
2
Istituto di Radioastronomia (IRA), Istituto Nazionale di Astrofisica (INAF), 40129 Bologna, Italy
3
Istituto Nazionale di Geofisica e Vulcanologia (INGV), Sezione di Bologna, 40128 Bologna, Italy
4
Dipartimento di Scienze della Terra dell’Ambiente e della Vita (DISTAV), Università degli Studi di Genova, 16132 Genoa, Italy
5
Dipartimento di Scienze Geologiche, Università degli Studi Roma Tre, 00146 Roma, Italy
6
Dipartimento di Ingegneria Enzo Ferrari, Università degli Studi di Modena e Reggio Emilia, 41125 Modena, Italy
7
Istituto Nazionale di Oceanografia e di Geofisica Sperimentale (OGS), “Infrastructures” Section (IRI), 34010 Sgonico, Italy
8
Dipartimento di Storia Culture Civiltà (DSCI), Università di Bologna, 40124 Bologna, Italy
*
Author to whom correspondence should be addressed.
Remote Sens. 2021, 13(1), 87; https://doi.org/10.3390/rs13010087
Submission received: 27 November 2020 / Revised: 23 December 2020 / Accepted: 26 December 2020 / Published: 29 December 2020
(This article belongs to the Special Issue Remote Sensing and Geodynamics)

Abstract

:
In Antarctica, the severe climatic conditions and the thick ice sheet that covers the largest and most internal part of the continent make it particularly difficult to systematically carry out geophysical and geodetic observations on a continental scale. It prevents the comprehensive understanding of both the onshore and offshore geology as well as the relationship between the inner part of East Antarctica (EA) and the coastal sector of Victoria Land (VL). With the aim to reduce this gap, in this paper multiple geophysical dataset collected since the 1980s in Antarctica by Programma Nazionale di Ricerche in Antartide (PNRA) were integrated with geodetic observations. In particular, the analyzed data includes: (i) Geodetic time series from Trans Antarctic Mountains DEFormation (TAMDEF), and Victoria Land Network for DEFormation control (VLNDEF) GNSS stations installed in Victoria Land; (ii) the integration of on-shore (ground points data and airborne) gravity measurements in Victoria Land and marine gravity surveys performed in the Ross Sea and the narrow strip of Southern Ocean facing the coasts of northern Victoria Land. Gravity data modelling has improved the knowledge of the Moho depth of VL and surrounding the offshore areas. By the integration of geodetic and gravitational (or gravity) potential results it was possible to better constrain/identify four geodynamic blocks characterized by homogeneous geophysical signature: the Southern Ocean to the N, the Ross Sea to the E, the Wilkes Basin to the W, and VL in between. The last block is characterized by a small but significant clockwise rotation relative to East Antarctica. The presence of a N-S to NNW-SSE 1-km step in the Moho in correspondence of the Rennick Geodynamic Belt confirms the existence of this crustal scale discontinuity, possibly representing the tectonic boundary between East Antarctica and the northern part of VL block, as previously proposed by some geological studies.

1. Introduction

The geodynamic interpretation of the Antarctic continent and geological sub-regions is particularly challenging because of the gaps and spatial heterogeneity of data. Gravimetric, geodetic, and magnetic dataset was collected from terrestrial and marine environments over the past decades, nevertheless their use and integration into geodynamic models at continental or regional scale requires further efforts.
Among the available observations, continuous Global Navigation Satellite Systems (CGNSS) and airborne or shipborne-based gravimetric surveys provided the fundamental data compilation to derive geodynamic and geophysical models of the Antarctic regions. Such geodetic and gravimetric signatures could reflect the complex interaction mechanisms between the solid earth and the cryosphere and provide insights about the structure of the upper mantle, crustal thicknesses, active tectonic, and geodynamic processes in Antarctica. In particular, strain rate field, from the analysis of CGNSS time series, and Moho depth models, from the inversions of gravimetric dataset, could be adopted to improve the geodynamic modelling of Antarctic regions and interpretation of modern processes.
Within geodetic initiatives, about a hundred of CGNSS stations have been installed in Antarctica in the last two decades by several research initiatives coordinated by the scientific committee on Antarctic research (SCAR). Most of them belong to the International GNSS Service (IGS) network, and the observations contributed to the realization of the International Terrestrial Reference Frame (ITRF) at relevant epochs. Data processing of continuous and discontinuous Antarctic GNSS station contributed to the studies related to geodynamics [1,2], glaciology [3], crustal motions [4,5,6,7,8], and glacial isostatic adjustment (GIA) modelling [9,10,11,12,13]. Some of the mentioned studies adopted a set of extra-Antarctic CGNSS stations to define a reference frame for further investigations of surface motions and geodynamics within the Antarctic plate. For instance, Zanutta et al. [14] used a total of 235 GNSS stations worldwide (95 of which located in Antarctica, Figure 1A) for estimating the Eulerian pole of the Antarctic plate.
By calculating the Euler pole, it was possible to subtract the contribution due to the rigid rotation of the Antarctic plate from the absolute plate motion. This way, residual velocity vectors can be therefore used to highlight the relative motions among rigid blocks and to compute the stain rate field resulting from tectonic-related movement and geodynamic phenomena at a continental and regional scale. Data gaps, heterogeneity in the spatial distribution of GNSS stations, and the very low magnitude of displacement residues require careful statistical analysis capable of selecting reliable values for a potential geodynamic interpretation. For instance, regional deformation fields from clusters of continuous and discontinuous GNSS stations and successive geodynamic modelling at regional scale has been introduced by a couple of projects in the Victoria Land (VL, East Antarctica). In particular, those implemented by the United States (US) and Italian projects, namely TAMDEF (Trans Antarctic Mountains DEFormation), and VLNDEF (Victoria Land Network for DEFormation control) [4,5]. Figure 1B shows the locations of VLNDEF and TAMDEF GNSS stations distributed in VL.
Despite geodetic investigations having revealed to be a good tool for making inferences about the geodynamics of Antarctica sub-regions, additional information from marine and on-shore terrestrial and airborne gravimetric measurements as well as the integration of data at regional and continental scales have constrained and strengthened the final geodynamic model. At continental scale, knowledge about the crust thickness of Antarctica has been greatly improved by extensive airborne geophysical campaigns, including measurements of gravity and magnetic fields, coupled with surface and shipborne gravity data [3,15,16,17,18,19,20,21]. Because of the limited number of surface gravimetric stations and minor gaps in the coverage of airborne geophysical surveys, the gravimetric compilation has been integrated by the more uniform spatial coverage provided by the satellite data. Several satellite missions, including CHAMP (Challenging Mini-satellite Payload) [22], GRACE (Gravity Recovery and Climate Experiment), and GOCE (Gravity field and steady state Ocean Circulation Explorer) [23], provided gravity data with consistent accuracy and uniform spatial coverage and resolution. To support the modelling of geodynamic processes with additional information on Antarctica’s crustal thickness, the inversions of the Moho depth can be performed. Referring to the Antarctic continent, possible approaches to Moho depth inversions using satellite gravity data were proposed by Block et al. [24]. O’Donnell and Nyblade [25], Pappa et al. [26] inverted the crustal thickness of Antarctica using different algorithms and constrained results by Moho depths estimated from 3D Rayleigh wave dispersion analyses and from regional seismological surveys. Discrepancies were found among resulting models with possible explanations based on modes of isostatic compensation and upper mantle composition variations. At regional scale, to better define discontinuities in crustal structures and along the coastal boundaries, geodynamic investigations supported by the inversions of geodetic and gravimetric observations could benefit from more accurate and dense measurements from surface, aerial, and shipborne surveys [14].
In this study, we improved the geodynamic interpretation of VL using new surface strain rates estimates derived from GNSS observations and Moho depth computations derived from the inversion of new gravimetric data collected from both onshore and offshore in the frame of the Italian national program for Antarctic research, PNRA (see Figure 1B to locate gravimetric measurements from surface shipborne gravimetry). Results better highlighted the VL tectonic framework, characterized by the presence of a series of NW-SE regional faults representing the inland propagation of the Southern Ocean fracture zones [27,28]. In particular, the study suggests the existence of four geodynamic blocks characterized by homogenous geodetic and geophysical features. We propose the presence of a clockwise rotation of VL with respect to the East Antarctica (EA), with larger relative motions along the Rennick Geodynamic Belt (RGB), [14]. A crustal discontinuity within this area is also visible from the interpretation of Moho depths and may represent the tectonic discontinuity between EA and VL that allows the abovementioned clockwise rotation. We conclude that the integration of high-density geophysical and geodetic data allows an improved geodynamic interpretation of VL by the delineation of sub-regions with different geodetic and gravimetric signatures.

2. GNSS and Gravimetric Data

The dataset used in this work consists of superficial velocity field coming from GNSS observations collected during several research campaigns [14]. Terrestrial, airborne, and shipborne gravimetric data come from geophysical surveying carried out within the PNRA campaigns over the past two decades [14,19], which were integrated with data provided by the Bundesanstalt für Geowissenschaften und Rohstoffe (BGR), [29], British Antarctic Survey (BAS), [20,30], Osservatorio Geofisico Sperimentale (OGS), and satellite gravimetric data supplied by the international geosciences community [23,31].

2.1. GNSS Dataset

The estimation of the strain rate field of the current crustal motion derives from the absolute velocities of 235 GNSS stations distributed worldwide (Figure 1A), including permanent IGS and POLENET stations, and discontinuous VLNDEF stations, whose observations have been collected since 1998 within the PNRA activities [2,6,8,14,32,33].
Thirty-six of the above mentioned stations are located in VL and, among them, 27 belongs to VLNDEF and 9 to the POLENET (Figure 1B).
The Bernese GNSS Software Version 5.2 [34] was used adopting the double-difference approach for estimating the position of the GNSS stations over time.

2.2. Gravimetric Dataset

The present work starts from the gravimetric dataset and products presented by Zanutta et al. [14], which was built starting from three different sources: (1) Terrestrial gravity surveys carried out in the austral summer at 180 sites located over the bedrock, distributed in VL; (2) marine gravity measures from the 1980–1981 profiles acquired by the German research institution (Bundesanstalt für Geowissenschaften und Rohstoffe—BGR) on the Southern Ocean (Explora Vessel), later supplemented with data provided by the OGS (Osservatorio Geofisico Sperimentale) [29]; (3) the 1988–2005 gravity data acquired along profiles in the Ross Sea (Antarctica) in the framework of the OGS international research programs, and the airborne gravity data collected by the British Antarctic Survey (BAS), [20]. The aforementioned dataset has been merged with data outside the studied area to reduce boundary effects in the method adopted to estimate the Moho depth.
Areas not covered by shipborne gravimetric measures are filled with data derived from satellite altimetry [35]. The complete dataset is defined onto a 10 × 10 km2 regular grid.
The Uieda and Barbosa [36] approach was adopted to calculate the gravity disturbance, which is the free air correction reduced to the normal Earth ellipsoid (WGS84) instead of the geoid [37]. Since the gravity disturbance will be used to estimate the Moho depth, the calculated disturbance has been upward continued to a reference height of 50 km. This elevation was chosen because it would reduce anomalies created by the near surface and short wavelength density anomalies in the crust [38]. The upward continued field should enhance the deep crustal regional sources.
Gravity disturbance has been corrected for topography, ice, and water to obtain the Bouguer disturbance. All calculations have been done with Tesseroids, which are mass elements defined in spherical coordinates and bounded by two meridians, two parallels, and two concentric circles [39]. Each correction has been calculated at the same height of the disturbance (50 km). Density values of 2670 kg/m3, 1030 kg/m3, and 917 kg/m3 were adopted for rocks, water, and ice respectively. Bedrock elevation, ice thickness, and bathymetry are from the Bedmap2 dataset [40]. Moreover, we also removed the gravity effect of the sediments that fill the Ross Sea basin up to 8-km thick [41]. We assumed a density contrast of 270 kg/m3 between the sediments and the underlain basement. The result is the Bouguer sediment-corrected gravity disturbance at 50 km of height that should reflect the gravity attraction of the crust-mantle boundary. Another gravity model has been defined by just setting the reference height for the upward gravity continuation to 30 km. All the other corrections have been done as in the 50 km case. This calculated Bouguer sediment-corrected gravity disturbance, at 30 km, should enhance shorter wavelengths deep crustal features.

3. Strain Map Rate from GNSS Observations

Velocities coming from GNSS observations demonstrate relative motions among stations while strain rate field shows strain concentration rates among stations. This may help to better understand the tectonic framework of a region. The strain rate is the local horizontal gradient of the velocity field.
Velocity errors are directly reflected on estimated strain rates, so it is important to analyze only meaningful data. Furthermore, anomalous movement of stations may generate errors in rates field of the surrounding area. Therefore it is important to adopt a correct strategy of computation [42] in order to optimize the interpolation of the strain rates using discrete geodetic measurements.
The geographical distribution of GNSS stations plays a fundamental role in the estimation of deformations coming from the velocities derived from the GNSS network solution but the homogeneous distribution of GNSS stations in Antarctica remains an unattained utopia.
In Antarctica, GNSS stations located on rocky outcrops are distributed in areas not covered by ice along the coasts, so the strain rate field analysis can only be performed along these narrow strips of the continent. This is also applied to VL, which is located near the boundary between West and East Antarctica (Figure 1).
The Cardozo and Allmendinger approach [43] was applied to characterize the horizontal surface deformation of VL.
The strain rate field of the current crustal motion was obtained from the horizontal observed velocities of GNSS stations published in [14]. The only assumption in this procedure was that strain is homogeneous within the region of the stations used in the analysis.
On one side, especially in Antarctica, it is important to eliminate the common movements of the stations in order to analyze the residual rates, which can highlight deformations due to GIA horizontal components and tectonic movements. The subtraction of the plate movement from the absolute velocities of the GNSS station produces relative velocities. This result was achieved by calculating the Euler pole position and the angular velocity by inverting the rate of the stations [10]. The number and geographic distribution of GNSS stations used in the calculation can influence the result. Zanutta et al. [14] derived the position of the Euler pole assessed with the angular velocity of the Antarctic plate using a subset of 95 GNSS stations located throughout the Antarctic plate (VLNDEF18 in Table 1). This made it possible to understand the movements at regional and continental scale of East and West Antarctica.
On the other side, the Euler pole was here evaluated using 36 GNSS stations located only within VL, in order to minimize the residual effects in relative velocities induced by external areas with respect to VL (VLNDEF20 in Table 1). This computation was performed using the Euler Pole Calculator (EPC) software [44] and adopting the absolute velocities estimated in Zanutta et al. [14], (Table 1 and Table 2).
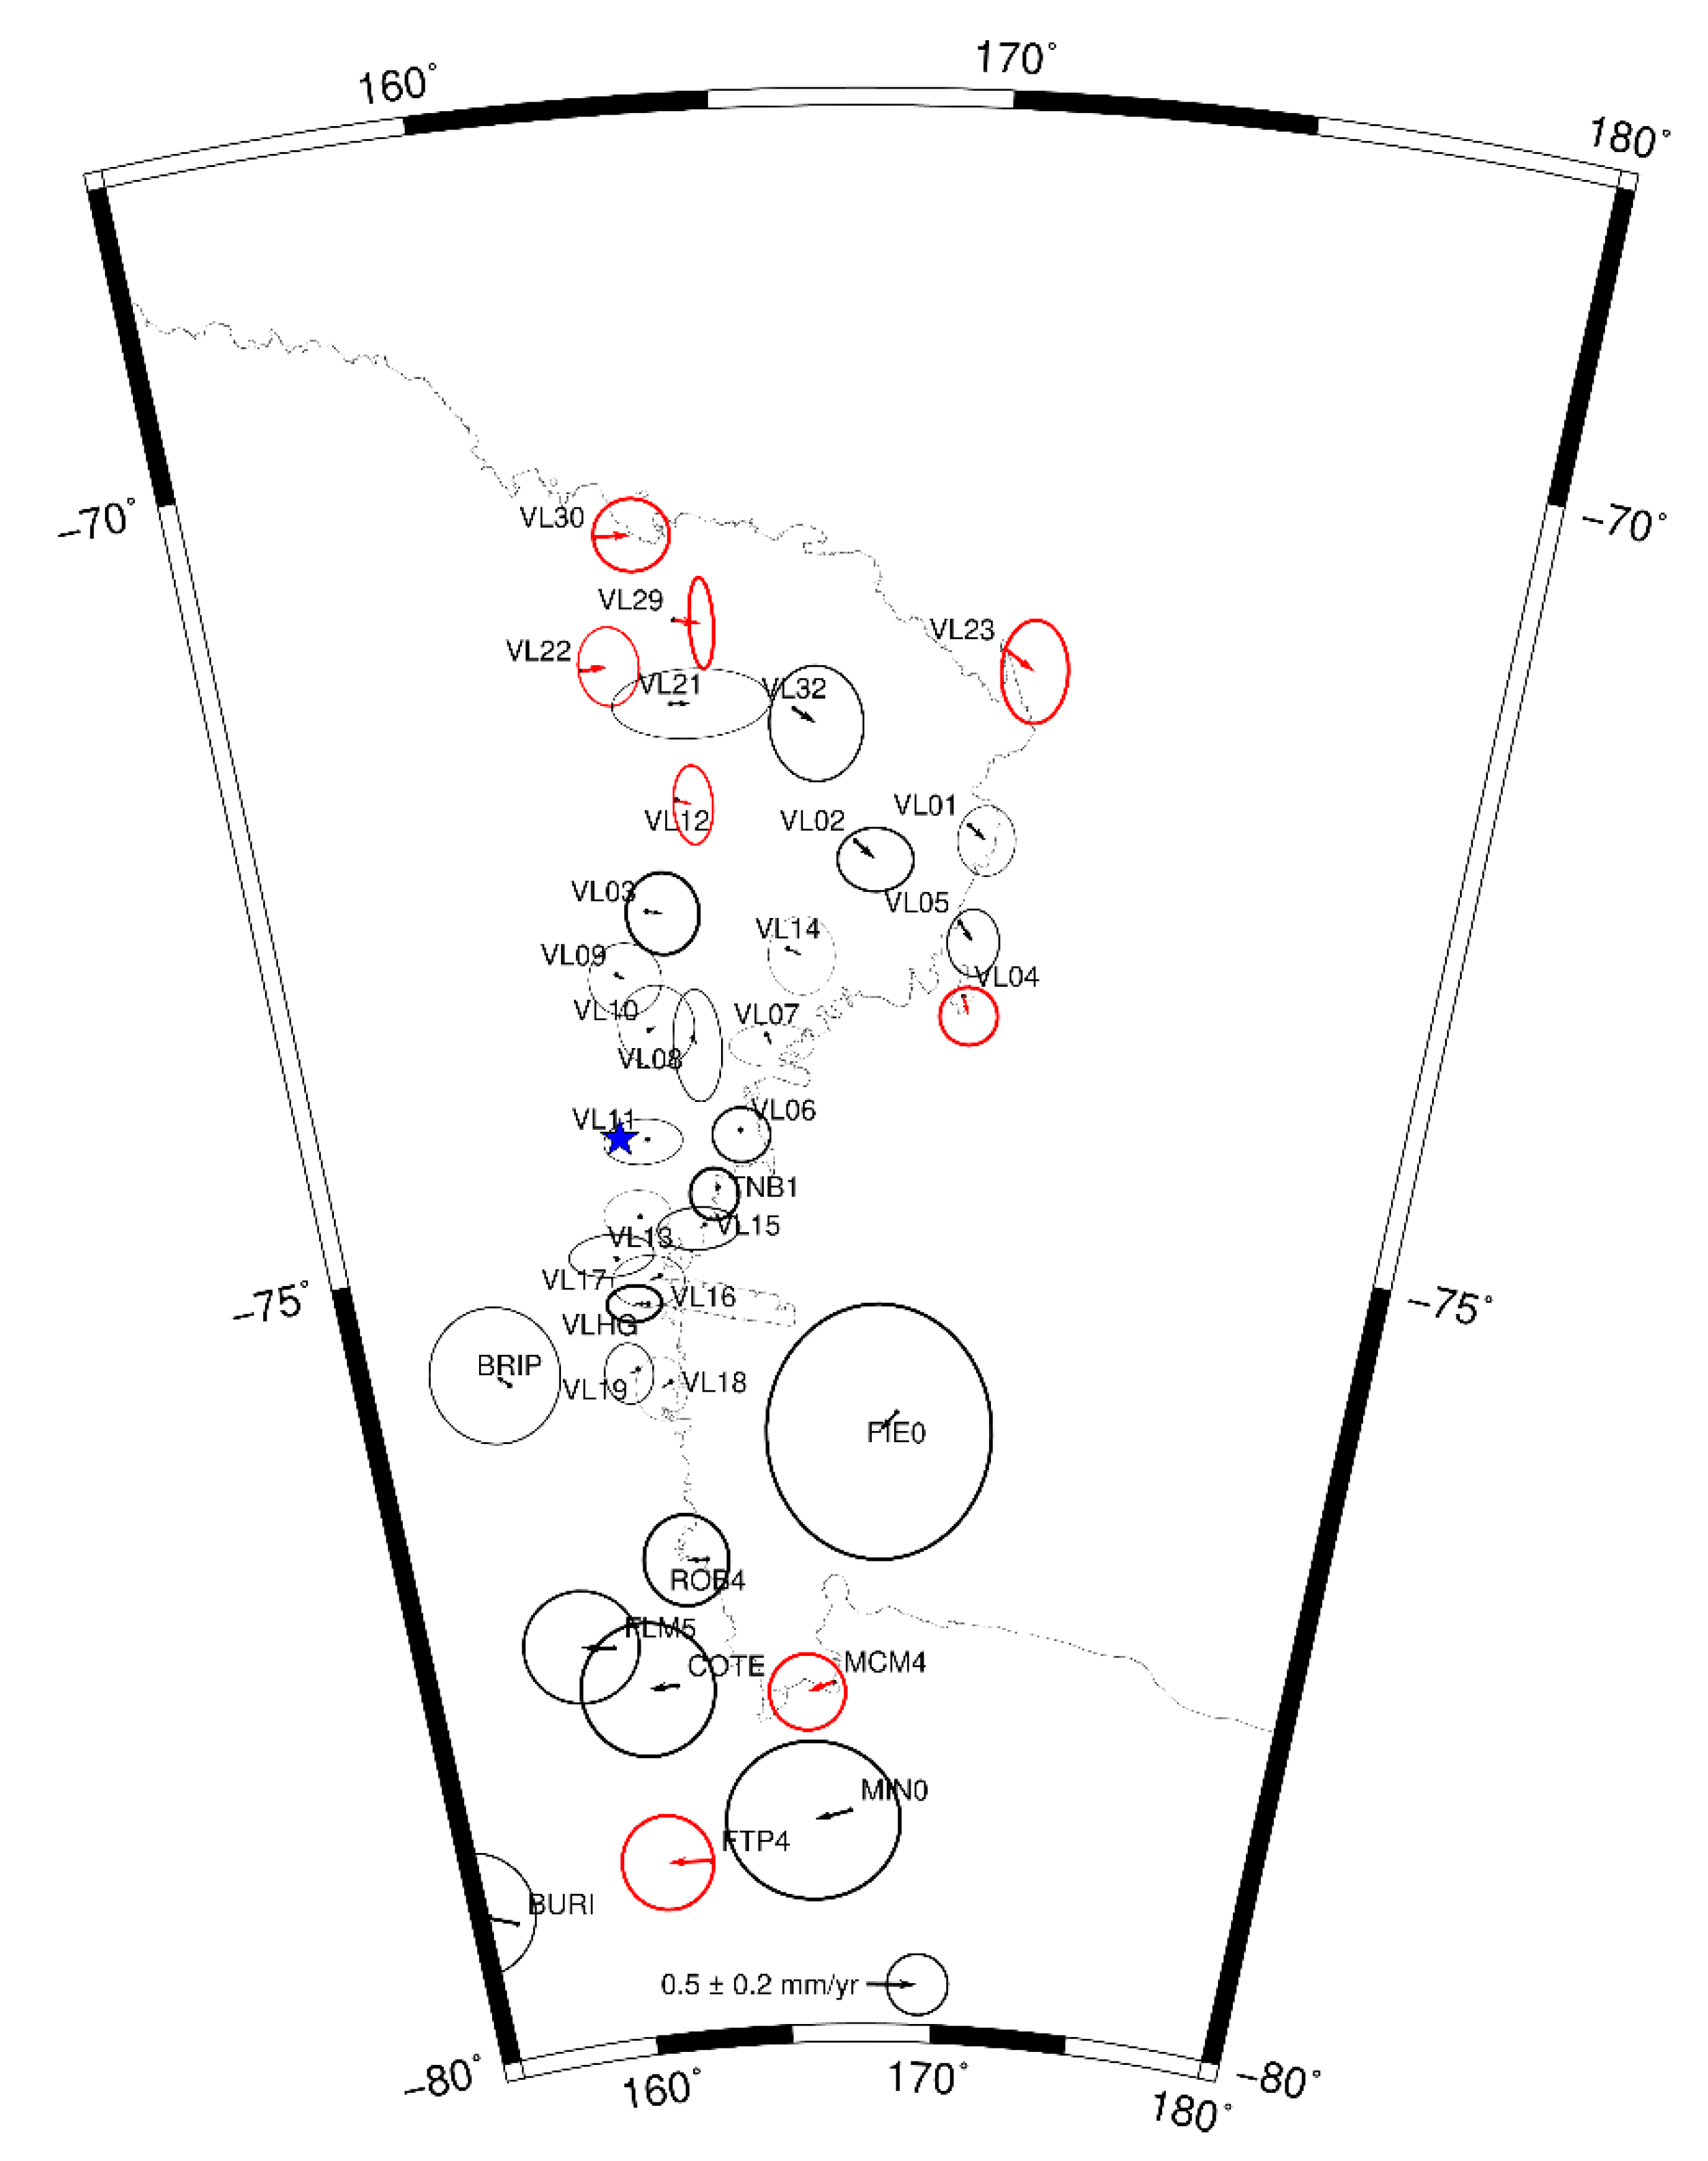
The differences of the station velocities obtained by the VLNDEF18 Euler pole and those coming from this work, show a residual clockwise rotation that characterizes the region (Figure 2). The apparent rotation has a pole located near the barycentre of the network. The Figure 2 shows the residual velocity vectors and their errors. Significant values, identified according to the ±σ sigma criterion, are highlighted in red.
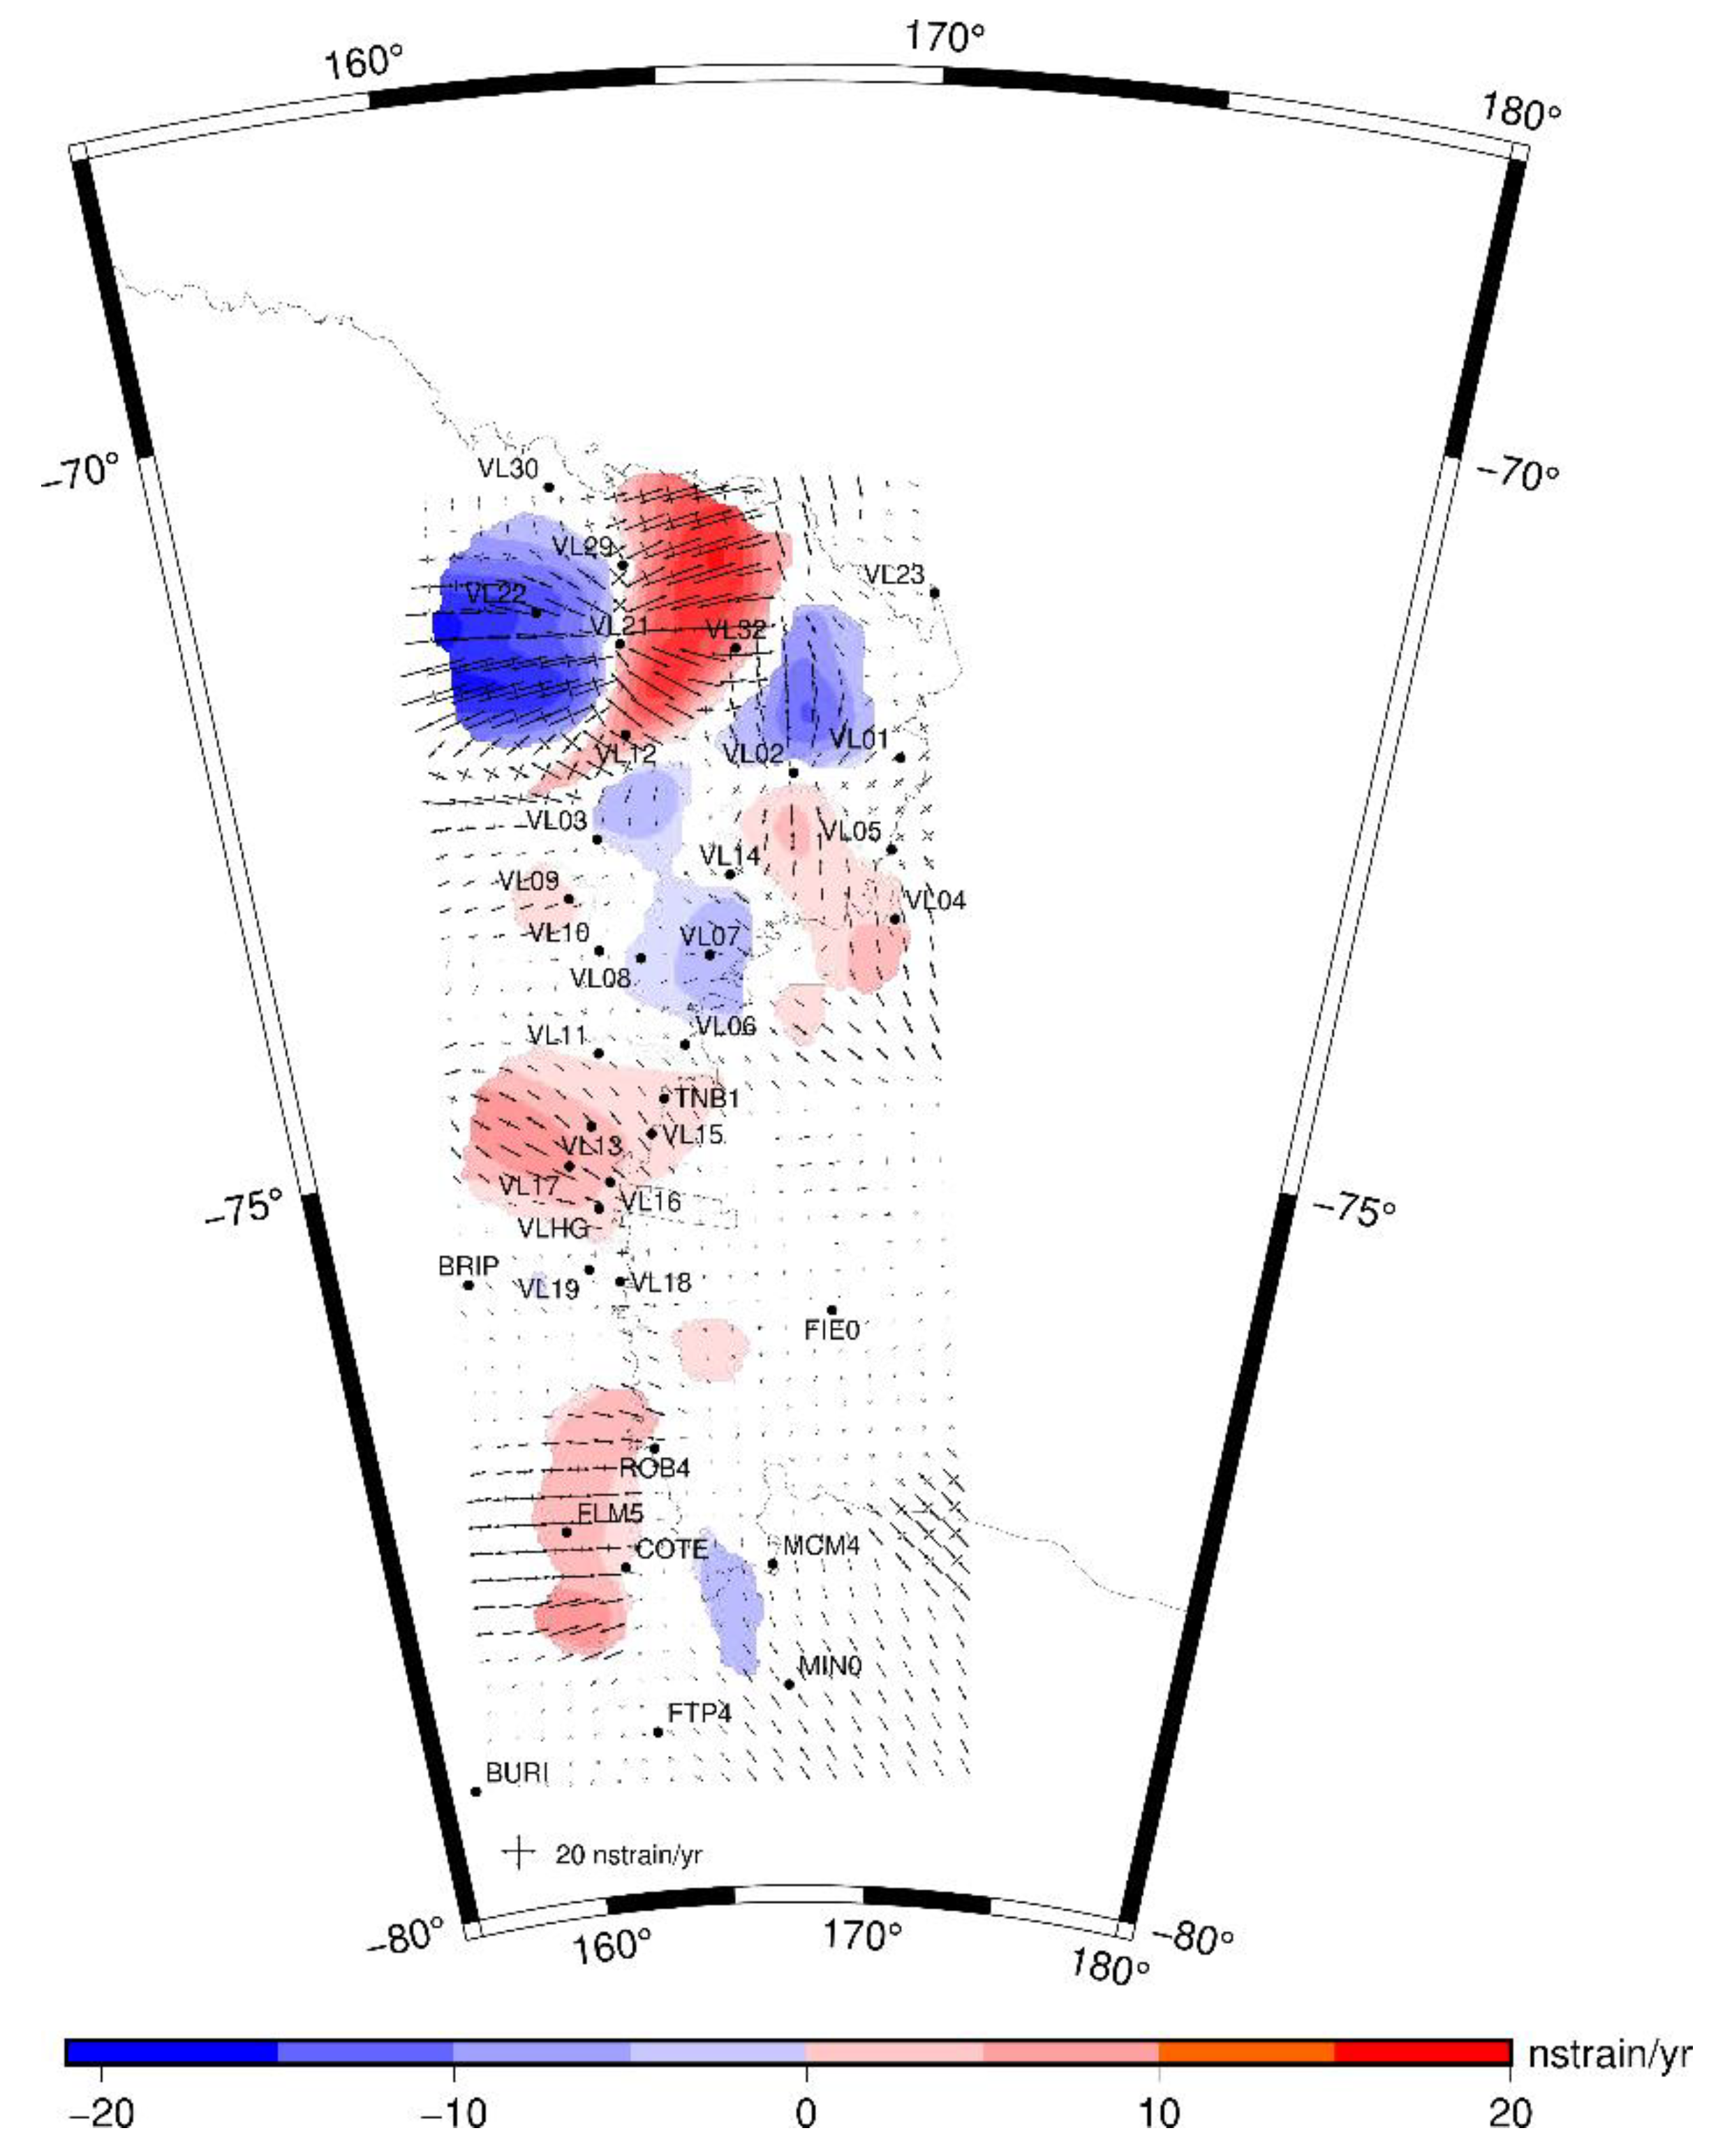
The horizontal principal strain rate and dilatation were evaluated at a center of each square cell of a regularly spaced grid, by means of the grid-distance-weighted approach [43,45,46,47]. The computation was done using all the 36 GNSS stations of the area and a distance weighting factor alpha of 38.67 km. Weighting data by distance produces a smoothed regional pattern strain and rotation rate field and is particularly effective to visualize the regional patterns over large areas. A grid spacing of 20 km was adopted to display the strain directions in the graphs in a more readable way, while a grid spacing of 5 km was adopted to highlight, by means of colored areas in the graph, only the significant values (at 1σ level).
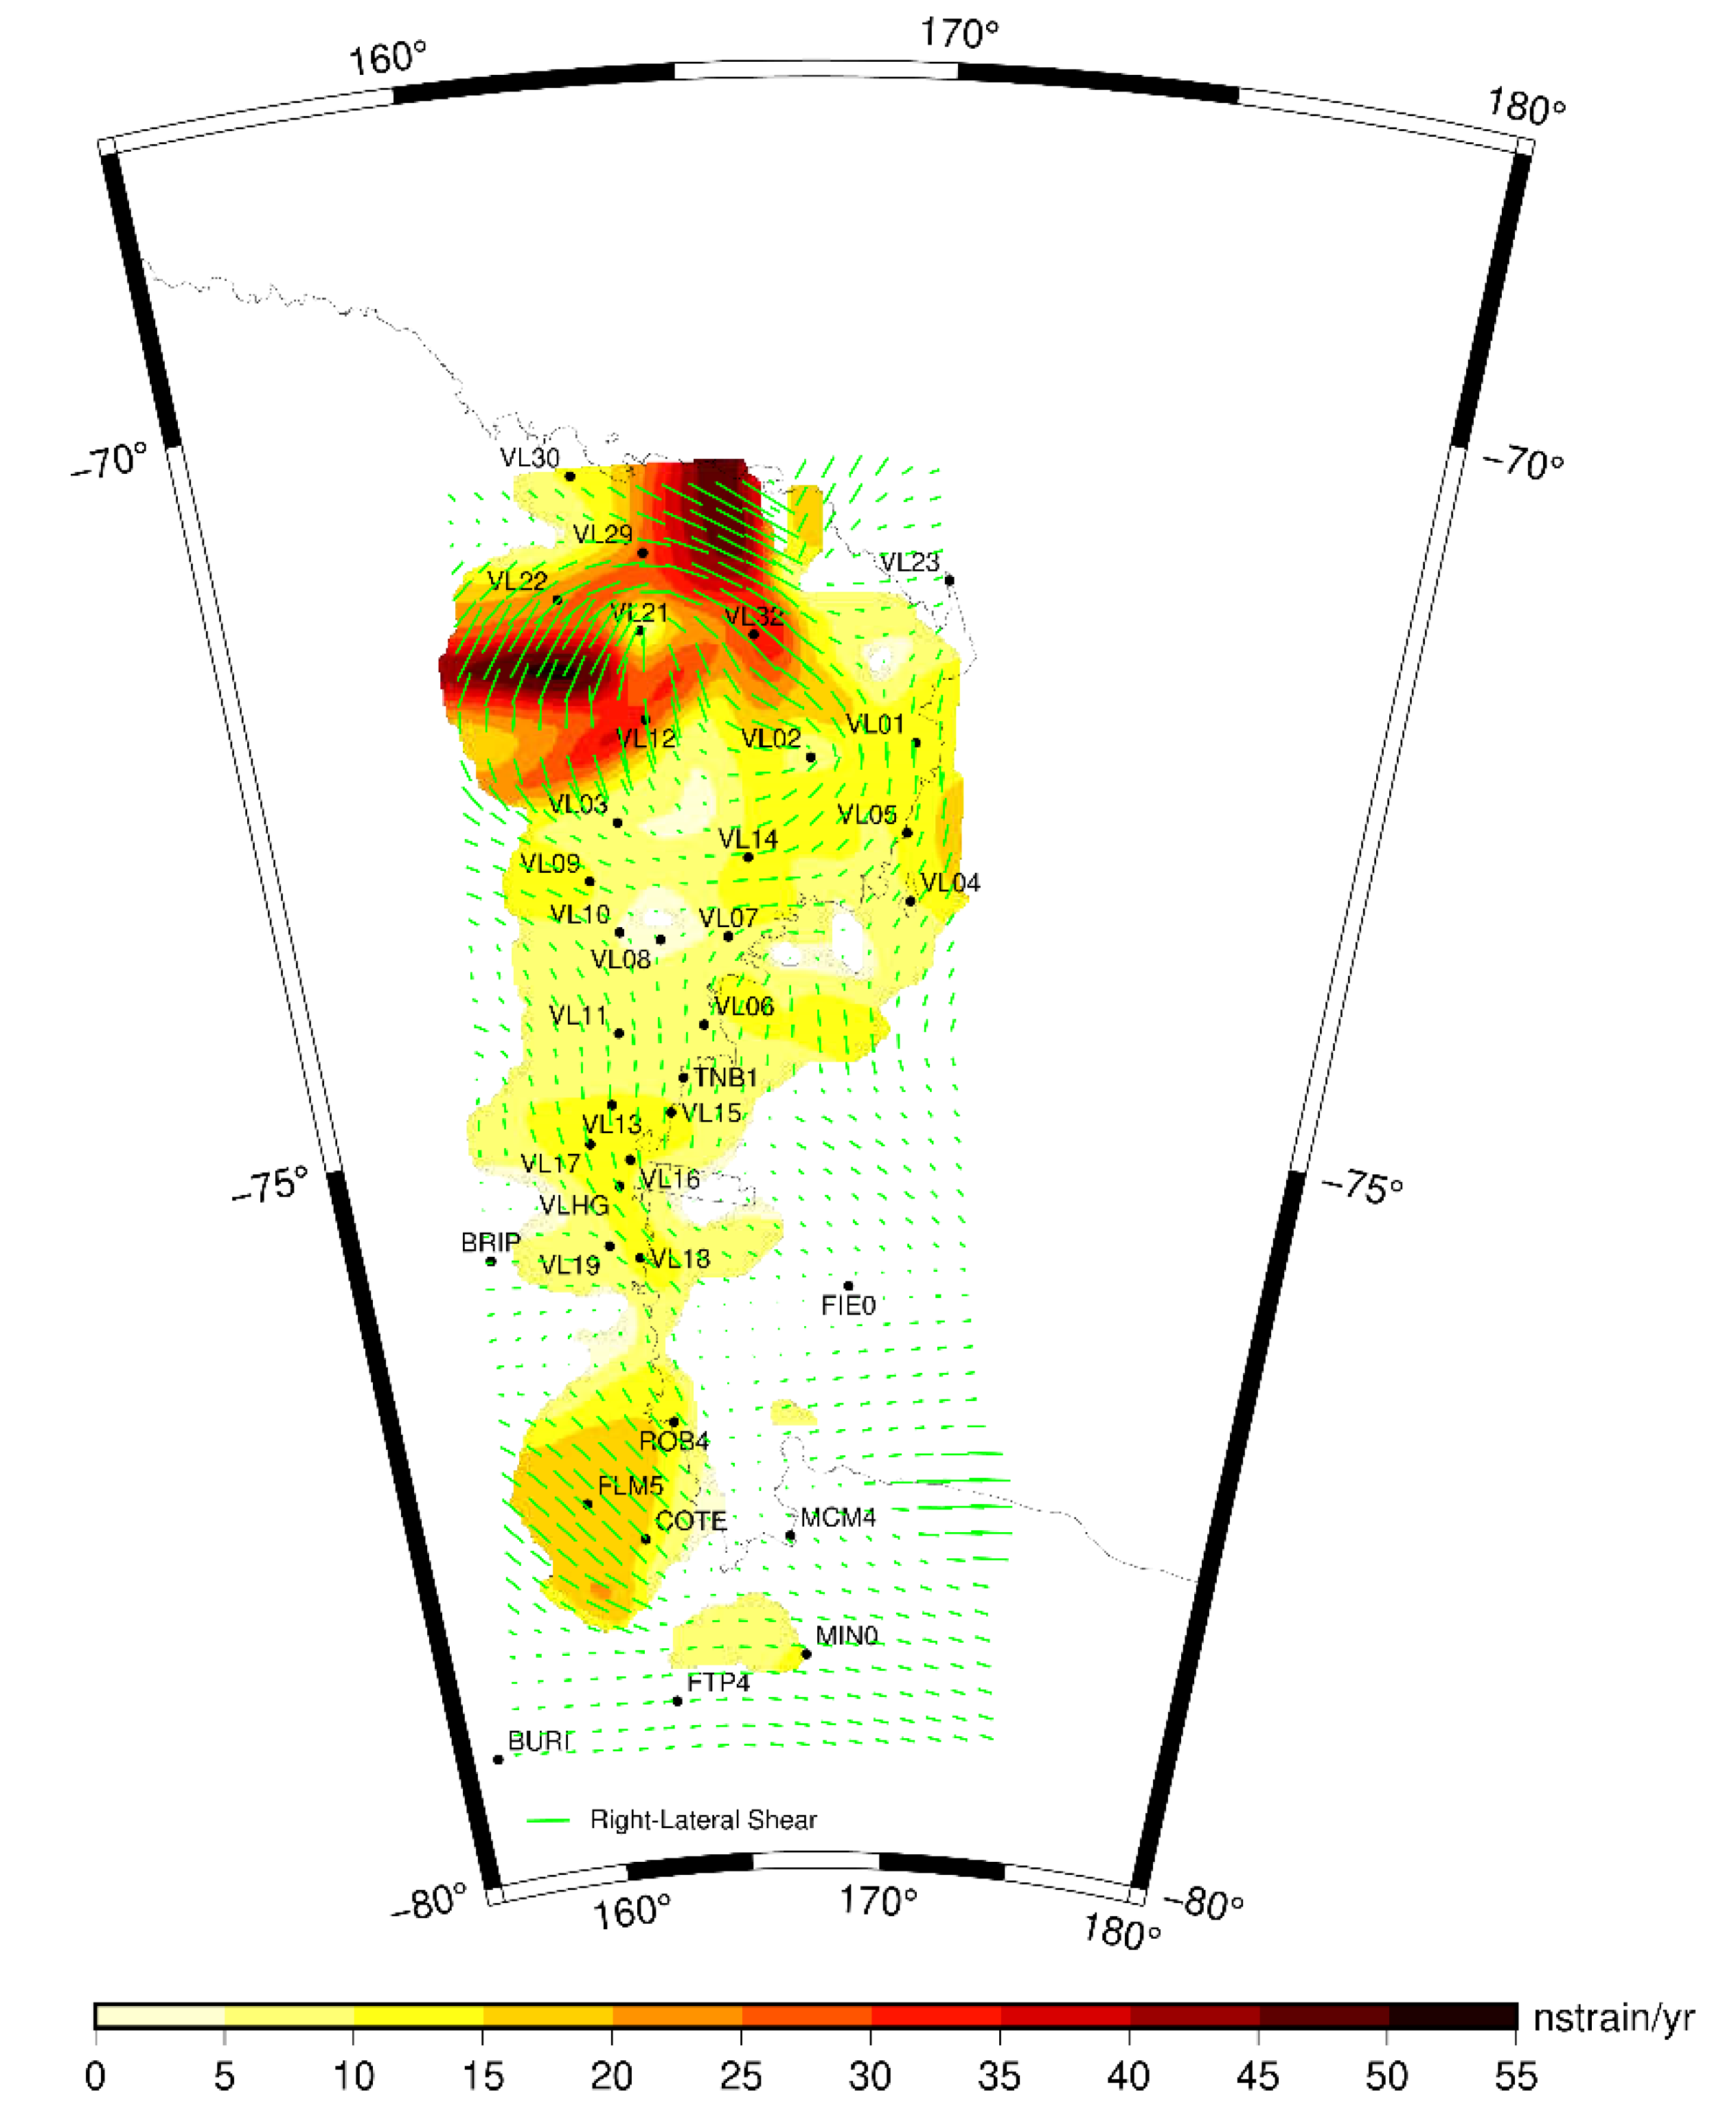
Figure 3 and Figure 4 show the strain rate field computed from GNSS relative velocities. The Figure 3 shows the behavior of VL, where dilatation is shown in red and compression in blue. The Figure 4 shows the maximum shear strain rates and the direction of right-lateral component. Both figures highlight the heterogeneities of the deformations within VL.

4. Computation of the Moho Depths from Gravimetric Data

The gravity dataset, build from the gravity disturbance upward continued to a reference height of 50 km, described in Section 2.2, has been used to estimate the Moho depth with the method proposed by Uieda and Barbosa [36]. This is a non-linear inversion method that requires gravity data and seismic estimations of the Moho as constraints. The inversion method needs the estimation of three hyperparameters that influence the solution: (1) A regularization parameter (μ), which stabilizes and smooths the solution; (2) the best normal Earth Moho depth (∆z); (3) the density contrast (∆ρ) at the crust-mantle boundary. The best μ in the range 10−10–10−2 was found at the value of 10−10. This low value suggests that the regularization parameter did not affect so much the Moho final value.
For the best estimating of ∆ρ and ∆z, the Moho depth obtained by seismic surveys is also required. We used the combined dataset built and proposed by Pappa et al. [26]. This dataset combines seismic estimations of the Moho depth from several sources.
Since both the average value of Moho depth and its density contrast are poorly known in VL area, we set a wide range for these parameters: a radius in the range 20–40 km at a 2.5-km step for ∆z; a radius in the range 200–600 kg/m3 at a 25 kg/m3 step for ∆ρ. For each ∆z-∆ρ pair the accuracy of the solution is evaluated against the seismic Moho depth. The solution that gives the smallest mean square error has been taken as the best fitting one. The best-fit values of ∆z and ∆ρ are 24 km and 450 kg/m3 respectively.
The Moho final grid shows a maximum depth of 38 km below the Transantarctic Mountain and a minimum of 17 km beneath the Ross Sea. The gravity effect of the estimated Moho shows a deviation from the calculated gravity anomalies of 0.93 ± 5.87 mGal, while for the predicted Moho depth the difference from the seismic Moho is 0.58 ± 5.18 km.
The Moho final grid shows a bimodal distribution: a maximum depth below the Transantarctic Mountains and a minimum of 17 km beneath the Ross Sea.
In the Ross Sea area, thin crust shows a good fit with seismic Moho depths measured along the Antarctic CRUstal Profile (ACRUP), [48], with differences in the range of 4.5–2.4 km and an average error of 1.8 km, which is comparable with the error of the seismic estimates. The Moho depth pattern agrees with the same estimated by a sophisticated 3D gravity inversion recently carried out in the RS area [49]. In this area, deviations from results obtained with the same inversion method [26] were observed, since the gravity effect of the sedimentary cover, which is not negligible [41], has been taken into account.
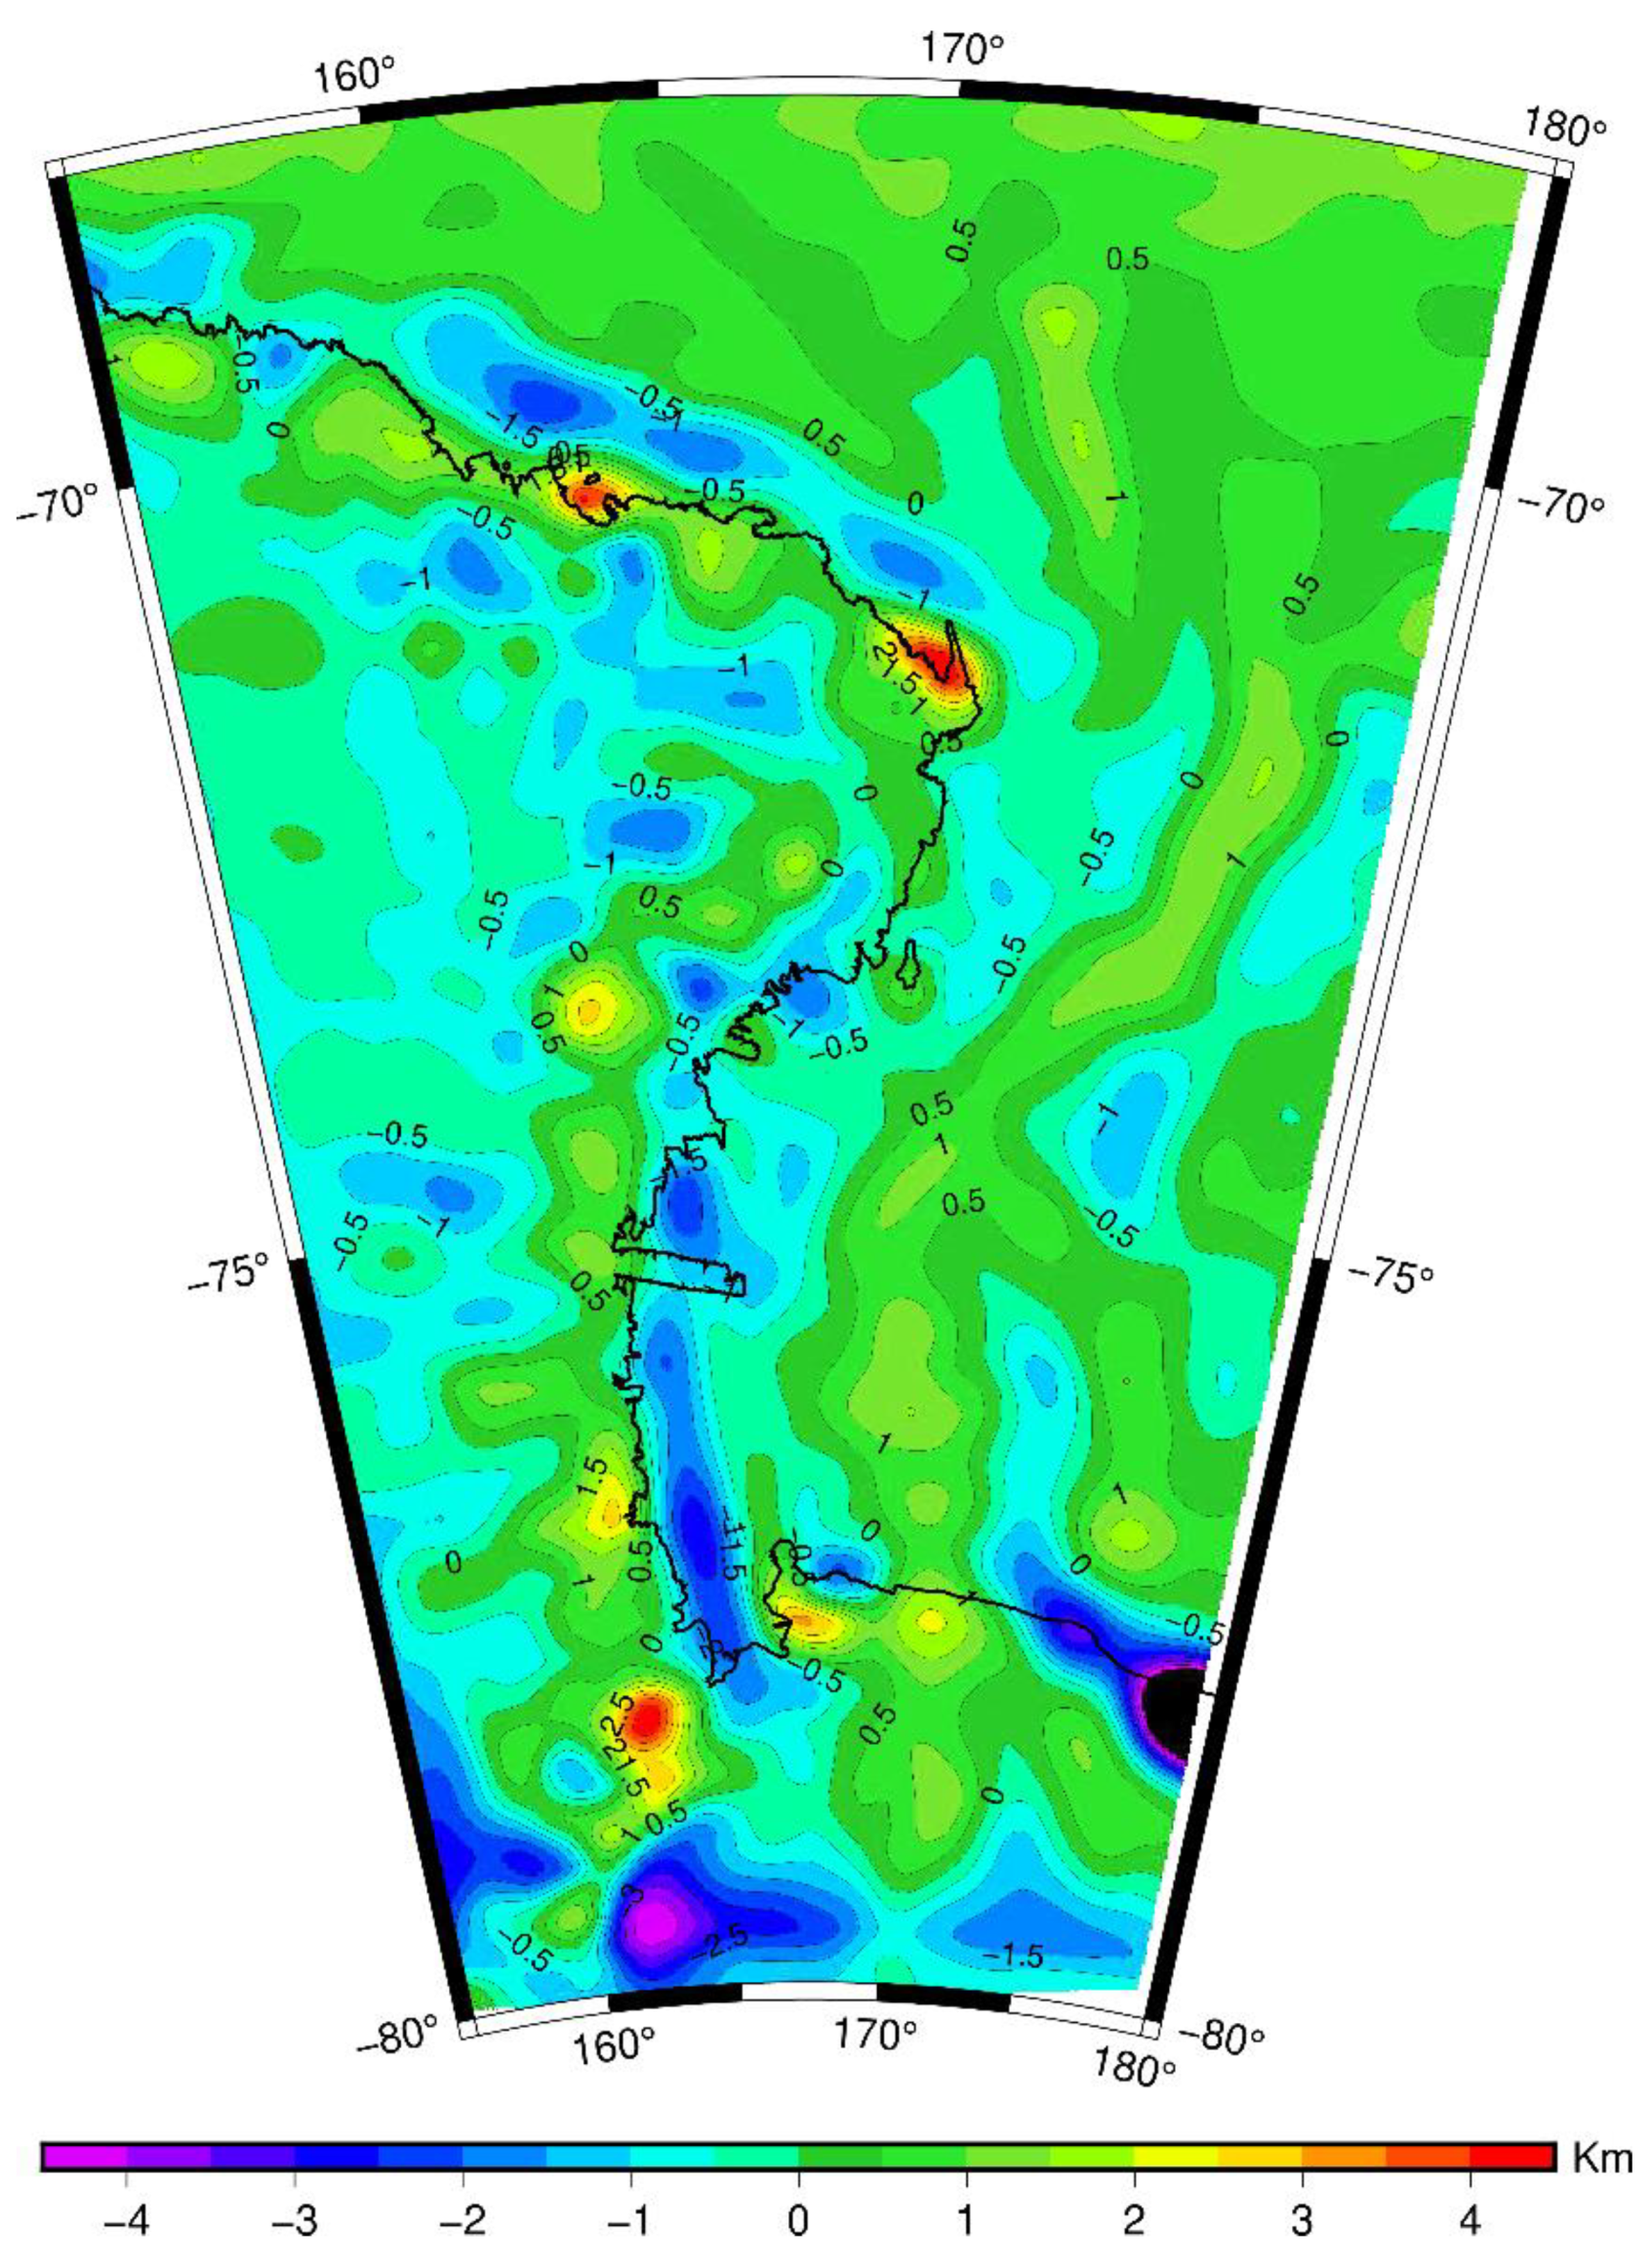
The Transantarctic Mountains show deeper Moho, however, because of the little and poorly distributed Moho values in the reference dataset for the area, an uncertainty remains in such a statement. Differences from the Moho reference dataset are within a range of ±10 km with an average error of 4.3 km. The gravity model built from a reference height for the upward gravity continuation of 30 km, as described in Section 2.2 was used to do another inversion. This second inversion should enhance short wavelength Moho undulations that could be filtered out by the 50 km height inversion. The difference between the Moho depth of the two models, 50 and 30 km, is small but points out some areas where short wavelength Moho changes occurs.

5. Discussion

The residual velocity vectors (Figure 2) highlight the presence of relative motions within VL region with respect to East Antarctica plate rotation. Three sectors can be identified. A northern sector with prevailing eastward relative movements, a southern one where the movements are westward, and a central, intermediate zone where the residual movements are negligible since below the errors. The northern sector, approximately located in the range of latitude 70°S–74°S, presents the larger residual velocity values along the northern coastal zones where they reach up to 0.5 mm/yr. These eastward velocities are present along the Rennick Geodynamic Belt (Figure 5, Figure 7), [14] and along the eastern coast of NVL, where the velocity vectors rotate to SE.
The southern sector extends approximately in the range of latitude between 77° S and 80° S. The two meaningful residual vectors indicate a westward motion around 0.2 mm/yr.
The residual vectors of VL are well described by a relative rotation of VL with respect to EA, with a pole falling inside VL at 74°21′13”S and 161°53′17”E and a clockwise rotation of 0.045°/Myr (Figure 2). The strain analysis in VL carried out starting from VLNDEF data presents two highly deformed sectors with contrasting values in the northern region (Figure 3). The western sector is characterized by a relative compression and contrasts with the eastern sector where extension dominates. Absolute values reach 15 nstrain/yr and both compression and extension directions are around E-W.
These two sectors correspond to the region where active tectonic uplifting has been recognized [2] together with the possible presence of active fault segments including the RGB and the Lillie Fault that roughly locate between the two sectors.
A third sector with minor compressive deformation could be identified to the East. Several sub-ordered zones with extension and compression are scattered in VL and may result from residual velocities below the error. The shear strain rate analysis (Figure 4) confirms the dichotomy of the two sectors with absolute values of shear rate up to 55 nstrain/yr, corresponding to a dextral NE/NS component in the western sector (where the E-W compression occurs). The eastern sector shows a NW dextral component (where the E-W extension has been computed). Once again, the RGB lies between the two sectors.
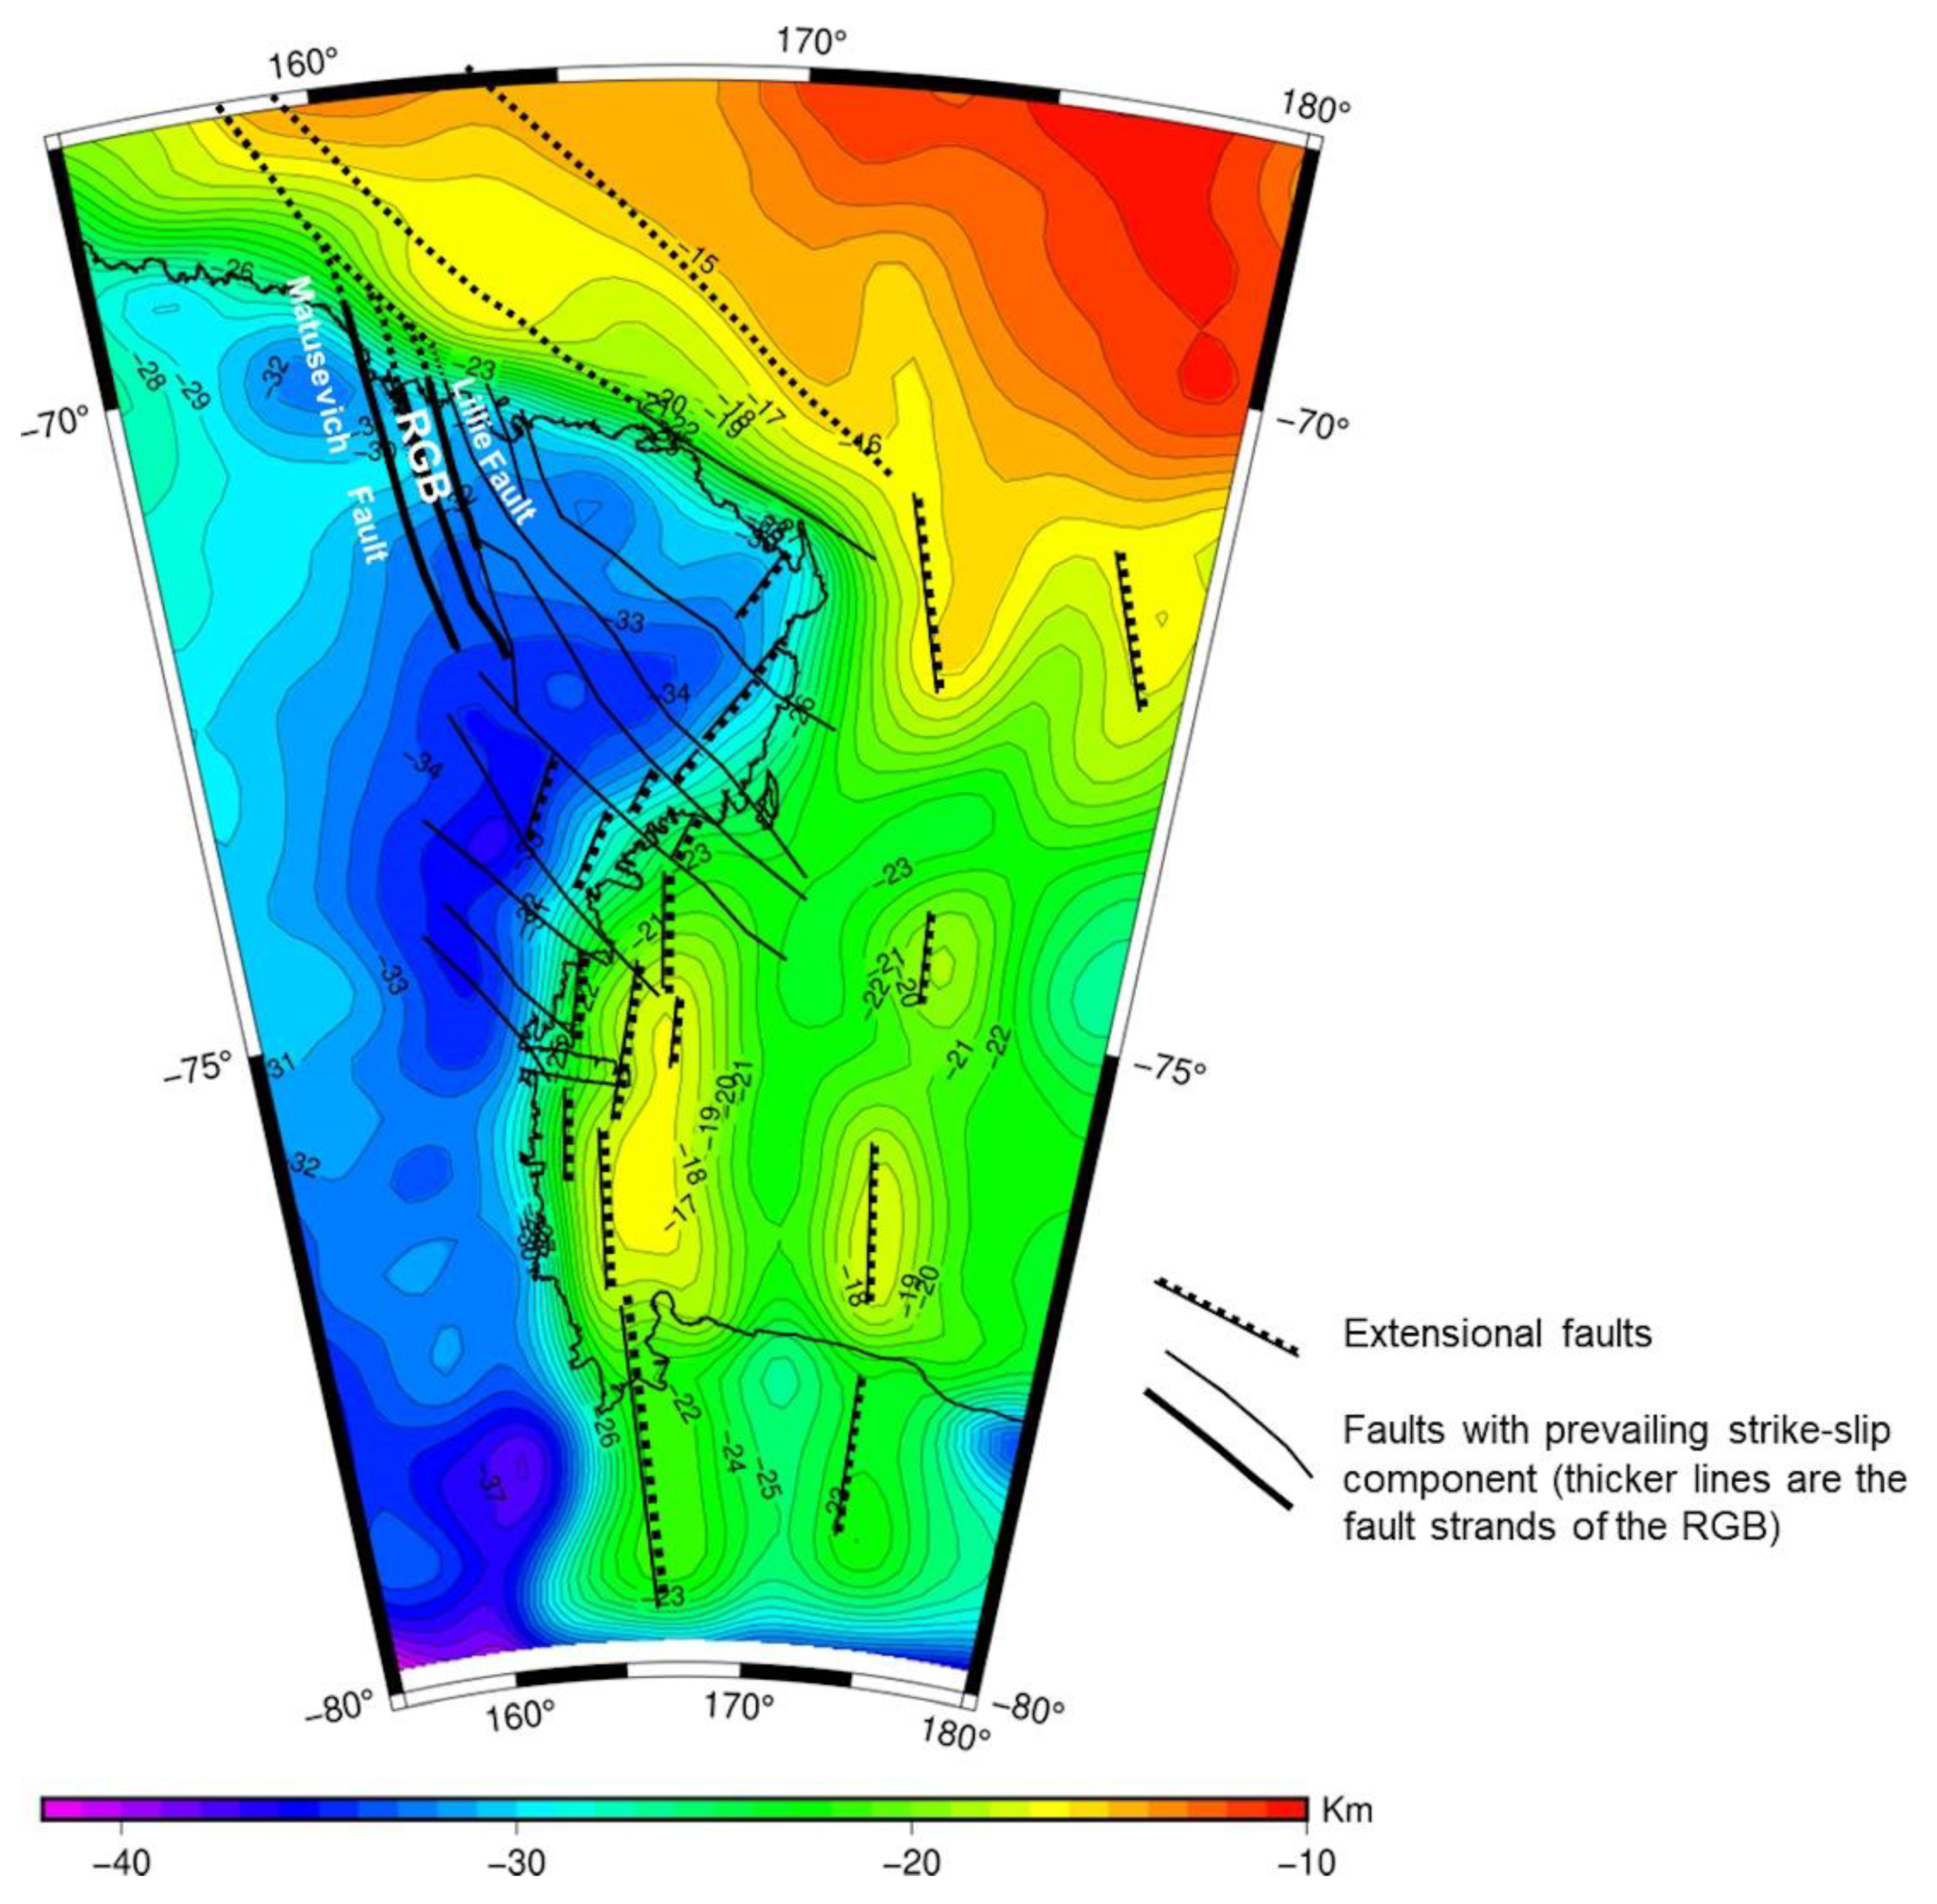
The NW dextral shear in the eastern sector is located at the onland continuation of the Tasman Fracture Zones where the same active movement has been proposed [6,27]. The Moho depth (Figure 5) as derived from gravity anomaly data shows the presence within the investigated region of four main sectors. The first to the N, corresponds to the Southern Ocean with thinned continental crust that fades into oceanic crust and has Moho depths between 11 and 15 km. The Ross Sea is the second sector and corresponds to a thinned continental crust with Moho depths between 17 and 25 km. The presence of local yet large depressions and rises strongly suggest the presence of N-S tectonic discontinuities that ruled the crustal thinning. The third sector corresponds to VL and is characterized by a Moho depth between 30 and 38 km with a strong asymmetry in the crustal thickness between the eastern sector, facing the Ross Sea, and the western one that decreases toward the W. The former is characterized by a strong EW negative gradient of about −0.4 km/km. The latter presents an E-W smoother negative gradient of −0.1 km/km toward the Wilkes Basin. This basin represents the fourth sector and is characterized by a Moho depth that gently decreases from about 30 km to the E up to 27 km in its N-W portion. Moreover, a N-S decrease from 31 km (to the S) to 27 km (N) exists.
The third sector (VL) can be split into a northern and a southern part. The latter is characterized by the largest depth, in which the Moho reaches a depth greater than 35 km in the southernmost zone. Moving toward the north, an irregularly distributed rising of the Moho is observed, with values up to 30 km. The 76°S parallel represents the boundary between the two sectors. The Northern Sector is characterized by the presented differential rising along the western and eastern sides, and its central region presents a rather homogeneous Moho depth at around 35 km. The northern part is characterized by a gentle decreasing of the Moho depth, reaching less that 25 km along the northern coastline. Major changes in depth are present along the Matusevich Glacier to the west, where it isolates a deeper zone of the Moho down to more than 32 Km. A rather N-S elongation of deeper Moho of down to 33 km is present in correspondence of the RGB (centered between 71°–72° S parallels and 162° E meridian). To better highlight the presence of this N-S elongated depression of 1 km in the Moho, we calculated a new Moho depth, with the same inversion method depicted in Section 4, adopting a gravity disturbance upward continued to a reference height of 30 km instead of 50 km. We choose a shallower height to enhance the local Moho changes that could be filtered out by the 50 km height inversion. Then, the difference between the two Moho (50-30) (Figure 6) should enhance short wavelength Moho undulations. Since the 30-km Moho is more affected by its local variation, the resulting (50-30) image enhances their presence, despite the expected differences along the coastline and related to the presence of lighter sediments only on the offshore side. This anomaly may well relate to the presence of a N-S to NNW-SSE step in the Moho of the order of 1 km in correspondence of the RGB.
Performed geodetic and potential gravity field analyses provide some constraints for the geodynamic framework of the VL region and its surroundings.
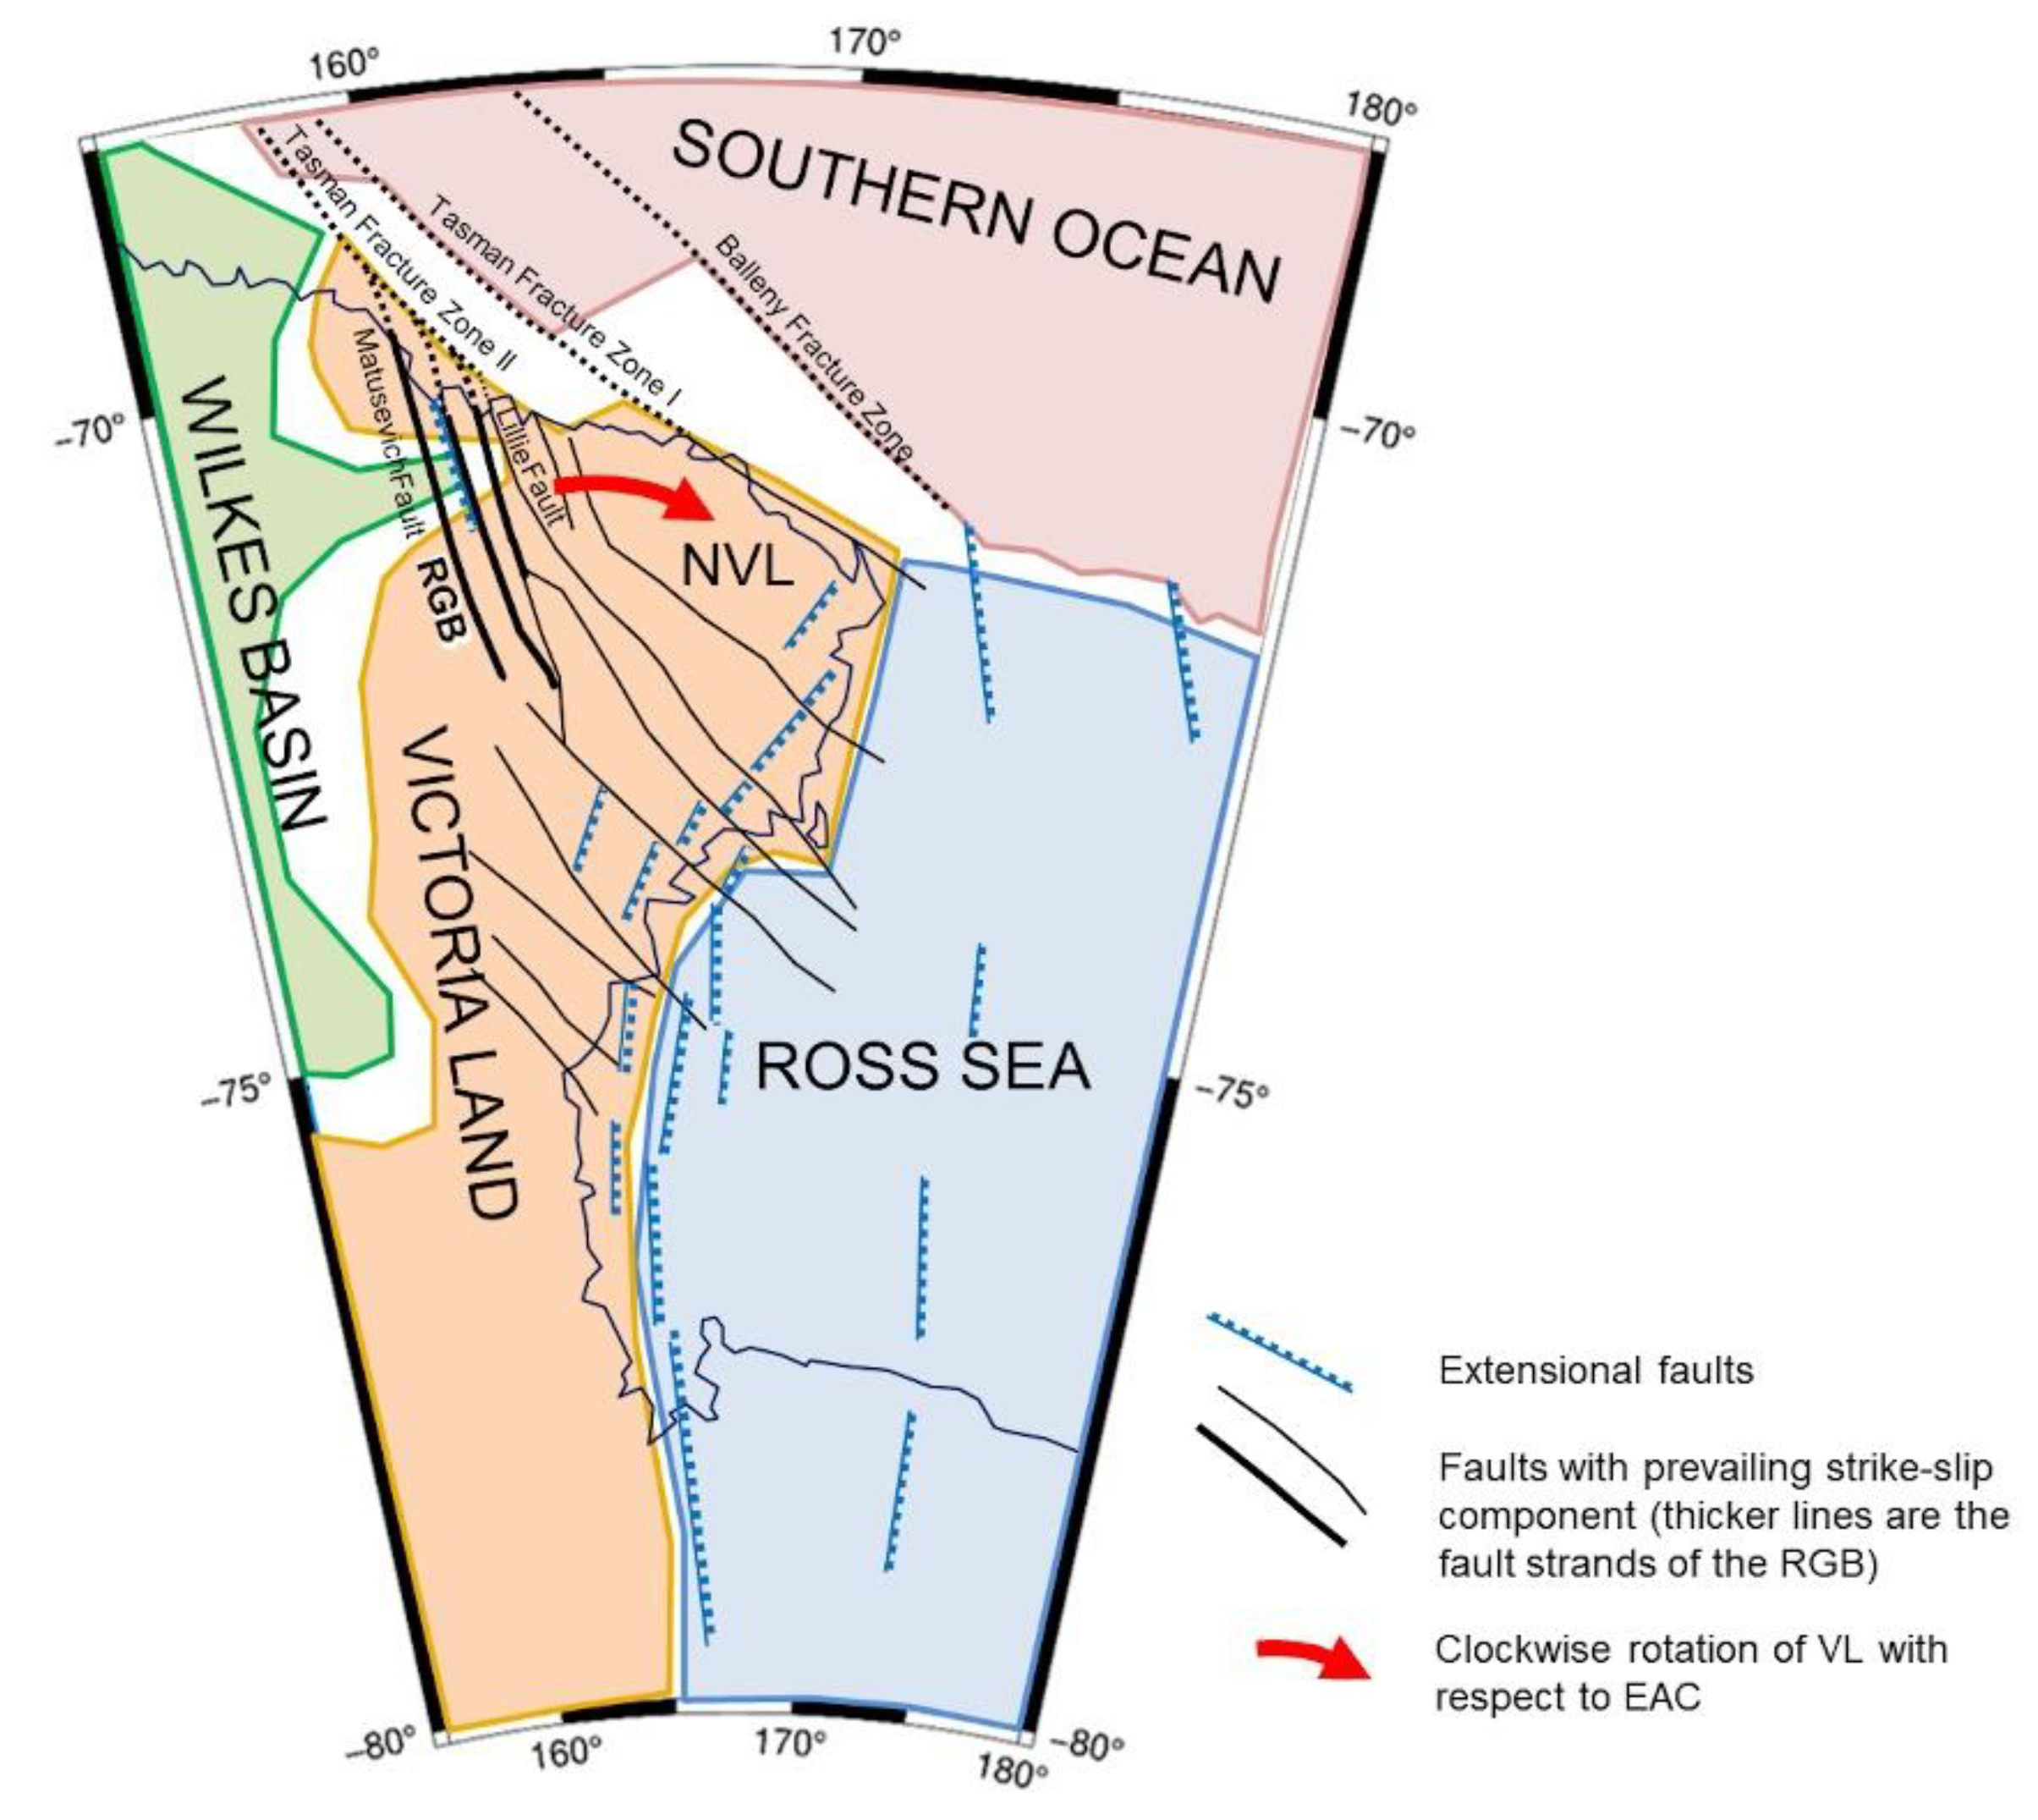
The region is split into four geodynamic blocks with homogenous geodetic and geophysical characteristics (Figure 7). They are: the Southern Ocean to North, the Ross Sea to the E, the Wilkes Basin to the W and the VL in between.
The first block is the southernmost portion of the Southern Ocean included this study. The Moho depth illustrates a continental crust progressively thinning and fading into oceanic crust from the coastline (26 km) to the N-NE with a thickness reduced to 11 km. The Moho isobaths follow the ocean one and describe the right lateral offset along the Tasman and Balleny Fracture Zone. In this way, these tectonic structures rule the staircase geometry and associated horizontal offsets of the crust of the Southern Ocean in this sector. In the Eastern sector the presence of N-S alignment on crustal thinning testifies for the fading of the Balleny Fracture Zone into the N-S extensional tectonics that characterizes the Ross Sea. The Ross Sea represents the second geodynamic block and is bounded, in the studied area, by the Southern Ocean to the N and Victoria Land to the W. The Ross Sea has a thinned continental crust with thickness ranging from 17 to 25 km, and it is characterized by the presence of large, N-S elongated thinned sectors. These features correspond to seafloor depressions and relate to the activity of major N-S normal faults of crustal importance as proved by the presence of volcanic activity of deep-seated origin (e.g., Mt Erebus, Mt Melbourne). The gravimetric data indicate that these N-S trending thinner crust elongations continue to the S, below the Ross Ice Shelf. To the N, the N-S normal fault system merges into the oceanic fracture zone in a transtensional kinematics.
The third, and westernmost geodynamic sector is the Wilkes Basin, which is bounded to the E by VL and to the N by the Southern Ocean. Its crustal thickness varies from 31 km to the E, where it merges with the TAM in NVL, to less than 28 km to the NW. These thicknesses describe a thinned continental crust and confirm its geodynamic setting as an intracratonic basin. The same crustal thinning characterizes also its N-S trend, leaving open the possibility of a possible connection of its origin with transtensional activity of the oceanic fracture zones propagating into the continent.
The high density of geophysical and geodetic data in VL allows us to better highlight and allowed to produce a more detailed analysis for the region, which represents the fourth geodynamic block in the studied area. This block is characterized by continental crust with thickness ranging between 37 km to the S and 30 km to the N.
The region, included between 75.5° S and 78° S, presents a slightly thinner crust down to 33 km. This may testify that VL is constituted by the juxtaposition of two crustal blocks. An alternative hypothesis on this crustal thinning may relate to the SE active propagation of the Wilkes Basin. The eastern margin of VL is characterized by a rather steep thinning toward the Ross Sea block and testifies for the tectonic control of this margin. In the southern sector (S to 75°S) this margin is nearly parallel to the NS tectonic depressions/crustal thinning in the Ross Sea. To the N, the margin rotates to NE following the coastline and shows a smooth thinning. This may relate to the interference in this sector between the N-S Ross Embayment related extensional faults and the SE offshore propagation of the regional strike-slip faults cutting through VL [27].
The northernmost sector of VL is characterized by a homogeneous crustal thickness around 32–33 km with a nearly E-W boarder to the south. In its western area, a NS 1-km thicker elongation is present, which roughly corresponds to the strain inversion zone described by the strain analysis. Again, this corridor corresponds to the RGB. These results confirm the presence of a crustal scale discontinuity in this sector, which is possibly produced by the interaction between the EA motion and the Southern Ocean activity.
This crustal discontinuity could represent the boundary between EA and VL and would allow the limited relative clockwise rotation of VL. This rotation is the effect of the propagation of the Balleny and Tasman Fracture Zone into VL by their merging with the NW-SE regional strike-slip faults. The presence of a strong right-lateral shear in the northernmost NVL, as revealed by the GNSS data analyses, enforces this interpretation.
From W to the N-S elongation of thicker crust, as above mentioned, an E-W elongated area with thinner crust is present and may relate to a secondary E-W propagation of the Wilkes Basin activity that interacts with the NVL tectonics as described in Jordan et al. [19].
The results of our computations confirm an active tectonic regime within Victoria Land characterized by strain field values similar to other regions in the world as California, Italy, Greece [50]. The geodynamic implications provide clues on the active role of the Rennick Geodynamic belt as an important, active tectonic corridor separating the kinematics of North Victoria Land (to the E) and East Antarctica craton (to the W). Moreover, a Cenozoic-to-Recent active extensional tectonics has been advanced for the origin of the Adventure and Aurora subglacial trenches in the eastern part of the East Antarctic craton e.g., [51,52]. These results are undermining the current paradigm of a “tectonically stable cratonic/intraplate” setting in East Antarctica.

6. Conclusions

Results from the analyzed geodetic and potential gravity field data collected in the last decades in the framework of the PNRA field activities allow to address the following issues.
The difference in relative velocities of the 36 VLNDEF and TAMDEF GNSS stations in Victoria Land, obtained by using the two reference Euler poles, VLNDEF18 [14] and VLNDEF20 (present work), reveals the presence of relative rotation of VL with respect to East Antarctic craton (EAC). This motion is well described as a clockwise rotation of 0.045°/Myr around a pole centered at 74°21′13” S and 161°53′17” E. The described different kinematics between the northern part of VL and the EAC (specifically the northern part of the Wilkes Basin) occurs where the active fault segments of the Rennick Geodynamic Belt (RGB) and Lillie Faults are located. Moreover, these fault strands develop at the elongated boundary separating the two regions in the western part of northern VL characterized relative compression (to the W) and extension (to the E), as revealed by the strain rate analysis. In this way, the elongated strip including the RGB and Lillie Faults represents the regional discontinuity separating the kinematics of northern VL and EAC.
The estimate of the Moho depth from gravity measurements took into account the presence of offshore sediments with density contrast of 270 kg/m3 and highlighted the crustal thinning that characterizes the southern part of the Ross Sea.
Four geodynamic blocks with homogeneous geodetic and geophysical characteristics have been better identified. These blocks are: the Southern Ocean to North, the Ross Sea to the E, the Wilkes Basin to the W and the VL in between. In particular the boundary between the Wilkes Basin and VL blocks is articulated and characterized by several indentations.
The boundary between the Wilkes basin (EAC) and VL is characterizes by two main indentations, where relative thinner crust, associated to the Wilkes basin, penetrate in VL. These are located in the northern sector, west to the RGB (71°S, 160°E) and to the south (75°S, 160°E) and show that the relations between EAC and VL are more complex and will require further studies. The integrated analysis of GNSS time series from VLNDEF (Victoria Land Network for DEFormation control) and TAMDEF (Trans Antarctic Mountains DEFormation) and the potential gravity field measurements from Victoria Land and Ross Sea proved an effective tool to highlight the relationship between East Antarctica, VL, and its offshore regions in the Ross Sea and Southern Ocean.
Further geodetic and potential field measurements, including both gravity and magnetic data, and their integration will improve the continuity and spatial homogeneity of the data necessary for better refining the geodynamic model of Victoria Land and its offshore surroundings.

Author Contributions

F.M., M.N., L.V., and A.Z. conceived and designed the paper; A.C., M.D., P.C., F.M., F.S., P.S., L.V., and A.Z. joined in Antarctic Scientific Expeditions; N.C. and P.S. analyzed the geophysical data; P.C. and F.S. developed the geodynamic and tectonic interpretation of the data results partly within the PNRA, G-IDEA project; L.M., M.N., and A.Z. analyzed the GNSS data. L.V. analyzed the Euler poles positions and the strain fields derived by the GNSS absolute velocities. A.C. is the Principal Investigator of geodetic projects supported by PNRA, Co-Chair with Mirko Scheinert (Technische Universität, Dresden, Germany) of the Geodetic Infrastructure of Antarctica (GIANT) Expert Group within the Scientific Committee on Antarctic Research (SCAR). All authors contributed to the writing of the paper. All authors have read and agreed to the published version of the manuscript.

Funding

Part of this work was supported by the Programma Nazionale di Ricerche in Antartide (PNRA).

Data Availability Statement

Data sharing not applicable.

Acknowledgments

Several researchers contributed to the field activities. The figures were produced with the Generic Mapping Tool software [53].

Conflicts of Interest

The authors declare no conflict of interest.

References

  1. Negusini, M.; Mancini, F.; Gandolfi, S.; Capra, A. Terra Nova Bay GPS permanent station (Antarctica): Data quality and first attempt in the evaluation of regional displacement. J. Geodyn. 2005, 39, 81–90. [Google Scholar] [CrossRef]
  2. Zanutta, A.; Negusini, M.; Vittuari, L.; Cianfarra, P.; Salvini, F.; Mancini, F.; Sterzai, P.; Dubbini, M.; Galeandro, A.; Capra, A. Monitoring geodynamic activity in the Victoria Land, East Antarctica: Evidence from GNSS measurements. J. Geodyn. 2017. [Google Scholar] [CrossRef]
  3. Martín-Español, A.; Zammit-Mangion, A.; Clarke, P.J.; Flament, T.; Helm, V.; King, M.A.; Luthcke, S.B.; Petrie, E.; Rémy, F.; Nana, S.; et al. Spatial and temporal Antarctic Ice Sheet mass trends, glacio-isostatic adjustment, and surface processes from a joint inversion of satellite altimeter, gravity, and GPS data. J. Geophys. Res. Earth Surf. 2016, 121, 182–200. [Google Scholar] [CrossRef] [PubMed] [Green Version]
  4. Bevis, M.; Kendrick, E.; Smalley, R., Jr.; Dalziel, I.; Caccamise, D.; Sasgen, I.; Helsen, M.; Taylor, F.W.; Zhou, H.; Brown, A.; et al. Geodetic measurements of vertical crustal velocity in West Antarctica and the implications for ice mass balance. Geochem. Geophys. Geosyst. 2009, 10. [Google Scholar] [CrossRef]
  5. Capra, A.; Mancini, F.; Negusini, M. GPS as a geodetic tool for geodynamic in Northern Victoria Land, Antarctica. Antarct. Sci. 2007, 19, 107–114. [Google Scholar] [CrossRef]
  6. Dubbini, M.; Cianfarra, P.; Casula, G.; Capra, A.; Salvini, F. Active tectonics in northern Victoria Land (Antarctica) inferred from the integration of GPS data and geologic setting. J. Geophys. Res. Solid Earth 2010, 115, B12. [Google Scholar] [CrossRef]
  7. Sjöberg, L.; Walyeldeen, H.; Horemuz, M. Estimation of crustal motions at the permanent GPS station SVEA, Antarctica from 2005 to 2009. J. Geod. Sci. 2011, 1, 215–220. [Google Scholar] [CrossRef]
  8. Zanutta, A.; Vittuari, L.; Gandolfi, S. Geodetic GPS-based analysis of recent crustal motions in Victoria Land (Antarctica). Glob. Planet. Chang. 2008, 62, 115–131. [Google Scholar] [CrossRef]
  9. Amalvict, M.; Willis, P.; Wöppelmann, G.; Ivins, E.R.; Bouin, M.N.; Testut, L.; Hinderer, J. Isostatic stability of the East Antarctic station Dumont d’Urville from longterm geodetic observations and geophysical models. Polar Res. 2009, 28, 193–202. [Google Scholar] [CrossRef]
  10. Argus, D.F.; Peltier, W.R.; Drummond, R.; Moore, A.W. The Antarctica component of postglacial rebound model ICE-6G_C (VM5a) based upon GPS positioning, exposure age dating of ice thicknesses, and relative sea level histories. Geophys. J. Int. 2014, 198, 537–563. [Google Scholar] [CrossRef]
  11. King, M.A.; Altamimi, Z.; Boehm, J.; Bos, M.; Dach, R.; Elosegui, P.; Fund, F.; Hernández-Pajares, M.; Lavallée, D.; Mendes Cerveira, P.J.; et al. Improved constraints to models of glacial isostatic adjustment: A review of the contribution of ground-based geodetic observations. Surv. Geophys. 2010, 31, 465–507. [Google Scholar] [CrossRef]
  12. King, M.A.; Whitehouse, P.L.; Van der Wal, W. Incomplete separability of Antarctic plate rotation from glacial isostatic adjustment deformation within geodetic observations. Geophys. J. Int. 2016, 324–330. [Google Scholar] [CrossRef] [Green Version]
  13. Thomas, I.D.; King, M.A.; Bentley, M.J.; Whitehouse, P.L.; Penna, N.T.; Williams, S.D.P.; Riva, R.E.M.; Lavallee, D.A.; Clarke, P.J.; King, E.; et al. Widespread low rates of Antarctic glacial isostatic adjustment revealed by GPS observations. Geophys. Res. Lett. 2011, 38. [Google Scholar] [CrossRef] [Green Version]
  14. Zanutta, A.; Negusini, M.; Vittuari, L.; Martelli, L.; Cianfarra, P.; Salvini, F.; Mancini, F.; Sterzai, P.; Dubbini, M.; Capra, A. New Geodetic and Gravimetric Maps to Infer Geodynamics of Antarctica with Insights on Victoria Land. Remote Sens. 2018, 10, 1608. [Google Scholar] [CrossRef] [Green Version]
  15. Aitken, A.R.A.; Betts, P.G.; Young, D.A.; Blankenship, D.D.; Roberts, J.L.; Siegert, M.J. The Australo-Antarctic Columbia to Gondwana transition. Gondwana Res. 2016, 29, 136–152. [Google Scholar] [CrossRef] [Green Version]
  16. Baranov, A.; Tenzer, R.; Bagherbandi, M. Combined Gravimetric–Seismic Crustal Model for Antarctica. Surv. Geophys. 2018, 39, 23–56. [Google Scholar] [CrossRef] [Green Version]
  17. Ferraccioli, F.; Finn, C.A.; Jordan, T.A.; Bell, R.E.; Anderson, L.M.; Damaske, D. East Antarctic rifting triggers uplift of the Gamburtsev Mountains. Nature 2011, 479, 388–392. [Google Scholar] [CrossRef]
  18. Golynsky, A.V.; Ferraccioli, F.; Hong, J.K.; Golynsky, D.A.; von Frese, R.R.B.; Young, D.A.; Blankenship, D.D.; Holt, J.W.; Ivanov, S.V.; Kiselev, A.V.; et al. New magnetic anomaly map of the Antarctic. Geophys. Res. Lett. 2018, 45, 6437–6449. [Google Scholar] [CrossRef]
  19. Jordan, T.A.; Ferraccioli, F.; Armadillo, E.; Bozzo, E. Crustal architecture of the Wilkes Subglacial Basin in East Antarctica, as revealed from airborne gravity data. Tectonophysics 2013, 585, 196–206. [Google Scholar] [CrossRef]
  20. Scheinert, M.; Ferraccioli, F.; Schwabe, J.; Bell, R.; Studinger, M.; Damaske, D.; Jokat, W.; Aleshkova, N.; Jordan, T.; Leitchenkov, G.; et al. New Antarctic Gravity Anomaly Grid for Enhanced Geodetic and Geophysical Studies in Antarctica. Geophys. Res. Lett. 2016, 43, 600–610. [Google Scholar] [CrossRef] [Green Version]
  21. Shen, W.; Wiens, D.A.; Anandakrishnan, S.; Aster, R.C.; Gerstoft, P.; Bromirski, P.D.; Hansen, S.E.; Dalziel, I.W.D.; Heeszel, D.S.; Huerta, A.D.; et al. The crust and upper mantle structure of central and West Antarctica from Bayesian inversion of Rayleigh wave and receiver functions. J. Geophys. Res. Solid Earth 2018, 123, 7824–7849. [Google Scholar] [CrossRef]
  22. Llubes, M.; Florsch, N.; Legresy, B.; Lemoine, J.M.; Loyer, S.; Crossley, D.; Rémy, F. Crustal thickness in Antarctica from CHAMP gravimetry. Earth Planet. Sci. Lett. 2003, 212, 103–117. [Google Scholar] [CrossRef] [Green Version]
  23. Hirt, C.; Rexer, M.; Scheinert, M.; Pail, R.; Claessens, S.; Holmes, S. A new degree-2190 (10 km resolution) gravity field model for Antarctica developed from GRACE, GOCE and Bedmap2 data. J. Geod. 2016, 90, 105–127. [Google Scholar] [CrossRef]
  24. Block, A.E.; Bell, R.E.; Studinger, M. Antarctic crustal thickness from satellite gravity: Implications for the Transantarctic and Gamburtsev Subglacial Mountains. Earth Planet. Sci. Lett. 2009, 288, 194–203. [Google Scholar] [CrossRef]
  25. O’Donnell, J.P.; Nyblade, A.A. Antarctica’s hypsometry and crustal thickness: Implications for the origin of anomalous topography in East Antarctica. Earth Planet. Sci. Lett. 2014, 388, 143–155. [Google Scholar] [CrossRef]
  26. Pappa, F.; Ebbing, J.; Ferraccioli, F. Moho depths of Antarctica: Comparison of seismic, gravity, and isostatic results. Geochem. Geophys. Geosyst. 2019, 20, 1629–1645. [Google Scholar] [CrossRef] [Green Version]
  27. Salvini, F.; Brancolini, G.; Busetti, M.; Storti, F.; Mazzarini, F.; Coren, F. Cenozoic geodynamics of the Ross Sea Region, Antartica: Crustal extension, intraplate strike-slip faulting tectonic inheritance. J. Geophys. Res. 1997, 102, 24669–24696. [Google Scholar] [CrossRef]
  28. Storti, F.; Salvini, F.; Rossetti, F.; Phipps Morgan, J. Intraplate termination of transform faulting within the Antarctic continent. Earth Planet. Sci. Lett. 2007, 260, 115–126. [Google Scholar] [CrossRef]
  29. Gantar, C.; Zanolla, C. Gravity and Magnetic Exploration in the Ross Sea (Antarctica). Boll. Geof. Teor. Appl. 1993, 219, 230. [Google Scholar]
  30. Scheinert, M. Progress and prospects of the Antarctic Geoid Project (Commission Project 2.4). In Geodesy for Planet Earth; Kenyon, S., Pacino, M.C., Marti, U., Eds.; Springer: Berlin, Germany, 2012; pp. 451–456. [Google Scholar] [CrossRef]
  31. Forsberg, R.; Olesen, A.V.; Yildiz, H.; Tscherning, C.C. Polar gravity fields from GOCE and airborne gravity. In Proceedings of the 4th International GOCE User Workshop, Munich, Germany, 31 March–1 April 2011. [Google Scholar]
  32. Mancini, F. Geodetic activities: A new GPS network for crustal deformation control in northern Victoria Land. Terra Antart. Rep. 2001, 5, 23–28. [Google Scholar]
  33. Capra, A.; Dubbini, M.; Galeandro, A.; Gusella, L.; Zanutta, A.; Casula, G.; Negusini, M.; Vittuari, L.; Sarti, P.; Mancini, F.; et al. VLNDEF Project for Geodetic Infrastructure Definition of Northern Victoria Land, Antarctica. In Geodetic and Geophysical Observations in Antarctica. An Overview in the IPY Perspective; Capra, A., Dietrich, R., Eds.; Springer: Berlin/Heidelberg, Germany, 2008. [Google Scholar] [CrossRef]
  34. Dach, R.; Lutz, S.; Walser, P.; Fridez, P. Bernese GNSS Software Version 5.2; User manual, Astronomical Institute, University of Bern, Bern Open Publishing: Bern, Switzerland, 2015; ISBN 978-3-906813-05-9. [Google Scholar] [CrossRef]
  35. Sandwell, D.T.; Müller, R.D.; Smith, W.H.F.; Garcia, E.; Francis, R. New global marine gravity model from Cryo-Sat-2 and jason-1 reveals buried tectonic structure. Science 2014, 346, 65–67. [Google Scholar] [CrossRef] [PubMed]
  36. Uieda, L.; Barbosa, V.C.F. Fast nonlinear gravity inversion in spherical coordinates with application to the South American Moho. Geophys. J. Int. 2017, 208, 162–176. [Google Scholar] [CrossRef] [Green Version]
  37. Li, X.; Götze, H. Ellipsoid, geoid, gravity, geodesy, and geophysics. Geophysics 2001, 66, 1660–1668. [Google Scholar] [CrossRef]
  38. Blakely, R. Potential Theory in Gravity and Magnetic Applications; Cambridge University Press: Cambridge, UK, 1995. [Google Scholar] [CrossRef]
  39. Uieda, L.; Barbosa, V.C.F.; Braitenberg, C. Tesseroids: Forward-modeling gravitational fields in spherical coordinates. Geophysics 2016, 81, F41–F48. [Google Scholar] [CrossRef]
  40. Fretwell, P.; Pritchard, H.D.; Vaughan, D.G.; Bamber, J.L.; Barrand, N.E.; Bell, R.; Bianchi, C.; Bingham, R.G.; Blankenship, D.D.; Casassa, G.; et al. Bedmap2: Improved ice bed, surface and thickness datasets for Antarctica. Cryosphere 2013, 7, 375–393. [Google Scholar] [CrossRef] [Green Version]
  41. Lindeque, A.; Gohl, K.; Wobbe, F.; Uenzelmann-Neben, G. Preglacial to glacial sediment thickness grids for the Southern Pacific Margin of West Antarctica. Geochem. Geophys. Geosyst. 2016, 17, 4276–4285. [Google Scholar] [CrossRef] [Green Version]
  42. Araszkiewcz, A.; Figurski, M.; Jarosinski, M. Erroneous GNSS Strain Rate Patterns and their Application to Investigate the Tectonic Credibility of GNSS Velocities. Acta Geophys. 2016, 64, 1412–1429. [Google Scholar] [CrossRef] [Green Version]
  43. Cardozo, N.; Allmendinger, R.W.W. SSPX: A program to compute strain from displacement/velocity data. Comput. Geosci. 2009, 35, 1343–1357. [Google Scholar] [CrossRef]
  44. Goudarzi, M.; Cocard, M.; Santerre, R. EPC: Matlab software to estimate Euler pole parameters. GPS Solut. 2014, 18, 153–162. [Google Scholar] [CrossRef]
  45. Shen, Z.K.; Jackson, D.D.; Ge, B.X. Crustal deformation across and beyond the Los Angeles basic from geodetic measurements. J. Geophys. Res. 1996, 101, 27957–27980. [Google Scholar] [CrossRef]
  46. Allmendinger, R.W.; Smalley, R.; Bevis, M.; Nicole, H.; Brooks, B. Bending the Bolivian oro-cline in real time. Geology 2005, 33, 905–908. [Google Scholar] [CrossRef] [Green Version]
  47. Allmendinger, R.W.; Reilinger, R.; Loveless, J. Strain and rotation rate from GPS in Tibet, Anatolia, and the Altiplano. Tectonics 2007, 26, TC3013. [Google Scholar] [CrossRef] [Green Version]
  48. Trey, H.; Cooper, A.K.; Pellis, G.; della Vedova, B.; Cochrane, G.; Brancolini, G.; Makris, J. Transect across the West Antarctic rift system in the Ross Sea, Antarctica. Tectonophysics 1999, 301, 61–74. [Google Scholar] [CrossRef]
  49. Ji, F.; Li, F.; Gao, J.; Zxhang, Q.; Hao, W. 3-D density structure of the Ross Sea basins, West Antarctica from constrained gravity inversion and their tectonic implications. Geophys. J. Int. 2018, 215, 1241–1256. [Google Scholar] [CrossRef]
  50. D’Agostino, N.; Métois, M.; Koci, R.; Duni, L.; Kuka, N.; Ganas, A.; Georgiev, I.; Jouanne, F.; Kaludjerovic, N.; Kandić, R. Active crustal deformation and rotations in the southwestern Balkans from continuous GPS measurements. Earth Planet. Sci. Lett. 2020, 539, 116246. [Google Scholar] [CrossRef]
  51. Cianfarra, P.; Maggi, M. Cenozoic extension along the reactivated Aurora Fault System in the East Antarctic Craton. Tectonophysics 2017, 703, 135–153. [Google Scholar] [CrossRef]
  52. Cianfarra, P.; Salvini, F. Origin of the Adventure Subglacial Trench linked to Cenozoic extension in the East Antarctic Craton. Tectonophysics 2016, 670, 30–37. [Google Scholar] [CrossRef]
  53. Wessel, P.; Smith, W.H.F. Free software helps map and display data. EOS Trans. Am. Geophys. Union 1991, 72, 441–446. [Google Scholar] [CrossRef]
Figure 1. (A) Geographical distribution of the Global Navigation Satellite Systems (GNSS) stations used for estimating the Eulerian Pole (VLNDEF18), [14], 95 of which are in Antarctica. Victoria Land (VL), the object of this study, is represented in a black frame, bottom-right inset. Yellow triangles identify the International GNSS Service (IGS) stations adopted to frame the network within the ITRF14 datum; IGS, POLENET, and VLNDEF GNSS stations are respectively represented by purple diamonds, red and cyan circles; blue and orange stars in the bottom of the figure show VLNDEF18 and VLNDEF20 (proposed in this work) Euler poles. (B) Map of VL shows the 36 GNSS stations used in this work and the location of the gravimetric data collected during the last 20 years within the PNRA projects. Yellow circles identify the locations of terrestrial gravimetric measurements; yellow polylines show the tracks of shipborne gravimetric data acquisition; red and cyan circles identify POLENET, and VLNDEF GNSS stations.
Remotesensing 13 00087 g001
Figure 2. The difference between the relative velocities of the GNSS stations obtained using VLNDEF18 Euler pole and those obtained using the VLNDEF20 pole. Significant vectors are highlighted in red according to the ±σ criterion; blue star in the middle of the figure identifies the Euler pole of the differences.
Remotesensing 13 00087 g002
Figure 3. Dilatation rate field computed for Victoria Land. Red and blue colors indicate, respectively, extension or compression statistically significant values at 1σ. Blanked grid cells correspond to area with statistically not significant values.
Remotesensing 13 00087 g003
Figure 4. Maximum shear strain rates of Victoria Land. Green lines depict the directions of maximum right lateral shear values while yellow to black colors show the magnitude of statistically significant values at 1σ. Blanked grid cells correspond to area with statistically not significant values.
Remotesensing 13 00087 g004
Figure 5. The estimated Moho depth in the Ross -TAM region derived from the inversion of gravity data and known Moho depth from the combined dataset of Pappa et al. [26]. The gravity disturbance used in the computation is upward continued to a reference height of 50 km.
Remotesensing 13 00087 g005
Figure 6. Difference between two Moho depth estimates assuming 30 km and 50 km for the reference height of the gravity disturbance upward continuation.
Remotesensing 13 00087 g006
Figure 7. Geodynamic framework of VL region and its surroundings, characterized by four blocks with homogeneous geodetic and geophysical characteristics. The blocks are: the Southern Ocean to North (pink), the Ross Sea to the E (cyan), the Wilkes Basin to the W (green), and VL in between (orange).
Remotesensing 13 00087 g007
Table 1. Rotational and geographic coordinates of the Euler poles (“mas yr−1”= milliarcsecond/yr; “° Myr−1” = degree/Millions yr). VLNDEF18 from Zanutta et al. [14]; VLNDEF20 in this work.
ModelNS (a)ωx (mas yr−1)ωy (mas yr−1)ωz (mas yr−1)ω (° Myr−1)Lon (°)Lat (°)
VLNDEF1895−0.260−0.3250.6380.21251.401856.8956
±0.005±0.004±0.016±0.0040.68150.6290
VLNDEF2036−0.217−0.3390.7980.24857.365263.2239
±0.012±0.004±0.039±0.0091.64390.9491
(a) Number of sites.
Table 2. Coordinates and relative velocities of GNSS stations adopted to evaluate the strain rate field of VL. These rates were obtained using relative velocities obtained with VLNDEF20 Euler Pole estimation. TNB1 and VLXX sites are VLNDEF stations; the others are POLENET. Velocities and errors are in mm/yr.
IDLon (°)Lat (°)H (m)Ve±σeVn±σn
TNB1164.1029−74.698872.249470.030.06−0.180.06
VL01169.7251−72.4501596.9040.150.05−0.190.07
VL02167.3781−72.56492047.1830.240.051.000.06
VL03162.9264−72.95052469.5910.570.05−0.010.06
VL04169.7487−73.51821834.540.260.05−0.390.07
VL05169.6122−73.0631478.47830.110.050.120.07
VL06164.6907−74.352671.0240.180.06−0.120.06
VL07165.3793−73.75992039.205−0.700.050.040.06
VL08163.7395−73.76432655.370.230.050.040.06
VL09162.1694−73.33082270.461−0.020.050.140.06
VL10162.7686−73.68852619.389−0.300.050.100.06
VL11162.5417−74.37142362.3130.020.060.520.06
VL12163.727−72.27441932.9670.050.05−0.860.06
VL13162.205−74.84781460.353−0.330.060.430.06
VL14165.9057−73.22822084.0130.390.05−0.200.06
VL15163.7157−74.9343−28.0657−0.400.06−0.060.06
VL16162.5455−75.2326311.31520.660.07−0.390.06
VL17161.5387−75.0951683.5092−0.490.070.170.06
VL18162.5937−75.898558.0139−0.080.080.110.06
VL19161.7816−75.805809.8439−0.250.080.260.06
VL21163.7329−71.66871899.384−2.690.060.240.06
VL22162.0404−71.4219274.8542−0.150.06−0.060.06
VL23170.3047−71.34581118.9840.110.060.160.07
VL29163.8963−71.15411624.468−0.020.070.030.06
VL30162.5251−70.59871491.51−0.670.07−0.590.06
VL32166.1646−71.73311784.0290.660.06−0.720.06
VLHG162.2017−75.398165.6562−0.100.07−0.170.06
BRIP158.4691−75.79572110.894−0.080.08−0.380.07
BURI155.8942−79.14742006.296−0.360.14−0.490.08
COTE161.9978−77.80591878.3720.420.110.050.06
FIE0168.4235−76.1446153.81060.450.080.520.06
FLM5160.2714−77.53271869.704−0.340.11−0.070.06
FTP4162.5647−78.9277243.185−0.140.140.010.06
MCM4166.6693−77.838497.978450.180.12−0.150.06
MIN0167.1638−78.6503676.8787−0.190.130.410.06
ROB4163.1901−77.0344−41.61820.460.10−0.320.06
Publisher’s Note: MDPI stays neutral with regard to jurisdictional claims in published maps and institutional affiliations.