Abstract
This communication emanates from the lack of a European-scale study for investigating the potential threats that subsurface archaeological remains face today due to soil loss by water. This research analyses the impact of soil loss on potential subsurface archaeological evidence by integrating open geospatial datasets deriving from two pertinent European studies. The first study’s dataset is related to soil erosion (soil loss provoked by water activity), which was reclassified into three groups alluding the level of threat on potential subsurface archaeological contexts, as follows: (1) areas presenting soil loss from 0 until 5 t/h per year, which are characterised as low threat areas; (2) areas presenting soil loss from 5 until 10 t/h per year, which are characterised as moderated threat; and (3) areas presenting soil loss beyond 10 t/h per year, which are considered as high-risk areas. The second study’s dataset refers to the capacity of soils to preserve specific archaeological materials, classified in four categories based on the properties of the archaeological material (bones, teeth, and shells (bones); organic materials (organics); metals (Cu, bronze, and Fe) (metals); and stratigraphic evidence (strati). Both datasets were imported into a Geographical Information System (GIS) for further synthesis and analysis, while the average threat of soil loss per year was evaluated in a country level (nomenclature of territorial units for statistics (NUTS) level 0). The overall results show that approximately 10% of European soils that potentially preserve archaeological remains are in high threat due to soil loss, while similar patterns—on a European level—are found for areas characterised with moderate to high risk from the soil loss. This study is the first attempt to present a proxy map for subsurface cultural material under threat due to soil loss, covering the entire European continent.
1. Introduction
Soil erosion by water is a natural action and a widespread problem throughout Europe and beyond. The activity of soil erosion involves detachment of material by two processes: raindrop impact and flow traction [1]. Scholars discussed soil erosion by water, emphasising the development or assessment of various models, targeted to soil erosion predictions on a local or wider scale [2,3,4,5,6,7,8,9].
Soil erosion models play an important role in soil erosion predictions. Despite the complexity of the phenomenon, various models have been suggested in the past regarding better estimation and prediction of soil loss [10,11]. As Reference [12] argued, in a context where process-based physical models and the availability of input data are not yet mature enough for global-scale applications, empirical methods for predicting soil erosion such as the Revised Universal Soil Loss Equation (RUSLE) [13] can provide reasonably accurate estimations for most practical purposes. The RUSLE model is developed based upon five factors: (1) rainfall erosivity factor (R), (2) soil erodibility factor (K), (3) slope length and steepness factor (LS), (4) cover management factor (C), and (5) conservation practice factor (P) for the estimation of the average annual soil loss (A) [14].
While the discussion is still ongoing regarding the improvements of such models, in the last years, soil erosion databases have become accessible on a European level. These models aim to provide a long-term estimation for soil loss by water instead of examining in detail short-periods of soil loss by water. As Reference [15] mentioned, the approach of using large-scale soil erosion modelling is fundamental for decision makers to address common policies and strategies. Models at these scales operating on standard datasets constitute a methodology that provides a basis for estimating soil erosion and identifies areas where detailed studies and remedial measures are needed. Indeed, European and global soil erosion maps and geodata sets are nowadays accessible by the European Soil Data Centre (ESDAC) [16].
As Reference [17] argued, soil erosion remains one of the most important factors that threaten archaeological sites, since both soil loss and soil deposition might alter the archaeological context of an area. Archaeological context refers to visible archaeological sites and standing monuments as well as to areas with potential archaeological interest (still unexcavated subsurface remains). As Reference [18] emphasised, the protection of subsurface archaeological remains—which constitute one of the most vulnerable types of archaeological resources—remains one of the great challenges of heritage management. Although soil erosion has been investigated in the past, since it is a well-known problem that affects archaeological sites or areas with potential archaeological interest, still, there is a limited discussion regarding its quantitative assessment [19,20].
Even though nowadays the documentation of standing monuments via new technologies (e.g., close-range photogrammetry; terrestrial laser scanners, etc. [21,22]) has progressed, the identification of subsurface archaeological areas is still challenging. Over the last years, a plethora of scientific efforts attempted a better detection and characterisation of subsurface archaeological remains through a variety of remote-sensing techniques. The latest include satellite imageries [23,24], aerial observations [25,26,27], unmanned aerial vehicles (UAVs) [28], and ground-based geophysical prospections [29,30]. In addition, predictive modelling was used through Geographical Information System (GIS) to identify areas with potential archaeological evidence [31].
Whilst reliable assessment to identify potential subsurface archaeological remains is a key component in modern archaeological landscape management [18], the current methods are applicable solely to local-scale assessments. However, a recent research work conducted by Reference [32] has overcome this scale limitation, providing archaeological proxies at a European level. In their study, Reference [32] has classified European soils based on their capacity to preserve potential subsurface archaeological remains. This was achieved by investigating how the various archaeological materials might be affected by the pertinent soil type, according to a standard taxonomic classification. Therefore, soil properties can provide evidence whether a specific soil type can preserve archaeological evidence and on what level, thus predicting the state of preservation of buried archaeological materials, if any, within the specific soil context.
In this study, the authors suggest and visualise a hypothetic analysis of soil loss and the consequent level of threat on subsurface archaeological remains. Towards this direction, the study integrated the works of References [16,32]. While the results of References [16,32] are biased on the uncertainty and assumptions of the models used, the current analysis paves the way to implement extensive-scale studies related to threats of subsurface archaeological materials, being the first one applied on a European level.
This article, therefore, evaluates the soil erosion threat to potential subsurface archaeological remains on a European scale. To do so, existing geodatasets were further processed and integrated into a Geographical Information System (GIS). Considerations on data limitations and accuracy/uncertainty as well as potential future improvements of these datasets are outlined in the Discussion section. The new findings are available for reuse by the scientific community based on open-access policy.
2. Materials and Methods
2.1. Data Related to the Preservation Capacity of European Soils
Open spatial European datasets related to the capacity of various soil types to preserve archaeological materials and stratigraphic evidence were downloaded from the European Soil Data Centre (ESDAC) based on the outcomes of Reference [32] upon request. Based on various soil properties related to the preservation capacities of the different soil types, the datasets were used as a proxy for archaeological subsurface evidence in case the objects are buried in a specific soil context. The soil properties considered by Reference [32] were hydrology, acidity and alkalinity, solute types and concentrations, the levels of dissolved organic matter in the soil, the vulnerability of soil to erosion, stiffness, as well as other factors that favor preservation of stratigraphic evidence. The soil classification was based on the Soil Geographical Database of Eurasia (SGDBE), which is the only harmonised soil database for Europe [33]. It contains a geographic database SGDBE (polygons) to which soil attributes are attached. The 1 km × 1 km rasters are available upon request and after registration to the system [34].
In the study of Reference [32], subsurface cultural evidence was classified in four different categories, namely (1) bones, teeth, and shells (bones); (2) organic materials (organics); (3) metals (Cu, bronze, and Fe) (metals); and (4) stratigraphic evidence (strati). The latest describes archaeological contexts that are interpretable from the chronological succession of layers of deposited material in soil and can be better preserved in soils that are receiving continuing inputs of parent material such as sediments during flood events. More information regarding the methodology adopted and details on the grouping of subsurface archaeological evidence can be found in Reference [32].
Figure 1 and Figure 2 visualise the outcomes from Reference [32] for the preservation capacities for buried materials and stratigraphy based on the soil properties across Europe. Numeric values were assigned to each preservation category (poor = 1, fair = 2, and good = 3). The latest was defined concerning endpoints (i.e., destruction) within 102 y (poor), after 102 and before 2000 y (103.3 y) (fair), and after 103.3 y (good). Areas covered by artificial surfaces, permanent ice or snow, as well as water bodies were excluded from the analysis (these areas have a value that equals 0) (for more details, refer to Reference [32]).
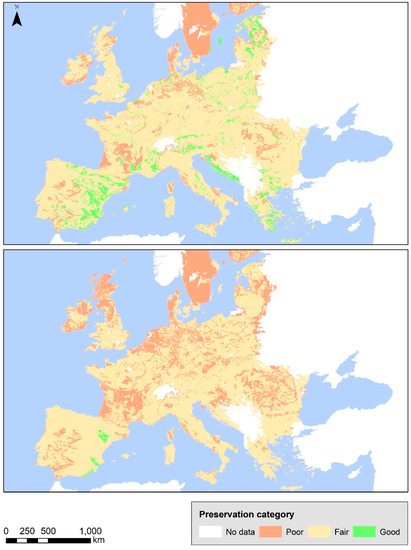
Figure 1.
Preservation capacities of buried materials and stratigraphy across Europe for metals (top) and bones (bottom) (data source: References [32,35]).
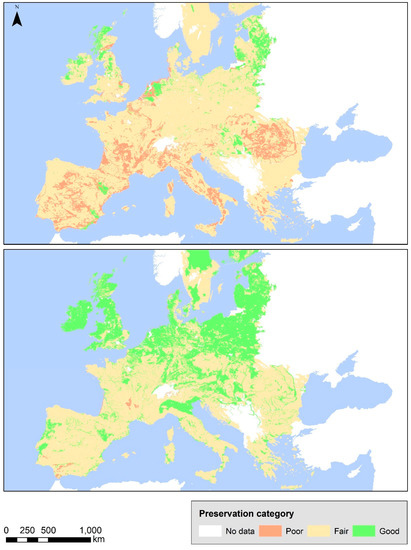
Figure 2.
Preservation capacities of buried materials and stratigraphy across Europe for organic materials (top) and stratigraphic evidence (bottom) (data source: References [32,35]).
2.2. Data Related to Soil Loss by Water in Europe
Soil loss provoked by water activity expressed in tons per hectare per year was requested and downloaded through the European Soil Data Centre (ESDAC), modeled after Reference [16]. The estimation of soil loss was based on a modified version of the RUSLE model (RUSLE2015), and it was used to estimate soil loss in Europe for the year 2010. The modified model improved the quality of estimation on a high-resolution (100 m) dataset [36]. Figure 3 illustrates the results, grouped in the following five classes: (1) 0–2 t/ha per year, (2) 2–5 t/ha per year, (3) 5–10 t/ha per year, (4) 10–50 t/ha per year, and (5) >50 t/ha per year.
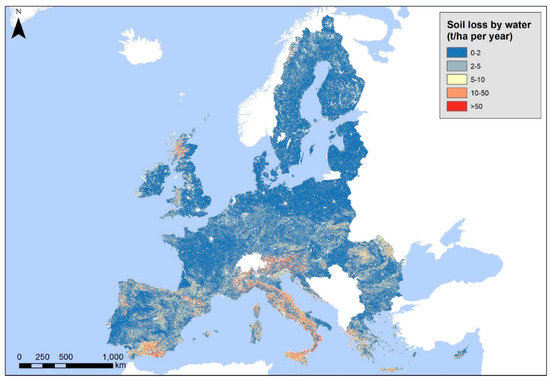
Figure 3.
Soil loss (by water) expressed in tons per hectare per year (data source: References [16,35]).
2.3. Methodology
Figure 4 shows the overall methodology implemented in this study. Initially, the two datasets were downloaded from the European Soil Data Centre (ESDAC) database, as mentioned earlier. Then, the analysis scale was adjusted to 1 km for both datasets in order for both studies to meet the same spatial resolution. Next, the soil loss provoked by water activity was classified into the following three categories: (1) areas with soil loss from 0 until 5 t/h per year were considered areas with low threat, (2) areas with soil loss from 5 until 10 t/h per year were considered areas of moderated threat, and (3) areas with soil loss beyond 10 t/h per year were considered areas of high risk. Afterwards, for each one of the above three categories, the subsurface hazard for each material (1: metals, 2: bones, 3: organics, and 4: stratigraphy) was estimated. The processing of all datasets was carried out in the ESRI ArcGIS v10.6 environment. Finally, zonal statistical analysis was carried out using as reference level the nomenclature of territorial units for statistics (NUTS) level 0 (country level).
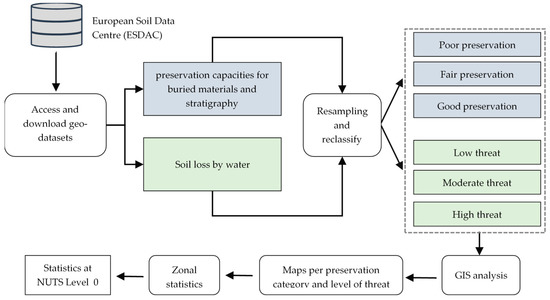
Figure 4.
Overall methodology of the study.
3. Results
The results of this study showed that 75% of area is characterised as low threat due to soil erosion (i.e., soil loss less than 5 t/ha per year) while another 13% and 12% are characterised as moderate (soil loss between 5–10 t/ha per year) and high-risk (soil loss more than 10 t/ha per year) areas, respectively. Also, based on the findings of Reference [32], shown in Figure 1 and Figure 2, approximately 42.9% of the area is characterised by poor preservation status; based on the soil properties, 53.2% of the area had fair preservation status, and only 3.9% of the area had good preservation status for all four different materials examined.
Figure 5 illustrates the overall results for the four categories of subsurface materials and the level of threat from soil erosion for each one of these materials. In addition, the preservation state of each type of stratigraphic material is mapped as poor (red), fair (yellow), and good (green). Areas with no data available are visualised with white colour in the background.
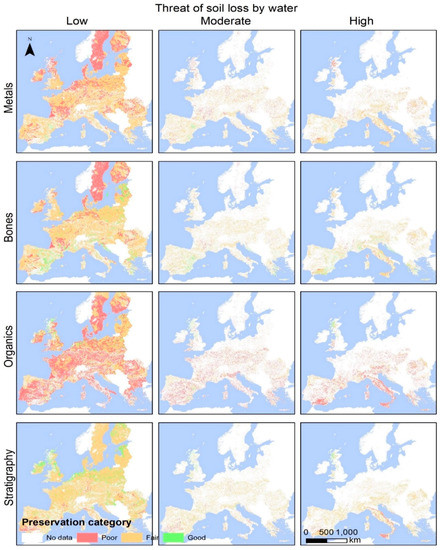
Figure 5.
Maps indicating the level of threat (low, moderate, and high) based on soil loss provoked by water activity (soil erosion) for each of the four different subsurface materials (metals, bones, organics, and stratigraphy evidence): The preservation state is also indicated (red for poor, yellow for fair, and green for good).
As evident in Figure 5, most of the areas—for all four types of archaeological material—are considered as low-threat areas regardless of their soils’ preservation capacity. For the moderate- and high-threat areas, differentiations are observed between European regions. As expected, southern European countries such as those of the Mediterranean basin are more exposed to soil-loss threats compared to the northern ones [16]. In addition, more concrete insights concerning the preservation status and stratigraphic material are shown in Figure 5. For instance, areas characterised as “fair” in terms of the preservation status for metals, bones, and stratigraphy evidence, indicated with yellow colour at Figure 5, seem to have a moderate-to-high threat from soil loss in the northern European areas. Areas which can highly preserve archaeological evidence in their subsoil (good soil preservation capacity indicated with green colour in Figure 5) and which present low amounts of soil loss are mainly concerning bones and stratigraphic materials. However, similar areas (good soil preservation capacity indicated with green colour in Figure 5) are evident in high-risk areas (third column of Figure 4) for all four different groups of archaeological materials, though in a smaller geographic extent.
A quantitative analysis followed, and the results are presented in Figure 6. The first row shows the overall statistics for areas characterised as low threat by soil loss. Similarly, the findings for areas characterised as moderated and high threat by soil loss are visualized in the second and third rows of Figure 6. Evidently, the majority of the subsurface evidence is considered a low threat by soil erosion (first row of Figure 6). In specific, more than 70% of metals in poor and fair conditions of preservation are within low-threat areas, while similar observations can be seen for the bones and organic evidence. In contrast, approximately 65% of the stratigraphy evidence is within areas characterised by low threat from soil loss. It should be mentioned that 25.2% of the area has a zero value for “no data” (not shown in Figure 5).
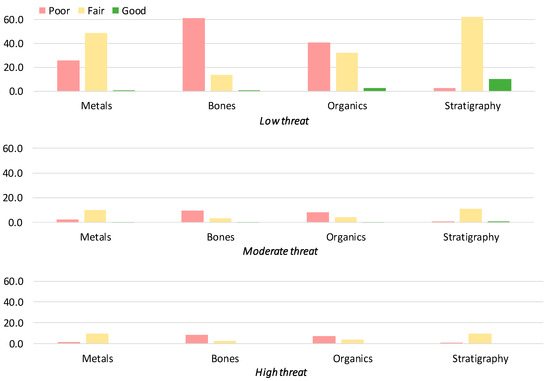
Figure 6.
Quantitative analysis of the findings of Figure 4 for low (1st row), moderate (2nd row), and high (3rd row) threat from soil loss by water for the four different subsurface materials discussed in this study (metals, bones, organics, and stratigraphy evidence) and the preservation status.
Following the interpretation of the findings of Figure 6, we can record that only 10–12% of the areas are threatened by soil loss, described by moderated and high threat (second and third rows respectively), with some fluctuations. While this is the same for all types of materials (metals, bones, organics, and stratigraphy), their preservation statuses are different. Also, areas characterised with good preservation status of the soil are less than 10% for all types of archaeological materials and sometimes even less than 1%, which is aligned with the work of Reference [32].
Table 1 shows the absolute areas, which are expressed in square kilometers per subsurface archaeological material (metals, bones, organics, and stratigraphy) per soil threat (low, moderate, and high) and preservation status (poor, fair, and good). Only a few areas in European territory feature good preservation status (last column of Table 1), while for some materials such as bones, it is extremely low. In contrast, fair preservation conditions for all types of materials are recorded.

Table 1.
Absolute areas of the subsurface materials studied here (metals, bones, organics, and stratigraphy) per soil threat (low, moderate, and high) and preservation status (poor, fair, and good).
Zonal statistics using as reference level the nomenclature of territorial units for statistics (NUTS) level 0 (country level) was then carried out. The overall findings of this analysis are shown in Figure 7, Figure 8, Figure 9 and Figure 10 and in Table A1 (Appendix A). In specific, Figure 7 indicates the mean values per country level for metals in regard to the level of soil-loss threats. Values close to 1 indicate poor status of preservation, values close to 2 indicate fair conditions of preservation, and values close to 3 good preservation status. Similarly, Figure 8, Figure 9 and Figure 10 indicate the results for bones, organics, and stratigraphic evidence, respectively.
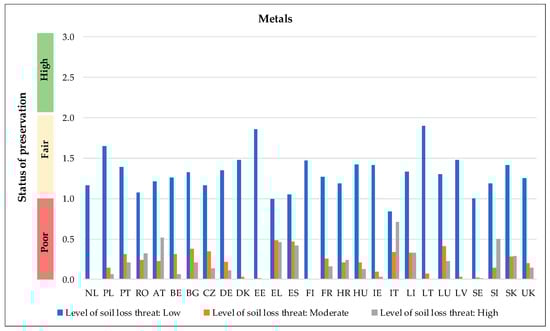
Figure 7.
Mean values per country level for metals per level of soil-loss threats: Values close to 1 indicate poor status of preservation, values close to 2 indicate fair conditions of preservation, and values close to 3 good preservation status.
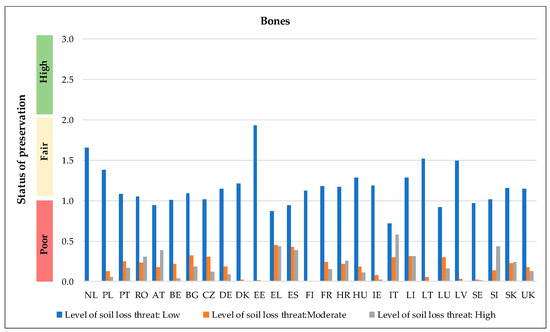
Figure 8.
Mean values per country level for bones per level of soil-loss threats: Values close to 1 indicate poor status of preservation, values close to 2 indicate fair conditions of preservation, and values close to 3 good preservation status.
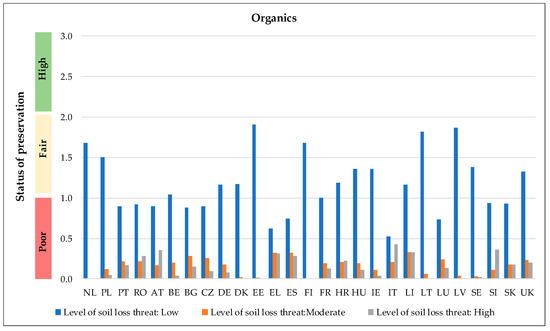
Figure 9.
Mean values per country level for organics per level of soil-loss threats: Values close to 1 indicate poor status of preservation, values close to 2 indicate fair conditions of preservation, and values close to 3 good preservation status.
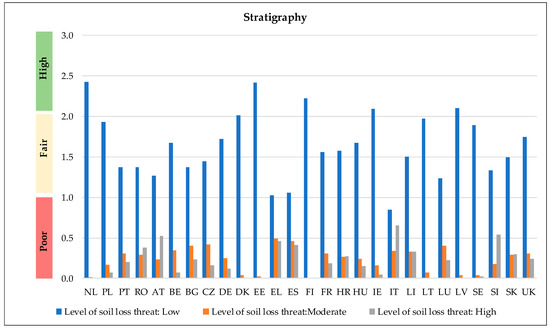
Figure 10.
Mean values per country level for bones per level of soil-loss threats: Values close to 1 indicate poor status of preservation, values close to 2 indicate fair conditions of preservation, and values close to 3 good preservation status.
As evident from these findings, regardless of the type of subsurface material (i.e., metal, bones, organics, and stratigraphy), the mean value of the preservation status—per country level—is characterised as poor or moderate. Some fluctuations between the countries examined here can be observed, for instance, for Estonia (EE) and Lithuania (LT) compared to Italy (IT) and Greece (HE). The majority of the potential cultural heritage wealth is characterised with low threat from soil loss for all types of subsurface material (indicated with blue colour in Figure 7, Figure 8, Figure 9 and Figure 10), while areas characterised as moderated and high risk from soil loss by water (indicated with orange and grey colour in Figure 7, Figure 8, Figure 9 and Figure 10) are quite small—in comparison to areas characterised with low threat. However, significant diversification between the European countries exist, for instance, for Greece (HE), Spain (ES), and Italy (IT) in comparison to northern European countries such as Estonia (EE) and Netherlands (NL).
Regression analysis was then performed to understand any correlations—at a country level—between the various types of subsurface materials studied here and the level of soil-loss threats. The results are shown in Figure 11, Figure 12 and Figure 13 for low, moderate, and high levels of soil-loss threat, respectively. The mean values per country level for the category of metals was set as a reference line (R2 = 1), whereas the rest of the three types of materials, namely the bones, organics, and stratigraphy, were plotted against this reference line (i.e., metals). At a low level of soil-loss threat (Figure 11), mean values of the preservation state for all types of materials—per country level—do not seem to follow any pattern or correlation. The preservation state—at this level of soil-loss threat—ranges from poor to fair and good, while the regression values (R2) range from 0.41 to 0.56 and indicate no strong correlation between the different types of materials.
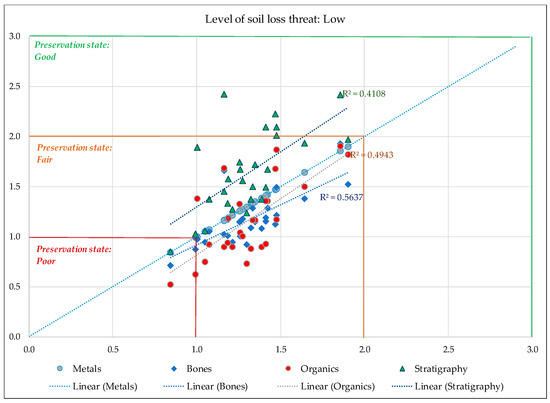
Figure 11.
Correlation of the different types of subsurface objects (metals, bones, organics, and stratigraphy) between areas characterized as low for soil-loss threat: Metals objects were used as the baseline (R = 1). Preservation state is also indicated for areas with different colours (red for poor preservation state, yellow for fair preservation state, and green for good preservation state).
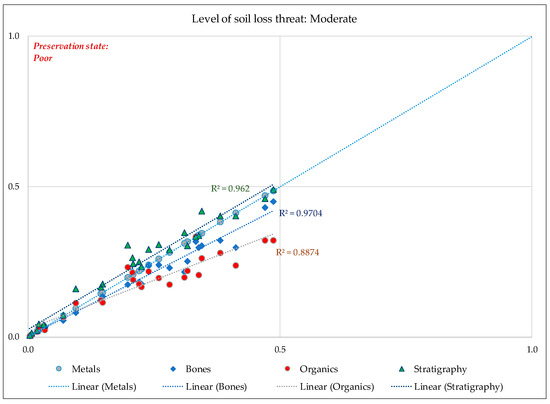
Figure 12.
Correlation of the different types of subsurface objects (metals, bones, organics, and stratigraphy) between areas characterized as moderate for soil-loss threat: Metals objects were used as the baseline (R = 1). Preservation state is also indicated for areas with different colours (same as Figure 11. Note here that only poor preservation state is shown).
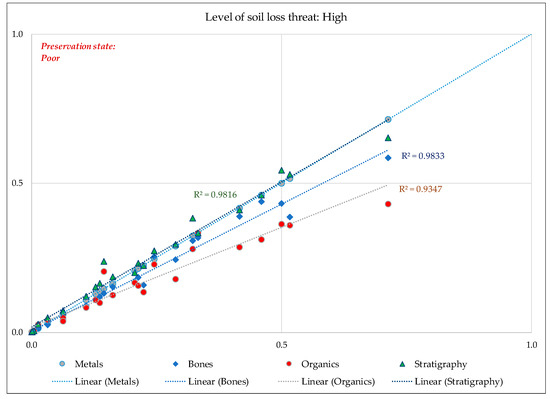
Figure 13.
Correlation of the different types of subsurface objects (metals, bones, organics, and stratigraphy) between areas characterized as moderate for soil-loss threat: Metals objects were used as the baseline (R = 1). Preservation state is also indicated for areas with different colours (same as Figure 11. Note here that only poor preservation state is shown).
However, this observation changes once we plot the results for the next two levels of soil-loss threat, namely the moderate (Figure 12) and high (Figure 13) levels. Once again, the mean values per country level for metals was set as reference observation and the rest of the materials were plotted against these measurements. Two observations can be drawn from Figure 12 (moderate level of threat) and Figure 13 (high level of threat): firstly, the preservation state at this level of soil loss is characterised as poor (same as Figure 7, Figure 8, Figure 9 and Figure 10); secondly, a strong correlation between all the subsurface materials (correlation coefficient R2 between 0.88 and 0.97) exists, indicating similar trends for all types of subsurface materials on a European scale.
4. Discussion
This communication capitalises on the results of two important studies carried out in the recent past [16,32] and estimates on a European scale the threat that potential subsurface archaeological materials (bones, metals, organics, and stratigraphic evidence) face. The estimation was made taking into account both the said materials and soil properties in combination with the soil loss provoked by water activity (soil erosion). Towards this direction, geodata from the aforementioned studies were imported into a GIS environment for further analysis. Four general remarks are underlined:
- Remark 1: Most of the European countries are considered low threat areas for all types of subsurface materials;
- Remark 2: Northern countries (e.g., Scandinavian) are almost exclusively considered low threat areas in contrast to Mediterranean countries, which are characterised with moderate and high risk. As a Mediterranean example, in Italy, the mean soil loss by water per year equals that of areas characterised as low or high risk for bone materials. This indicates that subsurface material in this country is widely exposed and threaten by soil loss in comparison to other countries;
- Remark 3: Areas characterised as low threat from soil erosion present approximately 10% of good preservation capacity, which varies depending on the type of the material.
- Remark 4: Similar patterns on a European scale for all types of materials are reported for areas characterised with moderate and high risk from soil loss.
Results from this study are biased due to the limitations of the two large extended geodatabases, namely the soil loss by water and the preservation of materials and stratigraphic evidence in soils. While assumptions and models have been implemented in both the studies of References [16,32] such as the Revised Universal Soil Loss Equation (RULSE) model used for estimation of the soil loss by water for the first study and the accuracy of the soil maps for the second study, the overall findings visualise and quantify for the first time potential threat of the subsurface cultural remains, as a result of soil erosion. While these results presented here are only a proxy on a country level and on a European level, it is evident that wider strategies can be developed in the future to support a better and higher resolution systematic monitoring of subsurface archaeological context in Europe for its potential loss of archaeological wealth by soil erosion.
In this direction, earth observation technologies and especially the European Space program Copernicus with its Sentinel missions can support this task. Space-based observations can deliver high-resolution products (up to 10-m resolution) and can therefore provide more details for targeted areas of interest, especially after heavy rainfalls or dramatic land-use changes. Optical Sentinel 2A and 2B sensors can be used to support a higher resolution soil erosion model (e.g., RUSLE) by providing inputs regarding the status of vegetation (through vegetation indices, e.g., Normalised Vegetation Difference Index (NDVI)), the land cover through classification methods, and maps of pertinent conservation practices. The FFO (Full-Free and Open-access) policy of the Copernicus program minimises the overall cost for such targeted investigations. In addition, space-based observations with the contributing missions of the Copernicus program (which includes very high-resolution satellite sensors) can also be used to map archaeological proxies, i.e., evidence for subsurface archaeological remains through crop-marks and soil-marks.
5. Conclusions
Several scientific studies evidence the various hazards threatening European cultural heritage, such as earthquakes [37,38,39,40,41], fires [42,43,44], soil erosion [45,46], landslides [47], floods [48], and urbanisation [49,50]. A special mention and growing interest regarding climate change and its impact on cultural heritage is reflected in recent literature [51,52].
Preserving subsurface archaeological remains is still a challenging task which needs to be further considered and addressed. This communication consists of the first European-scale investigation of the levels of soil loss and its impact on archaeological remains and strati. Despite limitations and assumptions, the study presented an overall trend at the country level through the exploitation of published open-access geodata. In addition, the methodology developed can be supported by earth observation sensors and can be further implemented elsewhere, blended together with local models and archaeological proxies of subsurface archaeological remains.
Future studies could also consider urbanisation, agricultural practices, land use changes, etc. for a complete understanding of both anthropogenic and natural hazards that affect the subsurface archaeological context. Such studies can support more comprehensive actions to prevent the loss of subsurface archaeological remains or to a priori protect areas with potential archaeological value. In addition, specific studies for the quantification of magnitudes of daily soil erosion can be explored in relation to climate changes understanding (e.g., increase of sat floods events). Finally, soil deposition based on soil erosion process can also be explored.
In light of the forthgoing, this communication comprises a proxy for soil loss by water threats to potential subsurface archaeological remains. This study does not intend to replace specific and local implemented studies but rather to provide a more general view on a European scale. Despite the eloquent limitations of this study, it can be used as a steppingstone to better understand on broader scales, namely on the European scale, the potential threat on subsurface archaeological evidence.
Author Contributions
Conceptualization, A.A. and V.L.; methodology, A.A. and V.L.; investigation, A.A. and V.L; writing—original draft preparation, A.A.; writing—review and editing, V.L.; project administration, D.G.H. All authors have read and agreed to the published version of the manuscript.
Funding
This communication is submitted under the NAVIGATOR project. The project is being co-funded by the Republic of Cyprus and the Structural Funds of the European Union in Cyprus under the Research and Innovation Foundation grant agreement EXCELLENCE/0918/0052 (Copernicus Earth Observation Big Data for Cultural Heritage).
Acknowledgments
The authors would like to acknowledge the “CUT Open Access Author Fund” for covering the open access publication fees of the paper. The authors would like to acknowledge the provision of the datasets from the European Soil Data Centre (ESDAC), esdac.jrc.ec.europa.eu, European Commission, Joint Research Centre.
Conflicts of Interest
The authors declare no conflict of interest.
Appendix A
Table A1.
Mean values of soil loss per country level for each type of subsurface material. Values close to 1 indicate poor status of preservation, values close to 2 indicate fair conditions of and values close to 3 good preservation status.
Table A1.
Mean values of soil loss per country level for each type of subsurface material. Values close to 1 indicate poor status of preservation, values close to 2 indicate fair conditions of and values close to 3 good preservation status.
| Subsurface Archaeological Evidence | Metals | Bones | Organics | Stratigraphy | |||||||||
|---|---|---|---|---|---|---|---|---|---|---|---|---|---|
| Level of soil-loss threat (L: low; M: moderate; and H: high) | |||||||||||||
| Country | CODE | L | M | H | L | M | H | L | M | H | L | M | H |
| Netherlands | NL | 1.2 | 0.0 | 0.0 | 1.7 | 0.0 | 0.0 | 1.7 | 0.0 | 0.0 | 2.4 | 0.0 | 0.0 |
| Poland | PL | 1.6 | 0.1 | 0.1 | 1.4 | 0.1 | 0.1 | 1.5 | 0.1 | 0.0 | 1.9 | 0.2 | 0.1 |
| Portugal | PT | 1.4 | 0.3 | 0.2 | 1.1 | 0.3 | 0.2 | 0.9 | 0.2 | 0.2 | 1.4 | 0.3 | 0.2 |
| Romania | RO | 1.1 | 0.2 | 0.3 | 1.1 | 0.2 | 0.3 | 0.9 | 0.2 | 0.3 | 1.4 | 0.3 | 0.4 |
| Austria | AT | 1.2 | 0.2 | 0.5 | 0.9 | 0.2 | 0.4 | 0.9 | 0.2 | 0.4 | 1.3 | 0.2 | 0.5 |
| Belgium | BE | 1.3 | 0.3 | 0.1 | 1.0 | 0.2 | 0.0 | 1.0 | 0.2 | 0.0 | 1.7 | 0.3 | 0.1 |
| Bulgaria | BG | 1.3 | 0.4 | 0.2 | 1.1 | 0.3 | 0.2 | 0.9 | 0.3 | 0.2 | 1.4 | 0.4 | 0.2 |
| Czech Republic | CZ | 1.2 | 0.3 | 0.1 | 1.0 | 0.3 | 0.1 | 0.9 | 0.3 | 0.1 | 1.4 | 0.4 | 0.2 |
| Germany | DE | 1.3 | 0.2 | 0.1 | 1.1 | 0.2 | 0.1 | 1.2 | 0.2 | 0.1 | 1.7 | 0.2 | 0.1 |
| Denmark | DK | 1.5 | 0.0 | 0.0 | 1.2 | 0.0 | 0.0 | 1.2 | 0.0 | 0.0 | 2.0 | 0.0 | 0.0 |
| Estonia | EE | 1.9 | 0.0 | 0.0 | 1.9 | 0.0 | 0.0 | 1.9 | 0.0 | 0.0 | 2.4 | 0.0 | 0.0 |
| Greece | EL | 1.0 | 0.5 | 0.5 | 0.9 | 0.4 | 0.4 | 0.6 | 0.3 | 0.3 | 1.0 | 0.5 | 0.5 |
| Spain | ES | 1.1 | 0.5 | 0.4 | 0.9 | 0.4 | 0.4 | 0.7 | 0.3 | 0.3 | 1.1 | 0.5 | 0.4 |
| Finland | FI | 1.5 | 0.0 | 0.0 | 1.1 | 0.0 | 0.0 | 1.7 | 0.0 | 0.0 | 2.2 | 0.0 | 0.0 |
| France | FR | 1.3 | 0.3 | 0.2 | 1.2 | 0.2 | 0.2 | 1.0 | 0.2 | 0.1 | 1.6 | 0.3 | 0.2 |
| Croatia | HR | 1.2 | 0.2 | 0.2 | 1.2 | 0.2 | 0.3 | 1.2 | 0.2 | 0.2 | 1.6 | 0.3 | 0.3 |
| Hungary | HU | 1.4 | 0.2 | 0.1 | 1.3 | 0.2 | 0.1 | 1.4 | 0.2 | 0.1 | 1.7 | 0.2 | 0.2 |
| Ireland | IE | 1.4 | 0.1 | 0.0 | 1.2 | 0.1 | 0.0 | 1.4 | 0.1 | 0.0 | 2.1 | 0.2 | 0.0 |
| Italy | IT | 0.8 | 0.3 | 0.7 | 0.7 | 0.3 | 0.6 | 0.5 | 0.2 | 0.4 | 0.9 | 0.3 | 0.7 |
| Liechtenstein | LI | 1.3 | 0.3 | 0.3 | 1.3 | 0.3 | 0.3 | 1.2 | 0.3 | 0.3 | 1.5 | 0.3 | 0.3 |
| Lithuania | LT | 1.9 | 0.1 | 0.0 | 1.5 | 0.1 | 0.0 | 1.8 | 0.1 | 0.0 | 2.0 | 0.1 | 0.0 |
| Luxembourg | LU | 1.3 | 0.4 | 0.2 | 0.9 | 0.3 | 0.2 | 0.7 | 0.2 | 0.1 | 1.2 | 0.4 | 0.2 |
| Latvia | LV | 1.5 | 0.0 | 0.0 | 1.5 | 0.0 | 0.0 | 1.9 | 0.0 | 0.0 | 2.1 | 0.0 | 0.0 |
| Sweden | SE | 1.0 | 0.0 | 0.0 | 1.0 | 0.0 | 0.0 | 1.4 | 0.0 | 0.0 | 1.9 | 0.0 | 0.0 |
| Slovenia | SI | 1.2 | 0.1 | 0.5 | 1.0 | 0.1 | 0.4 | 0.9 | 0.1 | 0.4 | 1.3 | 0.2 | 0.5 |
| Slovakia | SK | 1.4 | 0.3 | 0.3 | 1.2 | 0.2 | 0.2 | 0.9 | 0.2 | 0.2 | 1.5 | 0.3 | 0.3 |
| United Kingdom | UK | 1.3 | 0.2 | 0.1 | 1.1 | 0.2 | 0.1 | 1.3 | 0.2 | 0.2 | 1.7 | 0.3 | 0.2 |
| Status of Preservation: 1: poor; 2: fair; and 3: good | |||||||||||||
Appendix B
Geodatasets related to the findings of Figure 5 can be accessed at the open access institutional repository of the Cyprus University of Technology (KTISIS), under the “Copernicus Earth Observation Big Data for Cultural Heritage -NAVIGATOR” project (https://ktisis.cut.ac.cy/cris/project/pj00350). The geodatasets indicate the level of threat (low, moderate, and high) based on soil loss provoked by water activity (soil erosion) for each of the four different subsurface materials (metals, bones, organics, and stratigraphy evidence). The preservation state is also mentioned (poor, fair, and good).
References
- Joint Research Centre European Soil Data Centre (ESDAC). Erosion by Water. Available online: https://esdac.jrc.ec.europa.eu/themes/erosion (accessed on 1 February 2020).
- Pena, B.S.; Abreu, M.M.; Magalhães, R.M.; Cortez, N. Water erosion aspects of land degradation neutrality to landscape planning tools at national scale. Geoderma 2020, 363, 114093. [Google Scholar] [CrossRef]
- Borji, M.; Samani, N.A.; Rashidi, S.; Tiefenbacher, P.J. Catchment-scale soil conservation: Using climate, vegetation, and topo-Hydrological parameters to support decision making and implementation. Sci. Total Environ. 2020, 712, 136124. [Google Scholar] [CrossRef]
- Chandramohan, T.; Venkatesh, B.; Balchand, A.N. Evaluation of Three Soil Erosion Models for Small Watersheds. Aquat. Procedia 2015, 4, 1227–1234. [Google Scholar] [CrossRef]
- Bosco, C.; de Rigo, D.; Dewitte, O.; Poesen, J.; Panagos, P. Modelling soil erosion at European scale: Towards harmonization and reproducibility. Nat. Hazards Earth Syst. Sci. 2015, 15, 225–245. [Google Scholar] [CrossRef]
- Panagos, P.; Katsoyiannis, A. Soil erosion modelling: The new challenges as the result of policy developments in Europe. Environ. Res. 2019, 172, 470–474. [Google Scholar] [CrossRef] [PubMed]
- Liu, Y.-H.; Li, D.-H.; Chen, W.; Lin, B.-S.; Seeboonruang, U.; Tsai, F. Soil Erosion Modeling and Comparison Using Slope Units and Grid Cells in Shihmen Reservoir Watershed in Northern Taiwan. Water 2018, 10, 1387. [Google Scholar] [CrossRef]
- Alewell, C.; Borrelli, P.; Meusburger, K.; Panagos, P. Using the USLE: Chances, challenges and limitations of soil erosion modelling. Int. Soil Water Conserv. Res. 2019, 7, 203–225. [Google Scholar] [CrossRef]
- Borrelli, P.; Meusburger, K.; Ballabio, C.; Panagos, P.; Alewell, C. Object-Oriented soil erosion modelling: A possible paradigm shift from potential to actual risk assessments in agricultural environments. Land Degrad. Dev. 2018, 29, 1270–1281. [Google Scholar] [CrossRef]
- Quinton, J.N. Soil Erosion Modeling. In Encyclopedia of Agrophysics; Encyclopedia of Earth Sciences Series; Gliński, J., Horabik, J., Lipiec, J., Eds.; Springer: Berlin/Heidelberg, Germany, 2011. [Google Scholar]
- Avwunudiogba, A.; Hudson, F.P. A Review of Soil Erosion Models with Special Reference to the needs of Humid Tropical Mountainous Environments. Eur. J. Sustain. Dev. 2014, 3, 299–310. [Google Scholar] [CrossRef]
- Borrelli, P.; Robinson, D.A.; Fleischer, L.R. An assessment of the global impact of 21st century land use change on soil erosion. Nat. Commun. 2013, 8. [Google Scholar] [CrossRef]
- Renard, K.G.; Foster, G.R.; Weesies, G.A.; McCool, D.K.; Yoder, D.C. Predicting Soil Erosion by Water: A Guide to Conservation Planning with the Revised Universal Soil Loss Equation (RUSLE); US Department of Agriculture, Agricultural Research Service: Washington, DC, USA, 1997. [Google Scholar]
- Ghosal, K.; Das Bhattacharya, S. A Review of RUSLE Model. J. Indian Soc. Remote Sens. 2020. [Google Scholar] [CrossRef]
- Abdelwahab, O.M.M.; Ricci, G.F.; De Girolamo, A.M.; Gentile, F. Modelling soil erosion in a Mediterranean watershed: Comparison between SWAT and AnnAGNPS models. Environ. Res. 2018, 166, 363–376. [Google Scholar] [CrossRef]
- Panagos, P.; Van Liedekerke, M.; Jones, A.; Montanarella, L. European Soil Data Centre: Response to European policy support and public data requirements. Land Use Policy 2012, 29, 329–338. [Google Scholar] [CrossRef]
- Howland, M.D.; Jones, I.W.N.; Najjar, M.; Levy, E.T. Quantifying the effects of erosion on archaeological sites with low-Altitude aerial photography, structure from motion, and GIS: A case study from southern Jordan. J. Archaeol. Sci. 2018, 90, 62–70. [Google Scholar] [CrossRef]
- Ducke, B. An Integrative Approach to Archaeological Landscape Evaluation: Locational Preferences, Site Preservation and Uncertainty Mapping, the Archaeology of Erosion, the Erosion of Archaeology 2014. In Proceedings of the Brussels Conference, Brussels, Belgium, 28–30 April 2008; Meylemans, E., Poesen, J., Ven, I.I., Eds.; pp. 13–22. [Google Scholar]
- Huisman, H.; de Kort, J.-W.; Ketterer, M.E.; Reimann, T.; Schoorl, M.J.; van der Heiden, M.; van Soest, M.; van Egmond, F. Erosion of archaeological sites: Quantifying the threat using optically stimulated luminescence and fallout isotopes. Geoarchaeology 2019, 34, 478–494. [Google Scholar] [CrossRef]
- Davidson, A.D.; Grieve, C.I.; Tyler, N.A.; Barclay, J.G.; Maxwell, S.G. Archaeological Sites: Assessment of Erosion Risk. J. Archaeol. Sci. 1998, 25, 857–860. [Google Scholar] [CrossRef]
- Kushwaha, S.K.P.; Dayal, K.R.; Sachchidanand; Raghavendra, S.; Pande, H.; Tiwari, P.S.; Agrawal, S.; Srivastava, S.K. 3D Digital Documentation of a Cultural Heritage Site Using Terrestrial Laser Scanner—A Case Study. In Applications of Geomatics in Civil Engineering; Ghosh, J., da Silva, I., Eds.; Lecture Notes in Civil Engineering; Springer: Singapore, 2020; Volume 33. [Google Scholar]
- Stampouloglou, M.; Toska, O.; Tapinaki, S.; Kontogianni, G.; Skamantzari, M.; Georgopoulos, A. 3D Documentation and Virtual Archaeological Restoration of Macedonian tombs. Int. Arch. Photogramm. Remote Sens. Spat. Inf. Sci. 2019, 1073–1080. [Google Scholar] [CrossRef]
- Tapete, D.; Cigna, F. COSMO-SkyMed SAR for Detection and Monitoring of Archaeological and Cultural Heritage Sites. Remote Sens. 2019, 11, 1326. [Google Scholar] [CrossRef]
- Agapiou, A.; Lysandrou, V.; Sarris, A.; Papadopoulos, N.; Hadjimitsis, D.G. Fusion of Satellite Multispectral Images Based on Ground-Penetrating Radar (GPR) Data for the Investigation of Buried Concealed Archaeological Remains. Geosciences 2017, 7, 40. [Google Scholar] [CrossRef]
- Malfitana, D.; Leucc, G.; Fragalà, G.; Masini, N.; Scardozzi, G.; Cacciaguerra, G.; Santagati, C.; Sheh, E. The potential of integrated GPR survey and aerial photographic analysis of historic urban areas: A case study and digital reconstruction of a Late Roman villa in Durrës (Albania). J. Archaeol. Sci. Rep. 2015, 4, 276–284. [Google Scholar] [CrossRef]
- Sarris, A.; Papadopoulos, N.; Agapiou, A.; Salvi, M.C.; Hadjimitsis, D.G.; Parkinson, A.; Yerkes, R.W.; Gyucha, A.; Duffy, R.P. Integration of geophysical surveys, ground hyperspectral measurements, aerial and satellite imagery for archaeological prospection of prehistoric sites: The case study of Vésztő-Mágor Tell, Hungary. J. Archaeol. Sci. 2013, 40, 1454–1470. [Google Scholar] [CrossRef]
- Pavelka, K., Jr.; Hanuš, J.; Raeva, P.; Gojda, M. Using of both hyperspectral aerial sensing and RPAS multispectral sensing for potential archaeological sites detection. In Proceedings of the SPIE 10780, Multispectral, Hyperspectral, and Ultraspectral Remote Sensing Technology, Techniques and Applications VII, Honolulu, HI, USA, 23 October 2018. [Google Scholar] [CrossRef]
- Pavelka, K.; Šedina, J.; Matoušková, E. High Resolution Drone Surveying of the Pista Geoglyph in Palpa, Peru. Geosciences 2018, 8, 479. [Google Scholar] [CrossRef]
- Lasaponara, R.; Leucci, G.; Masini, N.; Persico, R.; Scardozzi, G. Towards an operative use of remote sensing for exploring the past using satellite data: The case study of Hierapolis (Turkey). Remote Sens. Environ. 2016, 174, 148–164. [Google Scholar] [CrossRef]
- Papadopoulos, G.N.; Sarris, A.; Salvi, M.C.; Dederix, S.; Soupios, P.; Dikmen, U. Rediscovering the small theatre and amphitheatre of ancient Ierapytna (SE Crete) by integrated geophysical methods. J. Archaeol. Sci. 2012, 39, 1960–1973. [Google Scholar] [CrossRef]
- Lysandrou, V.; Agapiou, A. Cities of the dead: Approaching the landscape of Hellenistic and Roman necropoleis of Cyprus. Archaeol. Anthropol. Sci. 2016, 8, 867–877. [Google Scholar] [CrossRef]
- Kibblewhite, M.; Tóth, G.; Hermann, T. Predicting the preservation of cultural artefacts and buried materials in soil. Sci. Total Environ. 2015, 529, 249–263. [Google Scholar] [CrossRef]
- Joint Research Centre European Soil Data Centre (ESDAC). European Soil Database v2.0 (Vector and Attribute Data). Available online: https://esdac.jrc.ec.europa.eu/content/european-soil-database-v20-vector-and-attribute-data (accessed on 1 February 2020).
- Joint Research Centre European Soil Data Centre (ESDAC). European Soil Database & Soil Properties. Available online: https://esdac.jrc.ec.europa.eu/resource-type/european-soil-database-soil-properties (accessed on 1 February 2020).
- Joint Research Centre European Soil Data Centre (ESDAC). Soil Erosion by Water (RUSLE2015). Available online: https://esdac.jrc.ec.europa.eu/content/soil-erosion-water-rusle2015 (accessed on 17 February 2020).
- Panagos, P.; Borrelli, P.; Poesen, J.; Ballabio, C.; Lugato, E.; Meusburger, K.; Montanarella, L.; Alewell, C. The new assessment of soil loss by water erosion in Europe. Environ. Sci. Policy 2015, 54, 438–447. [Google Scholar] [CrossRef]
- Maio, R.; Miguel Ferreira, T.; Vicente, R. A critical discussion on the earthquake risk mitigation of urban cultural heritage assets. Int. J. Disaster Risk Reduct. 2018, 27, 239–247. [Google Scholar] [CrossRef]
- Pan, Y.; Wang, X.; Guo, R.; Yuan, S. Seismic damage assessment of Nepalese cultural heritage building and seismic retrofit strategies: 25 April 2015 Gorkha (Nepal) earthquake. Eng. Fail. Anal. 2018, 87, 80–95. [Google Scholar] [CrossRef]
- Agapiou, A.; Lysandrou, V.; Themistocleous, K.; Hadjimitsis, D.G. Risk assessment of Cultural Heritage Sites Clusters Using Satellite Imagery and GIS: The case study of Paphos District, Cyprus. Nat. Hazards 2016, 83, 5–20. [Google Scholar] [CrossRef]
- Tapete, D.; Cigna, F. Trends and perspectives of space-Borne SAR remote sensing for archaeological landscape and cultural heritage applications. J. Archaeol. Sci. Rep. 2017, 14, 716–726. [Google Scholar] [CrossRef]
- Zhou, W.; Chen, F.; Guo, H. Differential Radar Interferometry for Structural and Ground Deformation Monitoring: A New Tool for the Conservation and Sustainability of Cultural Heritage Sites. Sustainability 2015, 7, 1712–1729. [Google Scholar] [CrossRef]
- Yuan, C.; He, Y.; Feng, Y.; Wang, P. Fire hazards in heritage villages: A case study on Dangjia Village in China. Int. J. Disaster Risk Reduct. 2018, 28, 748–757. [Google Scholar] [CrossRef]
- Agapiou, A.; Lysandrou, V.; Alexakis, D.D.; Themistocleous, K.; Cuca, B.; Sarris, A.; Argyrou, N.; Hadjimitsis, D.G. Cultural heritage management and monitoring using remote sensing data and GIS: The case study of Paphos area, Cyprus. CEUS Comput. Environ. Urban Syst. 2015, 54, 230–239. [Google Scholar] [CrossRef]
- Marrion, E.C. More effectively addressing fire/disaster challenges to protect our cultural heritage. J. Cult. Herit. 2016, 20, 746–749. [Google Scholar] [CrossRef]
- Cuca, B.; Agapiou, A. Impact of land use change and soil erosion on cultural landscapes: The case of cultural paths and sites in Paphos district, Cyprus. Appl. Geomat. 2018, 10, 515. [Google Scholar] [CrossRef]
- Pourkerman, M.; Marriner, N.; Morhange, C.; Djamali, M.; Amjadi, S.; Lahijani, H.; Beni, N.A.; Vacchi, M.; Tofighian, H.; Shah-Hoesseini, M. Tracking shoreline erosion of “at risk” coastal archaeology: The example of ancient Siraf (Iran, Persian Gulf). Appl. Geogr. 2018, 101, 45–55. [Google Scholar] [CrossRef]
- Cencetti, C.; Di Matteo, L.; Romeo, S. Analysis of Costantino Landslide Dam Evolution (Southern Italy) by Means of Satellite Images, Aerial Photos, and Climate Data. Geosciences 2017, 7, 30. [Google Scholar] [CrossRef]
- Canuti, P.; Casagli, N.; Catani, F.; Fanti, R. Hydrogeological hazard and risk in archaeological sites some case studies in Italy. J. Cult. Herit. 2000, 12, 117–125. [Google Scholar] [CrossRef]
- Kiruthiga, K.; Thirumaran, K. Effects of urbanization on historical heritage buildings in Kumbakonam, Tamilnadu, India. Front. Archit. Res. 2019, 8, 94–105. [Google Scholar] [CrossRef]
- Swensen, G.; Jerpåsen, B.G. Cultural heritage in suburban landscape planning A case study in Southern Norway. Landsc. Urban Plan. 2008, 874, 289–300. [Google Scholar] [CrossRef]
- Sesana, E.; Bertolin, C.; Gagnon, A.S.; Hughes, J.J. Mitigating Climate Change in the Cultural Built Heritage Sector. Climate 2019, 7, 90. [Google Scholar] [CrossRef]
- Hao, L.; Herrera-Avellanosa, D.; Del Pero, C.; Troi, A. Categorization of South Tyrolean Built Heritage with Consideration of the Impact of Climate. Climate 2019, 7, 139. [Google Scholar] [CrossRef]
© 2020 by the authors. Licensee MDPI, Basel, Switzerland. This article is an open access article distributed under the terms and conditions of the Creative Commons Attribution (CC BY) license (http://creativecommons.org/licenses/by/4.0/).