Seasonal Dynamics of a Temperate Tibetan Glacier Revealed by High-Resolution UAV Photogrammetry and In Situ Measurements


 ,
,
Abstract
1. Introduction
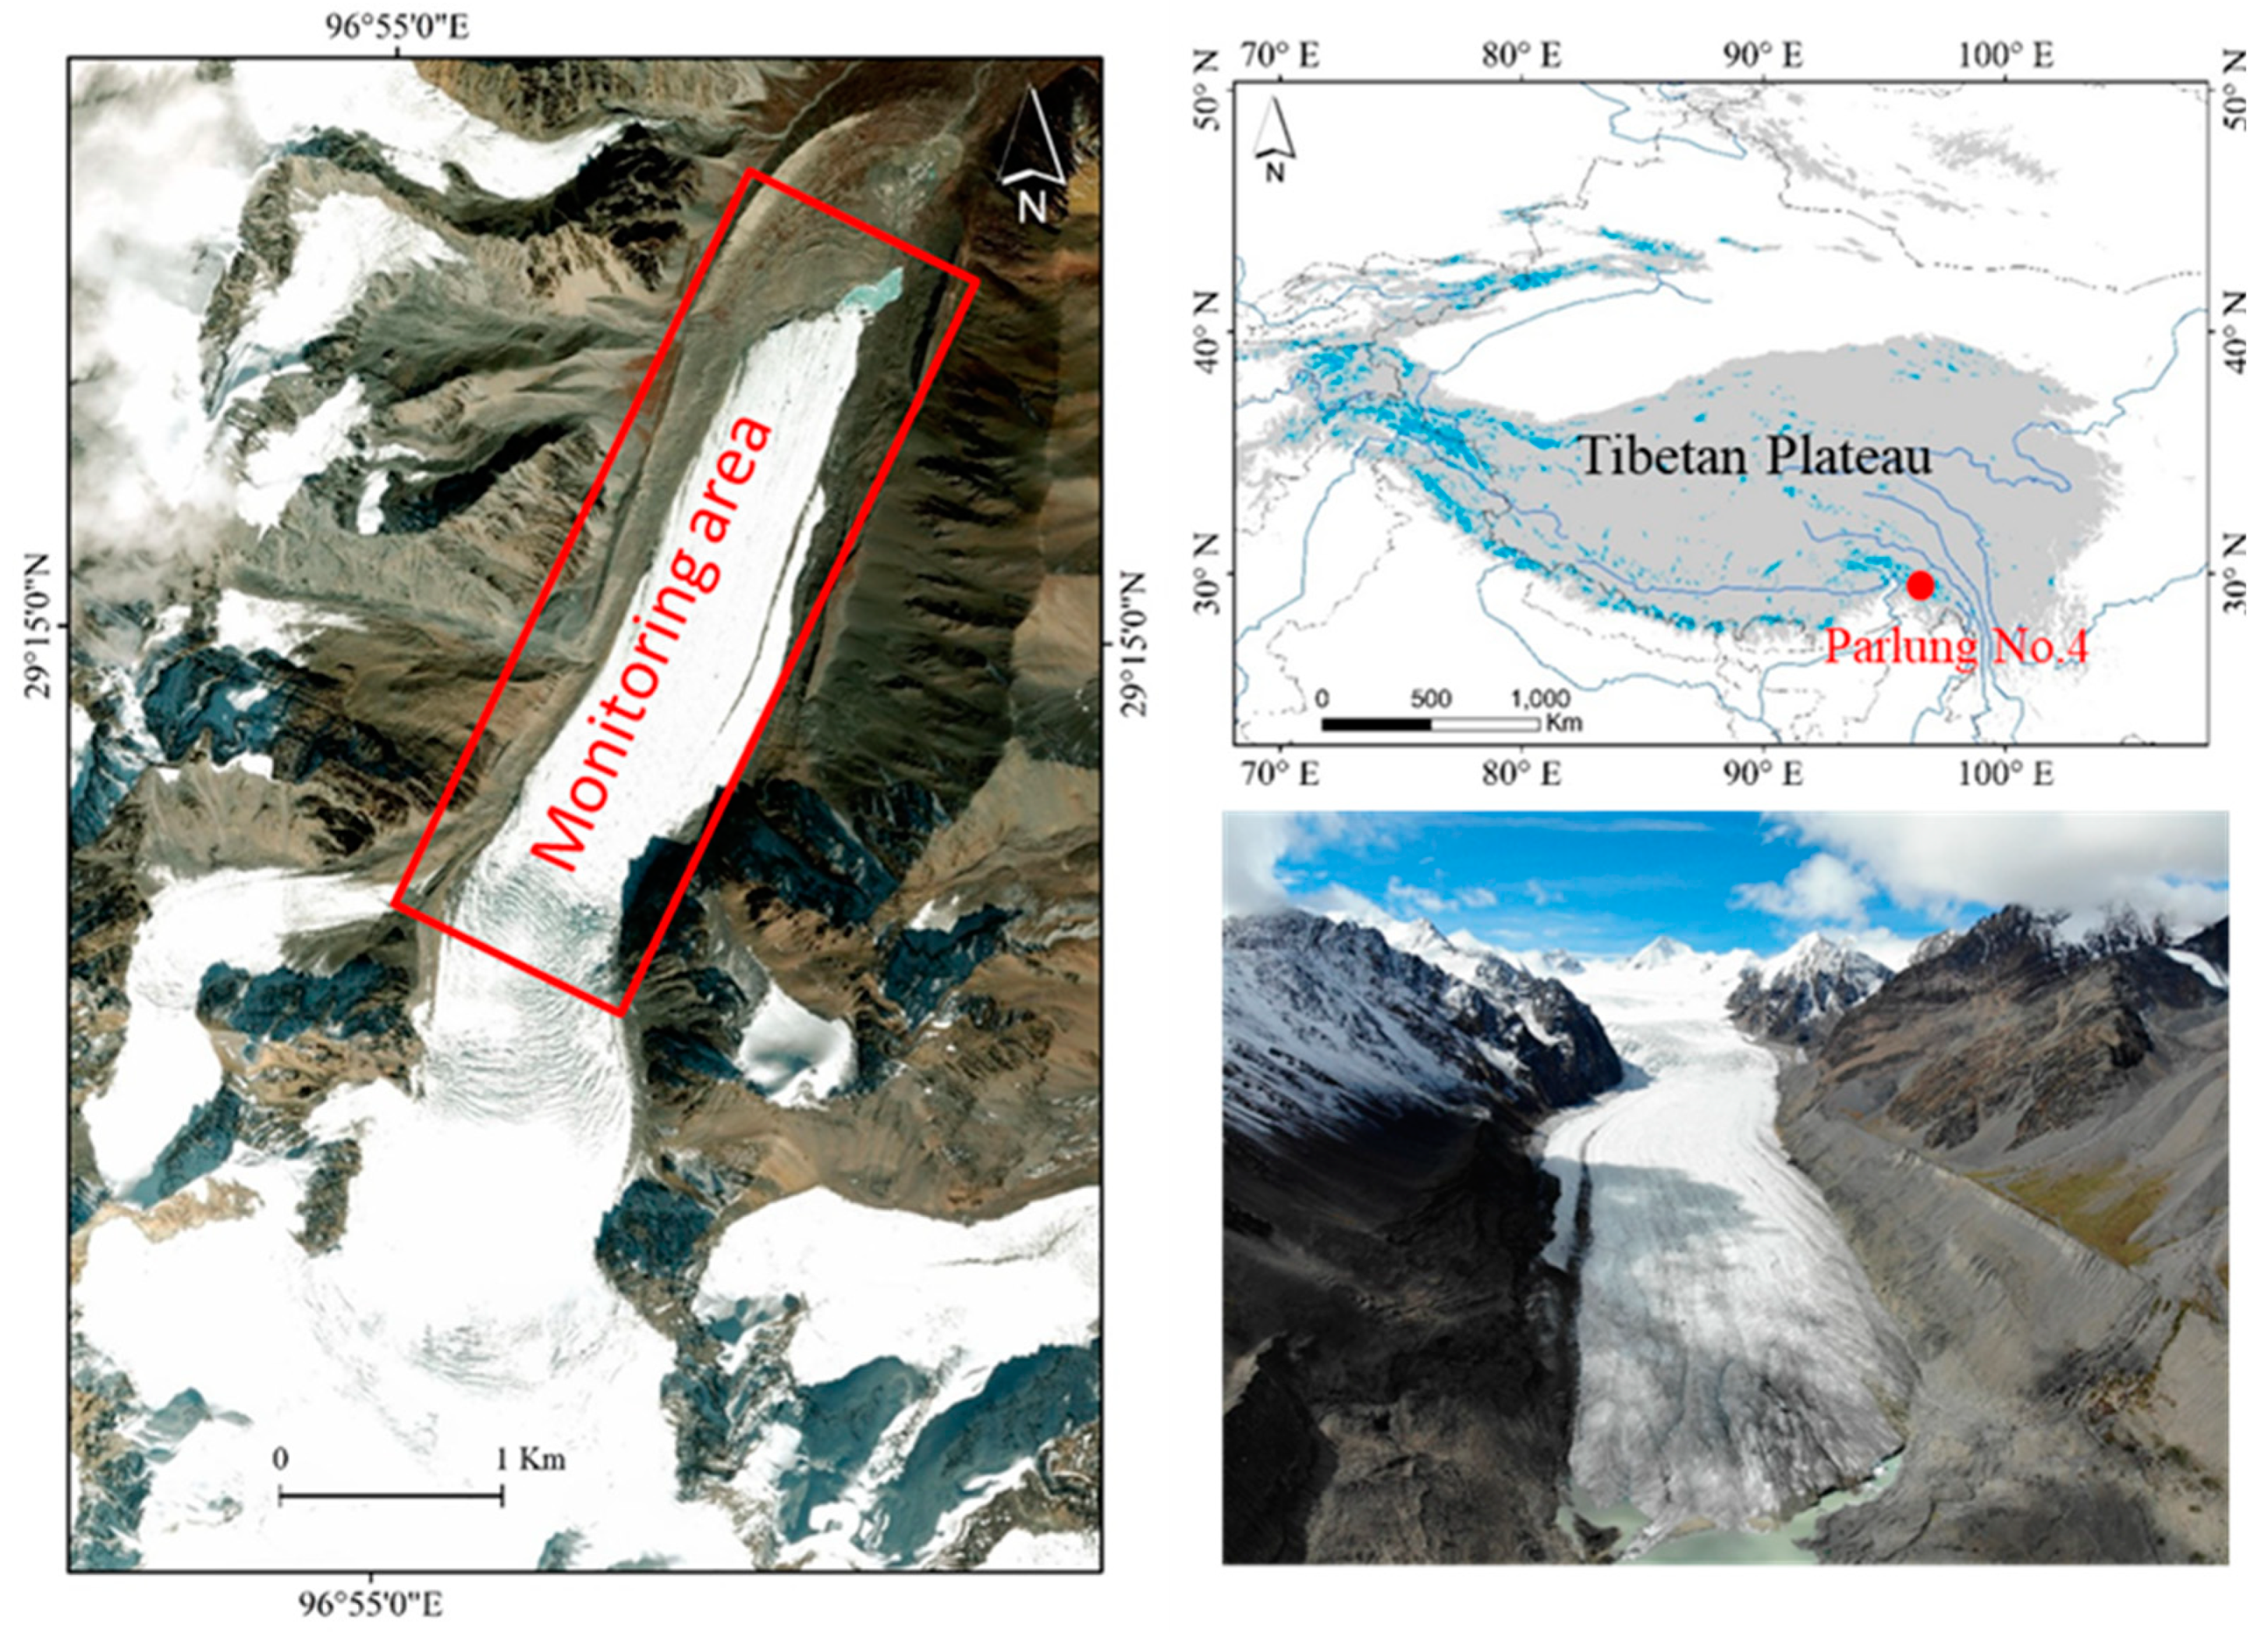
2. Study Site
3. Data and Methods
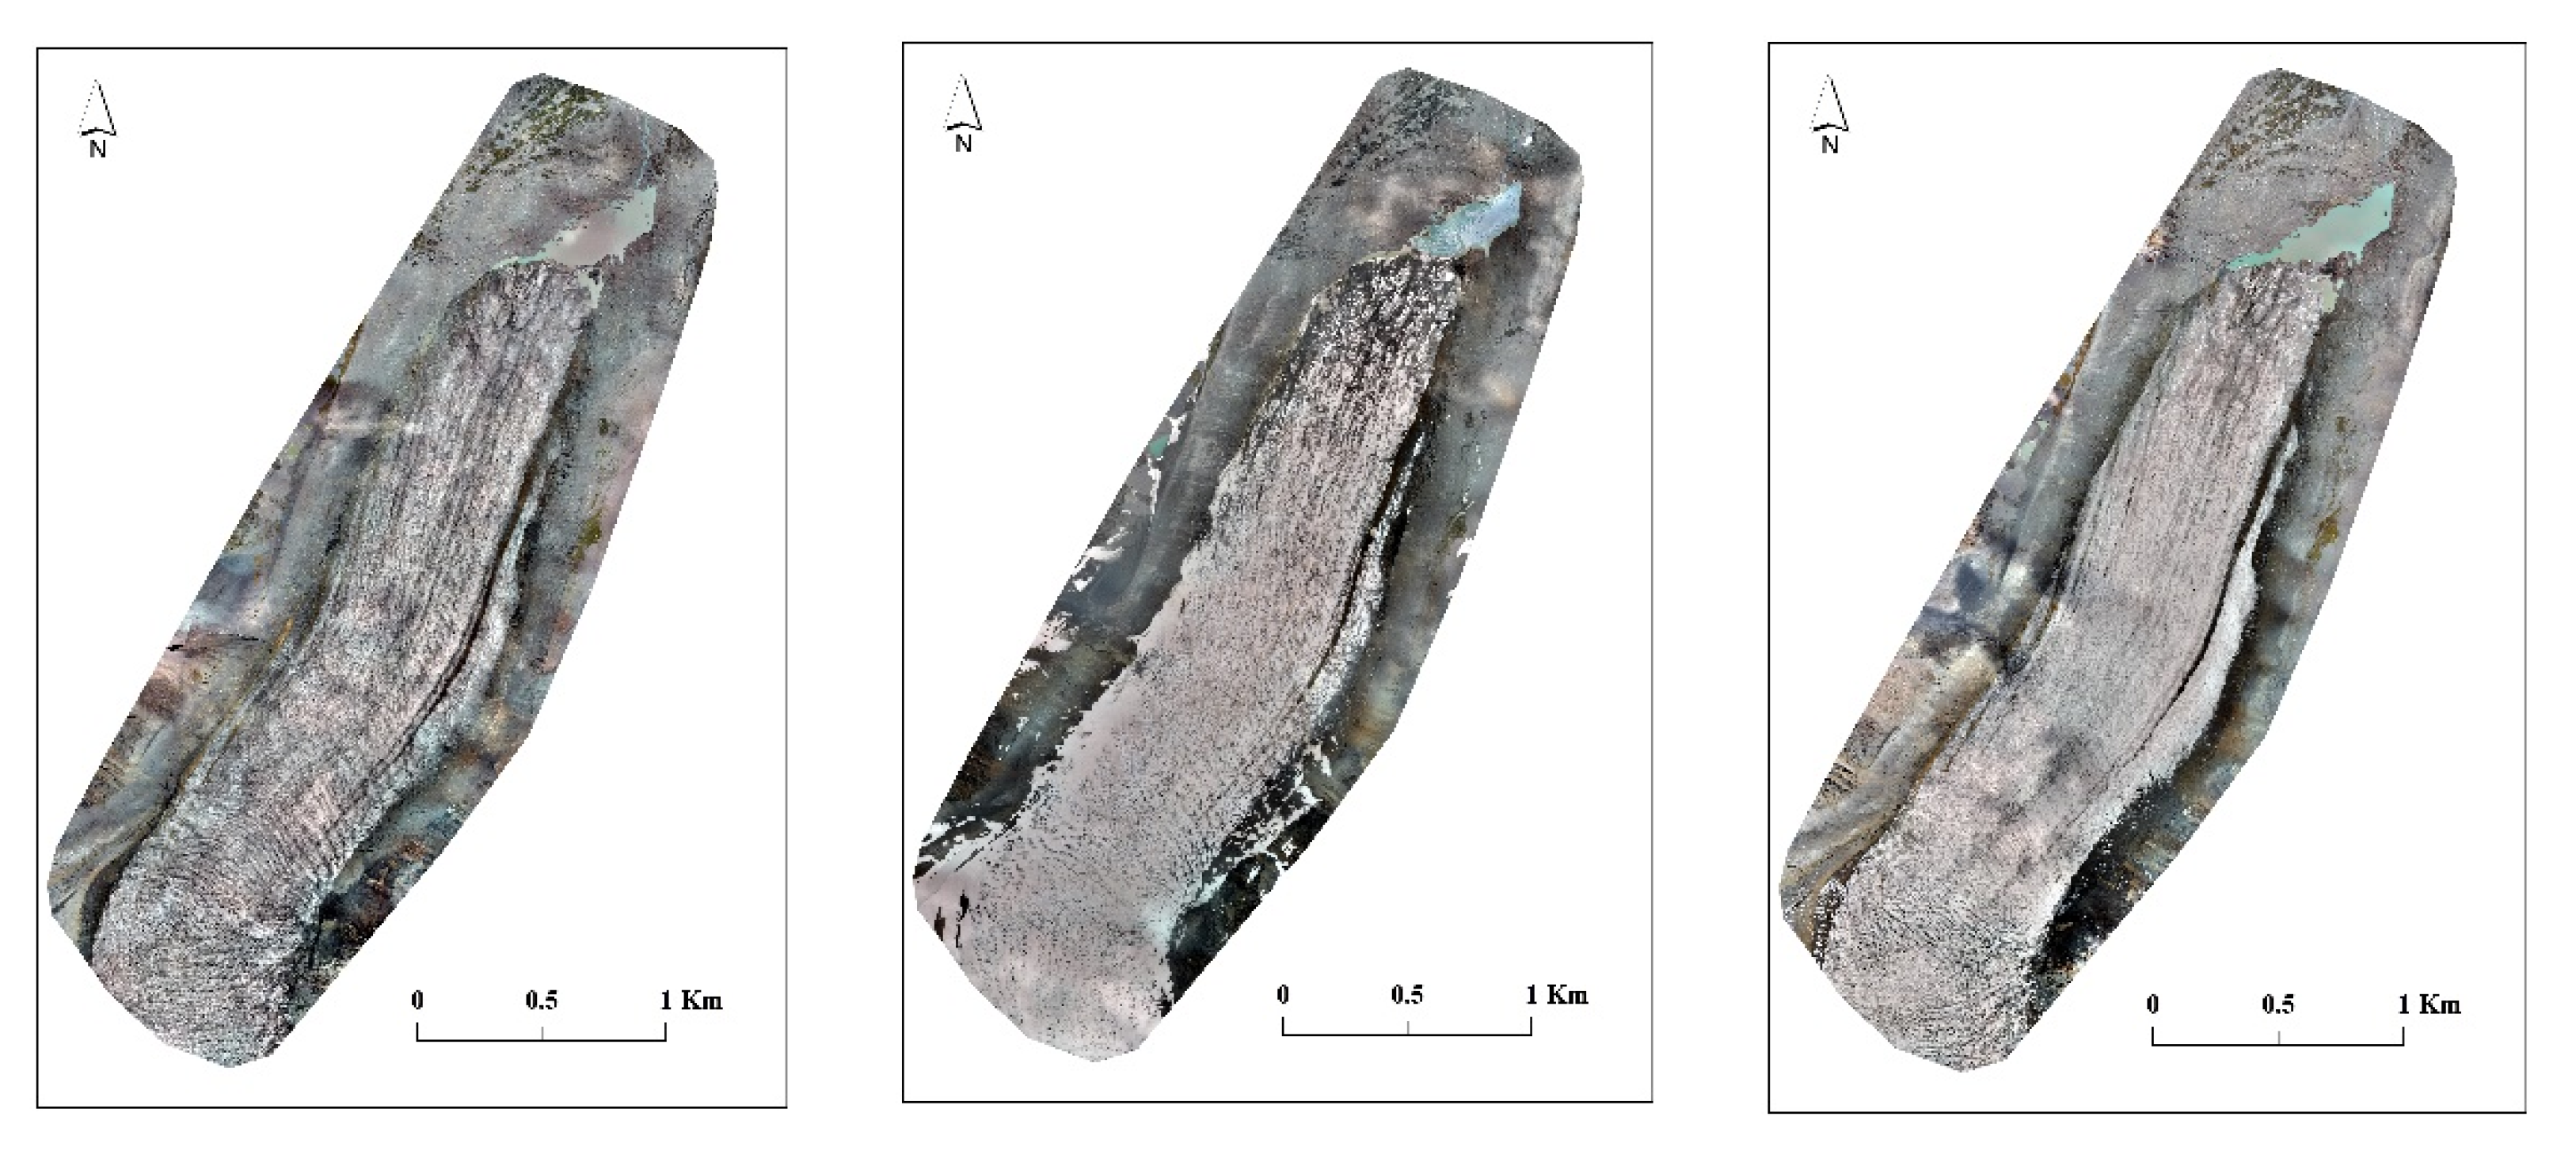
3.1. UAV Flights and Data Processing
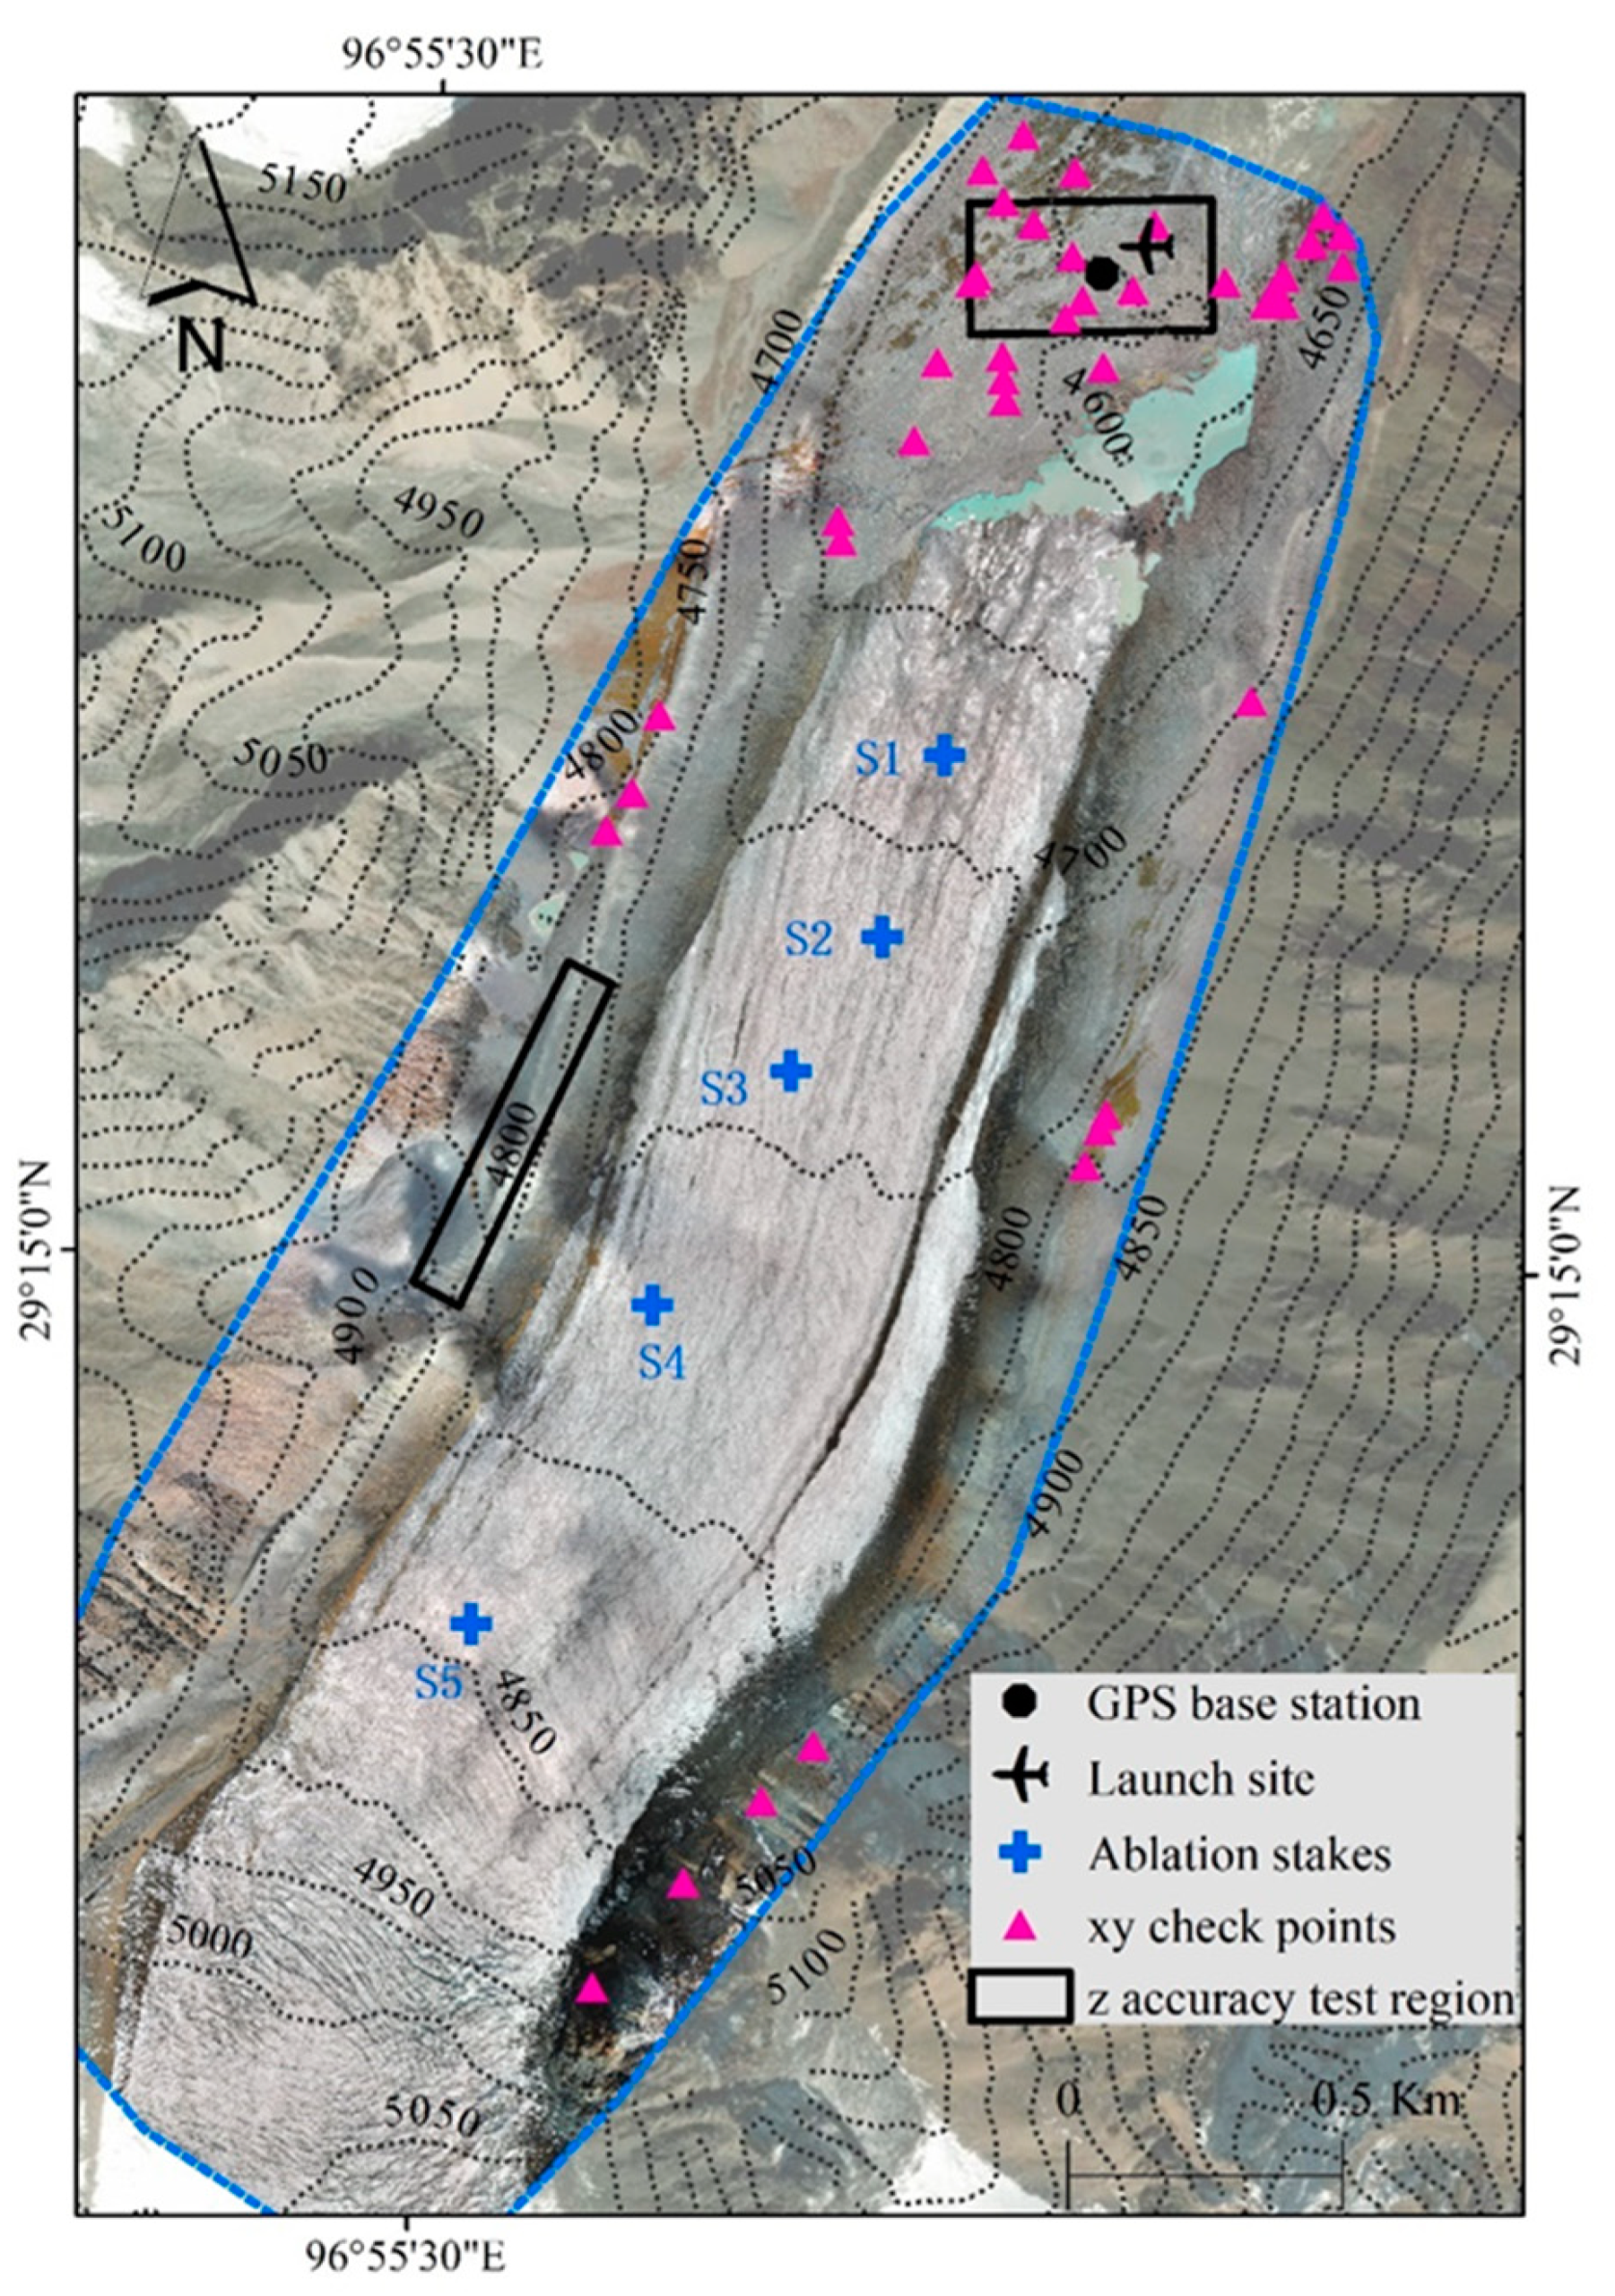
3.2. In-Situ Measurements and Estimation of Emergence Velocity
4. Results
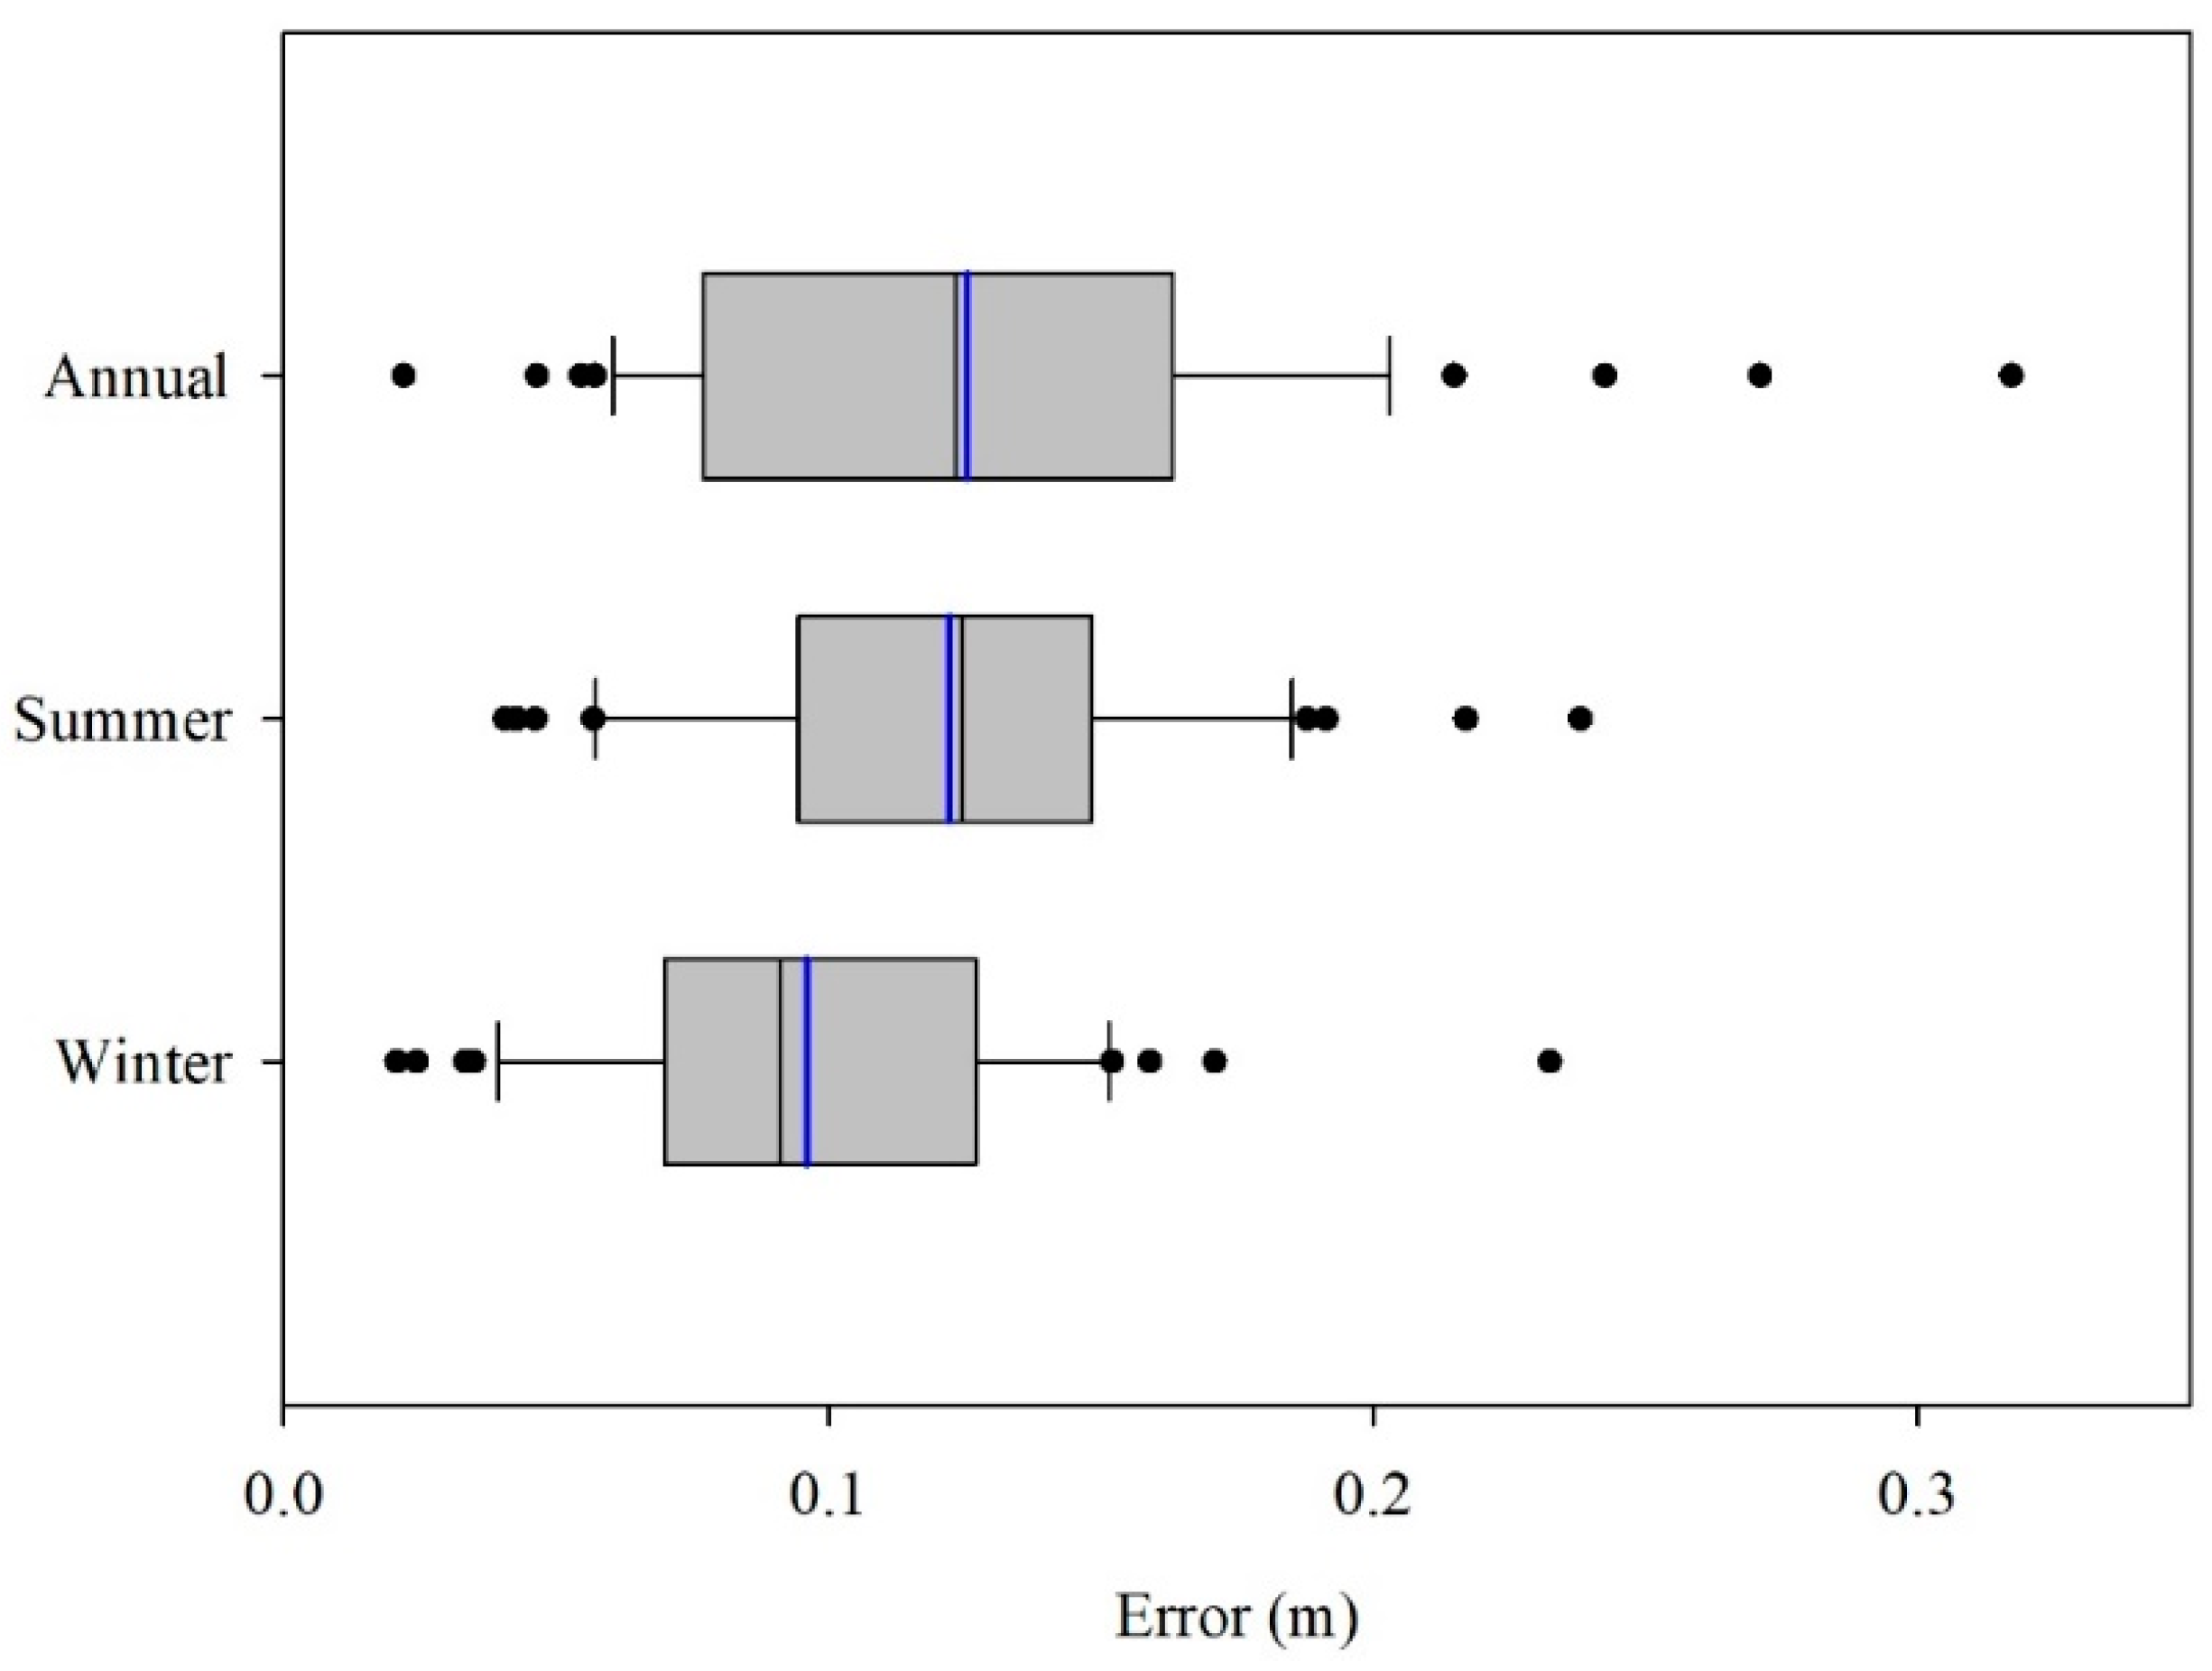
4.1. Accuracy of DEMs and Orthophotos by UAV Measurements
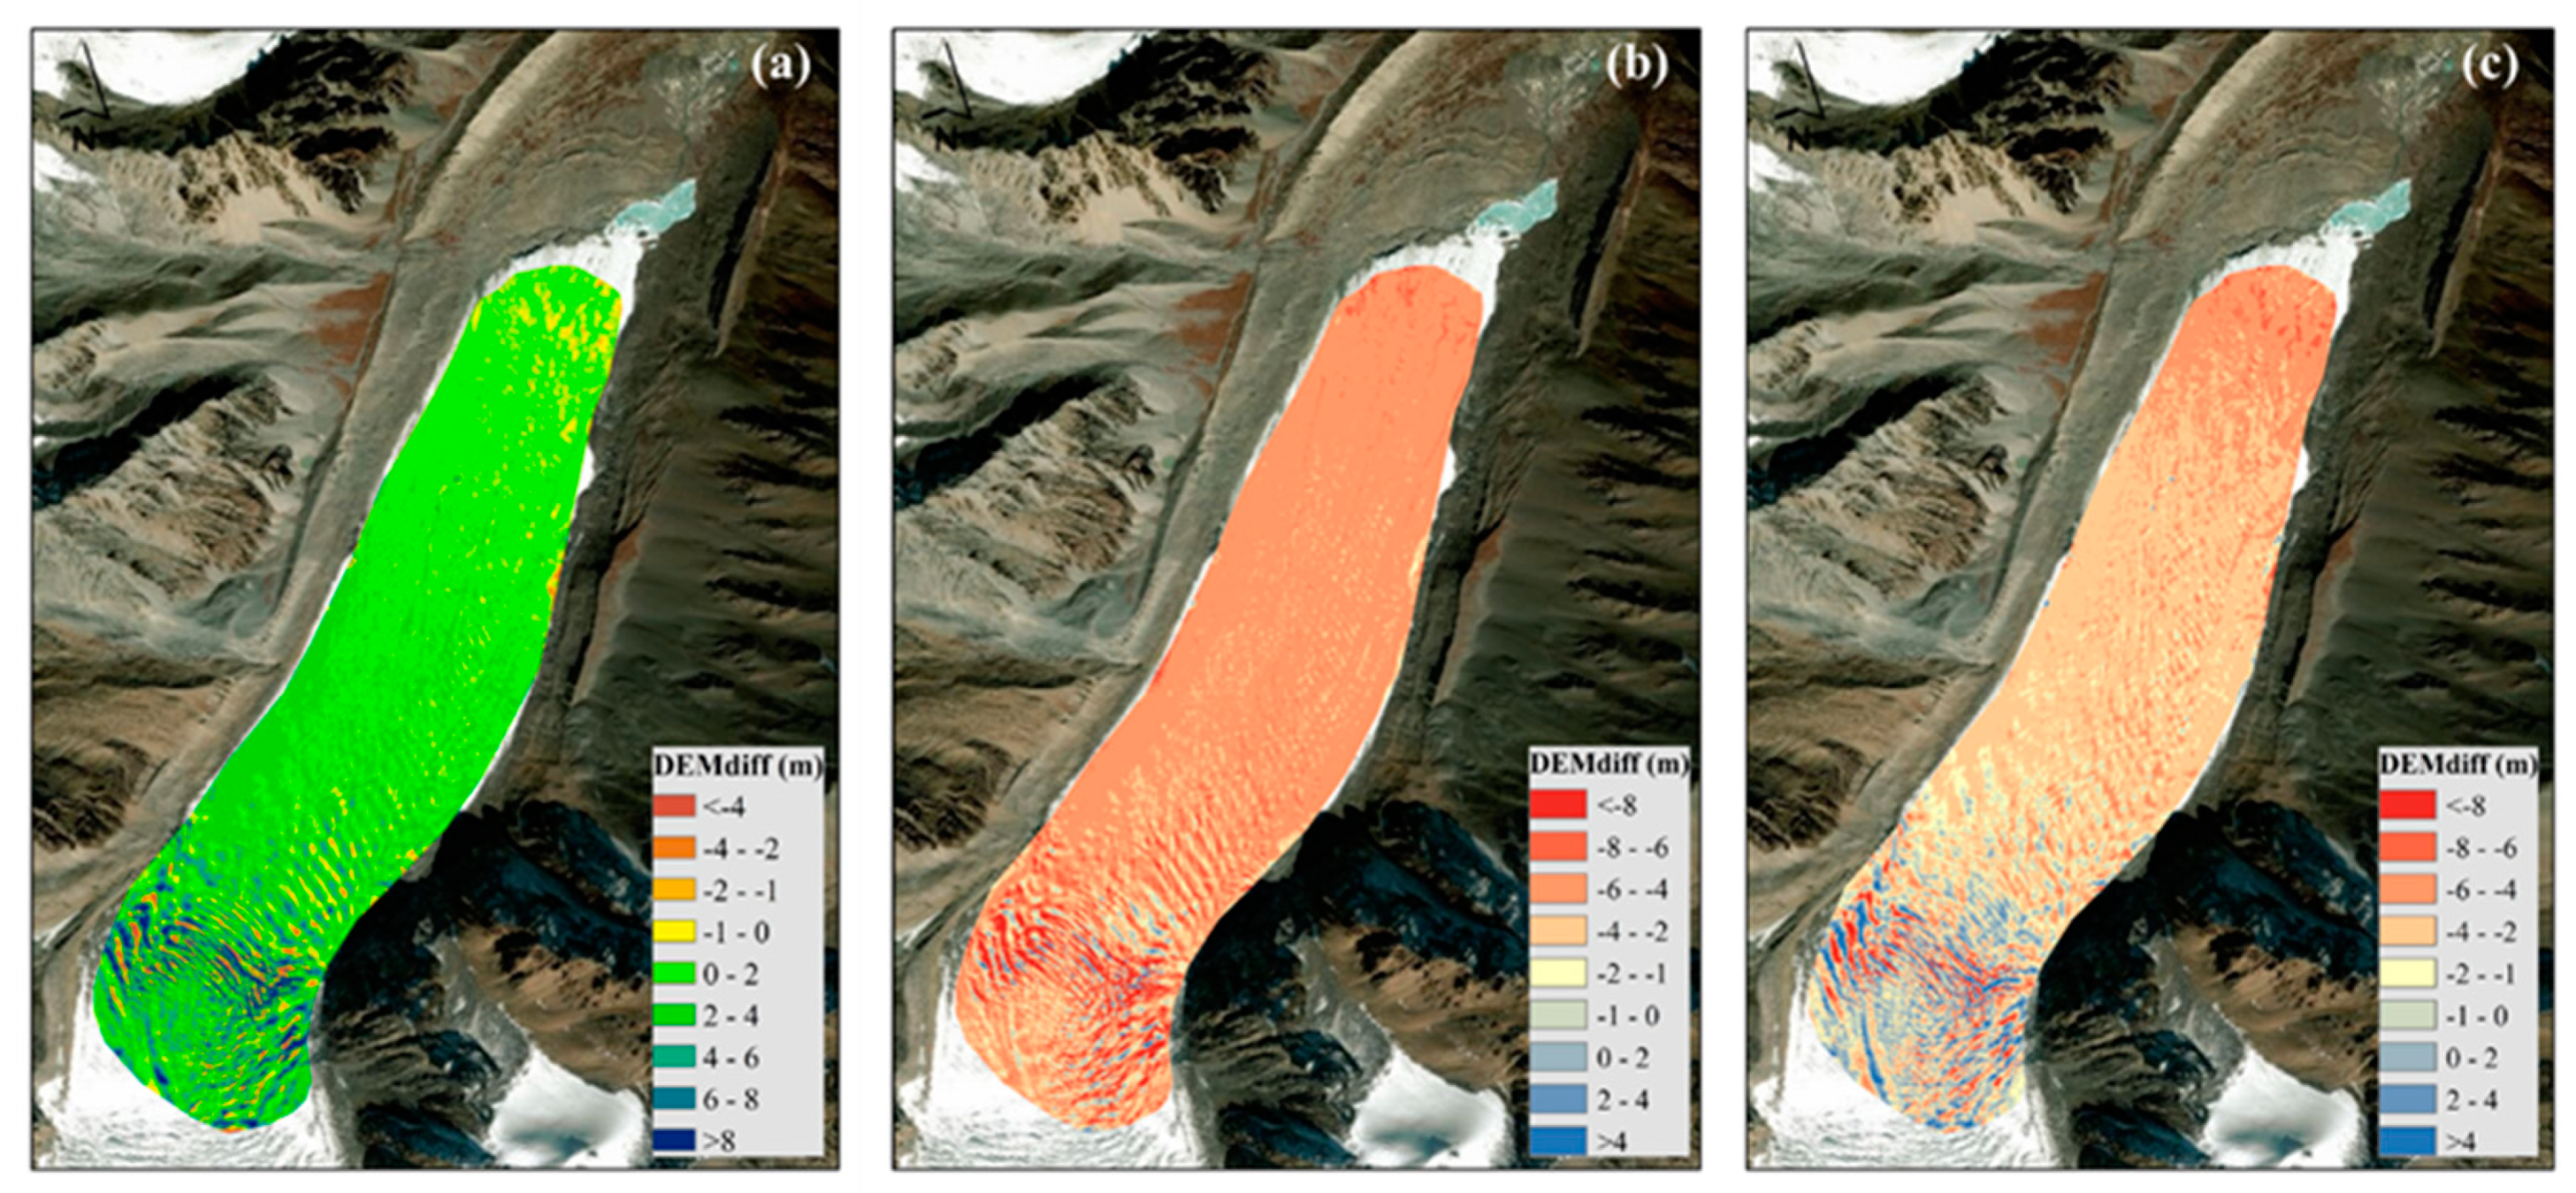
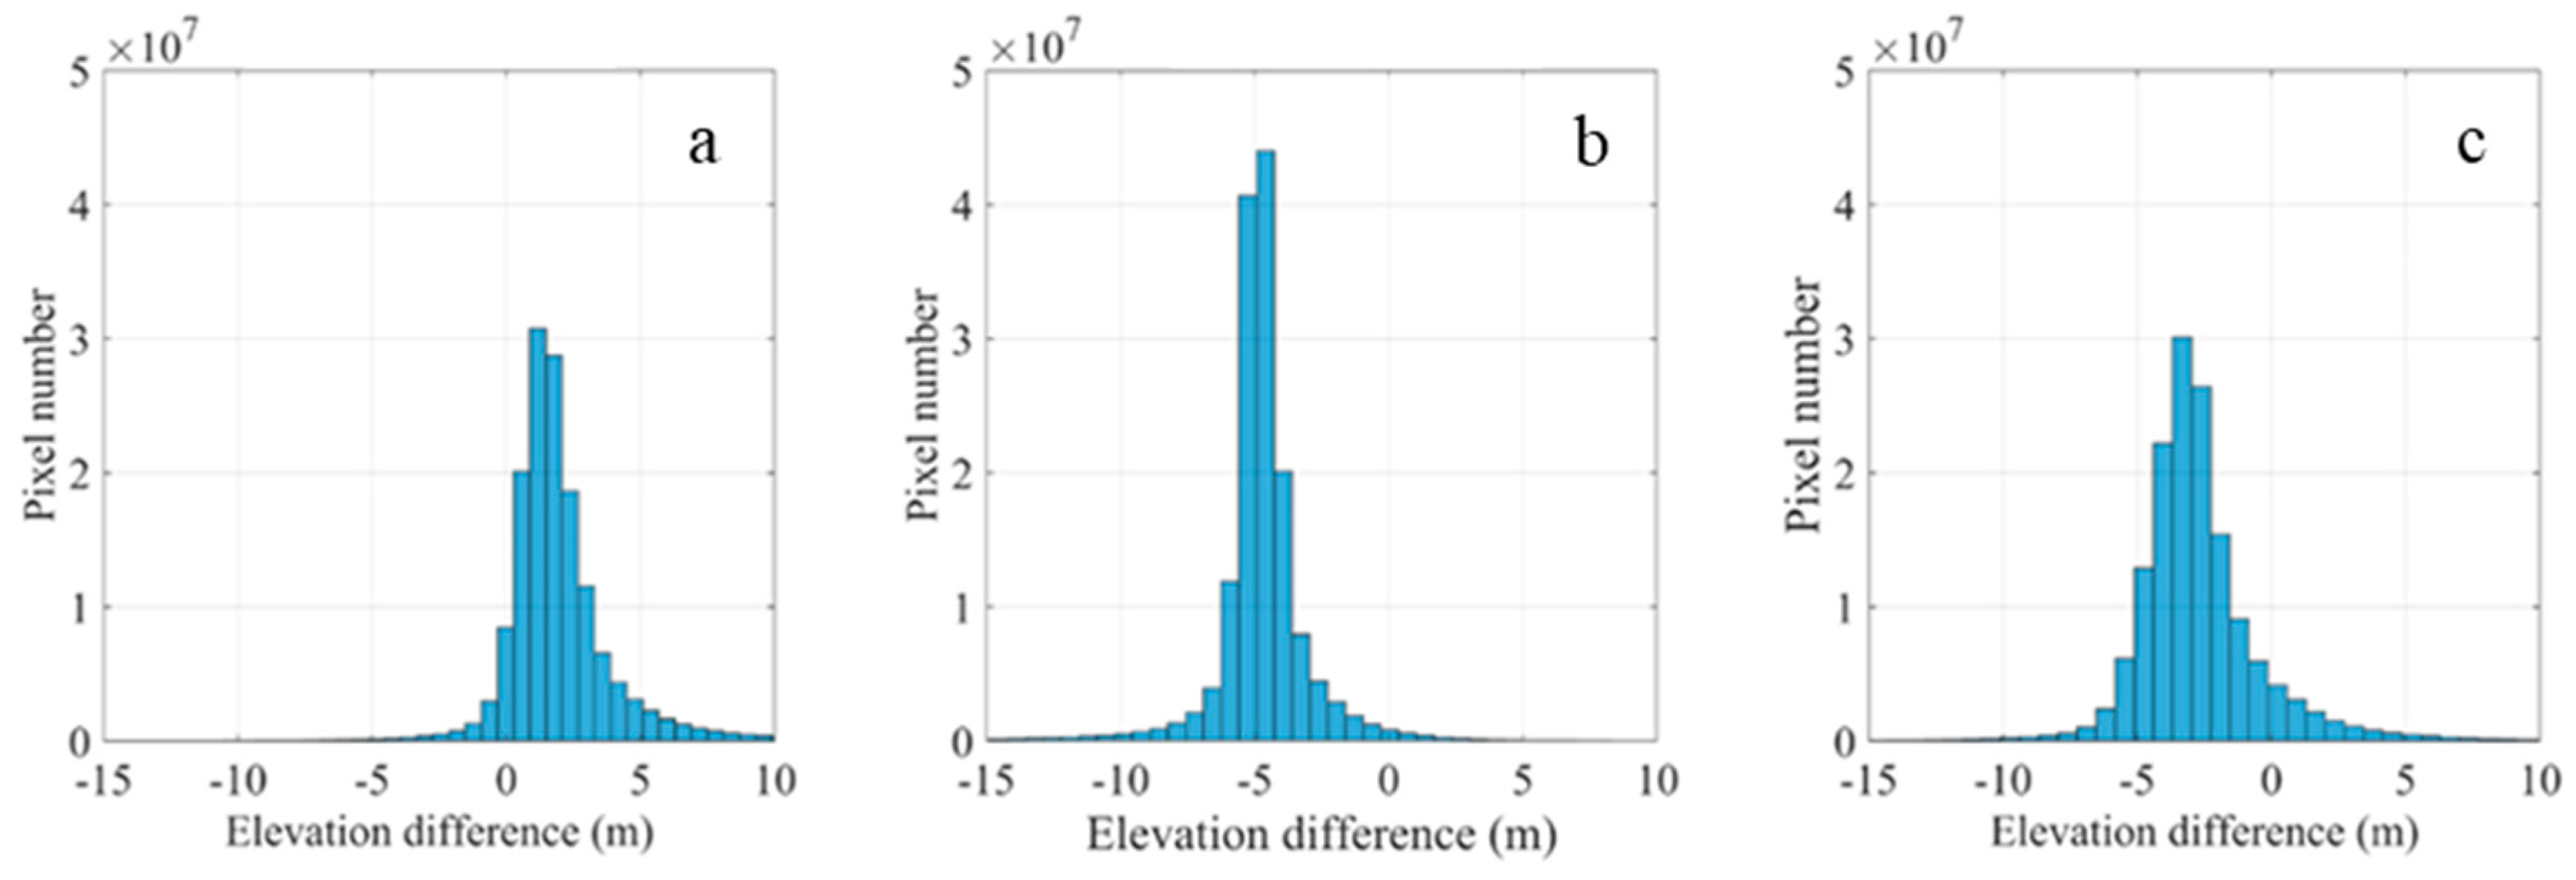
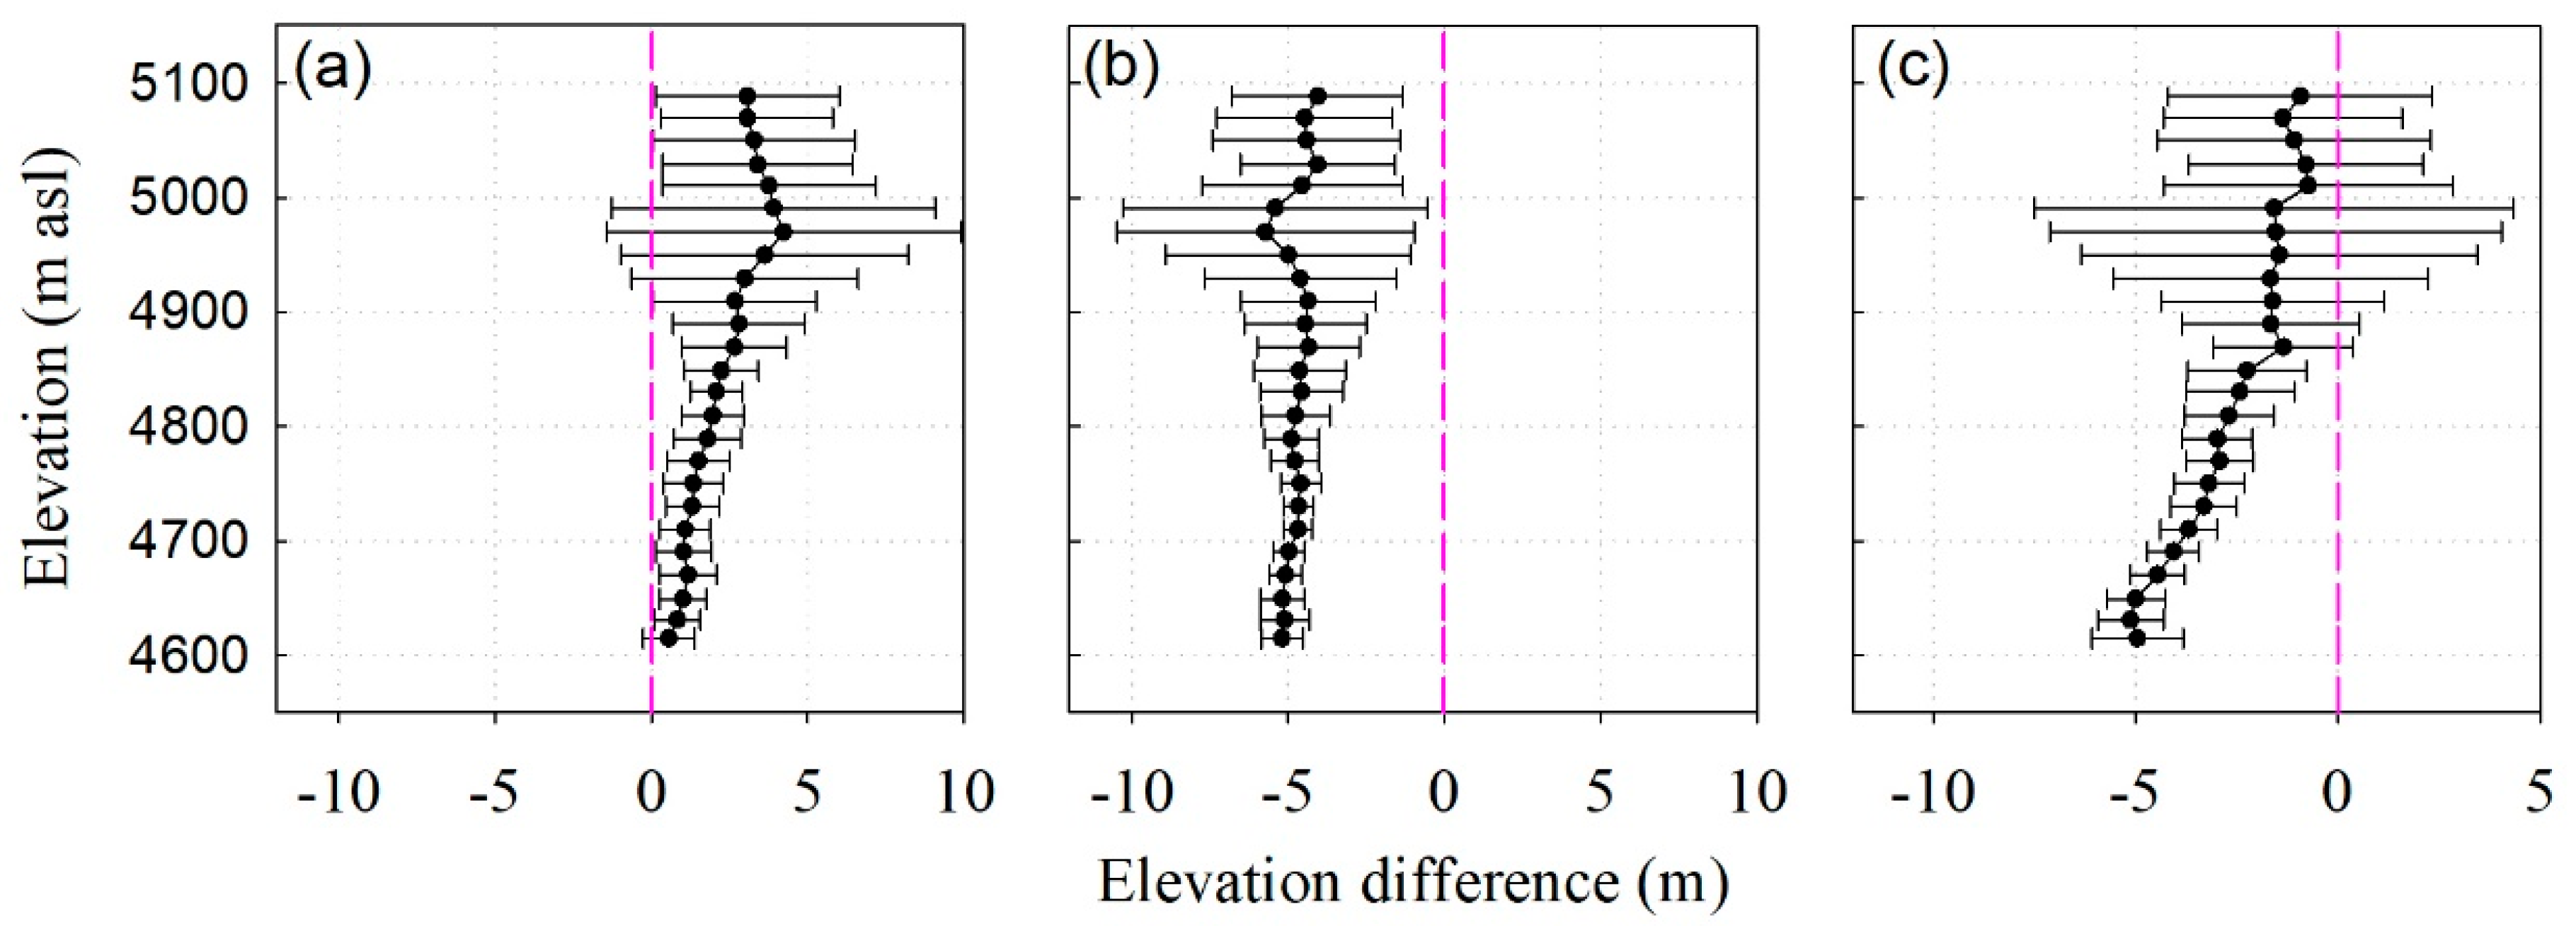
4.2. Surface Elevation Changes at Different Seasons
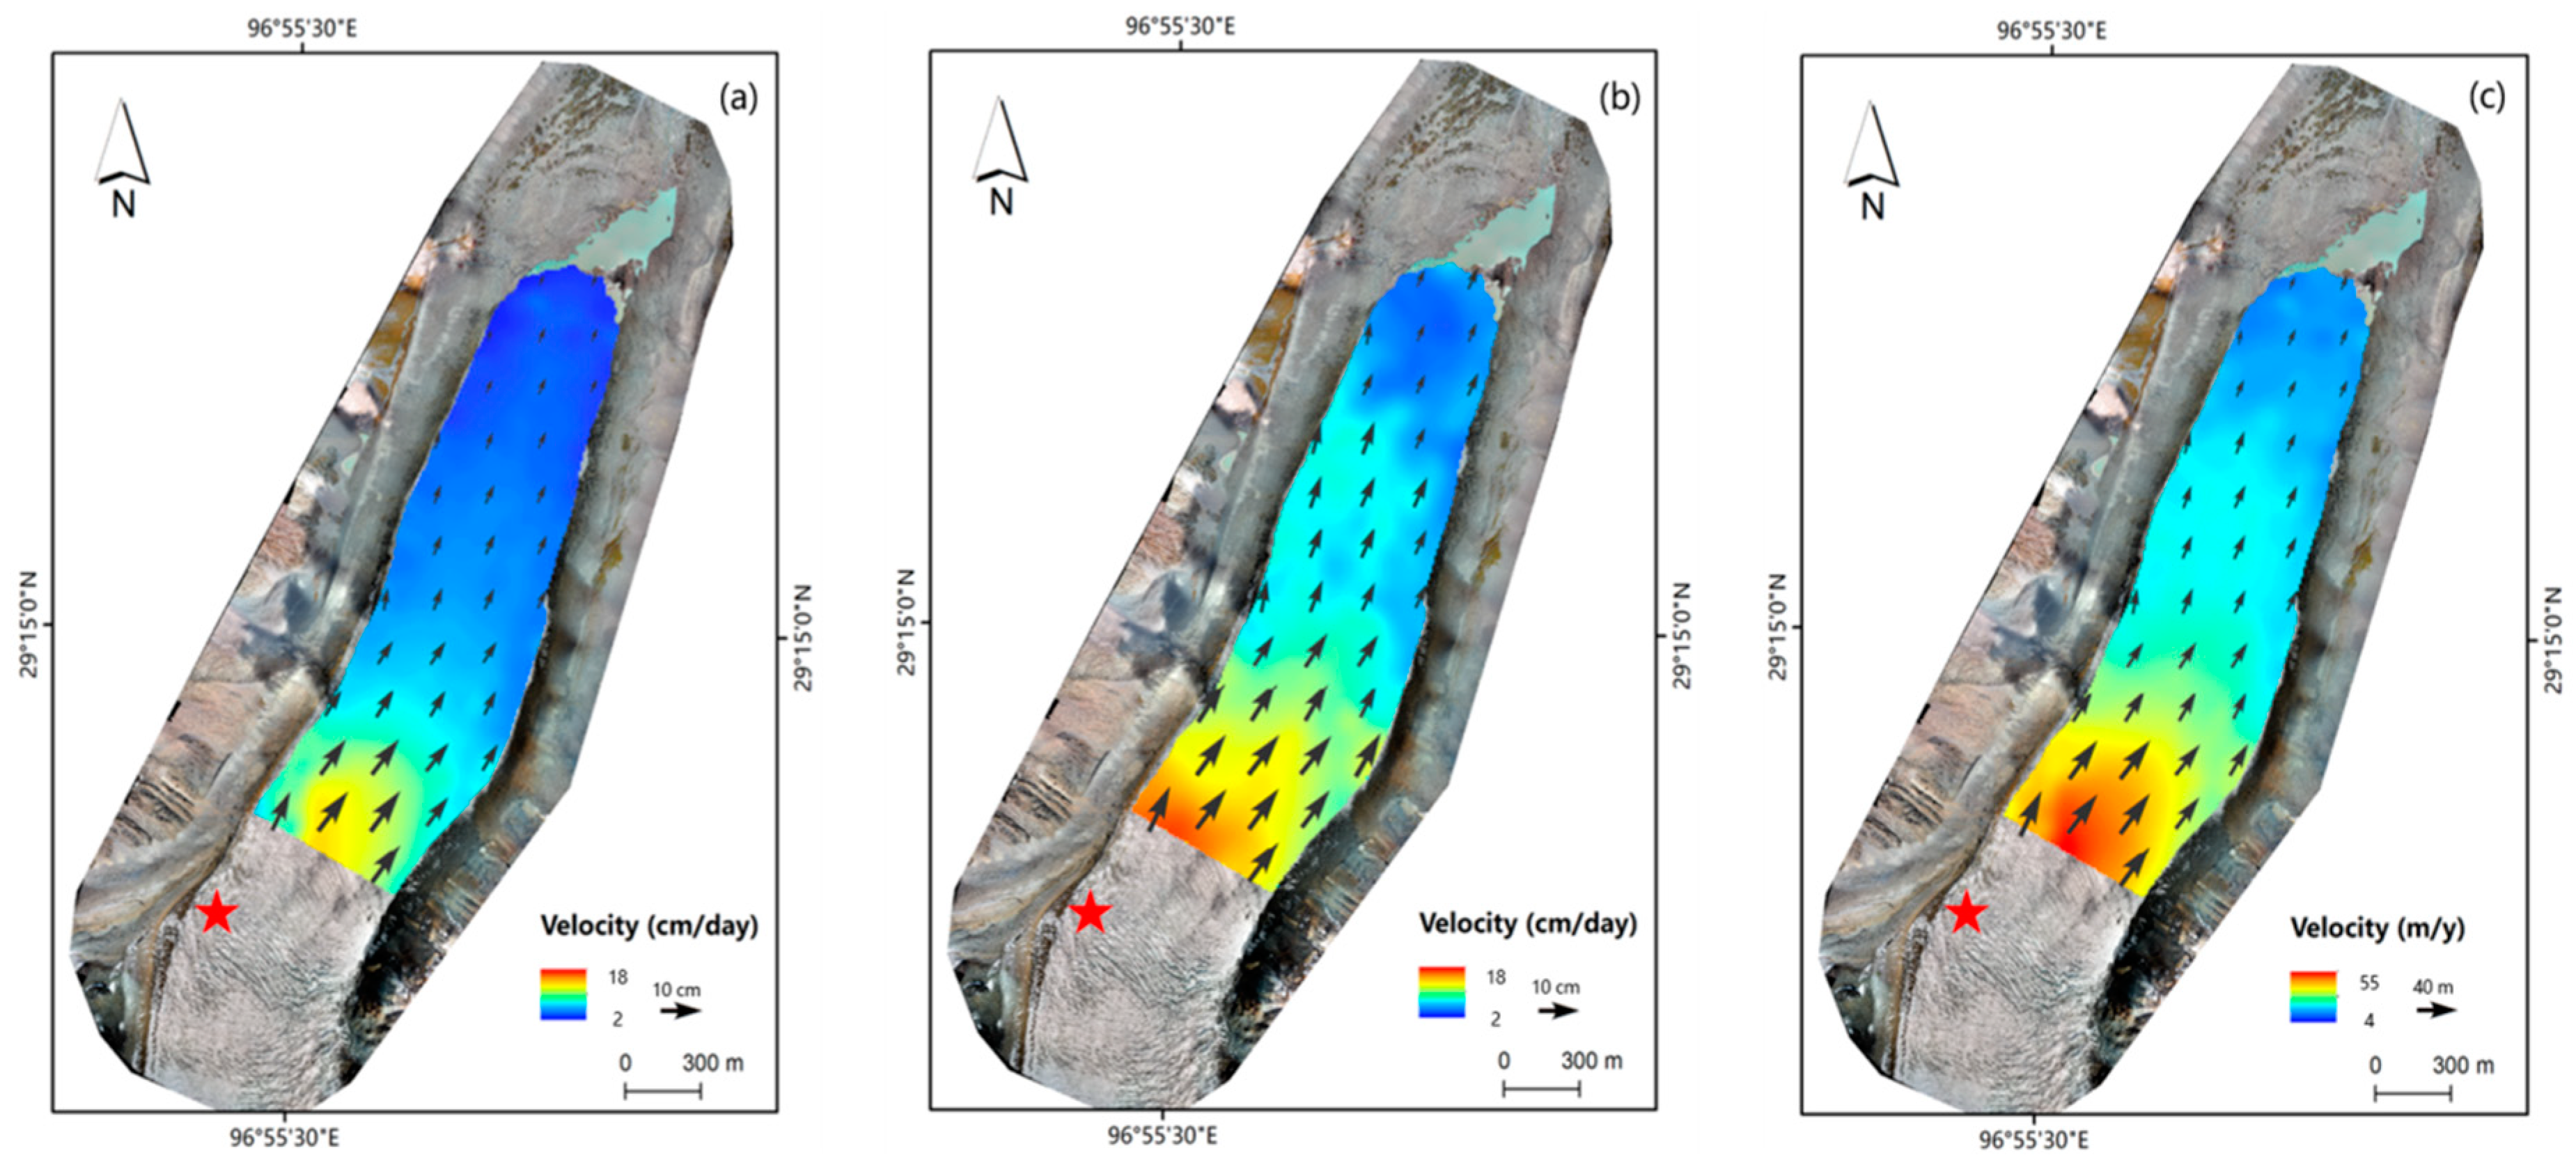
4.3. Surface Velocity
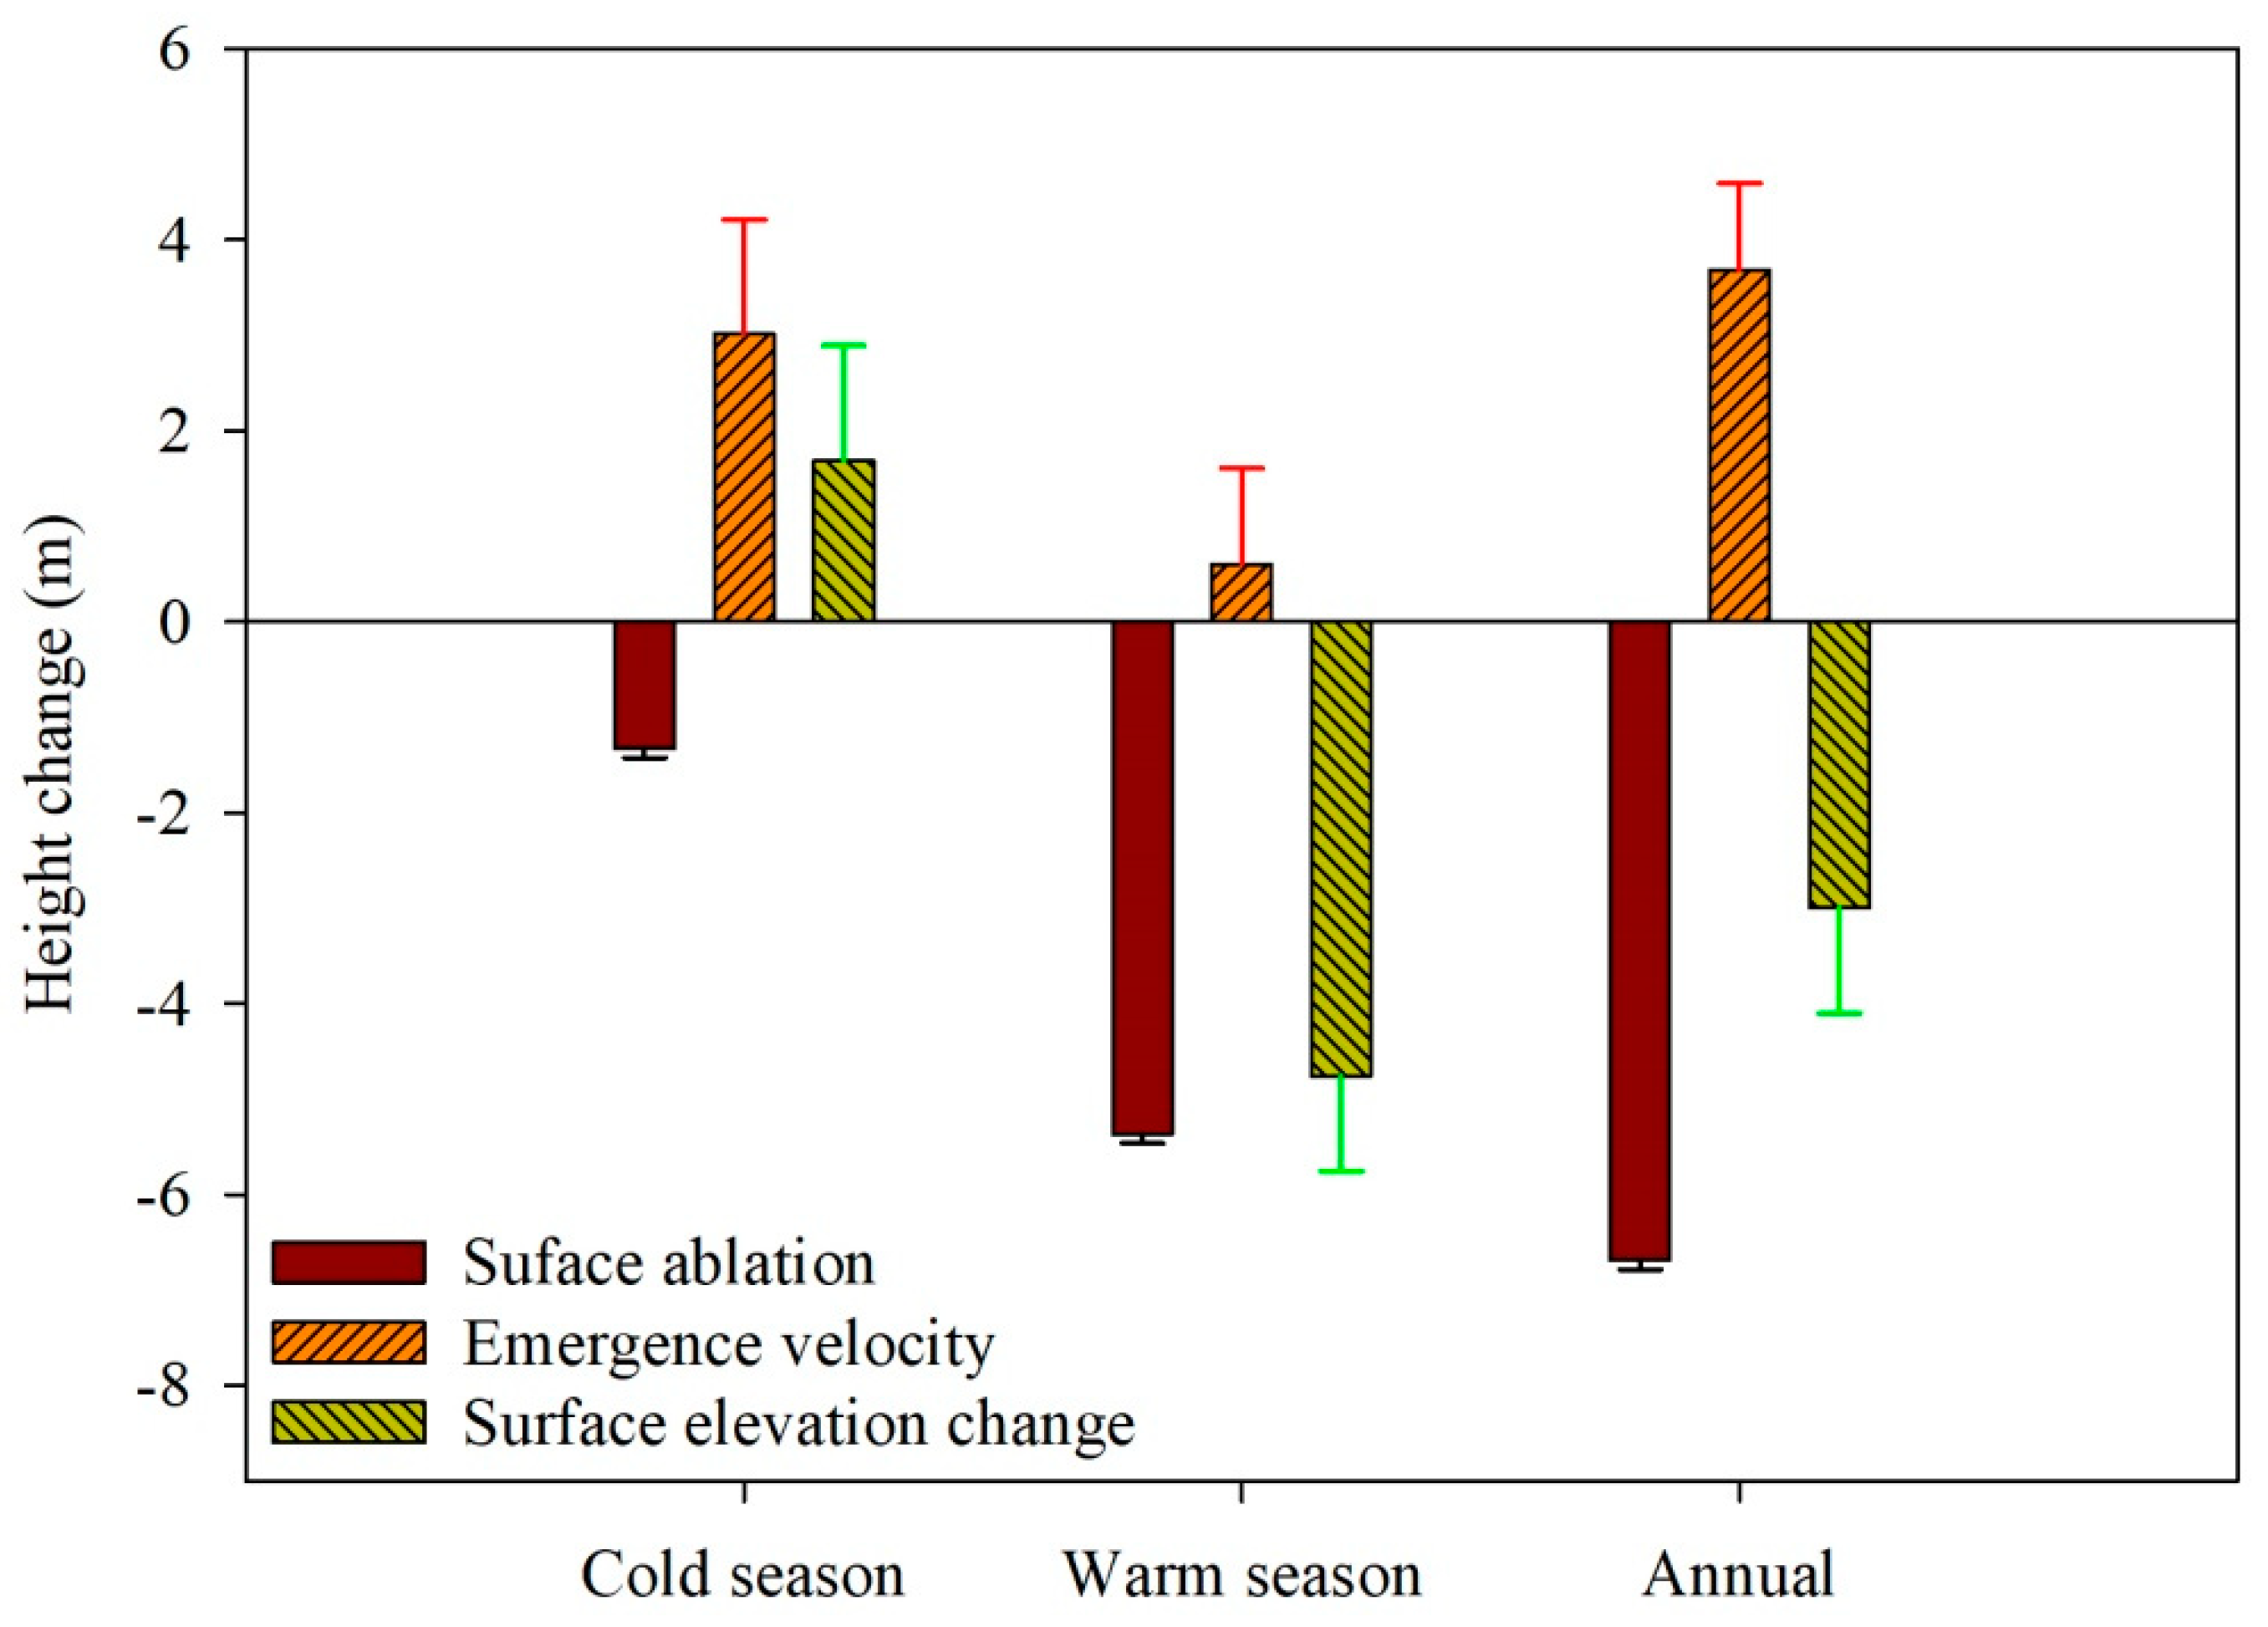
4.4. Surface Ablation and Emergence Velocity
5. Discussion
5.1. The Contributions of Surface Ablation and Emergence Velocity to Surface Elevation Change
5.2. The Possible Mechanism of Dynamic Thickening in Cold Season and the Impact on Regional Glacier Changes
6. Conclusions
Author Contributions
Funding
Conflicts of Interest
Appendix A

References
- Yao, T.; Thompson, L.; Yang, W.; Yu, W.; Gao, Y.; Guo, X.; Yang, X.; Duan, K.; Zhao, H.; Xu, B.; et al. Different glacier status with atmospheric circulations in Tibetan Plateau and surroundings. Nat. Clim. Chang. 2012, 2, 663–667. [Google Scholar] [CrossRef]
- Kääb, A.; Berthier, E.; Nuth, C.; Gardelle, J.; Arnaud, Y. Contrasting patterns of early twenty-first-century glacier mass change in the Himalayas. Nature 2012, 488, 495–498. [Google Scholar] [CrossRef] [PubMed]
- Wang, W.C.; Yao, T.D.; Yang, X.X. Variations of glacial lakes and glaciers in the Boshula mountain range, southeast Tibet, from the 1970s to 2009. Ann. Glaciol. 2011, 52, 9–17. [Google Scholar] [CrossRef]
- Veha, G.; Korup, O.; Walz, A. Hazard from Himalayan glacier lake outburst floods. Proc. Natl. Acad. Sci. USA 2020, 907–912. [Google Scholar] [CrossRef] [PubMed]
- Kääb, A.; Leinss, S.; Gilbert, A.; Bühler, Y.; Gascoin, S.; Evans, S.G.; Bartelt, P.; Berthier, E.; Brun, F.; Chao, W.-A.; et al. Massive collapse of two glaciers in western Tibet in 2016 after surge-like instability. Nat. Geosci. 2018, 11, 114–120. [Google Scholar] [CrossRef]
- Wei, R.Q.; Zeng, Q.L.; Davies, T.; Yuan, G.X.; Wang, K.Y.; Xue, X.Y.; Yin, Q.F. Geohazard cascade and mechanism of large debris flows in Tianmo gully, SE Tibetan Plateau and implications to hazard monitoring. Eng. Geol. 2018, 233, 172–182. [Google Scholar] [CrossRef]
- Allen, S.K.; Zhang, G.Q.; Wang, W.C.; Yao, T.D.; Bolch, T. Potentially dangerous glacial lakes across the Tibetan Plateau revealed using a large-scale automated assessment approach. Sci. Bull. 2019, 64, 435–445. [Google Scholar] [CrossRef]
- Immerzeel, W.W.; Kraaijenbrink, P.D.A.; Shea, J.M.; Shrestha, A.B.; Pellicciotti, F.; Bierkens, M.F.P.; Jong, S.M.D. High-resolution monitoring of Himalayan glacier dynamics using unmanned aerial vehicles. Remote Sens. Environ. 2014, 150, 93–103. [Google Scholar] [CrossRef]
- Kraaijenbrink, P.; Meijer, S.W.; Shea, J.M.; Pellicciotti, F.; Immerzeel, W.W. Seasonal surface velocities of a Himalayan glacier derived by automated correlation of unmanned aerial vehicle imagery. Ann. Glaciol. 2016, 57, 103–113. [Google Scholar] [CrossRef]
- Kraaijenbrink, P.D.A.; Shea, J.M.; Litt, M.; Steiner, J.F.; Treichler, D.; Koch, I.; Immerzeel, W.W. Mapping Surface Temperatures on a Debris-Covered Glacier With an Unmanned Aerial Vehicle. Front. Earth Sci. 2018, 6, 64. [Google Scholar] [CrossRef]
- Wigmore, O.; Mark, B. Monitoring tropical debris-covered glacier dynamics from high-resolution unmanned aerial vehicle photogrammetry, Cordillera Blanca, Peru. Cryosphere 2017, 11, 2463–2480. [Google Scholar] [CrossRef]
- Fugazza, D.; Scaioni, M.; Corti, M.; D’Agata, C.; Azzoni, R.S.; Cernuschi, M.; Smiraglia, C.; Diolaiuti, G.A. Combination of UAV and terrestrial photogrammetry to assess rapid glacier evolution and map glacier hazards. Nat. Hazards Earth Syst. Sci. 2018, 18, 1055–1071. [Google Scholar] [CrossRef]
- Rossini, M.; Mauro, B.D.; Garzonio, R.; Baccolo, G.; Cavallini, G.; Mattavelli, M.; De Amicis, M.; Colombo, R. Rapid melting dynamics of an alpine glacier with repeated UAV photogrammetry. Geomorphology 2018, 304, 159–172. [Google Scholar] [CrossRef]
- Westoby, M.J.; Brasington, J.; Glasser, N.F.; Hambrey, M.J.; Reynolds, J.M. ‘Structure-from-Motion’ photogrammetry: A low-cost, effective tool for geoscience applications. Geomorphology 2012, 179, 300–314. [Google Scholar] [CrossRef]
- Benoit, L.; Gourdon, A.; Vallat, R.; Irarrazaval, I.; Gravey, M.; Lehmann, B.; Prasicek, G.; Graff, D.; Herman, F.; Mariethoz, G. A high-resolution image time series of the Gorner Glacier - Swiss Alps - derived from repeated unmanned aerial vehicle surveys. Earth Syst. Sci. Data 2019, 11, 579–588. [Google Scholar] [CrossRef]
- Gindraux, S.; Boesch, R.; Farinotti, D. Accuracy Assessment of Digital Surface Models from Unmanned Aerial Vehicles’ Imagery on Glaciers. Remote Sens. 2017, 9, 186. [Google Scholar] [CrossRef]
- James, M.R.; Robson, S.; d’Oleire-Oltmanns, S.; Niethammer, U. Optimising UAV topographic surveys processed with structure-from-motion: Ground control quality, quantity and bundle adjustment. Geomorphology 2017, 280, 51–66. [Google Scholar] [CrossRef]
- Chudley, T.R.; Christoffersen, P.; Doyle, S.H.; Abellan, A.; Snooke, N. High-accuracy UAV photogrammetry of ice sheet dynamics with no ground control. Cryosphere 2019, 13, 955–968. [Google Scholar] [CrossRef]
- Padro, J.C.; Munoz, F.J.; Planas, J.; Pons, X. Comparison of four UAV georeferencing methods for environmental monitoring purposes focusing on the combined use with airborne and satellite remote sensing platforms. Int. J. Appl. Earth. Obs. Geoinf. 2019, 75, 130–140. [Google Scholar] [CrossRef]
- Teng, L.; Zhang, B.; Cheng, X.; Westoby, M.J.; Li, Z.; Ma, C.; Hui, F.; Shokr, M.; Liu, Y.; Chen, Z.; et al. Resolving Fine-Scale Surface Features on Polar Sea Ice: A First Assessment of UAS Photogrammetry without Ground Control. Remote Sens. 2019, 11, 784. [Google Scholar]
- Brun, F.; Wagnon, P.; Berthier, E.; Shea, J.M.; Immerzeel, W.W.; Kraaijenbrink, P.D.A.; Vincent, C.; Reverchon, C.; Shrestha, D.; Arnaud, Y. Ice cliff contribution to the tongue-wide ablation of Changri Nup Glacier, Nepal, central Himalaya. Cryosphere 2018, 12, 3439–3457. [Google Scholar] [CrossRef]
- van Woerkom, T.; Steiner, J.F.; Kraaijenbrink, P.D.A.; Miles, E.S.; Immerzeel, W.W. Sediment supply from lateral moraines to a debris-covered glacier in the Himalaya. Earth Surf. Dyn. 2019, 7, 411–427. [Google Scholar] [CrossRef]
- Cogley, J.G.; Arendt, A.A.; Bauder, A.; Braithwaite, R.J.; Hock, R.; Jansson, P.; Kaser, G.; Moller, M.; Nicholson, L.; Rasmussen, L.A.; et al. Glossary of Glacier Mass Balance and Related Terms (IHP-VII Technical Documents in Hydrology), 1st ed.; International Hydrological Programme: Paris, France, 2010; volume 86, pp. 1–124. [Google Scholar]
- Berthier, E.; Vincent, C. Relative contribution of surface mass-balance and ice-flux changes to the accelerated thinning of Mer de Glace, French Alps, over 1979–2008. J. Glaciol. 2012, 58, 501–512. [Google Scholar] [CrossRef]
- Yang, W.; Yao, T.D.; Guo, X.F.; Zhu, M.L.; Li, S.H.; Kattel, D.B. Mass balance of a maritime glacier on the southeast Tibetan Plateau and its climatic sensitivity. J. Geophys. Res. Atmos. 2013, 118, 9579–9594. [Google Scholar] [CrossRef]
- Ye, D.; Gao, Y. Meteorology of the Tibetan Plateau; Science Press: Beijing, China, 1979; pp. 49–61. [Google Scholar]
- Shi, Y.; Liu, C.; Wang, Z. Concise Glacier Inventory of China; Shanghai Popular Science Press: Shanghai, China, 2008. [Google Scholar]
- Shi, Y.; Liu, S. Estimation on the response of glaciers in China to the global warming in the 21st century. Chin. Sci. Bull. 2000, 45, 668–672. [Google Scholar] [CrossRef]
- Brun, F.; Berthier, E.; Wagnon, P.; Kääb, A.; Treichler, D. A spatially resolved estimate of High Mountain Asia glacier mass balances from 2000 to 2016. Nat. Geosci. 2017, 10, 668–673. [Google Scholar] [CrossRef]
- Wu, K.P.; Liu, S.Y.; Jiang, Z.L.; Xu, J.L.; Wei, J.F.; Guo, W.Q. Recent glacier mass balance and area changes in the Kangri Karpo Mountains from DEMs and glacier inventories. Cryosphere 2018, 12, 103–121. [Google Scholar] [CrossRef]
- Ren, S.; Menenti, M.; Jia, L.; Zhang, J.; Zhang, J.; Li, X. Glacier Mass Balance in the Nyainqentanglha Mountains between 2000 and 2017 Retrieved from ZiYuan-3 Stereo Images and the SRTM DEM. Remote Sens. 2020, 12, 864. [Google Scholar] [CrossRef]
- Shean, D.E.; Bhushan, S.; Montesano, P.; Rounce, D.R.; Arendt, A.; Osmanoglu, B. A Systematic, Regional Assessment of High Mountain Asia Glacier Mass Balance. Front. Earth Sci. 2020, 7. [Google Scholar] [CrossRef]
- Yang, W.; Guo, X.; Yao, T.; Zhu, M.; Wang, Y. Recent accelerating mass loss of southeast Tibetan glaciers and the relationship with changes in macroscale atmospheric circulations. Clim. Dyn. 2016, 47, 805–815. [Google Scholar] [CrossRef]
- Yao, T.D.; Li, Z.G.; Yang, W.; Guo, X.J.; Zhu, L.P.; Kang, S.C.; Wu, Y.H.; Yu, W.S. Glacial distribution and mass balance in the Yarlung Zangbo River and its influence on lakes. Chin. Sci. Bull. 2010, 55, 2072–2078. [Google Scholar] [CrossRef]
- Yang, W.; Guo, X.F.; Yao, T.D.; Yang, K.; Zhao, L.; Li, S.H.; Zhu, M.L. Summertime surface energy budget and ablation modeling in the ablation zone of a maritime Tibetan glacier. J. Geophys. Res. Atmos. 2011, 116. [Google Scholar] [CrossRef]
- Messerli, A.; Grinsted, A. Image georectification and feature tracking toolbox: ImGRAFT. Geosci. Instrum. Methods Data Syst. 2015, 4, 23–34. [Google Scholar] [CrossRef]
- Satyabala, S.P. Spatiotemporal variations in surface velocity of the Gangotri glacier, Garhwal Himalaya, India: Study using synthetic aperture radar data. Remote Sens. Environ. 2016, 181, 151–161. [Google Scholar] [CrossRef]
- Sakai, A.; Fujita, K.; Duan, K.; Pu, J.; Nakawo, M.; Yao, T. Five decades of shrinkage of July 1st glacier, Qilian Shan, China. J. Glaciol. 2006, 52, 11–16. [Google Scholar] [CrossRef]
- Xu, C.; Li, Z.; Li, H.; Wang, F.; Zhou, P. Long-range terrestrial laser scanning measurements of annual and intra-annual mass balances for Urumqi Glacier No. 1, eastern Tien Shan, China. Cryosphere 2019, 13, 2361–2383. [Google Scholar] [CrossRef]
- Nuimura, T.; Fujita, K.; Sakai, A. Downwasting of the debris-covered area of Lirung Glacier in Langtang Valley, Nepal Himalaya, from 1974 to 2010. Quat. Int. 2017, 455, 93–101. [Google Scholar] [CrossRef]
- Nuimura, T.; Fujita, K.; Fukui, K.; Asahi, K.; Aryal, R.; Ageta, Y. Temporal Changes in Elevation of the Debris-Covered Ablation Area of Khumbu Glacier in the Nepal Himalaya since 1978. Arct. Antarct. Alp. Res. 2011, 43, 246–255. [Google Scholar] [CrossRef]
- Xu, B.Q.; Wang, M.; Joswiak, D.R.; Cao, J.J.; Yao, T.D.; Wu, G.J.; Yang, W.; Zhao, H.B. Deposition of anthropogenic aerosols in a southeastern Tibetan glacier. J. Geophys. Res. Atmos. 2009, 114. [Google Scholar] [CrossRef]
- Xu, B.; Cao, J.; Hansen, J.; Yao, T.; Joswia, D.R.; Wang, N.; Wu, G.; Wang, M.; Zhao, H.; Yang, W.; et al. Black soot and the survival of Tibetan glaciers. Proc. Natl. Acad. Sci. USA 2009, 106, 22114–22118. [Google Scholar] [CrossRef]
- Maussion, F.; Scherer, D.; Molg, T.; Collier, E.; Curio, J.; Finkelnburg, R. Precipitation Seasonality and Variability over the Tibetan Plateau as Resolved by the High Asia Reanalysis. J. Clim. 2014, 27, 1910–1927. [Google Scholar] [CrossRef]
- Fujita, K.; Ageta, Y. Effect of summer accumulation on glacier mass balance on the Tibetan Plateau revealed by mass-balance model. J. Glaciol. 2000, 46, 244–252. [Google Scholar] [CrossRef]
- Ke, L.; Song, C.; Yong, B.; Lei, Y.; Ding, X. Which heterogeneous glacier melting patterns can be robustly observed from space? A multi-scale assessment in southeastern Tibetan Plateau. Remote Sens. Environ. 2020, 242, 111777. [Google Scholar] [CrossRef]
- Dehecq, A.; Gourmelen, N.; Gardner, A.S.; Brun, F.; Goldberg, D.; Nienow, P.W.; Berthier, E.; Vincent, C.; Wagnon, P.; Trouve, E. Twenty-first century glacier slowdown driven by mass loss in High Mountain Asia. Nat. Geosci. 2019, 12, 22–27. [Google Scholar] [CrossRef]


| Survey Time | Number of Images | Flight Altitude | Flight Time | Ground Resolution (cm) | Coverage Area (km2) | Flight Time (Beijing Time) |
|---|---|---|---|---|---|---|
| (m) | (min) | |||||
| 23 September 2018 | 460 | 324 | 83 | 9 | 6.3 | 11:30–12:52 |
| 7 June 2019 | 504 | 428 | 84 | 12 | 6.4 | 11:08–12:32 |
| 7 October 2019 | 652 | 328 | 149 | 9 | 5.4 | 09:15–10:44 |
| Stake | Elevation (m asl) | Cold Season (258 days) | Warm Season (122 days) | Annual (380 days) | ||||||
|---|---|---|---|---|---|---|---|---|---|---|
| S1 | 4660 | 1.2 ± 0.9 | −2.2 ± 0.1 | 3.4 ± 1.0 | −5.1 ± 0.5 | −6.5 ± 0.1 | 1.4 ± 0.6 | −4.5 ± 0.7 | −8.7 ± 0.1 | 4.2 ± 0.8 |
| S2 | 4720 | 1.3 ± 0.9 | −1.3 ± 0.1 | 2.7 ± 1.0 | −4.7 ± 0.5 | −5.4 ± 0.1 | 0.8 ± 0.6 | −3.3 ± 0.8 | −6.8 ± 0.1 | 3.5 ± 0.9 |
| S3 | 4760 | 1.5 ± 1.0 | −1.1 ± 0.1 | 2.6 ± 1.1 | −4.8 ± 0.8 | −5.1 ± 0.1 | 0.3 ± 0.9 | −2.9 ± 0.8 | −6.2 ± 0.1 | 3.2 ± 0.9 |
| S4 | 4780 | 1.8 ± 1.1 | −1.1 ± 0.1 | 2.8 ± 1.2 | −4.9 ± 0.9 | −5.0 ± 0.1 | 0.1 ±1.0 | −3.0 ± 0.9 | −6.0 ± 0.1 | 3.0 ± 1.0 |
| S5 | 4870 | 2.7 ± 1.7 | −1.0 ± 0.1 | 3.7 ± 1.8 | −4.3 ± 1.6 | −4.9 ± 0.1 | 0.5 ± 1.7 | −1.3 ± 1.7 | −5.9 ± 0.1 | 4.5 ± 1.8 |
© 2020 by the authors. Licensee MDPI, Basel, Switzerland. This article is an open access article distributed under the terms and conditions of the Creative Commons Attribution (CC BY) license (http://creativecommons.org/licenses/by/4.0/).
Share and Cite
Yang, W.; Zhao, C.; Westoby, M.; Yao, T.; Wang, Y.; Pellicciotti, F.; Zhou, J.; He, Z.; Miles, E. Seasonal Dynamics of a Temperate Tibetan Glacier Revealed by High-Resolution UAV Photogrammetry and In Situ Measurements. Remote Sens. 2020, 12, 2389. https://doi.org/10.3390/rs12152389
Yang W, Zhao C, Westoby M, Yao T, Wang Y, Pellicciotti F, Zhou J, He Z, Miles E. Seasonal Dynamics of a Temperate Tibetan Glacier Revealed by High-Resolution UAV Photogrammetry and In Situ Measurements. Remote Sensing. 2020; 12(15):2389. https://doi.org/10.3390/rs12152389
Chicago/Turabian StyleYang, Wei, Chuanxi Zhao, Matthew Westoby, Tandong Yao, Yongjie Wang, Francesca Pellicciotti, Jianmin Zhou, Zhen He, and Evan Miles. 2020. "Seasonal Dynamics of a Temperate Tibetan Glacier Revealed by High-Resolution UAV Photogrammetry and In Situ Measurements" Remote Sensing 12, no. 15: 2389. https://doi.org/10.3390/rs12152389
APA StyleYang, W., Zhao, C., Westoby, M., Yao, T., Wang, Y., Pellicciotti, F., Zhou, J., He, Z., & Miles, E. (2020). Seasonal Dynamics of a Temperate Tibetan Glacier Revealed by High-Resolution UAV Photogrammetry and In Situ Measurements. Remote Sensing, 12(15), 2389. https://doi.org/10.3390/rs12152389