Abstract
The cross-spectral correlation approach has been used to estimate the wave spectrum from optical and radar images. This work aims to improve the cross-spectral approach to derive current velocity from the X-band marine radar image sequence, and evaluate the application conditions of the method. To reduce the dependency of gray levels on range and azimuth, radar images are preprocessed by the contrast-limited adaptive histogram equalization. Two-dimensional cross-spectral coherence and phase are derived from neighboring X-band marine radar images, and the phases with large coherences are used to estimate the phase velocity and angular frequency of waves, which are first fitted with the theoretical dispersion relation by different least square models, and then the current velocity can be determined. Compared with the current velocities measured by a current meter, the root-mean-square error, correlation coefficient, bias, and relative error are 0.15 m/s. 0.88, –0.05 m/s, and 7.79% for the north-south velocity, and 0.14 m/s, 0.86, 0.06 m/s, and 10.75% for the east-west velocity in the experimental area, respectively. The preprocessing, critical coherence, and the number of images for applying the cross-spectral approach, are discussed.
1. Introduction
The sea surface current is important for marine activities and scientific research. The current is usually measured using a current meter and an acoustic Doppler current profiler (ADCP), which provide current velocity with high accuracy, but can only be used at fixed positions, and they are both expensive and difficult to deploy [1]. Due to the high spatial and temporal resolutions, the X-band marine radar has been used in the observation of ocean waves and currents [2,3].
The X-band marine radar works under low grazing incidence angles, and records the radar backscatter from the sea surface as a gray level image. The algorithms used to retrieve the current from these X-band marine radar images are mainly based on a three-dimensional (3D) fast Fourier transform (FFT) [2]. By applying this 3D FFT on the radar image sequence, a 3D wavenumber-frequency spectrum is obtained, and then the current can be derived by minimizing the difference between the image spectrum and the theoretical dispersion relation [2,4,5,6]. 3D FFT requires that the global wave field be stationary and homogeneous. To overcome this disadvantage, the dispersive surface classificator was developed to analyze inhomogeneous image sequences on a local spatial scale [7]. Gangeskar [8] showed that the 3D FFT algorithms can provide high-accuracy current measurements using the X-band marine radar in deep water environments.
In addition to the algorithms based on 3D FFT, the cross-spectral correlation approach was used to derive wavenumber spectra from radar images and optical images. Engen and Johnsen [9] extracted the ocean wave spectrum from image cross-spectra by combining pairs of single look synthetic aperture radar (SAR) images, and showed that the image cross-spectra significantly reduce the speckle noise level, while preserving the spectral shape. Plant et al. [10] found that the solution of the cross-spectral approach is tolerant to noise and other forms of sampling deficiency; compared to the power spectral density fitting approach based on FFT, the cross-spectral correlation fitting improved the resolution by a factor of 10. In the cBathy algorithm, the dominant wave frequencies were estimated by Fourier transform, whereas the corresponding wavenumbers were derived from spatial gradients in the cross-spectral phase over analysis tiles that can be small, producing high spatial resolution [11,12]. However, the Doppler shift of the gravity wave caused by the current was ignored in the dispersion relation, so the current velocities were not obtained in these studies. Using the 3D wavenumber-frequency cross spectrum between power and the Doppler velocity measured by an X-band imaging Doppler radar, Frasier and McIntosh [13] studied the properties of microwave backscatter, but the method is still based on the 3D wavenumber-frequency spectrum, and the velocity measured by a Doppler radar is required. Kudryavtsev et al. [14,15] retrieved the directional wave spectrum from the high-resolution Sentinel-2 satellite sun glitter imagery, using the cross-channel correlation, and the surface current was derived by fitting the dispersion relation. They found an encouraging agreement between the retrieved wave spectra and several in-situ measurements.
Although the cross-spectral correlation approach has been used to estimate sea surface information from sea surface images, few people have studied the application conditions of the algorithm, especially in nearshore areas, where the wave field is inhomogeneous, and traditional algorithms may not be applicable [16]. In this study, several improvements to the cross-spectral correlation approach are proposed to derive current velocity from X-band marine radar image sequences. We then evaluated the approach under different conditions.
The remainder of this paper is organized as follows. The method to retrieve current velocity from an X-band marine radar image sequence is proposed in Section 2. The proposed method is evaluated using the experimental data in Section 3. The source of error and the application conditions are discussed in Section 4, and conclusions are provided in Section 5.
2. Method
In this section, the method to retrieve sea surface current velocity from a X-band marine radar image sequence is proposed, by using cross-spectra analysis and ocean wave theory.
2.1. Preprocessing of Radar Image
At low grazing incidence angles, tilt modulation and shadowing are important for the imaging of sea surface waves, so the images produced by the X-band marine radar are affected by the range and azimuth from the radar station [17]. To reduce the dependency of gray levels on range and azimuth, the radar images are preprocessed using contrast limited adaptive histogram equalization (CLAHE). CLAHE is a commonly used algorithm in digital image processing [18] that enhances the contrast of an image by applying contrast limited histogram equalization on small data regions, rather than upon the entire image, and then sticks back the resulting neighboring small tiles seamlessly, using bilinear interpolation. By limiting the contrast in a small homogeneous region, the variations in the radar image with range and azimuth can be reduced.
2.2. Cross-Spectral Correlation Approach
Assume that there are n images in an X-band marine radar image sequence, and is the gray level of location measured at time i.
Firstly, determine the cross-spectrum between each pair of neighboring images and , and the auto-spectrum of each image , where is the wavenumber, and is the direction.
To reduce the noise of the cross-spectra and auto-spectra, the spectra are averaged to determine the average cross-spectrum:
and the average auto-spectrum:
where the superscript (1,n) means the average of the 1st to the nth spectrum.
Secondly, obtain the cross-spectral coherence and cross-spectral phase of the radar image sequence by:
and:
where the mathematical operator |·| and are the modulus and argument of a complex number, respectively. However, 180° directional ambiguities exist in the cross-spectral coherence and phase. To remove the directional ambiguity, the true wave direction is chosen as that with positive phase using Equation (4). Then the peak wavenumber can be obtained from the peak of the cross-spectral coherence using Equation (3).
2.3. Estimation of Current Velocity
According to linear gravity wave theory, the dispersion relation is determined using:
where ω is the wave angular frequency; g is the gravitational acceleration; is the current velocity; and are the current components in north-south (NS) and east-west (EW) directions, respectively; and h is the water depth of the region.
To derive current velocity from an X-band marine radar image sequence using the cross-spectral approach, two methods are used.
2.3.1. Method 1
The first method to derive current velocity involves fitting the wave phase velocity derived from the theoretical dispersion relation with that estimated from radar images (named CSP1 for short).
According to the dispersion relation in Equation (5), the wave phase velocity can be obtained by:
According to the cross-spectral phase in Equation (4), the wave phase velocity can be estimated from an X-band marine radar image sequence using:
where Δt is the time delay between two neighboring radar images, i.e., the antenna rotation period of an X-band marine radar.
Then, the difference between the estimated phase velocity and that derived by the theoretical dispersion relation is:
where there are two undetermined variables: The current speed u and current direction θ. By choosing different directions , different phase velocities can be obtained from the cross-spectral phase (Equation (7)), then Equation (8) can be solved using the least squares method.
To deduce current velocity from an X-band marine radar image sequence using Equation (8), the wavenumber k and direction should be chosen as those with large coherences, because cross-spectra with small coherences are affected by noise or aliasing. In this study, the critical coherence was chosen as , and the cross-spectra with wavenumbers and directions that satisfy were used.
2.3.2. Method 2
The second method to derive current velocity is to fit the two-dimensional dispersion relation into Equation (5). Because the wave constituents with large cross-spectral coherences are significant, they are important to the Doppler shift in dispersion relation. The least-square model is weighted by the cross-spectral coherence in Equation (3), which is estimated from radar images (named CSP2):
where , , and ; the wavenumber k and direction are also chosen as those with large coherences; and are used here.
To evaluate different sea states, an indicator is defined as the average of the first five coherences for peak wave direction . When the sea state is high, the coherences are large, so is large under a high sea state; similarly, it decreases when the sea state is low. We found that is larger than about 0.7 under moderate and high sea states.
To summarize, our method used to retrieve current velocity from X-band marine radar image sequences is shown in Figure 1.
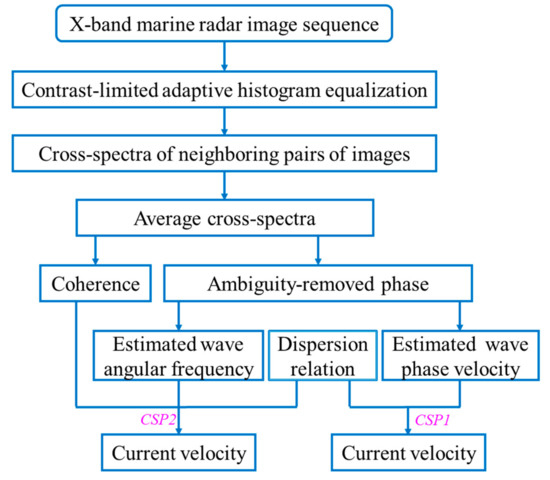
Figure 1.
The flowchart of the method used to retrieve sea surface current from an X-band marine radar image sequence.
3. Data and Result
In this section, the experimental data are illustrated and the methods are evaluated by comparing the current velocities retrieved from an X-band marine radar image sequence with in-situ measurements.
3.1. Experiment
An experiment was conducted on Haitan (or Pingtan) Island, of China (Figure 2a), from 27 October 2014 to 11 November 2014 [19,20]. During the experiment, an X-band marine radar system was used to acquire gray level images of the sea surface, and a current meter was deployed to collect current velocity simultaneously. According to a nautical chart, the water depths of the observation area were about 10–40 m. The tide of the area is dominated by a semidiurnal tide, the maximum tidal current velocity reaches up to 1.5–2 m/s, and the maximum tidal amplitude is more than 2 m. An anemometer was used near the radar station (A1 in Figure 2a), from December 2014 to January 2015 [19]; whereas the other anemometer was deployed about 10 km away from the radar station (A2 in Figure 2a), from October 2014 to January 2015. The wind was mostly from the northeast in the winter, and the waves propagated toward both the west and southwest in the field of view of the radar.
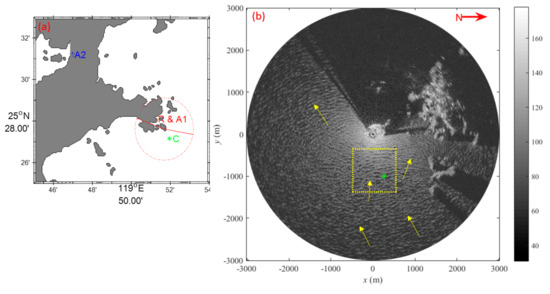
Figure 2.
(a) Map of the experimental area, where R, C, A1 and A2 mark the locations of the radar station, current meter, and two anemometers, respectively. (b) A gray level X-band marine radar image acquired at 12:00 a.m. on 29 October 2014. The yellow bin signifies the study area, the green asterisk marks the location of current meter, the red arrow in the upper right points to north (with 0° pointing to the north), and the yellow arrows point the wave directions in several positions.
The X-band marine radar system was deployed on the shore about 15 m above sea level (a.s.l.), and 20 m away from the coastline (Figure 2a). The configurations of the radar are shown in Table 1. By using a dedicated 40 MHz analogue-to-digital converter card, the radar backscatter from the sea surface was recorded and converted into gray level images. The radar worked every 7–30 minutes, and 32 images were recorded in a single radar image sequence, which required 80 s to acquire one radar image sequence. The measurement range of the radar was about 3 km, and the field of view ranged from 0 to 240° in azimuth. As an example, one image acquired by the X-band marine radar system is shown in Figure 2b, where the yellow arrows indicate that the waves propagated from northeast to southwest, and west and northwest at the time.

Table 1.
Configurations of the X-band marine radar system.
The current meter was moored 1 km from the radar station at an azimuth of about 70° (Figure 2). It was moored about 1 m below the water surface by a long anchor chain, so the measured current was affected by sea surface wind drift [21,22]. The current meter worked 20 minutes every hour, with a sampling rate of 2 Hz, so the current velocities were averaged hourly to reduce the influence of turbulence and noise.
Figure 2b also shows several small islands to the north of the observation area, so the current may be influenced by tidal current, wind drift, and bathymetry, except for any large-scale current, such as the Kuroshio Current. According to the location of the current meter, the study area was chosen to range from –480 m to 544 m on the x-axis, and –1374 m to –350 m on the y-axis, as demarcated by the yellow box in Figure 2b. According to the nautical chart, the average water depth of the study area is about 15 m. The first 16 images of each X-band marine radar image sequence were used to derive the current velocity.
3.2. Results
Using the method in Section 2, the sea surface current velocities were retrieved from X-band marine radar image sequences, and they were compared with those measured by the current meter, as shown in Figure 3. Both the NS current velocities and EW current velocities retrieved from the radar image sequences showed a distinct period of about 12 hours, which corresponded well with those measured by the current meter, which was caused by the semidiurnal tidal current. The NS current velocities measured by this current meter changed from –1.5 m/s to 0.8 m/s (the red dashed line in Figure 3a), which were close to those retrieved from the X-band marine radar image sequences using different methods; large differences between them occurred between the hours of about 1:00–1:30 and 2:30–2:50, when the sea state is low, and the coherence indicator at the time (Figure 3c). The EW current velocity measured by the current meter was –0.7 to 0.5 m/s (the red line in Figure 3b), whereas the velocities retrieved from the radar image sequences were mostly larger than that, which may be caused by the wind-induced surface drift. For the current velocities estimated using different methods, Figure 3a,b show that the error is smaller using the CSP2 method than when using CSP1.
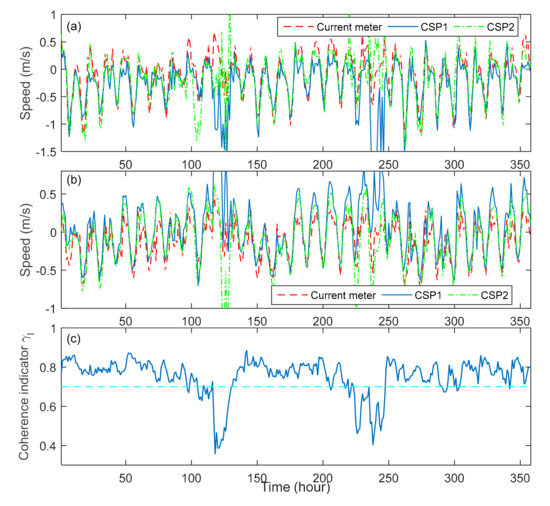
Figure 3.
Time series of (a) north-south (NS) velocity and (b) east-west (EW) velocity measured by a current meter, and those retrieved from X-band marine radar image sequences using different methods. (c) Time series of the coherence indicator; the cyan dashed line marks the coherence of 0.7.
Figure 3c shows that the coherence indicators were mostly 0.7–0.9, which signifies that the correlation between each pair of neighboring radar images was significant, so the cross-spectral correlation approach is suitable for deriving current velocity from X-band marine radar image sequences.
Quantitatively, the current velocities retrieved from the X-band marine radar image sequence were compared with those measured by the current meter, as shown in Figure 4. Because the radar backscatter is low under low sea states, the radar image sequences with were not considered here (Figure 3c). For NS current velocities, the black dots and digits indicate that the root-mean-square error (RMSE), the bias, and the relative error (RE) were smaller when using CSP2 than when using CSP1, whereas the correlation coefficients (Corr) for both methods were similar. For EW current velocities, a similar result was obtained from the red dots and digits, so the current velocities retrieved from the X-band marine radar images are better when using CSP2 than those retrieved using CSP1. The RE of the current velocities was about 7.8–10.8% using CSP2, while the Corr was 0.86–0.88, so CSP2 is suitable for retrieving the current velocity from X-band marine radar image sequences.
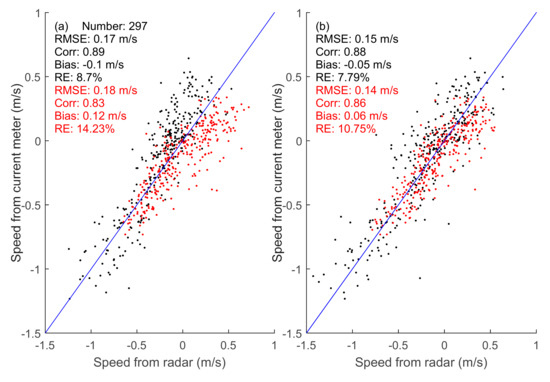
Figure 4.
Comparisons of the current velocities measured by current meter with those retrieved from X-band marine radar image sequences using different methods: (a) CSP1 and (b) CSP2. The black dots and digits are NS current velocities, and the red dots and digits are EW current velocities.
To further evaluate our proposed method, the current velocities were also retrieved from X-band marine radar images using the traditional 3D FFT algorithm [2,4], and then they were compared with the current meter, as shown in Figure 5. The RMSE and RE of the current velocities retrieved by the traditional algorithm were larger than those retrieved by CSP2, whereas the correlation coefficients were smaller, so the current velocities estimated using CSP2 were better than those estimated by traditional algorithm in the observation area. There may be several reasons for this: (1) The 3D FFT algorithm requires the wave field to be homogeneous [16], but the wave field changes considerably in nearshore regions (e.g., the wave directions changed rapidly in Figure 2b); (2) in the traditional algorithm, current velocity is estimated using the weighted least-square method, but the estimated velocity is affected by some parameters, such as the critical weighting energy (Figure 5 shows the best velocities that can be obtained using the method). However, the traditional algorithm has been validated in the regions with deep water [8] or nearshore regions with slowly varying topography [23], and more data will be needed to evaluate the proposed cross-spectral method.
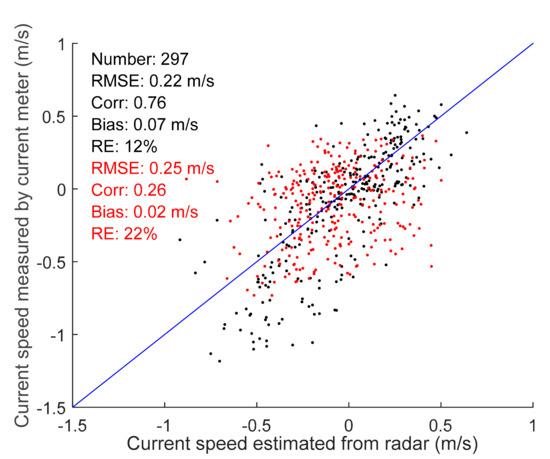
Figure 5.
Comparisons of the current velocities measured by a current meter with those retrieved from X-band marine radar image sequences using the traditional algorithm. The black dots and digits are NS velocities, and the red dots and digits are EW velocities.
4. Discussion
In this section, the preprocessing of radar images, the source of error, and the application conditions of the proposed method are discussed, such as the effect of sea surface drift, the critical coherence, and the number of radar images used in the proposed method.
4.1. Effect of Radar Image Preprocessing
In Section 2.1., X-band marine radar images were firstly preprocessed using CLAHE. To study the influence of CLAHE on the method, the radar image sequence in Figure 2b was taken as an example. Figure 6a shows the radar image in the study region, and the waves propagated approximately along the y-axis in the area. To show the effect of CLAHE, one radial was selected (the yellow dashed line in Figure 6a), and is shown in Figure 6b (the blue line). The gray levels tend to increase as the range varied from –1200 m to –400m. After preprocessing the image (Figure 6a) using CLAHE, the radial gray levels are shown by the red line in Figure 6b, which indicates that the wave crests and troughs were clearer than those of the original gray levels (i.e., the blue line). In addition, the variations in gray levels with range also decreased. The blue line and red dotes in Figure 6c,d show the phase velocities estimated from the radar images with and without CLAHE, and they are compared with the phase velocity derived from the theoretical dispersion relation (the green lines), which shows that the phase velocity estimated with CLAHE (Figure 6d) coincides better with the theoretical phase velocity, than that estimated without CLAHE (Figure 6c). Therefore, the preprocessing of radar images using CLAHE is useful for estimating current velocity from X-band marine radar images.
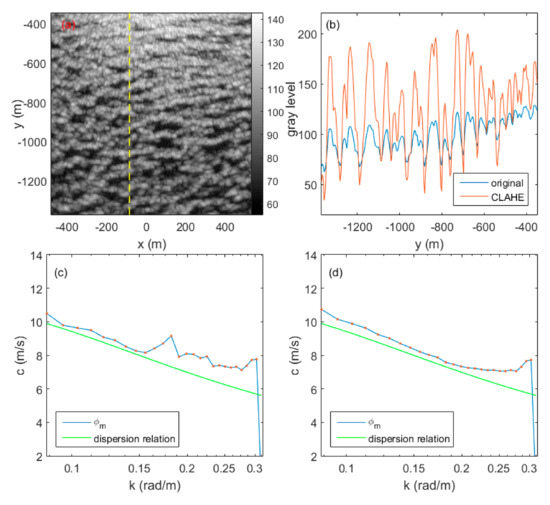
Figure 6.
(a) Part of the X-band marine radar image acquired at 12:00 a.m. on 29 October 2014. (b) The gray levels of the yellow dashed line in (a) with and without preprocessing. The phase velocities derived from radar images (c) without and (d) with contrast limited adaptive histogram equalization (CLAHE).
4.2. Effect of Sea Surface Drift
The current observed by the X-band marine radar was close to the sea surface (i.e., the current at a depth of 1.2 mm) [24], whereas the current meter measured the current at the depth of about 1 m, so they are different. As shown in Figure 4, there were negative biases of −0.05 m/s–−0.1 m/s for the NS velocity, whereas there were positive biases of 0.06–0.12 m/s for the EW velocity. To study the reasons, the influences of Stokes drift and Ekman current were estimated.
Stokes drift is caused by the orbital motion of a wave. For simplicity, the linear wave theory for deep-water wave is used here, and the horizontal component of Stokes drift velocity is given by [25]:
where a is wave amplitude, λ is wavelength, T is wave period, and z is the vertical coordinate in the positive direction pointing out of the fluid layer. Because the waves mostly propagate from east to west in the study region, the wave-induced Stokes drift mainly affects the EW velocity. In Equation (10), the wavelength and wave period can be obtained from the auto-spectrum of the radar images using Equation (2). The wave amplitude was chosen to be half the significant wave height, which was determined using the method previously published [20,26].
Figure 7a shows that the Stokes drift varied from about 0.05 m/s to more than 0.25 m/s, showing it is important to the sea surface current in the area. The difference between Stokes drift at the sea surface and at a depth of one meter is usually 0.02–0.04 m/s, which accounts for about one-third to one-half of the biases of the EW velocities (Figure 3
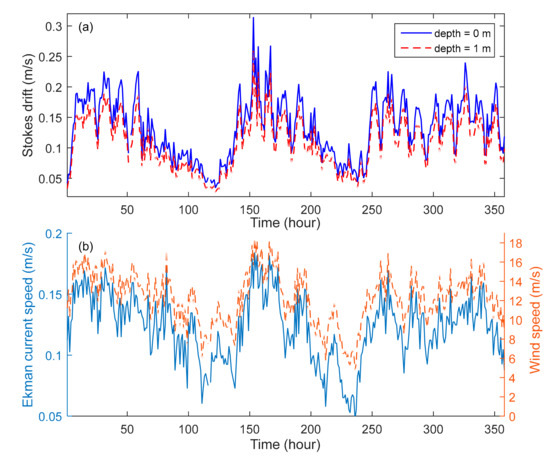
Figure 7.
(a) The Stokes drift at different depths, and (b) the estimated wind speed and sea surface Ekman current.
There was no measurement of wind at A1 (Figure 2a) during the experiment. The wind-induced Ekman drift is estimated as follows. Simultaneous measurements showed that the wind speeds at A1 and A2 (Figure 2a) were well correlated, and the correlation coefficient and RMSE between them were 0.84 and 2.57 m/s, respectively, so the wind speed measured at A2 was used to estimate that at A1 during the experiment, as shown in Figure 7b. According to previous studies, the sea surface Ekman current speed is about 1–2.5% of the wind speed [22], so it was estimated to be 0.05–0.2 m/s during the experiment (Figure 7b). Because the wind mostly came from the northeast in the area, whereas the Ekman current direction may turn about 10–20° to the right of the wind direction at a depth of one meter in the northern hemisphere [22], the Ekman current may also play an important role in EW velocity. The Ekman current is affected by both sea surface wind and bottom friction in shallow water, which is much more complex than in deep water [27], and it was not considered here.
The current speed and current direction can be determined by composing the NS velocity and EW velocity, and then they were compared with those measured by the current meter, as shown in Table 2. The third and fifth columns show the original current velocities retrieved using the two methods, and the RMSE of the current speeds were 0.11 m/s (i.e., the relative error was less than 10%), whereas the RMSE of the current directions were greater than 50°.

Table 2.
The root mean squared error (RMSE) and correlation coefficient (Corr) between the current speed and current direction measured by current meter and those retrieved from X-band marine radar images using two methods.
The fourth and sixth columns show the result corrected by wind-induced surface drift, and the RMSE of current directions were reduced to less than 28°. Therefore, the sea surface drift is important to the surface current estimated from radar images in the area.
4.3. Critical Coherence
In Section 2.3., the critical coherence was chosen to be 0.6, and the cross-spectral phases that satisfy were used to derive the current velocity from the X-band marine radar image sequence. To study the influence of critical coherence on the method, different critical values were used to estimate the current velocity from radar images. The CSP2 method was used here, and comparisons of the current velocities retrieved from radar images, with those measured by the current meter, are shown in Figure 8. For the critical coherences less than 0.5, the RMSE, bias, and correlation coefficient changed considerably, and the RMSE and bias were large, while the correlation coefficients were small. For a critical coherence larger than 0.6, the variations in RMSE and bias were small, and the correlation coefficients decreased slightly from 0.86 to 0.8, and the RMSE and bias were small while the correlation coefficients were large. Therefore, the critical value of 0.6 is applicable when estimating the current velocity from X-band marine radar images using the cross-spectral method.
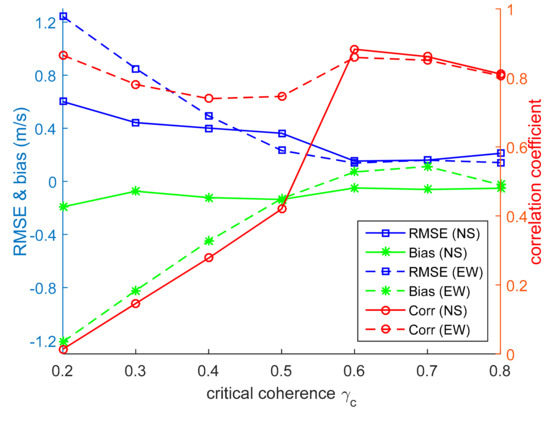
Figure 8.
The RMSE, bias, and correlation coefficient between the current velocities measured by a current meter and those retrieved from X-band marine radar images with different critical coherences.
4.4. Number of Images
In Section 3, the current velocity was retrieved from 16 images of an X-band marine radar image sequence, whereas 32 images are often used in the 3D FFT algorithm [8,23]. Usually, there are few successive images for airborne or satellite-borne sensors [9,14,15], so the influence of the number of images on the cross-spectral correlation approach was analyzed.
The current velocities were derived from 2, 4, 8, 16, and 32 radar images using the CSP2 method, and then the results were compared with the measurements from the current meter, as shown in Figure 9. The RMSE of the NS velocity (blue solid line) decreased rapidly from 2 to 4 images, then decreased slightly from 4 to 16 images, and then increased slightly from 16 to 32 images. The RMSE of the EW velocity (blue dashed line) changed slightly for different numbers of images. The correlation coefficients of the NS velocity (red solid line) and the EW velocity (red dashed line) increased rapidly from 2 to 4 images, then increased slightly from 4 to 16 images, and then slightly decreased from 16 to 32 images. The biases of NS velocity (green solid line) and EW velocities (green dashed line) decreased from 2 to 4 images, then varied slowly from 4 to 32 images. Therefore, for an X-band marine radar system with a sampling period of 2.5 s, at least four images are needed to determine a relatively reasonable current velocity, and a better current velocity can be derived using 16 images.
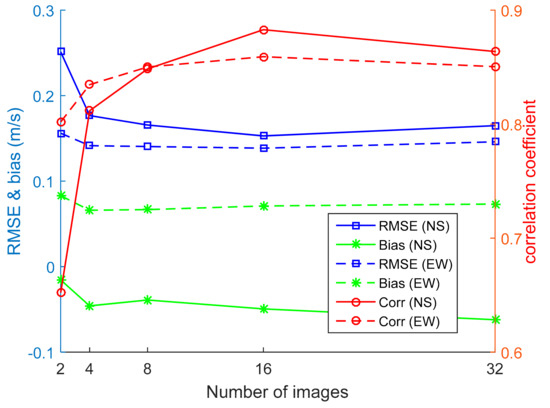
Figure 9.
The RMSE, bias and correlation coefficient between the current velocities measured by a current meter and those retrieved from different numbers of X-band marine radar images.
Figure 9 also indicates that it is unnecessary to use 32 images in the cross-spectral correlation approach, because the wave field is heterogeneous and varies rapidly in nearshore areas, and the coherences of waves decrease over a long time period (i.e., 80 s were needed to capture 32 images for the radar system). Because the sampling periods of different sensors are different (e.g., they are usually 1–3 s for different X-band marine radar systems), we suggest that the minimum time to acquire one image sequence should be 10–40 s to obtain a reasonable current velocity using the cross-spectral correlation approach.
5. Conclusions
In this study, an X-band marine radar was used to observe sea surface currents. Although the algorithm based on 3D FFT is widely used, the accuracy often decreases in heterogeneous regions. The cross-spectral correlation approach is also used in the estimation of wave spectrum and currents from optical and radar images, but mostly used for case studies from several images. This study improves the cross-spectral correlation approach to retrieve current velocity from an X-band marine radar image sequence, and we evaluated the application conditions. To reduce the dependency of gray levels on range and azimuth, the radar images were preprocessed by CLAHE. By applying the cross-spectral correlation approach on different pairs of neighboring radar images, the cross-spectral coherences and phases were obtained and averaged. Then, the phases with large coherences were used to deduce the phase velocities of waves, and the current velocity was derived by fitting them with the theoretical dispersion relation. In this method, the current is estimated using two-dimensional cross-spectral coherence and phase, rather than the widely-used 3D dispersion shell in traditional 3D FFT algorithms; the temporal aliasing is avoided by choosing positive phases, and the wavenumbers close to the peak of the coherence spectrum.
The method was validated by comparing the current velocities retrieved from X-band marine radar image sequences with the collocated measurements of a current meter. The RMSE of the EW velocity and NS velocity are 0.14 m/s and 0.15 m/s, respectively, using the CSP2 method, with relative errors of 7.79% and 10.75%, respectively, which are reasonable, because the current velocity varies from 0 to 1.4 m/s in the area. The RMSE of the total current speed is about 0.11 m/s, whereas that of current direction is more than 50°, but it decreases to less than 28° after considering the influence of wind drift. In nearshore regions, the sea surface current is influenced by many variables, such as tidal current, sea surface drift, and bathymetry. Due to the limitation of the experiment, the influence of wave-induced drift was studied using linear wave theory, whereas the wind drift was approximately estimated. In the future, experiments with more in-situ measurements should be conducted to further evaluate the method.
The application conditions of the cross-spectral correlation approach were discussed. We showed that the cross-spectra with a coherence larger than 0.6 are applicable to estimate current velocity; for the sampling period of 1–3 s, images acquired within 10–40 s may be necessary to obtain a reasonable current velocity. This may be helpful in the estimation of the current from spaceborne sensors using the cross-spectrum approach.
Author Contributions
Conceptualization, Z.C., Y.H. and X.C.; Formal analysis, Z.C.; Funding acquisition, Y.H.; Investigation, Z.C.; Methodology, V.K.; Visualization, B.Z.; Writing—review & editing, Z.C.
Funding
This research was funded by the International Cooperation Project of the National Natural Science Foundation of China under grant number 41620104003, and also by the National Natural Science Youth Foundation of China under grant number 41506199, National Science Foundation of China for Outstanding Young Scientist under grant number 41622604, National Key R&D Program of China under Grant 2017YFB0502700, Russian Science Foundation project under grant number 17-77-30019, the Natural Science Youth Foundation of Jiangsu Province under grant number BK20150905.
Conflicts of Interest
The authors declare no conflict of interest.
References
- Lucas, N.S.; Simpson, J.H.; Rippeth, T.P.; Old, C.P. Measuring turbulent dissipation using a tethered ADCP. J. Atmos. Ocean. Technol. 2014, 31, 1826–1837. [Google Scholar] [CrossRef]
- Young, I.R.; Rosenthal, W.; Ziemer, F. A three-dimensional analysis of marine radar images for the determination of ocean wave directionality and surface currents. J. Geophys. Res. 1985, 90, 1049–1059. [Google Scholar] [CrossRef]
- Huang, W.; Liu, X.; Gill, E.W. Ocean wind and wave measurements using X-band marine radar: A comprehensive review. Remote Sens. 2017, 9, 1261. [Google Scholar] [CrossRef]
- Gangeskar, R. Ocean current estimated from X-band radar sea surface images. IEEE Trans. Geosci. Remote Sens. 2002, 40, 783–792. [Google Scholar] [CrossRef]
- Serafino, F.; Lugni, C.; Soldovieri, F. A novel strategy for the surface current determination from marine X-band radar data. IEEE Geosci. Remote Sens. Lett. 2010, 7, 231–235. [Google Scholar] [CrossRef]
- Huang, W.; Carrasco, R.; Shen, C.; Gill, E.W.; Horstmann, J. Surface current measurements using X-band marine radar with vertical polarization. IEEE Trans. Geosci. Remote Sens. 2016, 54, 2988–2997. [Google Scholar] [CrossRef]
- Senet, C.M.; Seemann, J.o.; Flampouris, S.; Ziemer, F. Determination of bathymetric and current maps by the method DiSC based on the analysis of nautical X-band radar image sequences of the sea surface (November 2007). IEEE Trans. Geosci. Remote Sens. 2008, 46, 2267–2279. [Google Scholar] [CrossRef]
- Gangeskar, R. Verifying high-accuracy ocean surface current measurements by X-band radar for fixed and moving installations. IEEE Trans. Geosci. Remote Sens. 2018, 56, 4845–4855. [Google Scholar] [CrossRef]
- Engen, G.; Johnsen, H. SAR-Ocean wave inversion using image cross spectra. IEEE Trans. Geosci. Remote Sens. 1995, 33, 1047–1056. [Google Scholar] [CrossRef]
- Plant, N.G.; Holland, K.T.; Haller, M.C. Ocean wavenumber estimation from wave-resolving time series imagery. IEEE Trans. Geosci. Remote Sens. 2008, 46, 2644–2658. [Google Scholar] [CrossRef]
- Holman, R.; Plant, N.; Holland, T. cBathy: A robust algorithm for estimating nearshore bathymetry. J. Geophys. Res. Ocean. 2013, 118, 2595–2609. [Google Scholar] [CrossRef]
- Honegger, D.A. Depth Estimation and Frontal Imaging via X-Band Marine Radar. Master’s Thesis, Oregon State University, Corvallis, OR, USA, 12 March 2015. [Google Scholar]
- Frasier, S.J.; McIntosh, R.E. Observed wavenumber-frequency properties of microwave backscatter from the ocean surface at near-grazing angles. J. Geophys. Res. 1996, 101, 18391–18407. [Google Scholar] [CrossRef]
- Kudryavtsev, V.; Yurovskaya, M.; Chapron, B.; Collard, F.; Donlon, C. Sun glitter imagery of surface waves. Part 2: Waves transformation on ocean currents. J. Geophys. Res. Ocean. 2017, 122, 1384–1399. [Google Scholar] [CrossRef]
- Kudryavtsev, V.; Yurovskaya, M.; Chapron, B.; Collard, F.; Donlon, C. Sun glitter imagery of surface waves. Part 1: Directional spectrum retrieval and validation. J. Geophys. Res. Ocean. 2017, 122, 1369–1383. [Google Scholar] [CrossRef]
- Wu, L.-C.; Chuang, L.Z.-H.; Doong, D.-J.; Kao, C.C. Ocean remotely sensed image analysis using two-dimensional continuous wavelet transforms. Int. J. Remote Sens. 2011, 32, 8779–8798. [Google Scholar] [CrossRef]
- Lund, B.; Collins, C.O.; Graber, H.C.; Terrill, E.; Herbers, T.H.C. Marine radar ocean wave retrieval’s dependency on range and azimuth. Ocean Dyn. 2014, 64, 999–1018. [Google Scholar] [CrossRef]
- Zuiderveld, K. Contrast Limited Adaptive Histograph Equalization; Graphic Gems IV; Academic Press Professional: San Diego, CA, USA, 1994; pp. 474–485. [Google Scholar]
- Chen, Z.; He, Y.; Yang, W. Study of ocean waves measured by collocated HH and VV polarized X-band marine radars. Int. J. Antennas Propag. 2016, 2016, 1–12. [Google Scholar] [CrossRef]
- Chen, Z.; He, Y.; Zhang, B. An automatic algorithm to retrieve wave height from X-band marine radar image sequence. IEEE Trans. Geosci. Remote Sens. 2017, 55, 5084–5092. [Google Scholar] [CrossRef]
- Trizna, D.; Xu, L.X. Target classification and remote sensing of ocean current shear using a dual-use multifrequency HF radar. IEEE J. Ocean. Eng. 2006, 31, 904–918. [Google Scholar] [CrossRef]
- Stewart, R.H. Introduction to Physical Oceanography; Department of Oceanography, Texas A&M University: College Station, TX, USA, 2008; p. 353. [Google Scholar]
- Cui, L.; He, Y.; Shen, H.; Lv, H. Measurement of ocean wave and current field using dual polarized X-band radar. Chin. J. Oceanol. Limnol. 2010, 28, 1021–1028. [Google Scholar] [CrossRef]
- Stewart, R.H.; Joy, J.W. HF radio measurements of surface currents. Deep Sea Res. 1974, 21, 1039–1049. [Google Scholar] [CrossRef]
- Phillips, O.M. The Dynamics of the Upper Ocean, 2nd ed.; Cambridge University Press: Cambridge, UK, 1977. [Google Scholar]
- Chen, Z.; He, Y.; Zhang, B.; Qiu, Z.; Yin, B. A new algorithm to retrieve wave parameters from marine X-band radar image sequences. IEEE Trans. Geosci. Remote Sens. 2014, 52, 4083–4091. [Google Scholar] [CrossRef]
- Cushman-Roisin, B.; Deleersnijder, E. Top-to-bottom Ekman layer and its implications for shallow rotating flows. Environ. Fluid Mech. 2018, 1–15. [Google Scholar] [CrossRef]
© 2019 by the authors. Licensee MDPI, Basel, Switzerland. This article is an open access article distributed under the terms and conditions of the Creative Commons Attribution (CC BY) license (http://creativecommons.org/licenses/by/4.0/).