Abstract
The wind wake on the lee side of Hainan Island in the winter covers the southwest entrance of Beibu Gulf (or Gulf of Tonkin) and is essential to regional ocean dynamics. Using multiple satellite observations including advanced synthetic aperture radar (ASAR), we revisited the wake process during the winter of 2011. Asymmetric oceanic thermal responses were found with a warm band expanding northwestwardly while a cold tongue formed to the southeast. Combining satellite observations, model simulations, and reanalysis data, heat advection terms (ADV) are reconstructed and compared to air-sea heat flux terms. The observed thermal evolution process across the wake footprint is closely related to the balanced spatial variability from the Ekman ADV, the barotropic geostrophic ADV, and the latent heat flux (LHF), which are all on the order of 10−5 K·m·s−1. Specifically, the Ekman ADV tends to heat the northwestern side of the wake and cool the southeastern side, while the geostrophic ADV compensates with the Ekman ADV across the wake footprint. This study reveals detailed oceanic responses associated with the wind wake and clarifies the contribution of ADV to the asymmetric spatial thermal variabilities. The identified role of heat advection on a sub-seasonal timescale may further benefit the understanding of regional oceanic dynamics.
1. Introduction
Wind wakes are commonly observed on the lee side of an island with reduced wind speeds due to frictions of land orography []. Concerning the oceanic response, wind wakes are documented to generate regional thermal variability by different mechanisms depending on detailed hydrological conditions [,], which could be further complicated by circulations and associated eddies [,]. The wind wake of Hainan Island (HIWW) has been observed to the southwest coast of the island with interactions between the land elevated orography and the Asian monsoon, collocating with a warm sea surface temperature band []. A weak wind wake is also observed to the northwest of the Vietnamese coast resulting from an orographic blockage from June to October [], and it is proposed that the corresponding warm water is generated by thermal processes (e.g., latent heat flux) on the seasonal time scale, while dominated by wind mixing processes on the diurnal time scale.
Hainan Island is located in the northwest of the South China Sea (SCS) and is close to the entrance of the semi-enclosed shallow ocean, the Beibu Gulf (or Gulf of Tonkin). The major circulation of the SCS is driven by the monsoon wind [], with a southward coastal current along the western boundary in the winter and a northward coastal current in the summer [,]. Concerning regions around Hainan Island, many previous studies have focused on the summertime upwelling systems off the east coast (e.g., [,,]). For example, the work of Su and Pohlmann [] revealed that the southwesterly and southerly winds in the summer are responsible for the formation of the cold water centers off the eastern Hainan coast, while the combined effects of wind and topography lead to the uneven distribution of the upwelling centers. For the west coast, tidal currents are considered as an important factor of local fronts [,]. There are also upwellings observed off the west coast during summer despite the downwelling favorable winds, and these are attributed to the joint effects of tidal mixing and background stratification [,]. Li et al. [] also found that the interannual variability of the summer upwellings is related to the combined effects of along-shore wind, tidal mixing, and boundary currents. Few studies have focused on the southwest coast of Hainan Island during winter, except for the work of Li et al. [] who observed the HIWW.
The steady and strong wind conditions in the boreal winter makes HIWW an ideal case for wind wake studies. An important mechanism forming the warm band in SST is the reduced latent heat flux associated with the decreased wind speed in the wake region []. However, it is not clear yet how the heat advection term influences the regional thermal evolution process. The competition between heat advection and the air-sea heat flux in regional heat variabilities has been long discussed world-wide and may vary depending on the time scale and spatial distributions of interest [,,,]. Meanwhile, the seasonal variation of the seawater temperature is influenced by the air-sea heat flux [], and temperature variabilities on time scales from days to weeks over shallow water could be mainly attributed to heat advection []. Hence, the role of heat advection could be essential to understanding the regional thermal evolution process and should be taken into consideration in a detailed investigation of regional seawater variabilities.
In this study, with support from multi-sensor satellite observations including Advanced Synthetic Aperture Radar (ASAR) data and the derived sea surface wind field, sea surface temperature (SST) and merged wind products from microwave and optical sensors, as well as simultaneous model simulations, the characteristics of HIWW and associated oceanic responses are investigated in detail. Our analysis is organized as follows. Firstly, the datasets and the methods adopted are described in Section 2. Observed wind wake patterns and corresponding sea surface thermal responses are introduced in Section 3, followed by an analysis of the roles of heat advection and air-sea heat flux terms. In Section 4 and Section 5, the regional thermal evolution mechanism is summarized and discussed.
2. Data and Methods
2.1. Study Area
To study the oceanic spatial variability, a transect is made across the wind wake, starting at 18.8°N,107.5°E and ending at 17.0°N, 109.4°E in the northwestern-southeastern direction (Figure 1). There is a total of 568 sampling points with a spacing interval of 500 m along the transect, spanning over a distance of approximately 283 km.
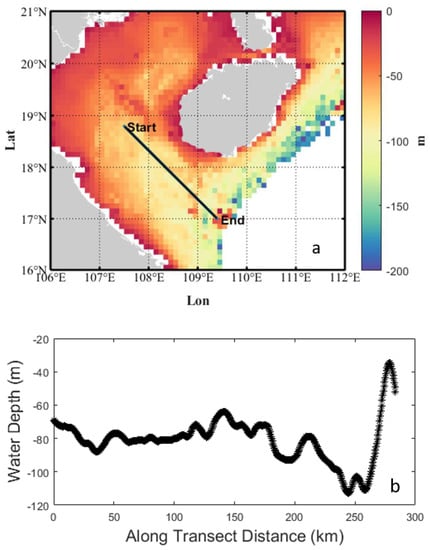
Figure 1.
The bathymetry of the study area. (a) The bathymetry around Hainan Island, in the northwest of the South China Sea. The color shading is the water depth. Areas with bathymetry deeper than 200 m are not plotted. The black line is a transect made across the wind wake. (b) The bathymetry along the transect.
2.2. ASAR Data and Processing
The Envisat/ASAR data (02:47 UTC of December 10th, 2011) in wide swath mode (WSM) was used to retrieve the sea surface wind field. ASAR WSM data were not highly acquired within our study area during winter. The presented case is a good enough example to show a clear wind wake pattern downstream of the island and is thus used for further analysis in this study. The ASAR is one of 10 instruments onboard the Envisat satellite, operating at C-band in a sun-synchronous orbit at an altitude of 800 km. The WSM is one of ASAR’s five imaging modes, and the swath width is approximately 400 km with the pixel size of 75 m [].
To retrieve the sea surface wind field from ASAR vertical-vertical (VV) polarization data, the C-band geophysical model function (GMF) CMOD5.N [] was applied. As one of geophysical model functions (GMFs), CMOD5.N depicts the relationship between the normalized radar cross section (NRCS) and wind vectors at 10 m height above the sea surface and radar incidence angles, which has been confirmed as a mature method for the retrieval equivalent neutral winds from scatterometer and synthetic aperture radar (SAR) measurements. The difference between the equivalent neutral wind and the real wind is found to be within 0.1~0.2 m/s []. The wind field can be retrieved at a resolution of 1 km [,], while we use a 5 km grid size [] so as to keep consistent with model simulations as introduced in Section 2.3. Thus, U and V components were further interpolated to the grid size in the retrieval. Sea surface wind directions from the European Centre for Medium-Range Weather Forecasts (ECMWF) ERA-Interim wind data (0.125° by 0.125°) were used as references. In a comparison [] between the ASAR-retrieved wind fields and on-land meteorological stations of Hainan Island, the standard deviation, mean error, and the correlation coefficient are 2.09 m/s, 0.27 m/s, and 0.75, respectively.
2.3. Other Satellite Observation and Reanalysis Datasets
SST used in this study comes from daily optimal interpolated maps (OISST) [] from remote sensing system (RSS) merging both microwave and infrared data at 9 km resolution, which combines the cloud-free capacity of microwave data and high resolution of infrared data of coastal oceans based on the optimal interpolation method. To fully investigate the character of the wind wake, gridded wind vectors from the cross-calibrated multi-platform (CCMP, v2.0) [] from RSS are also used as a reference in the present study, with a 25 km spatial resolution and 6-h temporal resolution. The sea surface latent heat flux (LHF), sensible heat flux (SHF), longwave thermal radiation, and surface net solar radiation are used as components of the air-sea heat flux, and are available from ERA5 reanalysis [] of Copernicus Climate Change Service (C3S) (2017) on a grid size of 0.25° with a temporal resolution of 6 h. Senafi et al. [] evaluated the performance of surface heat flux components of ERA5 by comparing with in-situ measurements and MERRA2/NASA reanalysis at the Arabian Gulf and the Red Sea, showing a bias of 4.5 W/m2 and 1.59 W/m2 respectively. Wind vectors from ERA5 03:00 UTC of December 10th, 2011 are also examined qualitatively to make sure the wind wake feature is captured, but no further analysis or calculation is conducted with ERA5 wind fields. To derive the surface absolute geostrophic velocities, we use the absolute dynamic topography (ADT) (version: SSALTO/DUACS Delayed-Time Level-4), which is available from the Copernicus Marine Environment Monitoring Service (CMEMS) containing multi-satellite merged daily maps from 1993 to present on a 0.25° Cartesian grid with tidal and inverse barometer corrections. The time-varying sea level is generally considered with an error of 2~3 cm [,]. Different datasets (Table 1) are harmonized by interpolation on a uniform grid with a spatial resolution of 0.1°, a temporal resolution of 1 day, and a vertical resolution of 1 m (if necessary).

Table 1.
Observational and Reanalysis Datasets Summary.
2.4. WRF Model Simulations
The weather research and forecasting (WRF) model with advanced research WRF (ARW) dynamic core is used in this study to get a high-resolution wind field []. The WRF method has been validated over the Beibu Gulf [], showing a standard deviation of 1.41m/s, a mean difference of 0.83m/s, and correlation coefficients squared of 0.67 by comparing offshore winds from WRF and SSM/I. WRF-ARW is a numerical weather prediction and atmospheric simulation system with fully compressible and non-hydrostatic equations, and provides several options to parameterize sub-grid scale physical processes and assimilate data. We use time-updating sea surface temperature (SST) with 0.5° × 0.5° from the National Centers for Environmental Prediction/Marine Modeling and Analysis Branch (NCEP / MMAB) and spectral nudging in order to make sure the lower boundary conditions are updated, and keep the large-scale circulation patterns of simulations close to the forcing field [,,]. The spectral nudging method is applied to temperature, geopotential height, and wind vector over 700 hPa level in all runs. The double and two-way nested scheme has been adopted in the model.
The model domain is centered at 18.03150°N and 109.6105°E, with a fine grid space of 10 km (dimensions of 135 × 115). The fine domain comprises the whole Hainan Island and Beibu Gulf. The Mercator projection is chosen due to the low-latitude simulated area. The main parameterization schemes used are Yonsei University planetary boundary layer (YSU PBL) scheme [], Kain-Fritsch Cumulus scheme [], Lin et al. microphysics scheme [], the rapid and accurate radiative transfer model (RRTM) longwave radiation scheme [], Dudhia shortwave radiation scheme [] and the Noah land surface model []. These schemes have proven to be appropriate for sea wind simulation [,]. Menendez et al. [] conducted a sensitivity test to demonstrate that the YSU PBL scheme is slightly more suitable than other PBL schemes in simulations of the sea wind over the Mediterranean Sea. We chose ERA-Interim reanalysis as the driving field and re-initialized the integral approach to conduct the dynamical downscaling spanning from January 1, 2011 to December 31, 2014. Then, the 6-hourly simulation results were interpolated linearly onto the standard grid with the spatial resolution of 0.1° and temporal resolution of one day.
Concerning the variation of the wind speed across the wind wake, curves from ASAR, WRF, CCMP, and ERA5 along the transect (as in Section 2.1) are shown (Figure 2). All datasets could capture the low-speed feature across the wake consistently, with the minimum wind speed occurs between 150~200 km along the transect. The curve along the transect from ASAR-derived wind shows the finest features, while the WRF simulation tends to overestimate the wind speed shear, and the CCMP wind speed shows weakened variation.
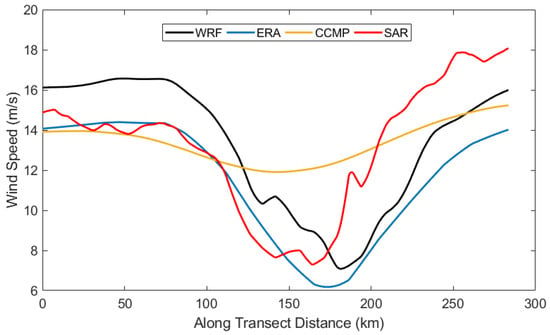
Figure 2.
The comparison of sea surface wind speed from different datasets used in this study. The wind speed comes from ASAR, WRF, ERA-5, and CCMP on December 10th, 2011, respectively. The WRF and CCMP data are the averaged value between 0:00 UTC and 6:00 UTC. The ERA-5 data is at 03:00 UTC. The ASAR data is at 02:47 UTC.
To simply provide an uncertainty bound, wind speeds from ASAR observation, WRF model simulation, and CCMP merged observation are cross-compared over the study domain with land area excluded. The ASAR data is at 02:47 UTC. The WRF and CCMP data are the averaged value between 0:00 UTC and 6:00 UTC on Dec 10th, 2011. ERA5 is not included in the comparison since ERA-interim is already used in WRF simulation, and ERA5 also assimilates observational datasets. In the first step, all datasets are interpolated onto the 0.1° grid as mentioned in the above section. There are totally 5485 collocated triplets for ASAR, WRF, and CCMP respectively. We here introduce the triple collocation analysis, which is a data comparison method using three independent products to assess the error magnitude of each product separately and has been popular in the wind and soil moisture products applications [,,,]. Following the calibration model of Stoffelen [] and the error assessment formula of Pan et al. [], the estimated error magnitudes between the products and a deterministic “truth” value are approximately 2.30 m/s, 1.34 m/s, and 2.14 m/s for ASAR, WRF, and CCMP, respectively, which is consistent with previous literatures [,]. No comparison with in-situ measurement was performed due to a lack of offshore meteorological buoy data.
2.5. Estimation of Wind-induced Currents
Wind time series used to calculate horizontal heat advection are directly from the WRF high-resolution simulation. Based on the conventional Ekman theory [], the depth-averaged wind current within the Ekman layer can be approximated as:
where is constant seawater density, the Coriolis parameter, the vertical unit vector, is the Ekman depth, and is the wind stress, which can be derived from wind vectors. The vertical velocities driven by the wind stress curl is given as:
However, the conventional Ekman theory is under the assumption of infinite water depth, which is obviously not the case in coastal oceans. Welander [] extended the equations to varying water depths by introducing structure functions, and the depth-integrated flow is expressed as
with structure functions
where is the sea level variation. indicates the ratio of water depth h to the Ekman depth. Currents in Equation (3) consist of contribution from the wind stress, as well as the sea level pressure gradient adjusted to wind and topography []. If we focus on the wind-induced drift components by eliminating the sea level variation parts and assume that [,], the depth-averaged Ekman currents over coastal oceans could then be estimated as
For infinite depth (R→+∞), C1→0 and C2→−1, and Equation (5) will reduce to Equation (1).
2.6. Heat Advection Estimation
Regarding the temperature variability over the continental shelf, a simplified heat budget [] over the whole water column is
where is the temperature (unit: K), is the water currents (unit: m/s), is the water depth (unit: m), and q is the vertical heat flux (unit: ). is the seawater heat capacity [] and is the seawater density. Rs is the residual term representing processes not included, such as diffusions.
We assume that the temperature is vertically uniform, which may not be true for stratified oceans, but is useful and valid for the well-mixed coastal water of Hainan Island during the winter []. Then, SST could be used to approximate the vertical temperature, and Equation (6) becomes
where is the vertically integrated horizontal transport (unit: ) from both the Ekman drift and barotropic geostrophic currents. Q is the air-sea net heat flux, being the sum of the solar radiation , the longwave radiation , the SHF and the LHF, which can be obtained from the ERA5 reanalysis. The term on the left-hand side represents the local temporal variability of SST. The first term on the right-hand side is the horizontal heat advection (ADV), and the second term corresponds to the air-sea heat flux (ASF). All three terms in Equation (7) have the unit of , and thus a meaningful comparison can be made between the ADV and ASF. Since our intent is to clarify the contribution of the heat advection, no attempt was made to construct a closed heat budget in this study. A weekly moving average is applied on the ADV and ASF terms hereafter when plotting to remove high-frequency variabilities.
3. Wind Wake Characters and Oceanic Responses
3.1. Wind Wake Observed by Spaceborne SAR
A high-resolution ASAR image captured at 02:47 (UTC) on December 10, 2011 and the retrieved sea surface wind field present the capability of capturing sub-mesoscale features of the wind wake. Due to the incidence angle, the whole image shows a light-to-dark trend from the lower right corner to the top left corner. The wind wake is indicated as a darker-than-ambient footprint (Figure 3a) to the southwest side of the island, extending about 200 km from the island to the coast of Vietnam, covering most of the southern entrance of Beibu Gulf. The dark area (low NRCS) corresponds to reduced sea surface wind speeds over the wake footprint, which is about 10 m/s lower than ambient waters (Figure 3b), with the minimum wind speed very close to the coast. Enhanced positive/negative wind stress curl is also found close to the footprint boundary in the retrieved wind stress curl map (Figure 3c), forming sub-mesoscale wind curl stripes extending in the offshore direction.
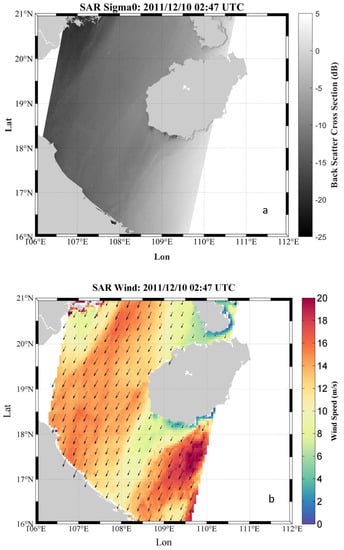
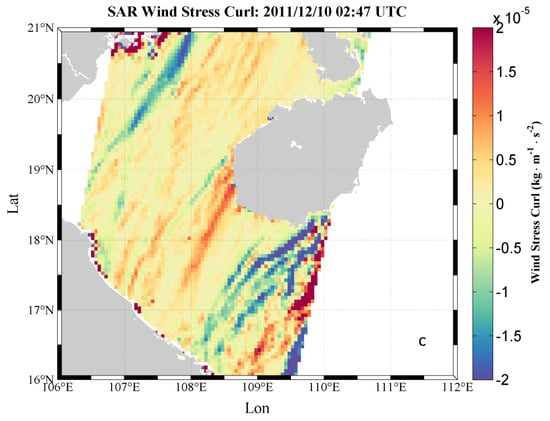
Figure 3.
(a) An example of the ASAR WSM image acquired at 02:47 UTC on 10 December 2011 showing a typical wind wake in the lee side of Hainan Island. (b) The retrieved sea surface wind speed from the ASAR data and (c) the calculated wind stress curl based on the ASAR wind field.
3.2. Seasonality of the Wake Distribution
The Asian monsoon is known to prevail over the South China Sea. However, a detailed description of local wind condition is necessary, which closely relates to the spatial and temporal distribution of HIWW. The seasonal wind rose diagrams (Figure 4) using the daily WRF wind vectors from 2011 to 2014 represent the characters of local wind. There is almost no southeasterly wind in the region. Northeasterly wind prevails during Autumn and Winter, while southwesterly wind prevails during Summer. The dominant wind intervals, i.e., taking the largest portion during each season, for the winter, spring, summer and autumn are 10~12 m/s (22.9%), 4~6 m/s (31.9%), 4~6 m/s (25.5%), and 6~8 m/s (22.1%), respectively.
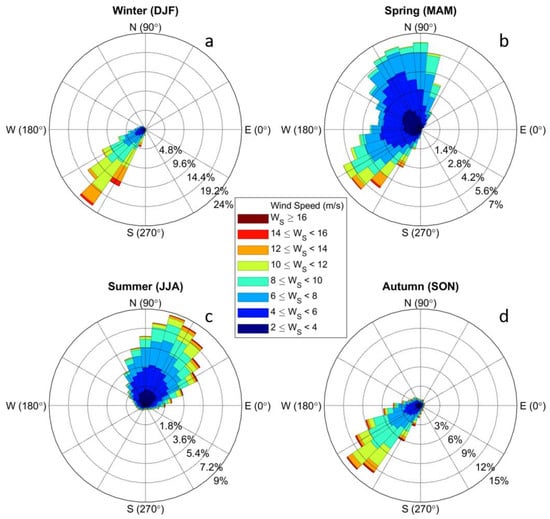
Figure 4.
Seasonal wind rose diagrams with WRF wind vectors from 2011 to 2014. Results are for (a) winter, (b) spring, (c) summer, and (d) autumn respectively. The wind direction is defined as the direction of the wind vector pointing towards and departs from the east (0°) cyclonically. Land areas are excluded. Color shading indicates the wind speed, with a speed interval of 2 m/s.
HIWW is expected to show a controlled distribution corresponding to the varying wind, which can be represented by the occurrence of anomalous wind speeds (Figure 5) 2 m/s lower than the regional average. The thresholds of other values less than 5 m/s hold consistent distribution patterns. Three areas with high occurrences of anomalous wind are found in the study area: one locates on the southwest coast of Hainan Island in winter, corresponding to the known wind wake footprint. Another one is located on the northwest coast of Hainan, due to the southerly wind in summer. Also, there is one close to the Vietnam coast at the lower-left corner (17°N, 107°E), which is likely due to the interaction between the southwesterly wind and the Vietnamese orography []. No occurrence was observed to the east of 110.5°E. In comparison to the northwest Hainan coast, the high occurrence in the southwest coast covers a larger area and larger magnitude, being consistent with the regional monsoon character that the northeasterly wind is strongest and steady from October to January (Figure 4).
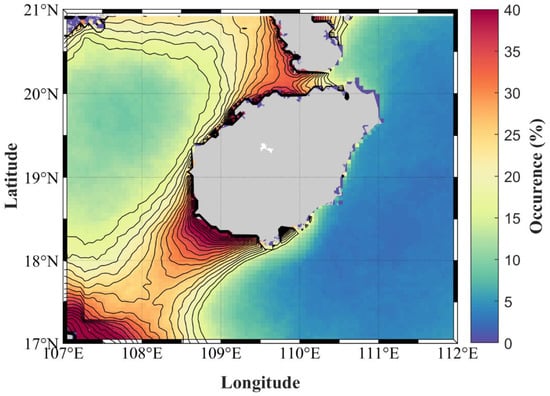
Figure 5.
The occurrence of anomalous wind speeds over the study area based on the WRF simulation. The “anomalous” wind speed here represents those wind speeds that is 2 m/s lower than the daily mean over the study area. Then the percentage of occurrence is calculated from 2011 to 2014. The land area is excluded from the calculation. Each contour line indicates a 2% interval from 16% to 40%.
3.3. Spatial Variability of Oceanic Thermal Response
To clarify the oceanic thermal response over the wind wake footprint, both the sea surface wind speed anomaly and SST are investigated along the transect across the wind wake. The study period from October 2011 to January 2012 was chosen since this is a period when the regional wind speed is the strongest in the annual cycle and wind direction is steady towards the southwest as mentioned in the above section. No steady wind wakes were observed within the transect before October or from the end of January. On the contrary, a lower-than-ambient wind speed band is clearly shown between distance 100 km and 200 km, together with the local speed minima identified (Figure 6a,b). The daily regional means have been removed to show the spatial variability without the influence of the temporal trend. The temporal-mean wind speed trough is around 5.10 m/s, with a local maximum value of 9~10 m/s on both ambient sides. To simplify the notation, hereafter we divide the transect into two parts, namely the northwestern side (NWS) with a transect distance smaller than the wind speed minima, and the southeastern side (SES) with a transect distance larger than the minima. We also noticed that the wind wake location oscillates during November and from the middle of January.
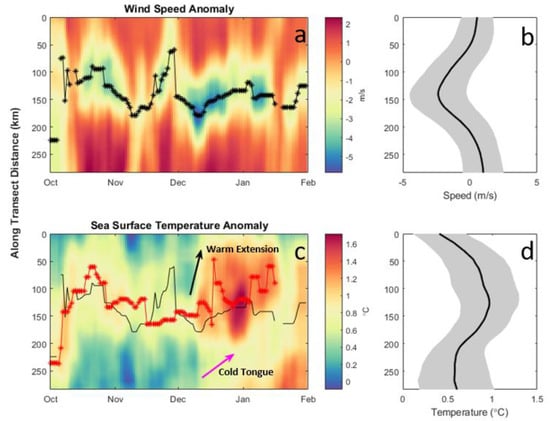
Figure 6.
The oceanic variables along the transect. The left panel are the variables (a) wind speed anomaly and (c) sea surface temperature anomaly varying with time in the winter of 2011. The right panel are the temporal-mean of variables of the left panel. The width of the gray shading area indicates two standard deviations. Blackline in (a) and (c) is the trough locations (±0.25 km) of wind speed anomaly of each day, the redline in (c) is the peak location of the SSTA. The black and magenta arrows in (c) indicate the NWS warm band extension and the SES cold tongue respectively. A weekly moving average was applied when plotting.
For the SST anomaly (SSTA) along the transect (Figure 6c,d), three features are noted here: firstly, a warm band is observed through the study period collocating with the wind wake pattern. Secondly, the SSTA warm band shows an asymmetric feature comparing with the wake footprint. The warm band covers a larger area than the wind speed band, extending in NWS of the wake. 65% of SST local maxima (red line in Figure 6c) locate within a shorter along transect distance than that of the wind speed minima. Specifically, SSTA with an elevated temperature of at least 0.9 °C is observed on the NWS during December and January (black arrow in Figure 6c). Thirdly, areas in SES (along a transect distance ≥ 200km) keeps reduced temperature steadily during the study period, even forming a cold tongue (magenta arrow in Figure 6c) to the southeast of the warm band from the middle of December until the end of January.
One question then arises naturally as what causes the observed asymmetric SSTA spatial variability. The reduced latent heat flux from the seawater to the atmosphere resulting from the decreased wind speed has been proposed as the forming mechanism of the warming SSTA band []. However, the sea surface heat flux solely could not explain the observed warming extension beyond the wind wake. Also, as shown by the retrieved wind stress curl from ASAR data (Figure 3c), a positive wind stress curl occurs on the NWS, which could bring the cooler bottom water, if any, up to the surface []. Obviously, the cooling process by upwelling is conflicting with the observed warming extension. The most possible mechanism for this is the redistribution of seawater heat induced by the oceanic heat advection, which is further investigated later on.
3.4. The Oceanic Heat Advection
The horizontal heat advection considered here consists of two terms: one is driven by the wind-induced Ekman drift (Figure 7), and the other is driven by the barotropic geostrophic current (Figure 8). Along the transect, the temporal averages of both ADV and LHF terms are in the order of 10−5 (Figure 9), but with different spatial variability across the wind wake, while SHF is one order smaller thus could be eliminated. The spatial difference of LHF along the transect increases from October to December. Focusing on December, we found that collocating with the trough of the wind speed (around 150 km along the transect), reduced LHF is found around 150 km, indicating a reduced heat loss process. Out of the wake footprint, LHF increased in both NWS and SES suggesting an enhanced cooling influence.
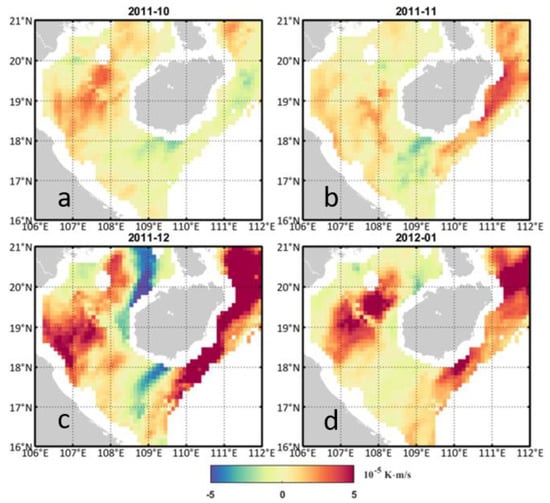
Figure 7.
Estimated monthly horizontal heat advection driven by the wind stress along the transect. Monthly averaged values are shown for (a) October of 2011, (b) November of 2011, (c) December of 2011, and (d) January of 2012.
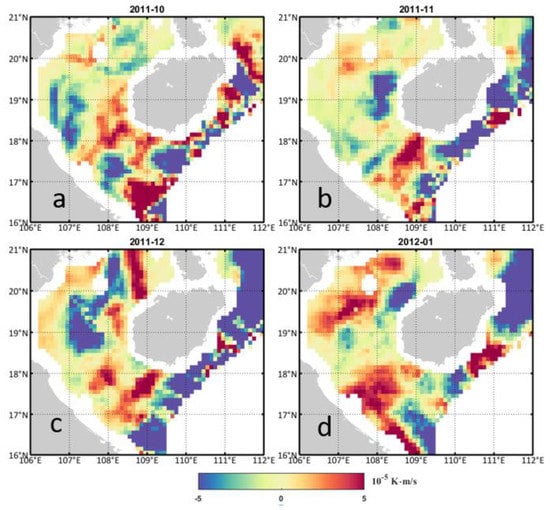
Figure 8.
Estimated monthly horizontal heat advection driven by the sea level pressure gradient along the transect. Monthly averaged values are shown for (a) October of 2011, (b) November of 2011, (c) December of 2011, and (d) January of 2012.
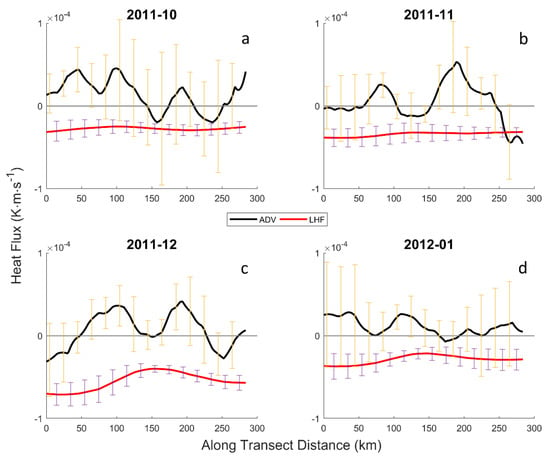
Figure 9.
Heat flux terms along the transect averaged over the study period from 2011/10/01 to 2012/01/31. The comparison is made between ADV (black line) and LHF (red line). Uncertainties of two standard deviations within each month are indicated as the length of error bars. The monthly averaged values are shown for (a) October of 2011, (b) November of 2011, (c) December of 2011, and (d) January of 2012.
Concerning ADV, a much larger temporal variability/uncertainty (yellow error bar in Figure 9) is observed especially in October and January, though the averaged values are still meaningful in terms of the temporal-integrated effects. The source of the temporal uncertainty will be analyzed later in this section. Coherent warming exceeding uncertainty could be found between 50 and 100 km from November to January, while the advective cooling process occurs around 250 km in November and December. In December, both ADV and LHF contribute to a higher heat accumulation process around the wake region than the ambient water (say, the starting and ending point of the transect at 0 km and 283 km) but in an out-of-phase pattern.
As mentioned in Section 3.3, a typical warm band extension on NWS (black arrow in Figure 6c) is observed at around December 10th, and a cold tongue forms on SES from the middle of December (magenta arrow in Figure 6c), while wind wake location keeps steady and strong during the same time. Thus, it is necessary to focus on December rather than the whole wake period from October to January to clarify the detailed day-by-day thermal evolution process (Figure 10). The increased ADV values (Figure 10b,c) around December 10th transiting northwestward agree well with the observed SSTA warming extension, and the cold tongue found southeast of the wake in the SST is also consistent with the decreased ADV values (Figure 10e,f).
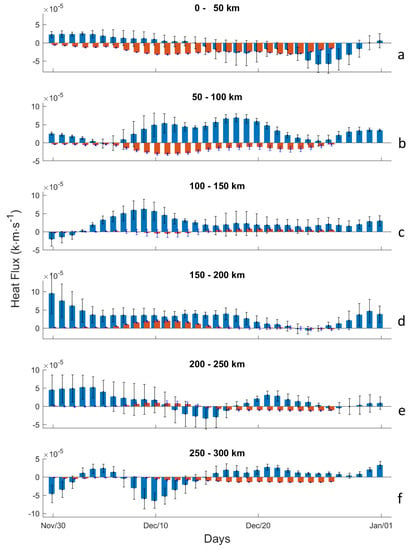
Figure 10.
Heat flux anomaly comparison between the heat advection and the latent heat flux in December of 2011. The transect is averaged every 50 km from(a) 0~50 km,(b) 50~100 km, (c) 100~150 km, (d) 150~200 km, (e) 200~250 km, and (f) 250~300 km. Blue bars are the heat advection, and red bars are the latent heat flux. The black and magenta arrows in (c) indicate the NWS warm band extension and the SES cold tongue respectively. Uncertainties of two standard deviations are indicated by the length of error bars.
Moreover, it is of interest to clarify the relative contribution of the two driven mechanisms, wind-induced Ekman drift and the geostrophic current, to the total heat advection. Still taking the December of 2011 as an example (Figure 7c and Figure 8c), the wind-driven heat advection tends to warm the water column from the center of the Beibu Gulf seawater to the NWS of the wake at 106°E ~ 108°E, 18°N ~ 20°N, while cool the water on the SES of the wake (approximately −4.23 × 10⁻⁵ ) at 109°E, 17.7°N. We also noticed the cooling of the west coast of Hainan Island and warming of the continental shelf, which is beyond our interest in this study though. Meanwhile, the geostrophic heat advection tends to decrease the water temperature in the center of the Beibu Gulf (e.g., −8.25 × 10⁻⁵ at 107.5°E, 18.9°N), and warm both sides of the wake (e.g., 4.53 × 10⁻⁵ at 107.9°E, 18°N, and 9.54 × 10⁻⁵ at 108.9°E, 17.7°N). Along the transect (Figure 11), the Ekman advection shows a consistent distribution through the whole wake period, cooling the NWS and warming the SES, which is probably related to the wind speed distribution associated with the wake. The maximum amplitude occurring in December corresponds to the intensified wind speed during the winter monsoon. On the other hand, the geostrophic advection is subjected to relatively larger temporal variability as represented by the standard deviation (yellow error bar in Figure 11), suggesting the temporal uncertainty observed in the total ADV (Figure 9) mostly comes from the geostrophic advection. Moreover, the geostrophic advection process tends to compensate the Ekman advection in the center of the Beibu Gulf and the SES, especially from October to December.
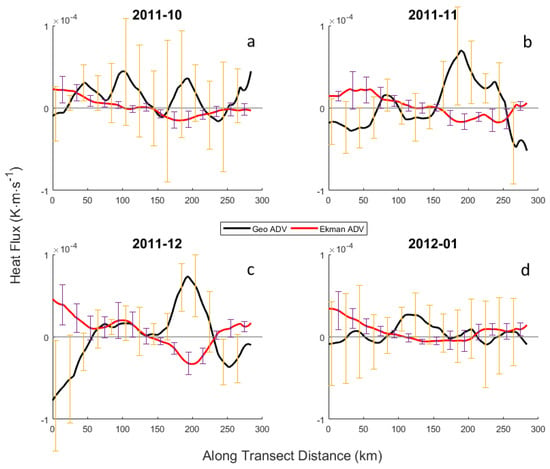
Figure 11.
Heat advection terms comparison along the transect averaged over the study period from 2011/10/01 to 2012/01/31. The comparison is made between the geostrophic heat advection (black line) and the wind-driven Ekman heat advection (red line). The monthly averaged values are shown for (a) October of 2011, (b) November of 2011, (c) December of 2011, and (d) January of 2012.The error bar along curves represent two times of temporal standard deviation within each month.
4. Discussion
It would be interesting to highlight the role of wind-driven heat advection. The wind advection tends to deplete the heat on the SES of the wake, and accumulate the heat on the NWS, with the sign switched within the wake footprint where the wind speed is the lowest. On the SES, the wind-driven heat advection is the major mechanism of the cooling process, which is enhanced (cooling) by the latent heat flux and compensated (warming) for by the geostrophic advection. The wind stress performs as an important factor driving the spatial thermal variability, especially in shaping the asymmetric warm band corresponding to the wind wake. It should be noted that our estimation in this study is integrated through the whole water column. If considering the surface layer only, the role of the Ekman drifting could even be amplified [,] while that of the geostrophic currents are reduced. It is also worth mentioning that the derived wind-driven currents in this study agree well with the reported winter time coastal circulations [], confirming the influence of the wind in the regional circulation, even taking geostrophic currents into consideration.
To correspond to the snapshot of the ASAR image from December 10, 2011, we conduct a case study of the wind wake from October 2011 to January 2012, when the wind wake location is steady and the wind speed is strong. The similar analyses could also be applied to other periods such as the following winters of 2012, 2013, and 2014 (Figure 12). The NWS warm band extensions beyond the wake could also be observed every winter from 2012 to 2014, and also collocate with similar distributions of the Ekman advection shown in sections above. The Ekman advection always tends to deplete the seawater heat on SES while accumulating the heat on NWS. This again confirms the essential role of the Ekman heat advection associated with the asymmetric thermal distribution across the wind wake. The geostrophic advection is also found to compensate for the Ekman advection during winter seasons somehow but is subjected to large spatial and temporal variability. Moreover, the distribution and the onset time of the wake exhibit interannual variations, which is probably modulated by climate oscillations via wind variabilities [,,]. The work of Li et al. [] also reveals that the core temperature of the warm band is significantly related to ENSO events from 1983 to 2011. The detailed climate-modulation process on different heat budget terms across the wake could be investigated in a future work.
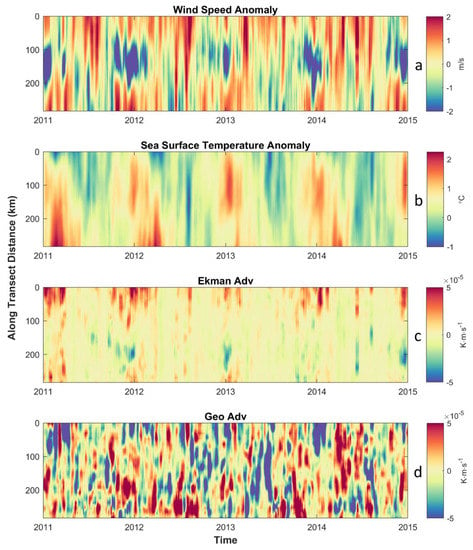
Figure 12.
Multi-year time series along the transect from 2011 to 2014. Four variables are plotted including (a) wind speed anomaly, (b) SSTA, (c) Ekman advection, and (d) geostrophic advection.
In Section 2.5, our assumption of vertically uniform temperature distribution precludes the heat advection contribution from the Ekman pumping. While from both the ASAR data and the WRF simulation, strong wind stress curls are noticed close to the boundary of the wake, corresponding to a maximum upwelling at an NWS (downwelling at SES) speed of 2.39 × 10⁻⁵ m/s. As previously studied, the Ekman pumping velocity of the eastern Hainan coast is in the order of 10−4 m/s [], while the upwelling velocity on the west coast is approximately 2.1 × 10⁻⁵ m/s []. Obviously, the magnitude of the wake-induced upwelling is comparable to the upwelling systems revealed around Hainan Island. However, the weak background stratification condition could prohibit the wake-induced upwelling to generate strong surface thermal response []. In contrast, the wake-induced upwelling could still bring nutrients upward, and might enhance the primary production in the upper ocean [,,]. Thus the identification of the suction/pumping process on the sub-mesoscale is meaningful to regional ecosystem dynamic studies.
A scaling analysis could be further applied considering the warming rate difference between two locations in the transect. Derived from Equation (7), we have . If we take the starting point at 0 km along the transect as a reference of ambient water, and assume that areas with a transect distance of 50 ± 10 km, 150 ± 10 km, and 250 ± 10 km represent the area of extended warming band out of the wake, the central warming band within the wake, and the cold tongue on the SES, respectively, then the heat flux difference from values at 0km could be estimated (Table 2) As analyzed in previous sections, the averaged values could indicate the temporal-integrated effects, while the uncertainty mostly corresponds to the temporal variations. Quantitatively, we could identify that the geostrophic ADV (Geo. ADV) dominant the warming of area 50 ± 10 km, and Ekman ADV dominant the cooling of area 250 ± 10 km. The ADV terms are important in shaping the boundary of the warm band, though the Ekman ADV and Geo. ADV tend to compensate for each other.

Table 2.
Contributions from heat flux/advection terms relative to values at 0 km along the transect.
Our results are not conflicting with the previously proposed mechanism that LHF could trigger the warm band [] since we also identified that LHF contributes to the central warming within the wake footprint. However, only if we introduce the ADV terms could the observed spatial variability be explained. On the other side, since , the net warming rate at 50 ± 10 km (Table 2) corresponds to a time scale of about 30 days to reach a temperature difference of 0.5 K. However, this shorter time scale, rather than the whole study period, indicates there must be other processes, such as tidal currents [,,] or ocean wave processes [], damping the spatial variability supported by the heat advection and the air-sea heat flux processes, which should be the subject of future works with the support of more in-situ measurements and a high-resolution air-sea coupling model in this region.
Moreover, documented wind wakes are usually presented through microwave instruments on much rougher resolutions [], or indirectly through optical imagery [,]. In this study the high-resolution ASAR data and its derived sea surface wind field show strong observative capacity on wind wake studies, revealing the sub-mesoscale structures within the wake. Furthermore, the combined application of observations from multi-sensor satellites, model simulations, and reanalysis products also support for identifying involved detailed evolution processes and provide complementary observations for model simulation results. This again validated the strong capacity of satellite remote sensing in understanding ocean dynamics.
This study sets up a framework via heat advection reconstruction based on multi-source datasets to clarify the competition process between the air-sea heat flux and the horizontal heat advection terms, which could be applied to similar phenomena as observed in other areas, e.g., in [,,]. The reconstruction then might be confined within the mixed layer in stratified seasons, but could extend to the whole column given support of vertical shear information. The baseline is that the reduced wind speed across the wake modifies the SST distribution not only through the air-sea heat flux (which has been extensively recognized), but also with variations in the horizontal heat advection on sub-seasonal timescale. Although the detailed role of heat advection, especially the wind-driven heat advection, may vary depending on local thermal and circulation conditions [], or even the interaction with land orography [], the contribution from heat advection could not be neglected before careful diagnosis.
5. Conclusions
Most of the previous studies around Hainan Island have focused on the upwelling systems on the eastern and western coasts during summer, but only a few have investigated the ocean dynamic to the southwest coast during winter, where HIWW is observed due to the interaction between the winter monsoon and the island’s orography. In this study, HIWW occurred during the winter of 2011 is taken as a study case to investigate the characters of the wind wake and associated oceanic thermal responses. Presented by ASAR NRCS and the retrieved sea surface wind field and wind stress curl, a triangular wake footprint with sub-mesoscale features is observed to extend around 200 km between Hainan Island and the Vietnamese coast, covering almost the whole southern entrance of the Beibu Gulf. The identification of strong Ekman suction/pumping bands on the boundary of the wind wake valids the strong capability of SAR sensors on sub-mesoscale study of the wind field. Statistics of the anomalous low wind speed from 2011 to 2014 confirms the monsoon-controlled spatial distribution of the wind wakes off the southwest coast of Hainan Island. It is necessary to further clarify the associated oceanic response to the wake during the wintertime so as to better understand the regional oceanic dynamics.
By a comparison between the wind field and temperature, the collocation of the wind wake footprint and the warm SST band along the transect is noticed. However, the northwest extending of the warm band and the cold tongue appearing to the southeast side could not be explained by the reduced LHF in response to the wind wake. The reconstructed heat advection reveals that the wind-driven horizontal heat advection, the barotropic geostrophic heat advection, and the latent heat flux are the three major factors contributing to the spatial temperature variability and are on the order of 10−5 K·m·s−1. The LHF mainly contributes to the central warming across the wind wake footprint. The wind-driven Ekman advection tends to deplete the seawater heat on SES of the wake and increase the heat on the NWS. The largest temporal and spatial variabilities are found within the geostrophic heat advection while compensating for the Ekman advection term somehow. In December 2011, the combined effects of these three terms generated the warming extension on the NWS and the cold tongue on the SES, forming an asymmetric thermal distribution across the wind wake. Our analysis highlights the role of heat advection concerning the thermal evolution process on a sub-seasonal timescale and clarified the regional asymmetric thermal responses to the wind wake in the winter.
Author Contributions
Conceptualization, J.S.; methodology, X.-M.L., X.C. and T.Z.; writing—original draft preparation, J.S.; writing—review and editing, J.S. and X.-M.L.
Funding
This research was supported by Hainan Provincial Natural Science Foundation of China (grant number 417215), National Natural Science Foundation of China (grant number 41706203) and the National Key R&D Program of China (2016YFC1401008).
Acknowledgments
We gratefully acknowledge the Envisat/ASAR data from European Space Agency (ESA), OISST and CCMP data from RSS (http://www.remss.com/), sea surface radiation products from ERA5 of Copernicus Climate Change Service (https://cds.climate.copernicus.eu/cdsapp#!/home), and ADT products from CMEMS (http://marine.copernicus.eu/).The authors would like to thank anonymous reviewers and the editors for suggestions that improved this manuscript. The authors also thank Jianjun Liang and Yili Zhao for providing suggestions and comments.
Conflicts of Interest
The authors declare no conflict of interest.
References
- Smith, R.B.; Gleason, A.C.; Gluhosky, P.A.; Grubišić, V. The Wake of St. Vincent. J. Atmos. Sci. 1997, 54, 606–623. [Google Scholar] [CrossRef]
- Caldeira, R.M.A.; Groom, S.; Miller, P.; Pilgrim, D.; Nezlin, N.P. Sea-surface signatures of the island mass effect phenomena around Madeira Island, Northeast Atlantic. Remote Sens. Environ. 2002, 80, 336–360. [Google Scholar] [CrossRef]
- Xie, S.-P.; Liu, W.T.; Liu, Q.; Nonaka, M. Far-Reaching Effects of the Hawaiian Islands on the Pacific Ocean-Atmosphere System. Science 2001, 292, 2057–2060. [Google Scholar] [CrossRef] [PubMed]
- Dong, C.; McWilliams, J.C. A numerical study of island wakes in the Southern California Bight. Cont. Shelf Res. 2007, 27, 1233–1248. [Google Scholar] [CrossRef]
- Harlan, J.A.; Swearer, S.E.; Leben, R.R.; Fox, C.A. Surface circulation in a Caribbean island wake. Cont. Shelf Res. 2002, 22, 417–434. [Google Scholar] [CrossRef]
- Li, J.; Wang, G.; Xie, S.-P.; Zhang, R.; Sun, Z. A winter warm pool southwest of Hainan Island due to the orographic wind wake. J. Geophys. Res. 2012, 117. [Google Scholar] [CrossRef]
- Yan, Y.; Chen, C.; Ling, Z. Warm water wake off northeast Vietnam in the South China Sea. Acta Oceanol. Sin. 2014, 33, 55–63. [Google Scholar] [CrossRef]
- Wyrtki, K. Scientific Results of Marine Investigations of the South China Sea and the Gulf of Thailand 1959–1961; Naga Report Vol. 2; University of California: San Diego, CA, USA, 1961; pp. 164–169. [Google Scholar]
- Shaw, P.-T.; Chao, S.-Y. Surface circulation in the South China Sea. Deep Sea Res. Part I Oceanogr. Res. Pap. 1994, 41, 1663–1683. [Google Scholar] [CrossRef]
- Chu, P.C.; Edmons, N.L.; Fan, C. Dynamical Mechanisms for the South China Sea Seasonal Circulation and Thermohaline Variabilities. J. Phys. Oceanogr. 1999, 29, 2971–2989. [Google Scholar] [CrossRef]
- Xie, L.; Pallàs-Sanz, E.; Zheng, Q.; Zhang, S.; Zong, X.; Yi, X.; Li, M. Diagnosis of 3D Vertical Circulation in the Upwelling and Frontal Zones East of Hainan Island, China. J. Phys. Oceanogr. 2017, 47, 755–774. [Google Scholar] [CrossRef]
- Lin, P.; Cheng, P.; Gan, J.; Hu, J. Dynamics of wind-driven upwelling off the northeastern coast of Hainan Island. J. Geophys. Res. Oceans 2016, 121, 1160–1173. [Google Scholar] [CrossRef]
- Su, J.; Pohlmann, T. Wind and topography influence on an upwelling system at the eastern Hainan coast. J. Geophys. Res. 2009, 114, C06017. [Google Scholar] [CrossRef]
- Minh, N.N.; Patrick, M.; Florent, L.; Sylvain, O.; Gildas, C.; Damien, A.; Van Uu, D. Tidal characteristics of the gulf of Tonkin. Cont. Shelf Res. 2014, 91, 37–56. [Google Scholar] [CrossRef]
- Hu, J.Y.; Kawamura, H.; Tang, D.L. Tidal front around the Hainan Island, northwest of the South China Sea. J. Geophys. Res. 2003, 108, 3342. [Google Scholar] [CrossRef]
- Lü, X.; Qiao, F.; Wang, G.; Xia, C.; Yuan, Y. Upwelling off the west coast of Hainan Island in summer: Its detection and mechanisms. Geophys. Res. Lett. 2008, 35. [Google Scholar] [CrossRef]
- Li, Y.; Peng, S.; Wang, J.; Yan, J.; Huang, H. On the Mechanism of the Generation and Interannual Variations of the Summer Upwellings West and Southwest Off the Hainan Island. J. Geophys. Res. Oceans 2018, 123, 8247–8263. [Google Scholar] [CrossRef]
- Gulev, S.K.; Latif, M.; Keenlyside, N.; Park, W.; Koltermann, K.P. North Atlantic Ocean control on surface heat flux on multidecadal timescales. Nature 2013, 499, 464–467. [Google Scholar] [CrossRef]
- Sha, J.; Yan, X.-H.; Li, X. The horizontal heat advection in the Middle Atlantic Bight and the cross-spectral interactions within the heat advection. J. Geophys. Res. Oceans 2017, 122, 5652–5665. [Google Scholar] [CrossRef]
- Dong, S.; Kelly, K.A. Seasonal and interannual variations in geostrophic velocity in the Middle Atlantic Bight. J. Geophys. Res. 2003, 108, 3172. [Google Scholar] [CrossRef]
- Dong, S.; Kelly, K.A. Heat Budget in the Gulf Stream Region: The Importance of Heat Storage and Advection. J. Phys. Oceanogr. 2004, 34, 1214–1231. [Google Scholar] [CrossRef]
- Mountain, D.G.; Strout, G.A.; Beardsley, R.C. Surface heat flux in the Gulf of Maine. Deep Sea Res. Part II Top. Stud. Oceanogr. 1996, 43, 1533–1546. [Google Scholar] [CrossRef]
- Lentz, S.J.; Shearman, R.K.; Plueddemann, A.J. Heat and salt balances over the New England continental shelf, August 1996 to June 1997. J. Geophys. Res. 2010, 115. [Google Scholar] [CrossRef]
- Closa, J.; Rosich, B.; Monti-Guarnieri, A. The ASAR wide swath mode products. In Proceedings of the IGARSS 2003, 2003 IEEE International Geoscience and Remote Sensing Symposium, Toulouse, France, 21–25 July 2003; Proceedings (IEEE Cat. No.03CH37477). IEEE: New York, NY, USA, 2003; Volume 2, pp. 1118–1120. [Google Scholar]
- Hersbach, H. Comparison of C-Band Scatterometer CMOD5.N Equivalent Neutral Winds with ECMWF. J. Atmos. Ocean. Technol. 2010, 27, 721–736. [Google Scholar] [CrossRef]
- Portabella, M.; Stoffelen, A. On Scatterometer Ocean Stress. J. Atmos. Ocean. Technol. 2009, 26, 368–382. [Google Scholar] [CrossRef]
- Horstmann, J.; Koch, W.; Lehner, S. Ocean wind fields retrieved from the advanced synthetic aperture radar aboard ENVISAT. Ocean Dyn. 2004, 54, 570–576. [Google Scholar] [CrossRef]
- Li, X.; Zheng, W.; Yang, X.; Zhang, J.A.; Pichel, W.G.; Li, Z. Coexistence of Atmospheric Gravity Waves and Boundary Layer Rolls Observed by SAR. J. Atmos. Sci. 2013, 70, 3448–3459. [Google Scholar] [CrossRef]
- Horstmann, J.; Koch, W. Measurement of Ocean Surface Winds Using Synthetic Aperture Radars. IEEE J. Ocean. Eng. 2005, 30, 508–515. [Google Scholar] [CrossRef]
- Chang, R.; Zhu, R.; Badger, M.; Hasager, C.; Xing, X.; Jiang, Y. Offshore Wind Resources Assessment from Multiple Satellite Data and WRF Modeling over South China Sea. Remote Sens. 2015, 7, 467–487. [Google Scholar] [CrossRef]
- Reynolds, R.W.; Smith, T.M.; Liu, C.; Chelton, D.B.; Casey, K.S.; Schlax, M.G. Daily High-Resolution-Blended Analyses for Sea Surface Temperature. J. Clim. 2007, 20, 5473–5496. [Google Scholar] [CrossRef]
- Atlas, R.; Hoffman, R.N.; Ardizzone, J.; Leidner, S.M.; Jusem, J.C.; Smith, D.K.; Gombos, D. A Cross-calibrated, Multiplatform Ocean Surface Wind Velocity Product for Meteorological and Oceanographic Applications. Bull. Am. Meteorol. Soc. 2010, 92, 157–174. [Google Scholar] [CrossRef]
- Hersbach, H.; Bell, B.; Berrisford, P.; Horányi, A.; Muñoz, J.; Nicolas, J.; Radu, R.; Schepers, D.; Simmons, A.; Soci, C.; et al. Global reanalysis: Goodbye ERA-Interim, hello ERA5. ECMWF Newsl. 2019, 159, 17–24. [Google Scholar]
- Al Senafi, F.; Anis, A.; Menezes, V. Surface Heat Fluxes over the Northern Arabian Gulf and the Northern Red Sea: Evaluation of ECMWF-ERA5 and NASA-MERRA2 Reanalyses. Atmosphere 2019, 10, 504. [Google Scholar] [CrossRef]
- Cheney, R.; Miller, L.; Agreen, R.; Doyle, N.; Lillibridge, J. TOPEX/POSEIDON: The 2-cm solution. J. Geophys. Res. 1994, 99, 24555–24563. [Google Scholar] [CrossRef]
- Hasager, C.; Astrup, P.; Zhu, R.; Chang, R.; Badger, M.; Hahmann, A. Quarter-Century Offshore Winds from SSM/I and WRF in the North Sea and South China Sea. Remote Sens. 2016, 8, 769. [Google Scholar] [CrossRef]
- Liu, P.; Tsimpidi, A.P.; Hu, Y.; Stone, B.; Russell, A.G.; Nenes, A. Differences between downscaling with spectral and grid nudging using WRF. Atmos. Chem. Phys. 2012, 12, 3601–3610. [Google Scholar] [CrossRef]
- Von Storch, H.; Langenberg, H.; Feser, F. A Spectral Nudging Technique for Dynamical Downscaling Purposes. Mon. Weather Rev. 2000, 128, 3664–3673. [Google Scholar] [CrossRef]
- Waldron, K.M.; Paegle, J.; Horel, J.D. Sensitivity of a Spectrally Filtered and Nudged Limited-Area Model to Outer Model Options. Mon. Weather Rev. 1996, 124, 529–547. [Google Scholar] [CrossRef]
- Hong, S.-Y.; Noh, Y.; Dudhia, J. A New Vertical Diffusion Package with an Explicit Treatment of Entrainment Processes. Mon. Weather Rev. 2006, 134, 2318–2341. [Google Scholar] [CrossRef]
- Kain, J.S.; Fritsch, J.M. A One-Dimensional Entraining/Detraining Plume Model and Its Application in Convective Parameterization. J. Atmos. Sci. 1989, 47, 2784–2802. [Google Scholar] [CrossRef]
- Lin, Y.-L.; Farley, R.D.; Orville, H.D. Bulk Parameterization of the Snow Field in a Cloud Model. J. Clim. Appl. Meteorol. 1983, 22, 1065–1092. [Google Scholar] [CrossRef]
- Mlawer, E.J.; Taubman, S.J.; Brown, P.D.; Iacono, M.J.; Clough, S.A. Radiative transfer for inhomogeneous atmospheres: RRTM, a validated correlated-k model for the longwave. J. Geophys. Res. Atmos. 1997, 102, 16663–16682. [Google Scholar] [CrossRef]
- Dudhia, J. Numerical Study of Convection Observed during the Winter Monsoon Experiment Using a Mesoscale Two-Dimensional Model. J. Atmos. Sci. 1989, 46, 3077–3107. [Google Scholar] [CrossRef]
- Decharme, B. Influence of runoff parameterization on continental hydrology: Comparison between the Noah and the ISBA land surface models. J. Geophys. Res. Atmos. 2007, 112. [Google Scholar] [CrossRef]
- Menendez, M.; García-Díez, M.; Fita, L.; Fernández, J.; Méndez, F.J.; Gutiérrez, J.M. High-resolution sea wind hindcasts over the Mediterranean area. Clim. Dyn. 2014, 42, 1857–1872. [Google Scholar] [CrossRef]
- Wang, G. Characteristics Analysis of High Winds over the Bohai and North Yellow Seas and Numerical Study of a High Wind Event. Master Thesis, Ocean University of China, Qingdao, China, 2013. [Google Scholar]
- Stoffelen, A. Toward the true near-surface wind speed: Error modeling and calibration using triple collocation. J. Geophys. Res. 1998, 103, 7755–7766. [Google Scholar] [CrossRef]
- Caires, S. Validation of ocean wind and wave data using triple collocation. J. Geophys. Res. 2003, 108, 3098. [Google Scholar] [CrossRef]
- Pan, M.; Fisher, C.K.; Chaney, N.W.; Zhan, W.; Crow, W.T.; Aires, F.; Entekhabi, D.; Wood, E.F. Triple collocation: Beyond three estimates and separation of structural/non-structural errors. Remote Sens. Environ. 2015, 171, 299–310. [Google Scholar] [CrossRef]
- Yilmaz, M.T.; Crow, W.T. The Optimality of Potential Rescaling Approaches in Land Data Assimilation. J. Hydrometeorol. 2013, 14, 650–660. [Google Scholar] [CrossRef]
- Ekman, V.W. On the Influence of the Earth’s Rotation on Ocean-Currents; Arkiv För Matematik, Astronomi Och Fysik, Bd. 2, No. 11; Almqvist & Wiksells boktryckeri, A.-B.: Uppsala, Sweden, 1905. [Google Scholar]
- Welander, P. Wind Action on a Shallow Sea: Some Generalizations of Ekman’s Theory. Tellus 1957, 9, 45–52. [Google Scholar] [CrossRef]
- Estrade, P.; Marchesiello, P.; De Verdière, A.C.; Roy, C. Cross-shelf structure of coastal upwelling: A two —Dimensional extension of Ekman’s theory and a mechanism for inner shelf upwelling shut down. J. Mar. Res. 2008, 66, 589–616. [Google Scholar] [CrossRef]
- Cushman-Roisin, B.; Beckers, J.-M. Introduction to Geophysical Fluid Dynamics: Physical and Numerical Aspects; Academic Press: Oxford, UK, 2011; Volume 101. [Google Scholar]
- Garratt, J.R. The Atmospheric Boundary Layer; Cambridge University Press: Cambridge, UK, 1994; ISBN 978-0-521-46745-2. [Google Scholar]
- Stevenson, J.W.; Niiler, P.P. Upper Ocean Heat Budget During the Hawaii-to-Tahiti Shuttle Experiment. J. Phys. Oceanogr. 1983, 13, 1894–1907. [Google Scholar] [CrossRef]
- Sha, J.; Jo, Y.-H.; Oliver, M.J.; Kohut, J.T.; Shatley, M.; Liu, W.T.; Yan, X.-H. A case study of large phytoplankton blooms off the New Jersey coast with multi-sensor observations. Cont. Shelf Res. 2015, 107, 79–91. [Google Scholar] [CrossRef]
- Gao, J.; Shi, M.; Chen, B.; Guo, P.; Zhao, D. Responses of the circulation and water mass in the Beibu Gulf to the seasonal forcing regimes. Acta Oceanol. Sin. 2014, 33, 1–11. [Google Scholar] [CrossRef]
- Wang, B.; Huang, F.; Wu, Z.; Yang, J.; Fu, X.; Kikuchi, K. Multi-scale climate variability of the South China Sea monsoon: A review. Dyn. Atmos. Oceans 2009, 47, 15–37. [Google Scholar] [CrossRef]
- Chao, S.-Y.; Shaw, P.-T.; Wu, S.Y. El Niño modulation of the South China Sea circulation. Prog. Oceanogr. 1996, 38, 51–93. [Google Scholar] [CrossRef]
- Zhang, Y.; Sperber, K.R.; Boyle, J.S. Climatology and interannual variation of the East Asian winter monsoon: Results from the 1979-95 NCEP/NCAR reanalysis. Mon. Weather Rev. 1997, 125, 2605–2619. [Google Scholar] [CrossRef]
- Tang, D.; Kawamura, H.; Lee, M.-A.; Van Dien, T. Seasonal and spatial distribution of chlorophyll-a concentrations and water conditions in the Gulf of Tonkin, South China Sea. Remote Sens. Environ. 2003, 85, 475–483. [Google Scholar] [CrossRef]
- Liu, Y.; Tang, D.; Evgeny, M. Chlorophyll Concentration Response to the Typhoon Wind-Pump Induced Upper Ocean Processes Considering Air-Sea Heat Exchange. Remote Sens. 2019, 11, 1825. [Google Scholar] [CrossRef]
- Wilkin, J.L. The Summertime Heat Budget and Circulation of Southeast New England Shelf Waters. J. Phys. Oceanogr. 2006, 36, 1997–2011. [Google Scholar] [CrossRef]
- Shi, Q.; Bourassa, M.A. Coupling Ocean Currents and Waves with Wind Stress over the Gulf Stream. Remote Sens. 2019, 11, 1476. [Google Scholar] [CrossRef]
- Thomson, R.E.; Gower, J.F.R.; Bowker, N.W. Vortex Streets in the Wake of the Aleutian Islands. Mon. Weather Rev. 1977, 105, 873–884. [Google Scholar] [CrossRef]
- Li, J.; Zhang, R.; Ling, Z.; Bo, W.; Liu, Y. Effects of Cardamom Mountains on the formation of the winter warm pool in the gulf of Thailand. Cont. Shelf Res. 2014, 91, 211–219. [Google Scholar] [CrossRef]
© 2019 by the authors. Licensee MDPI, Basel, Switzerland. This article is an open access article distributed under the terms and conditions of the Creative Commons Attribution (CC BY) license (http://creativecommons.org/licenses/by/4.0/).