Abstract
Although Saudi Arabia has experienced very high rates of urbanization, little interest has been given to investigating national and provincial trends in urbanization in space and time. Night-time lights satellite sensor data are considered as a suitable source of imagery for mapping urban areas across large regions. This study uses night-time lights data to analyze the spatial and temporal patterns and dynamics of urban growth in Saudi Arabia between 1992 and 2013 at the national and provincial levels. A hybrid method was applied to ensure the continuity and consistency of the Defense Meteorological Satellite Program (DMSP) Operational Line-Scan System (OLS) of stable night-time (SNT) data through time. As a result of spatial variation in the character of urban areas across Saudi Arabia, different thresholds were used to derive urban areas from the imagery. The extracted urban morphology was assessed using socio-economic data and finer resolution imagery, and accuracy assessment revealed excellent agreement. Based on the rigorous stepwise calibration analysis undertaken here, urban areas in Saudi Arabia were found to have increased three-fold between 1992 and 2013, with most of the increase concentrated in three provinces (Makkah, Riyadh and Eastern). In addition, significant variation was observed in urbanization at the provincial level. The observed high rates of urban growth are aligned with the prosperity and socio-economic development of Saudi Arabia over the last 40 years. The research shows that DMSP-OLS SNT data can provide a valuable source of information for mapping the space–time dynamics of urban growth across very large areas. Such data are required by urban and regional planners, as well as policy makers, for characterizing urban growth patterns, interpreting the drivers of such dynamics and for forecasting future growth, as well as achieving sustainable development management.
1. Introduction
Since the 1950s, Saudi Arabia has experienced rapid urbanization [1]. The percentage of the population that lives in urban areas in Saudi Arabia has increased from 21% in 1950, through 58% in 1975, to 83% in 2015, and is estimated to reach 86% by 2030 and 90% by 2050 [2]. These large increases in urban population over a short time period have led to the creation of large urban settlements to meet the need for new housing, businesses, industrial areas and transport infrastructure [3,4,5]. Therefore, accurate, consistent and timely information on national trends in urbanization and the growth of cities in space and time is required to enable urban and regional planners and policy-makers to understand the driving forces underpinning the processes of urbanization, to anticipate the consequences of rapid urbanization, and ultimately to make more reliable predictions to achieve sustainable urban development [6].
The space–time pattern of urban growth can be measured from traditional sources including national censuses [7]. However, in Saudi Arabia, such sources lack adequate spatial resolution, may be affected by abrupt, artificial administrative boundaries, and have low temporal frequency, limiting their usefulness for dynamic analysis. Remotely sensed imagery offers an alternative source of information for measuring the space–time growth of cities and urban dynamics with the benefits of providing a synoptic view, a fixed spatial resolution, and frequent revisit period. Fine and moderate spatial resolution images, such as from WorldView, GeoEye, Systeme Probatoire d’Observation de la Terre (SPOT) and Landsat, have been used widely for mapping urban areas [8,9]. However, for a vast country like Saudi Arabia, which covers an area of more than 2 million km2, processing such fine spatial resolution images can be prohibitively time consuming and expensive. For national coverage, it is more appropriate to consider coarse spatial resolution imagery. One source of imagery that has particular relevance to mapping urban areas is the Defense Meteorological Satellite Program (DMSP) Operational Line-Scan System (OLS) of stable night-time (SNT) light images. Such imagery has been used as a valuable source for assessing urban growth extent across very large areas, i.e., the national, regional and global scales.
DMSP-OLS has become a uniform and valuable data source for observing emission sources, such as city and industrial lights, gas flares and large natural fires [6,10,11,12]. DMSP-OLS data have also been used widely to investigate urban expansion and density [7,11,13,14,15,16,17,18,19,20,21,22,23]. However, there are several limitations associated with SNT data, including the absence of on-board calibration of the DMSP-OLS sensor, which makes it non-comparable with time-series data derived from other satellites. This can be improved by applying a calibration process to SNT data [24]. Another issue is the blooming effect in the SNT data, where the lit area exceeds the urban area. This causes difficulty in separating the urban area from its surrounding non-urban area. This issue can be addressed by applying methods such as the empirical threshold technique [18,20], classification-based methods [25,26,27] and index-based methods [28,29].
Due to its simplicity and comparatively reasonable accuracy and reliability, the threshold-based approach has been utilized commonly for deriving urban areas from night-time images [15,19,25], although this method often overestimates urban areas in larger cities and underestimates urban areas in small cities and towns. Using a single threshold may be inappropriate for regional and national levels where the desired threshold may vary across space and time [15]. For example, the appropriate thresholds for extracting urban areas from the DMSP-OLS images ranged between seven and 63 in different regions of the world [15,16,18,25,30,31,32,33]. These discrepancies in the threshold values may be attributed to spatial heterogeneity in terms of urban structure or socio-economic status [15,25]. Table 1 summarizes the research on urban areas measured by night-time lights in terms of study area, methodology and accuracy.

Table 1.
Comparison of previous research on urban areas measured by night-time lights.
According to the authors’ knowledge, no consistent or comparable information exists on urban growth in space and time in Saudi Arabia at the national and provincial levels. A variety of studies have been undertaken to detect urban growth using mainly Landsat satellite sensor imagery for certain major cities in Saudi Arabia, such as Riyadh city (in central Saudi Arabia) between 1972 and 2005 [34] and between 1990 and 2014 [35], Makkah and Taif (in western Saudi Arabia) between 1986 and 2013 [36], Jeddah (in western Saudi Arabia) between 1964 and 2007 [37], and Alkhobar (eastern Saudi Arabia) between 1990 and 2013 [8]. However, there has been a paucity of studies addressing urban growth across the whole of Saudi Arabia over recent years, leaving a wide gap in knowledge on this important issue.
This research aimed to quantify the spatiotemporal dynamics of urban growth in Saudi Arabia between 1992 and 2013 using DMSP-OLS SNT data for the first time. The analysis was carried out over seven-year intervals, resulting in three time periods (1992–1999, 1999–2006 and 2006–2013). Moreover, due to their political, economic and religious importance, the spatial patterns of growth in four highly urbanized cities (Makkah, Riyadh, Jeddah and Dammam) situated in different parts of the country were considered in greater detail.
2. Study Area and Data
2.1. Study Area
Saudi Arabia is located in the western part of the continent of Asia at the crossroads of three continents: Asia, Africa and Europe (Figure 1). It is the largest Gulf state and occupies most of the Arabian Peninsula, covering an area of about 2 million km2. The population was estimated to be 33.4 million in 2018 [38]. Saudi Arabia is divided into 13 administrative provinces, and each province is divided into governorates, with 188 governorates in Saudi Arabia in total. Provinces in Saudi Arabia are usually grouped into five major regions: West (Makkah and Madinah), Central (Riyadh and Qasim), East (Eastern), North (Tabuk, Jouf, Hail and Northern) and South (Baha, Asir, Jazan and Najran).
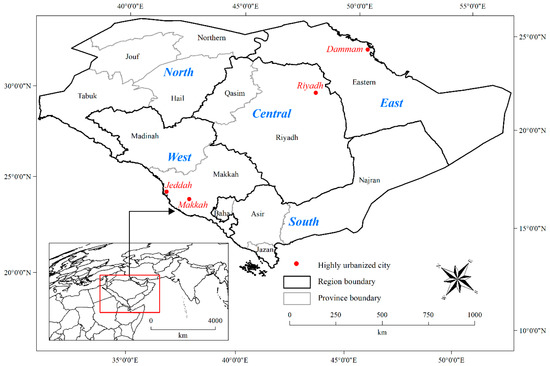
Figure 1.
Location of Saudi Arabia (inset) and the five regions and 13 provinces within Saudi Arabia.
2.2. Data
For this study, version 4 of the DMSP-OLS dataset was downloaded from the National Oceanic and Atmospheric Administration/National Geographical Data Center (NOAA/NGDC) website. The version 4 DMSP-OLS dataset contains three products: the cloud-free dataset, average visible dataset and stable light dataset. The stable night-time light (DMSP-OLS SNT) dataset is the most popular product because it mainly represents the light from cities and villages [39]. The spatial resolution of the DMSP-OLS SNT is 30 arc second (approximately 1 km) and the swath width is 3000 km. Moreover, it includes two bands: the visible-near infrared band (0.5–0.9 µm) with a radiometric resolution of 6-bit (digital number (DN) values ranging from 0 to 63) and the thermal infrared band (10.5–12.6 µm) with a radiometric resolution of 8-bit (DN values ranging from 0 to 255). The DMSP-OLS SNT data were produced by six different satellites (namely: F10, F12, F14, F15, F16 and F18), spanning over 22 years from 1992 to 2013. So, for example, F14-2003 means a night-time image captured in 2003 from satellite F14 [39].
The global DMSP-OLS SNT data from 1992 to 2013 were clipped based on Saudi Arabia’s international boundaries. Phenomena such as gas flares were isolated and then the night-time images were projected using the Albers Equal Area projection to allow for the accurate calculation of area. Finally, the pixel size was resampled to 1 km by applying a commonly nearest neighbor resampling algorithm [12,19,26,28]. Landsat Thematic Mapper (TM) or Landsat Enhanced Thematic Mapper Plus (ETM+) data acquired in 2002 or 2003 were used as ancillary data to help extract the urban areas from the DMSP-OLS SNT images. The years 2002 and 2003 were chosen because they represent the middle of the period from 1992 to 2013. Extracting urban information from medium and fine spatial resolution remotely sensed data over a large area is time and labor consuming. Therefore, Landsat TM and Landsat Operational Land Imager (OLI) data acquired in 1992 and 2013, respectively, were analyzed for some cities to evaluate the urban areas derived from the DMSP-OLS SNT data.
Socio-economic statistical data at the national level were obtained from the Saudi General Authority for Statistics (STATS). Data on population, electricity consumption, number of students, number of health centers and gross domestic product (GDP) from 1992 to 2013 were extracted from the annual statistical yearbooks [40]. The socio-economic statistical data were also used to evaluate the calibrated DMSP-OLS SNT and the urban extent data, in particular, through the Pearson’s product–moment correlation coefficient.
3. Methodology
The DMSP-OLS SNT data have no on-board calibration, so the data are unstable and incomparable between the different satellites (F10–F18) for the different years (1992 to 2013) as shown in Figure 2 and by other research [15,39,41]. The absence of on-board calibration makes the DMSP-OLS SNT data insufficient for socio-economic applications. To overcome the instability and incomparability of the DMSP-OLS SNT data, a stepwise calibration method developed by Li and Zhou [41], plus an intra-annual composition and inter-annual series correction developed by Liu et al. [15], were used in this research.
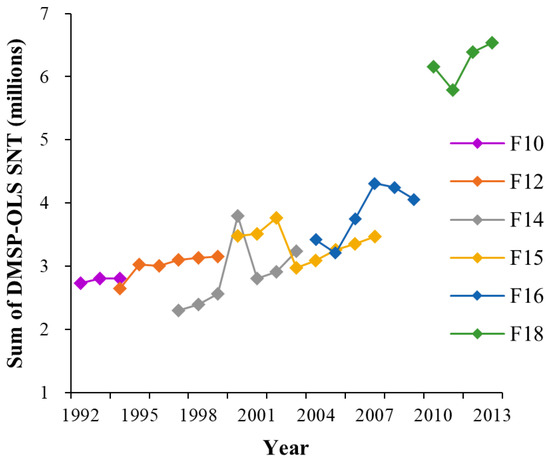
Figure 2.
Sum of DN values of lit pixels from the Defense Meteorological Satellite Program Operational Line-Scan System of stable night-time (DMSP-OLS SNT) light images for Saudi Arabia.
3.1. Stepwise Calibration
As explained above, the DMSP-OLS SNT data cannot be used directly for observing long-period temporal changes. Two main problems are represented in Figure 2. First, the DMSP-OLS SNT values may be inconsistent for the same year when derived from different sensors. For example, the sum of the DMSP-OLS SNT data in 1997, 1998 and 1999 was 3.11, 3.13 and 3.15 million respectively for sensor F12, whereas the sum was 2.2, 2.4 and 2.5 million, respectively, for sensor F14. Second, the DMSP-OLS SNT values fluctuate between different years for the same sensor. For example, the sum of the DMSP-OLS SNT data (DN values) in 2000 for sensor F14 dramatically decreased from 3.8 million to 2.8 million in 2001 (Figure 2). These observations conflict with the well-known development in Saudi Arabia that has demonstrated continuous growth in most socio-economic dimensions since 1992. Thus, the objective of the stepwise calibration [41] is to decrease spurious temporal variation in the DMSP-OLS SNT data. The method of Li and Zhou [41] uses multiple temporally neighboring images as the reference instead of a single image. The stepwise calibration method comprises four subsequent steps.
3.1.1. Systematic Correction of Satellite F14
The estimates (underestimation) of satellite F14 were corrected to make them compatible with the estimates from satellites F10 and F12. The latter (F10 and F12) were consistent and, thus, assumed to be sufficiently correct. The pattern of estimates from satellite F14 is acceptable, but has a systematic underestimation compared with satellite F12. This systematic underestimation could be a reason for the satellite change. Using the overlapping years (1997, 1998 and 1999) between satellites F12 and F14, a quadratic regression model (Equation (1)) was fitted to correct the systematic underestimation of satellite F14. Figure 3a shows the relationship and regression coefficients between satellites F12 and F14 in the overlapping years. The R2 value of 0.98 indicates a large, positive correlation between the estimates from the two satellites in the overlapping years.
where and are the DMSP-OLS SNT estimates of satellites F12 and F14, respectively, and , and are regression coefficients.
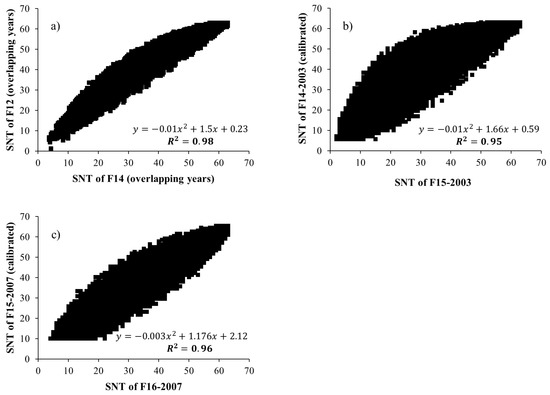
Figure 3.
Regression coefficients of DMSP-OLS SNT between (a) F12 and F14, (b) F14-2003 (calibrated) and F15-2003 and (c) F15-2007 (calibrated) and F16-2007.
3.1.2. Period-based Correction of Satellite F15
The period from 2003 to 2007 is underestimated by satellite F15 and was, therefore, corrected to bring the estimates into harmony with the pattern of estimates from satellite F14 and the previous years (2000–2002) of satellite F15. It was noticed that there was a decrease in estimates from satellite F15 since 2003 and then the estimates gradually increased (F15-2003 to F15-2007). The overlapping year (2003) of the calibrated F14 and the original F15 was used to fit a second regression model to adjust the systematic underestimation part (2003 to 2007) of satellite F15. Figure 3b confirms that a large correlation (R2 = 0.95) exists between the variables.
3.1.3. Correction of Satellite F16
The temporal pattern of estimates from satellite F16 is complex, unlike for the other satellites. For example, the sum of the DMSP-OLS SNT data in 2004 was 3.4 million, which decreased by 6% in 2005, increased to 3.7 million and 4.3 million in 2006 and 2007, respectively, and then decreased to 4.2 million and 4.0 million in 2008 and 2009, respectively (Figure 2). Different methods [6,34] were tested to correct the underestimation of satellite F16. The appropriate one was to fit a regression model (Figure 3c) between F15-2007 (calibrated) as the dependent variable and F16-2007 as the independent variable and then using the regression model to perform the correction. The large R2 (0.96) indicates a strong correlation between satellites.
3.1.4. Correction of Satellite F18-2010
The extremely unreliable overestimation of satellite F18 [41,42] was adjusted to make it comparable with the overall trend. Taking into account that there are no overlapping years between satellites F18 and F16, the widely utilized method developed by Elvidge et al. [39] was applied. Tabuk governorate demonstrates stable socio-economic development and, thus, it was chosen as the calibration area. The smallest sum of the DMSP-OLS SNT estimates in satellite F18 was recorded in 2011 (5.7 million), so F18-2011 was selected as the reference image and then regressed (Table 2) with the other years for the same satellite. The application of the Elvidge et al. [39] approach successfully decreases the extremely high overestimation of satellite F18.
Table 2.
Coefficients of satellite F18.
3.2. Intra-Annual Composition and Inter-Annual Series Correction
The aims of intra-annual composition are to utilize all images obtained from different sensors for the same year and to exclude unstable lit pixels [15]. The version 4 DMSP-OLS SNT dataset has 12 pairs, derived from different satellites during 1994 and from 1997 to 2007. Intra-annual composition starts by identifying the intra-annual unstable lit pixels, and then replacing them with a value of zero. Then, the average of the stable lit pixels is calculated for the images acquired in the same year [15]. The process for this step is given in Equation (2):
where is the DN value of the inter-annual composition step of the th lit pixel in the th year, and and are the DN values of the DMSP-OLS SNT data for the different satellites of the th lit pixel in the th year, respectively.
The aim of the inter-annual series correction is to ensure consistency between the images for different years. Liu et al. [15] assumed that urban sprawl was expanding outwards in China over time and, thus, the lit pixels should become brighter. This assumption holds true for a country like Saudi Arabia. The inter-annual series correction supposes that the DN values of the lit pixels observed in earlier years should be equal to or less than those observed in later years (Equation (3)):
where and are the DN values of the DMSP-OLS SNT data of the th lit pixel in the th and th years, respectively.
3.3. Urban Extraction
As mentioned earlier, different approaches have been utilized to extract urban areas from the DMSP-OLS SNT data [15,16,17,18,19,20,21,22,23,24,25,26,27,28,29]. However, the threshold approach based on ancillary data has been applied extensively because it is simple and produces reliable results for urban areas [15,30]. For this reason, the threshold approach with ancillary data was used in this research.
The choice of an appropriate threshold is a key factor in differentiating accurately between urban and non-urban areas. Due to the spatial heterogeneity in terms of urban pattern, texture and size between different regions, multiple thresholds are required [15,18,30]. Saudi Arabia has been divided into four groups of governorates based on demographic information (census statistics for 2010) which are labelled as: high-populated, medium-populated, low-populated and very low-populated governorates. These four groups reflect the range of spatial variation in urban population density in Saudi Arabia.
Samples consisting of 30% of the governorates from each group were selected and then Landsat TM or ETM+ data (acquired in 2002 or 2003) were downloaded for these samples. Based on visual analysis [18], the thresholds were defined using a trial-and-error approach for each group. The appropriate thresholds were selected by comparing and matching the urban areas extracted from the DMSP-OLS SNT data to the urban sprawl indicated in the Landsat data (Table 3). Finally, the appropriate thresholds were utilized to extract the lit urban areas for the other years in each group.
Table 3.
Appropriate thresholds in Saudi Arabia.
4. Results and Discussion
4.1. DMSP-OLS SNT Calibration and Validation
The stepwise calibration process improved the temporal pattern of estimates obtained from the DMSP-OLS SNT data in terms of continuity and comparability across Saudi Arabia for the period from 1992 to 2013 (Figure 4a–e). Firstly, the underestimation of satellite F14 was corrected based on satellite F12 and it is clear that the pattern of estimates from satellite F14 was made compatible with those from satellite F12 (Figure 4b). Moreover, after the second stepwise calibration step, the underestimation part (2003–2007) of satellite F15 was enhanced as the estimates increased (Figure 4c) and became consistent with estimates for previous years. For example, the sum of DMSP-OLS SNT of the underestimation part (2003–2007) of satellite F15 ranges from 2.9 million to 3.4 million before the calibration process. These values were increased after calibration and ranged from 4.3 million to 5 million. Secondly, the intra-annual composition (Figure 5a) and inter-annual series correction (Figure 5b) further improved the temporal profile in terms of temporal continuity and comparability in the DMSP-OLS SNT data.
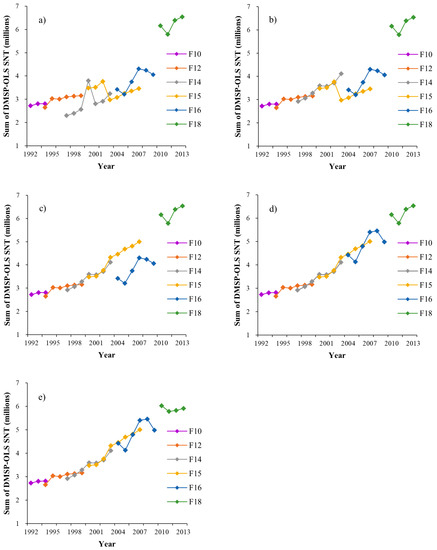
Figure 4.
Sum of DMSP-OLS SNT in the stepwise calibration: (a) original data before calibration; (b) correction of satellite F14; (c) adjustment of satellite F15; (d) correction of satellite F16; (e) correction of satellite F18.

Figure 5.
Sum of DMSP-OLS SNT data based on (a) intra-annual composition and (b) inter-annual series correction.
The calibrated DMSP-OLS SNT data were evaluated using socio-economic statistical data. All the socio-economic variables were tested for normality. The skewness and kurtosis values were divided by the standard error for each variable and all results fell in the range of –1.96 to +1.96, indicating normally distributed data. The analysis revealed a large correlation with all socio-economic indicators, with correlation coefficients () ranging between 0.96 and 0.99 (Figure 6a–e).
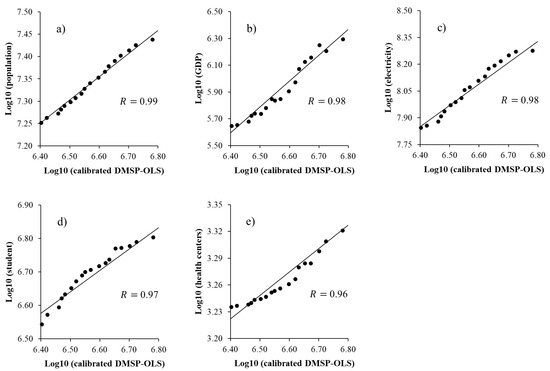
Figure 6.
Correlation of the log of (a) population, (b) GDP, (c) electricity consumption, (d) number of students and (e) number of health centers on the log of calibrated DMSP-OLS SNT data in Saudi Arabia.
4.2. Urban Area Extraction and Accuracy Assessment
Figure 7 shows the urban areas derived from the calibrated DMSP-OLS SNT data in Saudi Arabia from 1992 to 2013. The urban area was 8184 km2 in 1992, which increased to 13,208 km2 in 2002 and reached 24,699 km2 in 2013 (Figure 8). The dramatic changes in urban areas during this period (1992–2013) are related to the oil boom, construction projects, land grants and housing loans, the huge influx of migrants, and falling mortality rates [43].
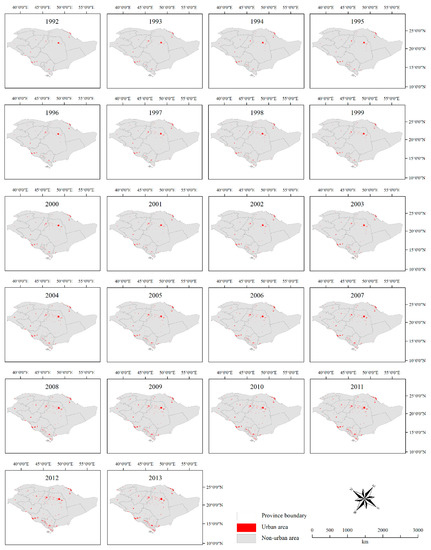
Figure 7.
Maps of urban area across Saudi Arabia from 1992 to 2013 derived from the calibrated DMSP-OLS SNT data.
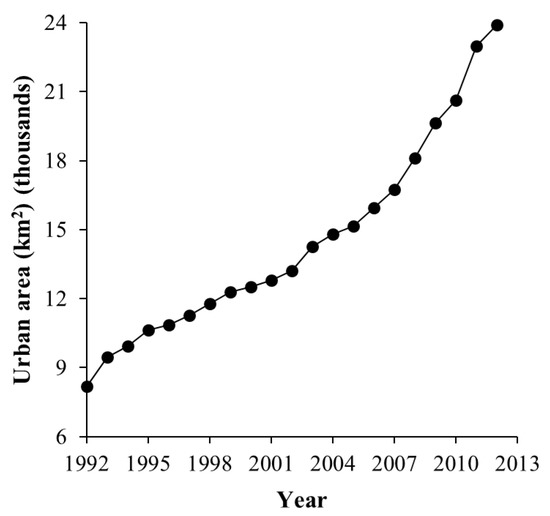
Figure 8.
Total urban area (km2) in Saudi Arabia from 1992 to 2013.
The extracted urban areas were assessed using: (1) several socio-economic indicators and (2) fine spatial resolution satellite sensor data. The extracted urban areas show a large correlation with all socio-economic variables and the coefficient values () range between 0.96 and 0.99, as shown in Figure 9. This suggests that the urban area derived from the DMSP-OLS SNT is relatively reliable.
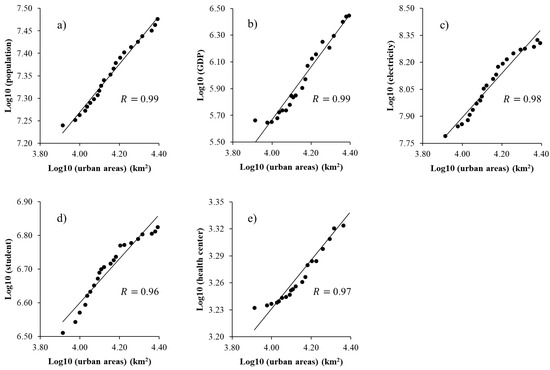
Figure 9.
Correlation of the log of (a) population, (b) GDP, (c) electricity consumption, (d) number of students and (e) number of health centers on the log of night-time urban areas in Saudi Arabia.
The hybrid calibration method applied in this research takes its advantages from two robust methods developed by Liu et al. [15] and Li and Zhou [41] and has not yet been examined. Most night-time lights studies used the Elvidge et al. [39] calibration method and few used the Liu et al. [15] method. It is interesting to compare the performance of the hybrid method applied here in the Arabian Gulf region (Saudi Arabia) with other methods applied in experiments undertaken in the USA, Europe or East Asia. For example, the correlation coefficients ( values) between the urban night-time lights variable and population and GDP were 0.98 and 0.94 in Xin et al. [22]; and 0.69 and 0.74 in Liu et al. [15], respectively. The correlation coefficients achieved in this research were larger than for these previous studies, with values of 0.99 and 0.98 respectively.
As a result of the fine spatial resolution of Landsat data (30 m) compared with the DMSP-OLS SNT data (1 km), the former can be utilized to evaluate the urban areas extracted from the DMSP-OLS SNT data [15,44]. The most populated cities in each group listed in Table 3 (namely, Riyadh, Hail, Rabeq and Traif) were selected. Then, Landsat data for 1992 (TM) and 2013 (OLI) for those cities were downloaded and digitized [17] to identify the urban areas. Evaluation suggests that the urban land cover derived from the DMSP-OLS SNT data is compatible with that derived from the Landsat data for 1992 and 2013 (Figure 10). The overall accuracy (OA) ranged from 80% to 92% and the Kappa statistic ranged from 0.66 to 0.84. This indicates that the DMSP-OLS SNT data can be utilized as an adequate source for mapping urban areas with high accuracy.
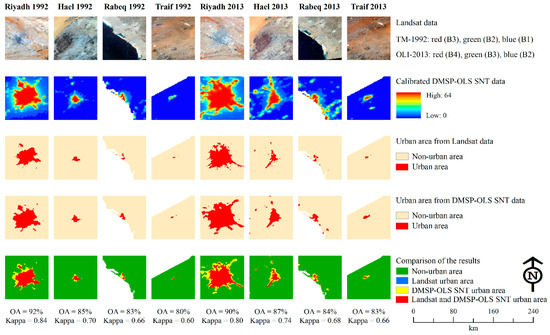
Figure 10.
Accuracy assessment of the DMSP-OLS SNT urban areas for representative cities in Saudi Arabia in 1992 and 2013.
4.3. Dynamics of Urban Expansion
In this research, seven-year intervals were used from 1992 to 2013, resulting in three time periods (1992–1999, 1999–2006 and 2006–2013). Figure 11 shows the dynamics of urban expansion in Saudi Arabia and the highly urbanized cities from 1992 to 2013. Saudi Arabia witnessed rapid urbanization during these years, as seen from the continuous growth of its built-up urban area (Figure 11a). Table 4 shows the urban areas and percentage changes that occurred within the three time periods at the national and provincial levels. The urban area covered 8184 km2 in 1992, which increased to 12,207 km2 in 1999. The increase in urban areas during the next two time periods was 30% and 55%, respectively. These results are in line with the socio-economic boom that occurred in Saudi Arabia due to oil revenues over the past 47 years. Table 4 shows that most of the highest growth rate occurred during the third time period (2006–2013) compared with the first (1992–1999) and second ones (1999–2006), which coincides with an increase in national income during this time period due to rising oil prices. For example, in Hail province, the urban growth rate during the third time period was larger (119%) than in the first and second time periods (35% and 85%, respectively).

Figure 11.
Dynamics of urban expansion through three time periods (1992 to 1999; 1999 to 2006; 2006 to 2013) in (a) Saudi Arabia and (b–e) highly urbanized cities.
Table 4.
Urban expansion in km2 and percentage change across the three time periods for the 13 Saudi provinces and Saudi Arabia as a whole.
Riyadh, Makkah and Eastern provinces had the largest urban areas in all three time periods and this coincided with massive investment in these provinces in terms of socio-economic activities. For example, Makkah province receives special attention from the Saudi government because it includes the holy mosque and millions of people visit Makkah from different countries every year. The Saudi government launched railway and bus projects to facilitate people reaching the holy sites. Moreover, the largest seaport in terms of size and handling is located in Makkah province, and it handles more than 65% of the goods delivered through all Saudi seaports. Riyadh province includes the capital city and, thus, it is the political and financial center of the country. Major projects have been implemented such as the construction of roads, street lighting and railway projects (particularly the center-to-east and center-to-north directions). Moreover, most of the government institutions and largest universities are located in Riyadh province. The Eastern province is the center of the economy in Saudi Arabia due to the availability of gas and petroleum. Utilities and services have been constructed to support these industries and the largest industrial city in the Middle East is built in the Eastern province (Jubail Industrial City).
Since the Fifth Development Plan (1990–1995) the government aimed to achieve development throughout all provinces of the Kingdom and focused on developing medium and small cities (provinces) across the country. This policy change is commensurate with the urban growth rates observed in provinces such as Asir, Baha, Jazan and Hail which were larger than those in the three more established provinces (Makkah, Riyadh and Eastern).
The dynamics of urban expansion reveal regional discrepancies. For example, Northern province grew by 60% in the second time period (1999–2006), whereas Hail province grew by 85% in the same period (Table 4). The differences in urban expansion observed across provinces result from imbalanced development in terms of administrative, economic and social activities. Moreover, it was found that nearly 50% of the provinces increased at a faster rate than the average national rate across all periods. Clearly, the observed urban growth for all time periods reflects the economic development in Saudi Arabia. For example, the GDP was $123 billion in 1992, increasing to $161 billion in 1999, $356 billion in 2006 and $748 billion in 2013 [40].
To consider the spatial patterns of growth in urban areas in greater detail, four important, highly urbanized cities (Makkah, Riyadh, Jeddah and Dammam) in different parts of Saudi Arabia are now discussed. Makkah is the most important city in Muslim countries and is located in the mid-west part of the Makkah region. Riyadh is the capital of Saudi Arabia, the most populated city in the country and one of the fastest growing cities in the Middle East. Jeddah is the second largest city in Saudi Arabia, considered the commercial capital of the country and is the largest seaport on the Red Sea. Dammam is located in the Eastern province along the Arabian Gulf and is the center of the Saudi oil industry.
Figure 11b,d map the urban areas of Makkah and Jeddah, respectively, for the three time periods. It can be observed that Makkah has witnessed urban expansion from the center of the city to the north-east due to the availability of flatlands and to the south-east towards a city called Taif, which has a large tourism industry. For Jeddah (Figure 11d), the urban pattern is different and is affected mainly by the presence of the coastline. The urban area of Jeddah expanded more to the north and east than the south, as was also found in other studies [43,45]. The urban area of Riyadh (Figure 11c) is circular in form, starting from the urban core, and expansion tended to occur in a northern, western and eastern direction. Urban growth in Damam (Figure 11e) is influenced by the Arabian Gulf, and so has been in a western direction. These findings are also compatible with other studies, such as Jamali and Rahman [35] and Alqurashi et al. [43]. It is clear that the majority of the urban growth extended the existing urban areas, rather than being detached from them.
4.4. Socio-Economic Relevance and Potential Impact
To the authors’ knowledge, this is the first study aimed at analyzing the spatiotemporal dynamics of urban growth in Saudi Arabia. The results of this study could be the basis for several applications [6,12] that have so far not been pursued due to lack of data. For example, the outcome of this research may play a vital role to reduce the consequences and impacts of urbanization, categorized as: physical (urban sprawl, unbalanced and “leap-frog” developments), social (decline in social interaction, lack of sufficient housing supply, lack of public services, inadequate health, rise in crime, isolation and segregation of some populations), economic (increase in inequity of income distribution, unemployment, poverty), and environmental (loss of agricultural lands, air pollution, urban heat island, decline in water quality, climate change, destruction of the natural landscape and public open spaces). Spatio-temporal urban data are useful and necessary for urban and regional planners and decision-makers in Saudi Arabia to draw plans and policies that support and influence urban growth processes. Furthermore, Saudi Arabia is exposed to several natural hazards such as flash-flooding, dust storms, droughts and earthquakes; urbanized area data can be used to assess the exposure of such hazards at the national level.
5. Conclusions
Timely and accurate information on urban growth across large areas is required for understanding the drivers of that growth and predicting future growth, as well as responding to a range of environmental and socio-economic problems. Remotely sensed satellite sensor data have been demonstrated to be suitable for urbanization studies. A variety of remotely sensed satellite sensor data are available. However, DMSP-OLS SNT lights data have advantages for urbanization studies because: (1) the coarse spatial resolution (1 km) of the DMSP-OLS SNT data allows large-scale coverage and speedy data processing and requires less labor for data analysis and interpretation, (2) urban phenomena are often clearer and more readily identified in night-time lights satellite sensor data compared then with daytime satellite sensor data, and (3) the high-temporal DMSP-OLS data (1992 to 2013) provide a suitable source of time series imagery for monitoring urban dynamics.
This research describes the application of DMSP-OLS SNT data to analyze the spatial growth patterns in Saudi Arabia between 1992 and 2013. In this research, the lack of on-board sensor calibration was corrected by adopting robust stepwise calibration [41], intra-annual composition and inter-annual series correction methods [15]. The hybrid calibration approach greatly improved the continuity and comparability of the DMSP-OLS SNT data. The corrected DMSP-OLS SNT data were assessed using socio-economic variables at the national level for the period from 1992 to 2013 and large correlations were observed, with a mean value of 0.98. The urban pattern across Saudi Arabia is spatially inhomogeneous and, thus, different thresholds, based on demographic information, were used to map urban areas. The extracted urban areas were assessed at the national level using socio-economic variables and at the city level (four representative cities) using Landsat data. Assessment at the national level produced a large correlation, with an average value of 0.98. Accuracy assessment at the city level revealed that most of the urban areas were identified accurately from the DMSP-OLS SNT data compared with those derived from the Landsat data, with an average overall accuracy and Kappa statistic of 86% and 0.71, respectively.
Most Saudi cities continued to experience rapid urbanization growth during the period from 1992 to 2013. The robust, calibrated estimates from this analysis reveal that the urban area increased nearly three-fold from 8184 km2 in 1992 to 24,699 km2 in 2013. The large increase in urban area across Saudi Arabia coincided with a significant increase in the national economy that supported investments in services, transportation and industry. The largest urban areas were located in Makkah, Riyadh and Eastern provinces because of their importance. In contrast, the largest urban growth rates occurred in the remaining provinces coinciding with geographically varying development policies.
DMSP-OLS SNT data can be used by urban and regional planners and policy makers to better quantify urban growth spatially and temporally, understand the current driving forces underpinning the urbanization process, make more reliable predictions of future growth, and help to achieve sustainable urban development through careful planning. Despite the calibration approach taken, which helped to ensure that a range of biases were corrected, some uncertainties remain in the DMSP-OLS SNT data (blooming and saturation effects). Therefore, in future research, land surface temperature as well as ancillary spatial data, such as vegetation, water and bare land layers, should be used to reveal how and where the accuracy of urban area mapping might be increased further. In addition, finer spatial resolution night-time data, such as from the Visible Infrared Imager Radiometer Suite (VIIRS), should be investigated as an alternative validation dataset.
Author Contributions
Conceptualization, M.A.; methodology, M.A. and P.M.A.; validation, M.A.; formal analysis, M.A.; investigation, M.A. and P.A; writing—original draft preparation, M.A.; review and editing P.M.A.; visualization, M.A. and P.M.A.
Funding
This research received no external funding.
Acknowledgments
The authors gratefully acknowledge the support of King Abdulaziz City for Science and Technology (KACST).
Conflicts of Interest
The authors declare no conflict of interest.
References
- Abubakar, I.R.; Aina, Y.A. Achieving sustainable cities in Saudi Arabia: Juggling the competing urbanization challenges. In Population Growth and Rapid Urbanization in the Developing World; Benna, U.G., Garba, S.B., Eds.; IGI Global: Hershey, PA, USA, 2016; pp. 42–63. [Google Scholar]
- UN. World Urbanization Prospects: The 2018 Revision; Department of Economic and Social Affairs, Population Division: New York, NY, USA, 2018. [Google Scholar]
- Alkhedheiri, A.A. The Role of Secondary Cities in the National Development Process of Saudi Arabia, 1st ed.; Riyadh Press: Riyadh, Saudi Arabia, 2002. [Google Scholar]
- Al-Hathloul, S.; Mughal, M.A. Urban growth management-the Saudi experience. Habitat Int. 2004, 28, 609–623. [Google Scholar] [CrossRef]
- MOMRA. National Report: Third United Nations Conferences on Housing and Sustainable Urban Development (HABITAT III); MOMRA: Riyadh, Saudi Arabia, 2016. [Google Scholar]
- Li, X.; Zhou, Y. Urban mapping using DMSP/OLS stable night-time light: A review. Int. J. Remote Sens. 2017, 38, 6030–6046. [Google Scholar] [CrossRef]
- Tan, M. Urban growth and rural transition in China based on DMSP/OLS nighttime light data. Sustainability 2015, 7, 8768–8781. [Google Scholar] [CrossRef]
- Rahman, M. Detection of land use/land cover changes and urban sprawl in Al-Khobar, Saudi Arabia: An analysis of multi-temporal remote sensing data. ISPRS Int. J. Geo-Inf. 2016, 5, 15. [Google Scholar] [CrossRef]
- Li, X.; Zhou, Y.; Zhu, Z.; Liang, L.; Yu, B.; Cao, W. Mapping annual urban dynamics (1985–2015) using time series of Landsat data. Remote Sens. Environ. 2018, 216, 674–683. [Google Scholar] [CrossRef]
- Elvidge, C.D.; Baugh, K.E.; Kihn, E.A.; Kroehl, H.W.; Davis, E.R. Mapping city lights with nighttime data from the DMSP Operational Linescan System. Photogramm. Eng. Remote Sens. 1997, 63, 727–734. [Google Scholar]
- Imhoff, M.L.; Lawrence, W.T.; Stutzer, D.C.; Elvidge, C.D. A technique for using composite DMSP/OLS “city lights” satellite data to map urban area. Remote Sens. Environ. 1997, 61, 361–370. [Google Scholar] [CrossRef]
- Huang, Q.; Yang, X.; Gao, B.; Yang, Y.; Zhao, Y. Application of DMSP/OLS nighttime light images: A meta-analysis and a systematic literature review. Remote Sens. 2014, 6, 6844–6866. [Google Scholar] [CrossRef]
- Small, C.; Pozzi, F.; Elvidge, C.D. Spatial analysis of global urban extent from DMSP-OLS night lights. Remote Sens. Environ. 2005, 96, 277–291. [Google Scholar] [CrossRef]
- Zhang, Q.; Seto, K.C. Mapping urbanization dynamics at regional and global scales using multi-temporal DMSP/OLS nighttime light data. Remote Sens. Environ. 2011, 115, 2320–2329. [Google Scholar] [CrossRef]
- Liu, Z.; He, C.; Zhang, Q.; Huang, Q.; Yang, Y. Extracting the dynamics of urban expansion in China using DMSP-OLS nighttime light data from 1992 to 2008. Landsc. Urban Plan. 2012, 106, 62–72. [Google Scholar] [CrossRef]
- Yi, K.; Tani, H.; Li, Q.; Zhang, J.; Guo, M.; Bao, Y.; Wang, X.; Li, J. Mapping and evaluating the urbanization process in northeast China using DMSP/OLS nighttime light data. Sensors 2014, 14, 3207–3226. [Google Scholar] [CrossRef] [PubMed]
- Xiao, P.; Wang, X.; Feng, X.; Zhang, X.; Yang, Y. Detecting China’s urban expansion over the past three decades using nighttime light data. IEEE J. Sel. Top. Appl. Earth Obs. Remote Sens. 2014, 7, 4095–4106. [Google Scholar] [CrossRef]
- Zhou, Y.; Smith, S.J.; Elvidge, C.D.; Zhao, K.; Thomson, A.; Imhoff, M. A cluster-based method to map urban area from DMSP/OLS nightlights. Remote Sens. Environ. 2014, 147, 173–185. [Google Scholar] [CrossRef]
- Li, Q.; Lu, L.; Weng, Q.; Xie, Y.; Guo, H. Monitoring urban dynamics in the southeast USA using time-series DMSP/OLS nightlight imagery. Remote Sens. 2016, 8, 578. [Google Scholar] [CrossRef]
- Xie, Y.; Weng, Q. Updating urban extents with nighttime light imagery by using an object-based thresholding method. Remote Sens. Environ. 2016, 187, 1–13. [Google Scholar] [CrossRef]
- Fu, H.; Shao, Z.; Fu, P.; Cheng, Q. The dynamic analysis between urban nighttime economy and urbanization using the DMSP/OLS nighttime light data in China from 1992 to 2012. Remote Sens. 2017, 9, 416. [Google Scholar] [CrossRef]
- Xin, X.; Liu, B.; Di, K.; Zhu, Z.; Zhao, Z.; Liu, J.; Yue, Z.; Zhang, G. Monitoring urban expansion using time series of night-time light data: A case study in Wuhan, China. Int. J. Remote Sens. 2017, 38, 6110–6128. [Google Scholar] [CrossRef]
- Zou, Y.; Peng, H.; Liu, G.; Yang, K.; Xie, Y.; Weng, Q. Monitoring urban clusters expansion in the middle reaches of the Yangtze River, China, using time-series nighttime light images. Remote Sens. 2017, 9, 1007. [Google Scholar] [CrossRef]
- Elvidge, C.D.; Hsu, F.-C.; Baugh, K.E.; Ghosh, T. National trends in satellite-observed lighting. In Global Urban Monitoring and Assessment through Earth Observation; Weng, Q., Ed.; Taylor & Francis Group: Boca Raton, FL, USA, 2014; pp. 97–120. [Google Scholar]
- Cao, X.; Chen, J.; Imura, H.; Higashi, O. A SVM-based method to extract urban areas from DMSP-OLS and SPOT VGT data. Remote Sens. Environ. 2009, 113, 2205–2209. [Google Scholar] [CrossRef]
- Jing, W.; Yang, Y.; Yue, X.; Zhao, X. Mapping urban areas with integration of DMSP/OLS nighttime light and MODIS data using machine learning techniques. Remote Sens. 2015, 7, 12419–12439. [Google Scholar] [CrossRef]
- Huang, X.; Schneider, A.; Friedl, M.A. Mapping sub-pixel urban expansion in China using MODIS and DMSP/OLS nighttime lights. Remote Sens. Environ. 2016, 175, 92–108. [Google Scholar] [CrossRef]
- Lu, D.; Tian, H.; Zhou, G.; Ge, H. Regional mapping of human settlements in southeastern China with multisensor remotely sensed data. Remote Sens. Environ. 2008, 112, 3668–3679. [Google Scholar] [CrossRef]
- Sharma, R.C.; Tateishi, R.; Hara, K.; Gharechelou, S.; Iizuka, K. Global mapping of urban built-up areas of year 2014 by combining MODIS multispectral data with VIIRS nighttime light data. Int. J. Digit. Earth 2016, 9, 1004–1020. [Google Scholar] [CrossRef]
- Henderson, M.; Yeh, E.T.; Gong, P.; Elvidge, C.; Baugh, K. Validation of urban boundaries derived from global night-time satellite imagery. Int. J. Remote Sens. 2003, 24, 595–609. [Google Scholar] [CrossRef]
- Sutton, P.C.; Elvidge, C.; Obremski, T. Building and evaluating models to estimate ambient population density. Photogramm. Eng. Remote Sens. 2003, 69, 545–553. [Google Scholar] [CrossRef]
- Sutton, P.C.; Elvidge, C.D.; Ghosh, T. Estimation of gross domestic product at sub-national scales using nighttime satellite imagery. Int. J. Ecol. Econ. Stat. 2007, 8, 5–21. [Google Scholar]
- Zhou, Y.; Smith, S.J.; Zhao, K.; Imhoff, M.; Thomson, A.; Bond-Lamberty, B.; Asrar, G.R.; Zhang, X.; He, C.; Elvidge, C.D. A global map of urban extent from nightlights. Environ. Res. Lett. 2015, 10, 054011. [Google Scholar] [CrossRef]
- Aina, Y.A.; Merwe, J.; Alshuwaikhat, H.M. Urban spatial growth and land use change in Riyadh: Comparing spectral angle mapping and band ratioing techniques. In Proceedings of the Academic Track of the 2008 Free and Open Source Software for Geospatial (FOSS4G) Conference, Incorporating the GISSA 2008 Conference, Cape Town, South Africa, 29 September–4 October 2008; pp. 51–57. [Google Scholar]
- Jamali, N.A.; Rahman, M.T. Utilization of remote sensing and GIS to examine urban growth in the city of Riyadh, Saudi Arabia. Cities 2016, 10, 11. [Google Scholar] [CrossRef]
- Alqurashi, A.F.; Kumar, L. Land use and land cover change detection in the Saudi Arabian desert cities of Makkah and Al-Taif using satellite data. Adv. Remote Sens. 2014, 3, 106–119. [Google Scholar] [CrossRef]
- Aljoufie, M.; Zuidgeest, M.; Brussel, M.; van Maarseveen, M. Spatial–temporal analysis of urban growth and transportation in Jeddah City, Saudi Arabia. Cities 2013, 31, 57–68. [Google Scholar] [CrossRef]
- STATS. The Total Population. Available online: https://www.stats.gov.sa/ (accessed on 4 June 2019).
- Elvidge, C.; Ziskin, D.; Baugh, K.; Tuttle, B.; Ghosh, T.; Pack, D.; Erwin, E.; Zhizhin, M. A fifteen year record of global natural gas flaring derived from satellite data. Energies 2009, 2, 595–622. [Google Scholar] [CrossRef]
- STATS. Statistical Yearbook; Central Department of Statistics & Information: Riyadh, Saudi Arabia, 1992–2013.
- Li, X.; Zhou, Y. A stepwise calibration of global DMSP/OLS stable nighttime light data (1992–2013). Remote Sens. 2017, 9, 637. [Google Scholar]
- Zhang, Q.; Pandey, B.; Seto, K.C. A robust method to generate a consistent time series from DMSP/OLS nighttime light data. IEEE Trans. Geosci. Remote Sens. 2016, 54, 5821–5831. [Google Scholar] [CrossRef]
- Alqurashi, A.; Kumar, L.; Sinha, P. Urban land cover change modelling using time-series satellite images: A case study of urban growth in five cities of Saudi Arabia. Remote Sens. 2016, 8, 838. [Google Scholar] [CrossRef]
- Liu, L.; Leung, Y. A study of urban expansion of prefectural-level cities in South China using night-time light images. Int. J. Remote Sens. 2015, 36, 5557–5575. [Google Scholar] [CrossRef]
- Aljabri, N.; Alhazmi, R. Observing and monitoring the urban expansion of Makkah Al-Mukarramah using the remote sensing and GIS. J. Eng. Sci. Inf. Technol. 2017, 1, 103–125. [Google Scholar]
© 2019 by the authors. Licensee MDPI, Basel, Switzerland. This article is an open access article distributed under the terms and conditions of the Creative Commons Attribution (CC BY) license (http://creativecommons.org/licenses/by/4.0/).