Next Issue
Volume 10, September
Previous Issue
Volume 10, July
 
 
remotesensing-logo

Journal Browser

Journal Browser

Remote Sens., Volume 10, Issue 8 (August 2018) – 156 articles

Cover Story (view full-size image): 
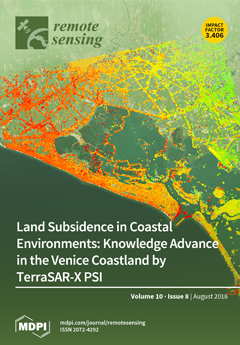
The quantification of land subsidence in transitional environments, including lagoons, deltas, estuaries, farmlands, and urban centers, is particularly challenging. The Venice coastland is among the most sensitive sites to land subsidence worldwide. Only a few millimeters of loss of elevation drastically raise the deterioration of this extraordinary environment and the concern for the historical heritage. Over the last decade, TerraSAR-X interferometry has been effectively used in Venice, leading to significant advancements in understanding the main drivers of land subsidence. The high resolution and regular acquisition of TerraSAR-X images has allowed accurate measurements to be obtained at the regional and local scale, on natural and artificial radar reflectors, splitting natural and anthropogenic processes. The important heterogeneity of the ground movements has been highlighted. View Paper here.
  • Issues are regarded as officially published after their release is announced to the table of contents alert mailing list.
  • You may sign up for e-mail alerts to receive table of contents of newly released issues.
  • PDF is the official format for papers published in both, html and pdf forms. To view the papers in pdf format, click on the "PDF Full-text" link, and use the free Adobe Reader to open them.
Order results
Result details
Section
Select all
Export citation of selected articles as:
22 pages, 11159 KiB  
Article
Window Detection from UAS-Derived Photogrammetric Point Cloud Employing Density-Based Filtering and Perceptual Organization
by Shirin Malihi, Mohammad Javad Valadan Zoej, Michael Hahn and Mehdi Mokhtarzade
Remote Sens. 2018, 10(8), 1320; https://doi.org/10.3390/rs10081320 - 20 Aug 2018
Cited by 16 | Viewed by 4860
Abstract
Point clouds with ever-increasing volume are regular data in 3D city modelling, in which building reconstruction is a significant part. The photogrammetric point cloud, generated from UAS (Unmanned Aerial System) imagery, is a novel type of data in building reconstruction. Its positive characteristics, [...] Read more.
Point clouds with ever-increasing volume are regular data in 3D city modelling, in which building reconstruction is a significant part. The photogrammetric point cloud, generated from UAS (Unmanned Aerial System) imagery, is a novel type of data in building reconstruction. Its positive characteristics, alongside its challenging qualities, provoke discussions on this theme of research. In this paper, patch-wise detection of the points of window frames on facades and roofs are undertaken using this kind of data. A density-based multi-scale filter is devised in the feature space of normal vectors to globally handle the matter of high volume of data and to detect edges. Color information is employed for the downsized data to remove the inner clutter of the building. Perceptual organization directs the approach via grouping and the Gestalt principles, to segment the filtered point cloud and to later detect window patches. The evaluation of the approach displays a completeness of 95% and 92%, respectively, as well as a correctness of 95% and 96%, respectively, for the detection of rectangular and partially curved window frames in two big heterogeneous cluttered datasets. Moreover, most intrusions and protrusions cannot mislead the window detection approach. Several doors with glass parts and a number of parallel parts of the scaffolding are mistaken as windows when using the large-scale object detection approach due to their similar patterns with window frames. Sensitivity analysis of the input parameters demonstrates that the filter functionality depends on the radius of density calculation in the feature space. Furthermore, successfully employing the Gestalt principles in the detection of window frames is influenced by the width determination of window partitioning. Full article
(This article belongs to the Special Issue Remote Sensing from Unmanned Aerial Vehicles (UAVs))
Show Figures

Graphical abstract

24 pages, 6510 KiB  
Article
Object-Based Image Analysis for Sago Palm Classification: The Most Important Features from High-Resolution Satellite Imagery
by Sarip Hidayat, Masayuki MATSUOKA, Sumbangan Baja and Dorothea Agnes Rampisela
Remote Sens. 2018, 10(8), 1319; https://doi.org/10.3390/rs10081319 - 20 Aug 2018
Cited by 15 | Viewed by 7831
Abstract
Sago palm (Metroxylon sagu) is a palm tree species originating in Indonesia. In the future, this starch-producing tree will play an important role in food security and biodiversity. Local governments have begun to emphasize the sustainable development of sago palm plantations; therefore, they [...] Read more.
Sago palm (Metroxylon sagu) is a palm tree species originating in Indonesia. In the future, this starch-producing tree will play an important role in food security and biodiversity. Local governments have begun to emphasize the sustainable development of sago palm plantations; therefore, they require near-real-time geospatial information on palm stands. We developed a semi-automated classification scheme for mapping sago palm using machine learning within an object-based image analysis framework with Pleiades-1A imagery. In addition to spectral information, arithmetic, geometric, and textural features were employed to enhance the classification accuracy. Recursive feature elimination was applied to samples to rank the importance of 26 input features. A support vector machine (SVM) was used to perform classifications and resulted in the highest overall accuracy of 85.00% after inclusion of the eight most important features, including three spectral features, three arithmetic features, and two textural features. The SVM classifier showed normal fitting up to the eighth most important feature. According to the McNemar test results, using the top seven to 14 features provided a better classification accuracy. The significance of this research is the revelation of the most important features in recognizing sago palm among other similar tree species. Full article
(This article belongs to the Section Remote Sensing in Agriculture and Vegetation)
Show Figures

Figure 1

21 pages, 14886 KiB  
Article
Coherence Difference Analysis of Sentinel-1 SAR Interferogram to Identify Earthquake-Induced Disasters in Urban Areas
by Chih-Heng Lu, Chuen-Fa Ni, Chung-Pai Chang, Jiun-Yee Yen and Ray Y. Chuang
Remote Sens. 2018, 10(8), 1318; https://doi.org/10.3390/rs10081318 - 20 Aug 2018
Cited by 40 | Viewed by 8760
Abstract
This study proposes a workflow that enables the accurate identification of earthquake-induced damage zones by using coherence image pairs of the Sentinel-1 satellite before and after an earthquake event. The workflow uses interferometric synthetic aperture radar (InSAR) processing to account for coherence variations [...] Read more.
This study proposes a workflow that enables the accurate identification of earthquake-induced damage zones by using coherence image pairs of the Sentinel-1 satellite before and after an earthquake event. The workflow uses interferometric synthetic aperture radar (InSAR) processing to account for coherence variations between coseismic and preseismic image pairs. The coherence difference between two image pairs is useful information to detect specific disasters in a regional-scale area after an earthquake event. To remove background effects such as the atmospheric effect and ordinal surface changes, this study employs the two-step threshold method to develop the coseismic coherence difference (CCD) map for our analyses. Thirty-four Sentinel-1 images between January 2015 and February 2016 were collected to process 30 preseismic image pairs and two coseismic image pairs for assessing multiple types of disasters in Tainan City of southwestern Taiwan, where severe damages were observed after the Meinong earthquake event. The coseismic unwrapping phases were further calculated to estimate the surface displacement in east-west and vertical directions. Results in the CCD map agree well with the observations from post-earthquake field surveys. The workflow can accurately identify earthquake-induced land subsidence and surface displacements, even for areas with insufficient geological data or for areas that had been excluded from the liquefaction potential map. In addition, the CCD details the distribution of building damages and structure failures, which might be useful information for emergency actions applied to regional-scale problems. The conversion of 2D surface displacement reveals the complex behavior of geological activities during the earthquake. In the foothill area of Tainan City, the opposite surface displacements in local areas might be influenced by the axis activities of the Kuanmiao syncline. Full article
(This article belongs to the Special Issue Applications of Sentinel Satellite for Geohazards Prevention)
Show Figures

Figure 1

14 pages, 5212 KiB  
Article
Using Multi-Angle Imaging SpectroRadiometer Aerosol Mixture Properties for Air Quality Assessment in Mongolia
by Meredith Franklin, Khang Chau, Olga V. Kalashnikova, Michael J. Garay, Temuulen Enebish and Meytar Sorek-Hamer
Remote Sens. 2018, 10(8), 1317; https://doi.org/10.3390/rs10081317 - 20 Aug 2018
Cited by 17 | Viewed by 5413
Abstract
Ulaanbaatar (UB), the capital city of Mongolia, has extremely poor wintertime air quality with fine particulate matter concentrations frequently exceeding 500 μg/m3, over 20 times the daily maximum guideline set by the World Health Organization. Intensive use of sulfur-rich coal for [...] Read more.
Ulaanbaatar (UB), the capital city of Mongolia, has extremely poor wintertime air quality with fine particulate matter concentrations frequently exceeding 500 μg/m3, over 20 times the daily maximum guideline set by the World Health Organization. Intensive use of sulfur-rich coal for heating and cooking coupled with an atmospheric inversion amplified by the mid-continental Siberian anticyclone drive these high levels of air pollution. Ground-based air quality monitoring in Mongolia is sparse, making use of satellite observations of aerosol optical depth (AOD) instrumental for characterizing air pollution in the region. We harnessed data from the Multi-angle Imaging SpectroRadiometer (MISR) Version 23 (V23) aerosol product, which provides total column AOD and component-particle optical properties for 74 different aerosol mixtures at 4.4 km spatial resolution globally. To test the performance of the V23 product over Mongolia, we compared values of MISR AOD with spatially and temporally matched AOD from the Dalanzadgad AERONET site and find good agreement (correlation r = 0.845, and root-mean-square deviation RMSD = 0.071). Over UB, exploratory principal component analysis indicates that the 74 MISR AOD mixture profiles consisted primarily of small, spherical, non-absorbing aerosols in the wintertime, and contributions from medium and large dust particles in the summertime. Comparing several machine learning methods for relating the 74 MISR mixtures to ground-level pollutants, including particulate matter with aerodynamic diameters smaller than 2.5 μm ( PM 2.5 ) and 10 μm ( PM 10 ), as well as sulfur dioxide ( SO 2 ), a proxy for sulfate particles, we find that Support Vector Machine regression consistently has the highest predictive performance with median test R 2 for PM 2.5 , PM 10 , and SO 2 equal to 0.461, 0.063, and 0.508, respectively. These results indicate that the high-dimensional MISR AOD mixture set can provide reliable predictions of air pollution and can distinguish dominant particle types in the UB region. Full article
(This article belongs to the Special Issue MISR)
Show Figures

Graphical abstract

21 pages, 7265 KiB  
Article
Evaluation of Five Satellite-Based Precipitation Products in Two Gauge-Scarce Basins on the Tibetan Plateau
by Peng Bai and Xiaomang Liu
Remote Sens. 2018, 10(8), 1316; https://doi.org/10.3390/rs10081316 - 20 Aug 2018
Cited by 76 | Viewed by 5661
Abstract
The sparse rain gauge networks over the Tibetan Plateau (TP) cause challenges for hydrological studies and applications. Satellite-based precipitation datasets have the potential to overcome the issues of data scarcity caused by sparse rain gauges. However, large uncertainties usually exist in these precipitation [...] Read more.
The sparse rain gauge networks over the Tibetan Plateau (TP) cause challenges for hydrological studies and applications. Satellite-based precipitation datasets have the potential to overcome the issues of data scarcity caused by sparse rain gauges. However, large uncertainties usually exist in these precipitation datasets, particularly in complex orographic areas, such as the TP. The accuracy of these precipitation products needs to be evaluated before being practically applied. In this study, five (quasi-)global satellite precipitation products were evaluated in two gauge-sparse river basins on the TP during the period 1998–2012; the evaluated products are CHIRPS, CMORPH, PERSIANN-CDR, TMPA 3B42, and MSWEP. The five precipitation products were first intercompared with each other to identify their consistency in depicting the spatial–temporal distribution of precipitation. Then, the accuracy of these products was validated against precipitation observations from 21 rain gauges using a point-to-pixel method. We also investigated the streamflow simulation capacity of these products via a distributed hydrological model. The results indicated that these precipitation products have similar spatial patterns but significantly different precipitation estimates. A point-to-pixel validation indicated that all products cannot efficiently reproduce the daily precipitation observations, with the median Kling–Gupta efficiency (KGE) in the range of 0.10–0.26. Among the five products, MSWEP has the best consistency with the gauge observations (with a median KGE = 0.26), which is thus recommended as the preferred choice for applications among the five satellite precipitation products. However, as model forcing data, all the precipitation products showed a comparable capacity of streamflow simulations and were all able to accurately reproduce the observed streamflow records. The values of the KGE obtained from these precipitation products exceed 0.83 in the upper Yangtze River (UYA) basin and 0.84 in the upper Yellow River (UYE) basin. Thus, evaluation of precipitation products only focusing on the accuracy of streamflow simulations is less meaningful, which will mask the differences between these products. A further attribution analysis indicated that the influences of the different precipitation inputs on the streamflow simulations were largely offset by the parameter calibration, leading to significantly different evaporation and water storage estimates. Therefore, an efficient hydrological evaluation for precipitation products should focus on both streamflow simulations and the simulations of other hydrological variables, such as evaporation and soil moisture. Full article
(This article belongs to the Section Remote Sensing in Geology, Geomorphology and Hydrology)
Show Figures

Graphical abstract

17 pages, 7449 KiB  
Article
Difference and Potential of the Upward and Downward Sun-Induced Chlorophyll Fluorescence on Detecting Leaf Nitrogen Concentration in Wheat
by Min Jia, Jie Zhu, Chunchen Ma, Luis Alonso, Dong Li, Tao Cheng, Yongchao Tian, Yan Zhu, Xia Yao and Weixing Cao
Remote Sens. 2018, 10(8), 1315; https://doi.org/10.3390/rs10081315 - 20 Aug 2018
Cited by 17 | Viewed by 5057
Abstract
Precise detection of leaf nitrogen concentration (LNC) is helpful for nutrient diagnosis and fertilization guidance in farm crops. Numerous researchers have estimated LNC with techniques based on reflectance spectra or active chlorophyll fluorescence, which have limitations of low accuracy or small scale in [...] Read more.
Precise detection of leaf nitrogen concentration (LNC) is helpful for nutrient diagnosis and fertilization guidance in farm crops. Numerous researchers have estimated LNC with techniques based on reflectance spectra or active chlorophyll fluorescence, which have limitations of low accuracy or small scale in the field. Given the correlation between chlorophyll and nitrogen contents, the response of sun-induced chlorophyll fluorescence (SIF) to chlorophyll (Chl) content reported in a few papers suggests the feasibility of quantifying LNC using SIF. Few studies have investigated the difference and power of the upward and downward SIF components on monitoring LNC in winter wheat. We conducted two field experiments to evaluate the capacity of SIF to monitor the LNC of winter wheat during the entire growth season and compare the differences of the upward and downward SIF for LNC detection. A FluoWat leaf clip coupled with a ASD spectrometer was used to measure the upward and downward SIF under sunlight. It was found that three (↓FY687, ↑FY687/↑FY739, and ↓FY687/↓FY739) out of the six SIF yield (FY) indices examined were significantly correlated to the LNC (R2 = 0.6, 0.51, 0.75, respectively). The downward SIF yield indices exhibited better performance than the upward FY indices in monitoring the LNC with the ↓FY687/↓FY739 being the best FY index. Moreover, the LNC models based on the three SIF yield indices are insensitive to the chlorophyll content and the leaf mass per area (LMA). These findings suggest the downward SIF should not be neglected for monitoring crop LNC at the leaf scale, although it is more difficult to measure with current instruments. The downward SIF could play an increasingly important role in understanding of the SIF emission for LNC detection at different scales. These results could provide a solid foundation for elucidating the mechanism of SIF for LNC estimation at the canopy scale. Full article
(This article belongs to the Special Issue Remote Sensing for Precision Nitrogen Management)
Show Figures

Graphical abstract

19 pages, 9744 KiB  
Article
Use of SMOS L3 Soil Moisture Data: Validation and Drought Assessment for Pernambuco State, Northeast Brazil
by Alzira G. S. S. Souza, Alfredo Ribeiro Neto, Luciana Rossato, Regina C. S. Alvalá and Laio L. Souza
Remote Sens. 2018, 10(8), 1314; https://doi.org/10.3390/rs10081314 - 20 Aug 2018
Cited by 24 | Viewed by 7409
Abstract
The goal of this study was to validate soil moisture data from Soil Moisture Ocean Salinity (SMOS) using two in situ databases for Pernambuco State, located in Northeast Brazil. The validation process involved two approaches, pixel-station comparison and areal average, for three regions [...] Read more.
The goal of this study was to validate soil moisture data from Soil Moisture Ocean Salinity (SMOS) using two in situ databases for Pernambuco State, located in Northeast Brazil. The validation process involved two approaches, pixel-station comparison and areal average, for three regions in Pernambuco with different climatic characteristics. After validation, the SMOS data were used for drought assessment by calculating soil moisture anomalies for the available period of data. Four statistical criteria were used to verify the quality of the satellite data: Pearson correlation coefficient, Willmott index of agreement, BIAS, and root mean squared difference (RMSD). The average RMSD calculated from the daily time series in the pixel and the areal assessment were 0.071 m3m−3 and 0.04 m3m−3, respectively. Those values are near to the expected 0.04 m3m−3 accuracy of the SMOS mission. The analysis of soil moisture anomalies enabled the assessment of the dry period between 2012 and 2017 and the identification of regions most impacted by the drought. The driest year for all regions was 2012, when the anomaly values achieved −50% in some regions. The use of SMOS data provided additional information that was used in conjunction with the precipitation data to assess drought periods. This may be particularly relevant for planning in agriculture and supporting decision makers and farmers. Full article
(This article belongs to the Special Issue Soil Moisture Remote Sensing Across Scales)
Show Figures

Graphical abstract

23 pages, 12328 KiB  
Article
A Variational Model for Sea Image Enhancement
by Mingzhu Song, Hongsong Qu, Guixiang Zhang, Shuping Tao and Guang Jin
Remote Sens. 2018, 10(8), 1313; https://doi.org/10.3390/rs10081313 - 20 Aug 2018
Cited by 10 | Viewed by 3499
Abstract
The purpose of sea image enhancement is to enhance the information of the waves, whose contrast is generally weak. Enhancement effect is often affected by impulse-type noise and non-uniform illumination. In this paper, we propose a variational model for sea image enhancement using [...] Read more.
The purpose of sea image enhancement is to enhance the information of the waves, whose contrast is generally weak. Enhancement effect is often affected by impulse-type noise and non-uniform illumination. In this paper, we propose a variational model for sea image enhancement using a solar halo model and a Retinex model. This paper mainly makes the following three contributions: 1. Establishing a Retinex model with noise suppression ability in sea images; 2. Establishing a solar-scattering halo model through sea image bitplane analysis; 3. Proposing a variational enhancement model combining the Retinex and halo models. The experimental results show that our method has a significant enhancement effect on sea surface images in different illumination environments compared with typical methods. Full article
(This article belongs to the Special Issue Data Restoration and Denoising of Remote Sensing Data)
Show Figures

Graphical abstract

15 pages, 10053 KiB  
Article
Regional Patterns and Asynchronous Onset of Ice-Wedge Degradation since the Mid-20th Century in Arctic Alaska
by Gerald V. Frost, Tracy Christopherson, M. Torre Jorgenson, Anna K. Liljedahl, Matthew J. Macander, Donald A. Walker and Aaron F. Wells
Remote Sens. 2018, 10(8), 1312; https://doi.org/10.3390/rs10081312 - 20 Aug 2018
Cited by 27 | Viewed by 5963
Abstract
Ice-wedge polygons are widespread and conspicuous surficial expressions of ground-ice in permafrost landscapes. Thawing of ice wedges triggers differential ground subsidence, local ponding, and persistent changes to vegetation and hydrologic connectivity across the landscape. Here we characterize spatio-temporal patterns of ice-wedge degradation since [...] Read more.
Ice-wedge polygons are widespread and conspicuous surficial expressions of ground-ice in permafrost landscapes. Thawing of ice wedges triggers differential ground subsidence, local ponding, and persistent changes to vegetation and hydrologic connectivity across the landscape. Here we characterize spatio-temporal patterns of ice-wedge degradation since circa 1950 across environmental gradients on Alaska’s North Slope. We used a spectral thresholding approach validated by field observations to map flooded thaw pits in high-resolution images from circa 1950, 1982, and 2012 for 11 study areas (1577–4460 ha). The total area of flooded pits increased since 1950 at 8 of 11 study areas (median change +3.6 ha; 130.3%). There were strong regional differences in the timing and extent of degradation; flooded pits were already extensive by 1950 on the Chukchi coastal plain (alluvial-marine deposits) and subsequent changes there indicate pit stabilization. Degradation began more recently on the central Beaufort coastal plain (eolian sand) and Arctic foothills (yedoma). Our results indicate that ice-wedge degradation in northern Alaska cannot be explained by late-20th century warmth alone. Likely mechanisms for asynchronous onset include landscape-scale differences in surficial materials and ground-ice content, regional climate gradients from west (maritime) to east (continental), and regional differences in the timing and magnitude of extreme warm summers after the Little Ice Age. Full article
(This article belongs to the Special Issue Remote Sensing of Dynamic Permafrost Regions)
Show Figures

Graphical abstract

10 pages, 2584 KiB  
Article
The Causative Fault of the 2016 Mwp 6.1 Petermann Ranges Intraplate Earthquake (Central Australia) Retrieved by C- and L-Band InSAR Data
by Marco Polcari, Matteo Albano, Simone Atzori, Christian Bignami and Salvatore Stramondo
Remote Sens. 2018, 10(8), 1311; https://doi.org/10.3390/rs10081311 - 20 Aug 2018
Cited by 20 | Viewed by 5264
Abstract
On 21 May 2016, an Mwp 6.1 earthquake occurred along the Petermann Ranges in Central Australia. Such a seismic event can be classified as a rare intraplate earthquake because the affected area presents low seismicity, being at the center of the Indo-Australian [...] Read more.
On 21 May 2016, an Mwp 6.1 earthquake occurred along the Petermann Ranges in Central Australia. Such a seismic event can be classified as a rare intraplate earthquake because the affected area presents low seismicity, being at the center of the Indo-Australian plate. Also, the architecture and kinematics of shear zones in the Petermann Orogen are largely unknown. We used Sentinel-1 C-band descending data and ALOS-2 L-band ascending data to constrain the causative fault. Our analysis revealed that the earthquake nucleated along an unmapped secondary back-thrust of the main feature of the area, namely the Woodroffe thrust. Full article
Show Figures

Graphical abstract

18 pages, 11588 KiB  
Article
Using Dual-Polarization Interferograms to Correct Atmospheric Effects for InSAR Topographic Mapping
by Zhiwei Liu, Haiqiang Fu, Jianjun Zhu, Cui Zhou and Tingying Zuo
Remote Sens. 2018, 10(8), 1310; https://doi.org/10.3390/rs10081310 - 20 Aug 2018
Cited by 5 | Viewed by 4028
Abstract
Atmospheric effect represents one of the major error sources for interferometric synthetic aperture radar (InSAR), particularly for the repeat-pass InSAR data. In order to further improve the practicability of InSAR technology, it is essential to study how to estimate and eliminate the undesired [...] Read more.
Atmospheric effect represents one of the major error sources for interferometric synthetic aperture radar (InSAR), particularly for the repeat-pass InSAR data. In order to further improve the practicability of InSAR technology, it is essential to study how to estimate and eliminate the undesired impact of atmospheric effects. In this paper, we propose the multi-resolution weighted correlation analysis (MRWCA) method between the dual-polarization InSAR data to estimate and correct atmospheric effects for InSAR topographic mapping. The study is based on the a priori knowledge that atmospheric effects is independent of the polarization. To find the identical atmospheric phase (ATP) signals of interferograms in different polarizations, we need to remove the other same or similar phase components. Using two different topographic data, differential interferometry was firstly performed so that the obtained differential interferograms (D-Infs) have different topographic error phases. A polynomial fitting method is then used to remove the orbit error phases. Thus, the ATP signals are the only identical components in the final obtained D-Infs. By using a forward wavelet transform, we break down the obtained D-Infs into building blocks based on their frequency properties. We then applied weighted correlation analysis to estimate the wavelet coefficients attributed to the atmospheric effects. Thus, the ATP signals can be obtained by the refined wavelet coefficients during inverse wavelet transform (IWT). Lastly, we tested the proposed method by the L-band Advanced Land Observing Satellite (ALOS)-1 PALSAR dual-polarization SAR data pairs covering the San Francisco (USA) and Moron (Mongolia) regions. By using Ice, Cloud, and land Elevation Satellite (ICESat) data as the reference data, we evaluated the vertical accuracy of the InSAR digital elevation models (DEMs) with and without atmospheric effects correction, which shows that, for the San Francisco test site, the corrected interferogram could provide a DEM with a root-mean-square error (RMSE) of 7.79 m, which is an improvement of 40.5% with respect to the DEM without atmospheric effects correction. For the Moron test site, the corrected interferogram could provide a DEM with an RMSE of 10.74 m, which is an improvement of 30.2% with respect to the DEM without atmospheric effects correction. Full article
(This article belongs to the Special Issue Radar Interferometry for Geohazards)
Show Figures

Graphical abstract

11 pages, 313 KiB  
Article
Radiative Transfer Modeling of Phytoplankton Fluorescence Quenching Processes
by Peng-Wang Zhai, Emmanuel Boss, Bryan Franz, P. Jeremy Werdell and Yongxiang Hu
Remote Sens. 2018, 10(8), 1309; https://doi.org/10.3390/rs10081309 - 20 Aug 2018
Cited by 13 | Viewed by 4098
Abstract
We report the first radiative transfer model that is able to simulate phytoplankton fluorescence with both photochemical and non-photochemical quenching included. The fluorescence source term in the inelastic radiative transfer equation is proportional to both the quantum yield and scalar irradiance at excitation [...] Read more.
We report the first radiative transfer model that is able to simulate phytoplankton fluorescence with both photochemical and non-photochemical quenching included. The fluorescence source term in the inelastic radiative transfer equation is proportional to both the quantum yield and scalar irradiance at excitation wavelengths. The photochemical and nonphotochemical quenching processes change the quantum yield based on the photosynthetic active radiation. A sensitivity study was performed to demonstrate the dependence of the fluorescence signal on chlorophyll a concentration, aerosol optical depths and solar zenith angles. This work enables us to better model the phytoplankton fluorescence, which can be used in the design of new space-based sensors that can provide sufficient sensitivity to detect the phytoplankton fluorescence signal. It could also lead to more accurate remote sensing algorithms for the study of phytoplankton physiology. Full article
Show Figures

Graphical abstract

18 pages, 9031 KiB  
Article
Multispectral Pansharpening with Radiative Transfer-Based Detail-Injection Modeling for Preserving Changes in Vegetation Cover
by Andrea Garzelli, Bruno Aiazzi, Luciano Alparone, Simone Lolli and Gemine Vivone
Remote Sens. 2018, 10(8), 1308; https://doi.org/10.3390/rs10081308 - 19 Aug 2018
Cited by 42 | Viewed by 3941
Abstract
Whenever vegetated areas are monitored over time, phenological changes in land cover should be decoupled from changes in acquisition conditions, like atmospheric components, Sun and satellite heights and imaging instrument. This especially holds when the multispectral (MS) bands are sharpened for spatial resolution [...] Read more.
Whenever vegetated areas are monitored over time, phenological changes in land cover should be decoupled from changes in acquisition conditions, like atmospheric components, Sun and satellite heights and imaging instrument. This especially holds when the multispectral (MS) bands are sharpened for spatial resolution enhancement by means of a panchromatic (Pan) image of higher resolution, a process referred to as pansharpening. In this paper, we provide evidence that pansharpening of visible/near-infrared (VNIR) bands takes advantage of a correction of the path radiance term introduced by the atmosphere, during the fusion process. This holds whenever the fusion mechanism emulates the radiative transfer model ruling the acquisition of the Earth’s surface from space, that is for methods exploiting a multiplicative, or contrast-based, injection model of spatial details extracted from the panchromatic (Pan) image into the interpolated multispectral (MS) bands. The path radiance should be estimated and subtracted from each band before the product by Pan is accomplished. Both empirical and model-based estimation techniques of MS path radiances are compared within the framework of optimized algorithms. Simulations carried out on two GeoEye-1 observations of the same agricultural landscape on different dates highlight that the de-hazing of MS before fusion is beneficial to an accurate detection of seasonal changes in the scene, as measured by the normalized differential vegetation index (NDVI). Full article
(This article belongs to the Section Forest Remote Sensing)
Show Figures

Graphical abstract

21 pages, 17446 KiB  
Article
A Generalized Zero-Shot Learning Framework for PolSAR Land Cover Classification
by Rong Gui, Xin Xu, Lei Wang, Rui Yang and Fangling Pu
Remote Sens. 2018, 10(8), 1307; https://doi.org/10.3390/rs10081307 - 19 Aug 2018
Cited by 12 | Viewed by 4492
Abstract
Most supervised classification methods for polarimetric synthetic aperture radar (PolSAR) data rely on abundant labeled samples, and cannot tackle the problem that categorizes or infers unseen land cover classes without training samples. Aiming to categorize instances from both seen and unseen classes simultaneously, [...] Read more.
Most supervised classification methods for polarimetric synthetic aperture radar (PolSAR) data rely on abundant labeled samples, and cannot tackle the problem that categorizes or infers unseen land cover classes without training samples. Aiming to categorize instances from both seen and unseen classes simultaneously, a generalized zero-shot learning (GZSL)-based PolSAR land cover classification framework is proposed. The semantic attributes are first collected to describe characteristics of typical land cover types in PolSAR images, and semantic relevance between attributes is established to relate unseen and seen classes. Via latent embedding, the projection between mid-level polarimetric features and semantic attributes for each land cover class can be obtained during the training stage. The GZSL model for PolSAR data is constructed by mid-level polarimetric features, the projection relationship, and the semantic relevance. Finally, the labels of the test instances can be predicted, even for some unseen classes. Experiments on three real RadarSAT-2 PolSAR datasets show that the proposed framework can classify both seen and unseen land cover classes with limited kinds of training classes, which reduces the requirement for labeled samples. The classification accuracy of the unseen land cover class reaches about 73% if semantic relevance exists during the training stage. Full article
Show Figures

Graphical abstract

12 pages, 1787 KiB  
Article
Fundamental Climate Data Records of Microwave Brightness Temperatures
by Wesley Berg, Rachael Kroodsma, Christian D. Kummerow and Darren S. McKague
Remote Sens. 2018, 10(8), 1306; https://doi.org/10.3390/rs10081306 - 19 Aug 2018
Cited by 28 | Viewed by 4687
Abstract
An intercalibrated Fundamental Climate Data Record (FCDR) of brightness temperatures (Tb) has been developed using data from a total of 14 research and operational conical-scanning microwave imagers. This dataset provides a consistent 30+ year data record of global observations that is well suited [...] Read more.
An intercalibrated Fundamental Climate Data Record (FCDR) of brightness temperatures (Tb) has been developed using data from a total of 14 research and operational conical-scanning microwave imagers. This dataset provides a consistent 30+ year data record of global observations that is well suited for retrieving estimates of precipitation, total precipitable water, cloud liquid water, ocean surface wind speed, sea ice extent and concentration, snow cover, soil moisture, and land surface emissivity. An initial FCDR was developed for a series of ten Special Sensor Microwave/Imager (SSM/I) and Special Sensor Microwave Imager Sounder (SSMIS) instruments on board the Defense Meteorological Satellite Program spacecraft. An updated version of this dataset, including additional NASA and Japanese sensors, has been developed as part of the Global Precipitation Measurement (GPM) mission. The FCDR development efforts involved quality control of the original data, geolocation corrections, calibration corrections to account for cross-track and time-dependent calibration errors, and intercalibration to ensure consistency with the calibration reference. Both the initial SSMI(S) and subsequent GPM Level 1C FCDR datasets are documented, updated in near real-time, and publicly distributed. Full article
(This article belongs to the Special Issue Remote Sensing of Essential Climate Variables and Their Applications)
Show Figures

Graphical abstract

31 pages, 15722 KiB  
Article
Landscape Change Detected over a Half Century in the Arctic National Wildlife Refuge Using High-Resolution Aerial Imagery
by Janet C. Jorgenson, M. Torre Jorgenson, Megan L. Boldenow and Kathleen M. Orndahl
Remote Sens. 2018, 10(8), 1305; https://doi.org/10.3390/rs10081305 - 18 Aug 2018
Cited by 18 | Viewed by 5157
Abstract
Rapid warming has occurred over the past 50 years in Arctic Alaska, where temperature strongly affects ecological patterns and processes. To document landscape change over a half century in the Arctic National Wildlife Refuge, Alaska, we visually interpreted geomorphic and vegetation changes on [...] Read more.
Rapid warming has occurred over the past 50 years in Arctic Alaska, where temperature strongly affects ecological patterns and processes. To document landscape change over a half century in the Arctic National Wildlife Refuge, Alaska, we visually interpreted geomorphic and vegetation changes on time series of coregistered high-resolution imagery. We used aerial photographs for two time periods, 1947–1955 and 1978–1988, and Quick Bird and IKONOS satellite images for a third period, 2000–2007. The stratified random sample had five sites in each of seven ecoregions, with a systematic grid of 100 points per site. At each point in each time period, we recorded vegetation type, microtopography, and surface water. Change types were then assigned based on differences detected between the images. Overall, 23% of the points underwent some type of change over the ~50-year study period. Weighted by area of each ecoregion, we estimated that 18% of the Refuge had changed. The most common changes were wildfire and postfire succession, shrub and tree increase in the absence of fire, river erosion and deposition, and ice-wedge degradation. Ice-wedge degradation occurred mainly in the Tundra Biome, shrub increase and river changes in the Mountain Biome, and fire and postfire succession in the Boreal Biome. Changes in the Tundra Biome tended to be related to landscape wetting, mainly from increased wet troughs caused by ice-wedge degradation. The Boreal Biome tended to have changes associated with landscape drying, including recent wildfire, lake area decrease, and land surface drying. The second time interval, after ~1982, coincided with accelerated climate warming and had slightly greater rates of change. Full article
(This article belongs to the Special Issue Remote Sensing of Dynamic Permafrost Regions)
Show Figures

Graphical abstract

25 pages, 8428 KiB  
Article
Multi-Sensor InSAR Analysis of Progressive Land Subsidence over the Coastal City of Urayasu, Japan
by Yusupujiang Aimaiti, Fumio Yamazaki and Wen Liu
Remote Sens. 2018, 10(8), 1304; https://doi.org/10.3390/rs10081304 - 18 Aug 2018
Cited by 33 | Viewed by 6662
Abstract
In earthquake-prone areas, identifying patterns of ground deformation is important before they become latent risk factors. As one of the severely damaged areas due to the 2011 Tohoku earthquake in Japan, Urayasu City in Chiba Prefecture has been suffering from land subsidence as [...] Read more.
In earthquake-prone areas, identifying patterns of ground deformation is important before they become latent risk factors. As one of the severely damaged areas due to the 2011 Tohoku earthquake in Japan, Urayasu City in Chiba Prefecture has been suffering from land subsidence as a part of its land was built by a massive land-fill project. To investigate the long-term land deformation patterns in Urayasu City, three sets of synthetic aperture radar (SAR) data acquired during 1993–2006 from European Remote Sensing satellites (ERS-1/-2 (C-band)), during 2006–2010 from the Phased Array L-band Synthetic Aperture Radar onboard the Advanced Land Observation Satellite (ALOS PALSAR (L-band)) and from 2014–2017 from the ALOS-2 PALSAR-2 (L-band) were processed by using multitemporal interferometric SAR (InSAR) techniques. Leveling survey data were also used to verify the accuracy of the InSAR-derived results. The results from the ERS-1/-2, ALOS PALSAR and ALOS-2 PALSAR-2 data processing showed continuing subsidence in several reclaimed areas of Urayasu City due to the integrated effects of numerous natural and anthropogenic processes. The maximum subsidence rate of the period from 1993 to 2006 was approximately 27 mm/year, while the periods from 2006 to 2010 and from 2014 to 2017 were approximately 30 and 18 mm/year, respectively. The quantitative validation results of the InSAR-derived deformation trend during the three observation periods are consistent with the leveling survey data measured from 1993 to 2017. Our results further demonstrate the advantages of InSAR measurements as an alternative to ground-based measurements for land subsidence monitoring in coastal reclaimed areas. Full article
Show Figures

Figure 1

14 pages, 2402 KiB  
Article
Novel Measurements of Fine-Scale Albedo: Using a Commercial Quadcopter to Measure Radiation Fluxes
by Charlotte R. Levy, Elizabeth Burakowski and Andrew D. Richardson
Remote Sens. 2018, 10(8), 1303; https://doi.org/10.3390/rs10081303 - 18 Aug 2018
Cited by 23 | Viewed by 5522
Abstract
Remote sensing of radiative indices must balance spatially and temporally coarse satellite measurements with finer-scale, but geographically limited, in-situ surface measurements. Instruments mounted upon an Unmanned Aerial Vehicle (UAV) can provide small-scale, mobile remote measurements that fill this resolution gap. Here we present [...] Read more.
Remote sensing of radiative indices must balance spatially and temporally coarse satellite measurements with finer-scale, but geographically limited, in-situ surface measurements. Instruments mounted upon an Unmanned Aerial Vehicle (UAV) can provide small-scale, mobile remote measurements that fill this resolution gap. Here we present and validate a novel method of obtaining albedo values using an unmodified quadcopter at a deciduous northern hardwood forest. We validate this method by comparing simultaneous albedo estimates by UAV and a fixed tower at the same site. We found that UAV provided stable albedo measurements across multiple flights, with results that were well within the range of tower-estimated albedo at similar forested sites. Our results indicate that in-situ albedo measurements (tower and UAV) capture more site-to-site variation in albedo than satellite measurements. Overall, we show that UAVs produce reliable, consistent albedo measurements that can capture crucial surface heterogeneity, clearly distinguishing between different land uses. Future application of this approach can provide detailed measurements of albedo and potentially other vegetation indices to enhance global research and modeling efforts. Full article
(This article belongs to the Special Issue Remotely Sensed Albedo)
Show Figures

Graphical abstract

21 pages, 3472 KiB  
Article
Assessment of the SMAP-Derived Soil Water Deficit Index (SWDI-SMAP) as an Agricultural Drought Index in China
by Jueying Bai, Qian Cui, Deqing Chen, Haiwei Yu, Xudong Mao, Lingkui Meng and Yang Cai
Remote Sens. 2018, 10(8), 1302; https://doi.org/10.3390/rs10081302 - 18 Aug 2018
Cited by 37 | Viewed by 6392
Abstract
China is frequently subjected to local and regional drought disasters, and thus, drought monitoring is vital. Drought assessments based on available surface soil moisture (SM) can account for soil water deficit directly. Microwave remote sensing techniques enable the estimation of global SM with [...] Read more.
China is frequently subjected to local and regional drought disasters, and thus, drought monitoring is vital. Drought assessments based on available surface soil moisture (SM) can account for soil water deficit directly. Microwave remote sensing techniques enable the estimation of global SM with a high temporal resolution. At present, the evaluation of Soil Moisture Active Passive (SMAP) SM products is inadequate, and L-band microwave data have not been applied to agricultural drought monitoring throughout China. In this study, first, we provide a pivotal evaluation of the SMAP L3 radiometer-derived SM product using in situ observation data throughout China, to assist in subsequent drought assessment, and then the SMAP-Derived Soil Water Deficit Index (SWDI-SMAP) is compared with the atmospheric water deficit (AWD) and vegetation health index (VHI). It is found that the SMAP can obtain SM with relatively high accuracy and the SWDI-SMAP has a good overall performance on drought monitoring. Relatively good performance of SWDI-SMAP is shown, except in some mountain regions; the SWDI-SMAP generally performs better in the north than in the south for less dry bias, although better performance of SMAP SM based on the R is shown in the south than in the north; differences between the SWDI-SMAP and VHI are mainly shown in areas without vegetation or those containing drought-resistant plants. In summary, the SWDI-SMAP shows great application potential in drought monitoring. Full article
Show Figures

Figure 1

2 pages, 159 KiB  
Erratum
Erratum: Xie, Y.Y.; et al. GRACE-Based Terrestrial Water Storage in Northwest China: Changes and Causes. Remote Sens. 2018, 10, 1163
by Yangyang Xie, Shengzhi Huang, Saiyan Liu, Guoyong Leng, Jian Peng, Qiang Huang and Pei Li
Remote Sens. 2018, 10(8), 1301; https://doi.org/10.3390/rs10081301 - 18 Aug 2018
Cited by 2 | Viewed by 3554
Abstract
The authors wish to make a correction to their paper [...] Full article
27 pages, 13586 KiB  
Article
Targeted Grassland Monitoring at Parcel Level Using Sentinels, Street-Level Images and Field Observations
by Raphaël D’Andrimont, Guido Lemoine and Marijn Van der Velde
Remote Sens. 2018, 10(8), 1300; https://doi.org/10.3390/rs10081300 - 17 Aug 2018
Cited by 35 | Viewed by 9055
Abstract
The introduction of high-resolution Sentinels combined with the use of high-quality digital agricultural parcel registration systems is driving the move towards at-parcel agricultural monitoring. The European Union’s Common Agricultural Policy (CAP) has introduced the concept of CAP monitoring to help simplify the management [...] Read more.
The introduction of high-resolution Sentinels combined with the use of high-quality digital agricultural parcel registration systems is driving the move towards at-parcel agricultural monitoring. The European Union’s Common Agricultural Policy (CAP) has introduced the concept of CAP monitoring to help simplify the management and control of farmers’ parcel declarations for area support measures. This study proposes a proof of concept of this monitoring approach introducing and applying the concept of ‘markers’. Using Sentinel-1- and -2-derived (S1 and S2) markers, we evaluate parcels declared as grassland in the Gelderse Vallei in the Netherlands covering more than 15,000 parcels. The satellite markers—respectively based on crop-type deep learning classification using S1 backscattering and coherence data and on detecting bare soil with S2 during the growing season—aim to identify grassland-declared parcels for which (1) the marker suggests another crop type or (2) which appear to have been ploughed during the year. Subsequently, a field-survey was carried out in October 2017 to target the parcels identified and to build a relevant ground-truth sample of the area. For the latter purpose, we used a high-definition camera mounted on the roof of a car to continuously sample geo-tagged digital imagery, as well as an app-based approach to identify the targeted fields. Depending on which satellite-based marker or combination of markers is used, the number of parcels identified ranged from 2.57% (marked by both the S1 and S2 markers) to 17.12% of the total of 11,773 parcels declared as grassland. After confirming with the ground-truth, parcels flagged by the combined S1 and S2 marker were robustly detected as non-grassland parcels (F-score = 0.9). In addition, the study demonstrated that street-level imagery collection could improve collection efficiency by a factor seven compared to field visits (1411 parcels/day vs. 217 parcels/day) while keeping an overall accuracy of about 90% compared to the ground-truth. This proposed way of collecting in situ data is suitable for the training and validating of high resolution remote sensing approaches for agricultural monitoring. Timely country-wide wall-to-wall parcel-level monitoring and targeted in-season parcel surveying will increase the efficiency and effectiveness of monitoring and implementing agricultural policies. Full article
(This article belongs to the Section Remote Sensing in Agriculture and Vegetation)
Show Figures

Graphical abstract

22 pages, 6321 KiB  
Article
Extraction of Sample Plot Parameters from 3D Point Cloud Reconstruction Based on Combined RTK and CCD Continuous Photography
by Jincheng Liu, Zhongke Feng, Liyan Yang, Abdul Mannan, Tauheed Ullah Khan, Ziyu Zhao and Zhuxin Cheng
Remote Sens. 2018, 10(8), 1299; https://doi.org/10.3390/rs10081299 - 17 Aug 2018
Cited by 40 | Viewed by 6604
Abstract
Enriching forest resource inventory is important to ensure the sustainable management of forest ecosystems. Obtaining forest inventory data from the field has always been difficult, laborious, time consuming, and expensive. Advances in integrating photogrammetry and computer vision have helped researchers develop some numeric [...] Read more.
Enriching forest resource inventory is important to ensure the sustainable management of forest ecosystems. Obtaining forest inventory data from the field has always been difficult, laborious, time consuming, and expensive. Advances in integrating photogrammetry and computer vision have helped researchers develop some numeric algorithms and methods that can turn 2D (images) into 3D (point clouds) and are highly applicable to forestry. This paper aimed to develop a new, highly accurate methodology that extracts sample plot parameters based on continuous terrestrial photogrammetry. For this purpose, we designed and implemented a terrestrial observation instrument combining real-time kinematic (RTK) and charge-coupled device (CCD) continuous photography. Then, according to the set observation plan, three independent experimental plots were continuously photographed and the 3D point cloud of the plot was generated. From this 3D point cloud, the tree position coordinates, tree DBHs, tree heights, and other plot characteristics of the forest were extracted. The plot characteristics obtained from the 3D point cloud were compared with the measurement data obtained from the field to check the accuracy of our methodology. We obtained the position coordinates of the trees with the positioning accuracy (RMSE) of 0.162 m to 0.201 m. The relative root mean square error (rRMSE) of the trunk diameter measurements was 3.07% to 4.51%, which met the accuracy requirements of traditional forestry surveys. The hypsometrical measurements were due to the occlusion of the forest canopy and the estimated rRMSE was 11.26% to 11.91%, which is still good reference data. Furthermore, these image-based point cloud data also have portable observation instruments, low data collection costs, high field measurement efficiency, automatic data processing, and they can directly extract tree geographic location information, which may be interesting and important for certain applications such as the protection of registered famous trees. For forest inventory, continuous terrestrial photogrammetry with its unique advantages is a solution that deserves future attention in the field of tree detection and ecological construction. Full article
(This article belongs to the Special Issue Aerial and Near-Field Remote Sensing Developments in Forestry)
Show Figures

Graphical abstract

18 pages, 2591 KiB  
Article
Extrinsic Parameters Calibration Method of Cameras with Non-Overlapping Fields of View in Airborne Remote Sensing
by Lei Yin, Xiangjun Wang, Yubo Ni, Kai Zhou and Jilong Zhang
Remote Sens. 2018, 10(8), 1298; https://doi.org/10.3390/rs10081298 - 16 Aug 2018
Cited by 17 | Viewed by 5751
Abstract
Multi-camera systems are widely used in the fields of airborne remote sensing and unmanned aerial vehicle imaging. The measurement precision of these systems depends on the accuracy of the extrinsic parameters. Therefore, it is important to accurately calibrate the extrinsic parameters between the [...] Read more.
Multi-camera systems are widely used in the fields of airborne remote sensing and unmanned aerial vehicle imaging. The measurement precision of these systems depends on the accuracy of the extrinsic parameters. Therefore, it is important to accurately calibrate the extrinsic parameters between the onboard cameras. Unlike conventional multi-camera calibration methods with a common field of view (FOV), multi-camera calibration without overlapping FOVs has certain difficulties. In this paper, we propose a calibration method for a multi-camera system without common FOVs, which is used on aero photogrammetry. First, the extrinsic parameters of any two cameras in a multi-camera system is calibrated, and the extrinsic matrix is optimized by the re-projection error. Then, the extrinsic parameters of each camera are unified to the system reference coordinate system by using the global optimization method. A simulation experiment and a physical verification experiment are designed for the theoretical arithmetic. The experimental results show that this method is operable. The rotation error angle of the camera’s extrinsic parameters is less than 0.001rad and the translation error is less than 0.08 mm. Full article
(This article belongs to the Section Remote Sensing Image Processing)
Show Figures

Figure 1

40 pages, 13280 KiB  
Article
Comparison of Seven Inversion Models for Estimating Plant and Woody Area Indices of Leaf-on and Leaf-off Forest Canopy Using Explicit 3D Forest Scenes
by Jie Zou, Yinguo Zhuang, Francesco Chianucci, Chunna Mai, Weimu Lin, Peng Leng, Shezhou Luo and Bojie Yan
Remote Sens. 2018, 10(8), 1297; https://doi.org/10.3390/rs10081297 - 16 Aug 2018
Cited by 13 | Viewed by 3706
Abstract
Optical methods require model inversion to infer plant area index (PAI) and woody area index (WAI) of leaf-on and leaf-off forest canopy from gap fraction or radiation attenuation measurements. Several inversion models have been developed previously, however, a thorough comparison of those inversion [...] Read more.
Optical methods require model inversion to infer plant area index (PAI) and woody area index (WAI) of leaf-on and leaf-off forest canopy from gap fraction or radiation attenuation measurements. Several inversion models have been developed previously, however, a thorough comparison of those inversion models in obtaining the PAI and WAI of leaf-on and leaf-off forest canopy has not been conducted so far. In the present study, an explicit 3D forest scene series with different PAI, WAI, phenological periods, stand density, tree species composition, plant functional types, canopy element clumping index, and woody component clumping index was generated using 50 detailed 3D tree models. The explicit 3D forest scene series was then used to assess the performance of seven commonly used inversion models to estimate the PAI and WAI of the leaf-on and leaf-off forest canopy. The PAI and WAI estimated from the seven inversion models and simulated digital hemispherical photography images were compared with the true PAI and WAI of leaf-on and leaf-off forest scenes. Factors that contributed to the differences between the estimates of the seven inversion models were analyzed. Results show that both the factors of inversion model, canopy element and woody component projection functions, canopy element and woody component estimation algorithms, and segment size are contributed to the differences between the PAI and WAI estimated from the seven inversion models. There is no universally valid combination of inversion model, needle-to-shoot area ratio, canopy element and woody component clumping index estimation algorithm, and segment size that can accurately measure the PAI and WAI of all leaf-on and leaf-off forest canopies. The performance of the combinations of inversion model, needle-to-shoot area ratio, canopy element and woody component clumping index estimation algorithm, and segment size to estimate the PAI and WAI of leaf-on and leaf-off forest canopies is the function of the inversion model as well as the canopy element and woody component clumping index estimation algorithm, segment size, PAI, WAI, tree species composition, and plant functional types. The impact of canopy element and woody component projection function measurements on the PAI and WAI estimation of the leaf-on and leaf-off forest canopy can be reduced to a low level (<4%) by adopting appropriate inversion models. Full article
(This article belongs to the Section Forest Remote Sensing)
Show Figures

Figure 1

17 pages, 6755 KiB  
Article
Virtual Structural Analysis of Jokisivu Open Pit Using ‘Structure-from-Motion’ Unmanned Aerial Vehicles (UAV) Photogrammetry: Implications for Structurally-Controlled Gold Deposits in Southwest Finland
by Mohammad Sayab, Domingo Aerden, Markku Paananen and Petri Saarela
Remote Sens. 2018, 10(8), 1296; https://doi.org/10.3390/rs10081296 - 16 Aug 2018
Cited by 37 | Viewed by 7049
Abstract
Unmanned aerial vehicles (UAVs) are rapidly growing remote sensing platforms for capturing high-resolution images of exposed rock surfaces. We used a DJI Phantom 3 Professional (P3P) quadcopter to capture aerial images that were used to generate a high-resolution three-dimensional (3-D) model of the [...] Read more.
Unmanned aerial vehicles (UAVs) are rapidly growing remote sensing platforms for capturing high-resolution images of exposed rock surfaces. We used a DJI Phantom 3 Professional (P3P) quadcopter to capture aerial images that were used to generate a high-resolution three-dimensional (3-D) model of the Jokisivu open-pit gold deposit that is located in southwestern Finland. 158 overlapping oblique and nadir images were taken and processed with Agisoft Photoscan Pro to generate textured 3-D surface models. In addition, 69 overlapping images were taken from the steep faces of the open pit. We assessed the precision of the 3-D model by deploying ground control points (GCPs) and the average errors were found minimal along X (2.0 cm), Y (1.2 cm), and Z (5.0 cm) axes. The steep faces of the open pit were used for virtual structural measurements and kinematic analyses in CloudCompare and ArcGIS to distinguish the orientation of different fracture sets and statistical categorization, respectively. Three distinct fracture sets were observed. The NW-SE and NE-SW striking fractures form a conjugate geometry, whereas the NNW-SSE striking fractures cut the conjugate fracture set. The orientation of conjugate fractures match well with the resource model of the deposit and NW- and NE-trending segments of regional-scale anastomosing shear zones. Based on the conjugate geometry of fracture sets I and II, and the regional pattern of anastomosing shear system lead us to interpret an origin of gold mineralization in two stages. An early N-S or NNW-SSE crustal shortening, corresponding to the regional D4 (ca. 1.83–1.81 Ga) or pre-D4 (ca. 1.87–1.86 Ga) Svecofennian tectonic event(s) that produced anastomosing shear zones. Subsequent E-W directed D5 contraction (ca. 1.79–1.77 Ga) partly reactivated the anastomosing shear zones with the formation of conjugate system, which controlled the migration of fluids and gold mineralization in SW Finland. Full article
Show Figures

Graphical abstract

19 pages, 5287 KiB  
Article
A Spatial-Temporal Adaptive Neighborhood-Based Ratio Approach for Change Detection in SAR Images
by Huifu Zhuang, Hongdong Fan, Kazhong Deng and Guobiao Yao
Remote Sens. 2018, 10(8), 1295; https://doi.org/10.3390/rs10081295 - 16 Aug 2018
Cited by 15 | Viewed by 3380
Abstract
The neighborhood-based method was proposed and widely used in the change detection of synthetic aperture radar (SAR) images because the neighborhood information of SAR images is effective to reduce the negative effect of speckle noise. Nevertheless, for the neighborhood-based method, it is unreasonable [...] Read more.
The neighborhood-based method was proposed and widely used in the change detection of synthetic aperture radar (SAR) images because the neighborhood information of SAR images is effective to reduce the negative effect of speckle noise. Nevertheless, for the neighborhood-based method, it is unreasonable to use a fixed window size for the entire image because the optimal window size of different pixels in an image is different. Hence, if you let the neighborhood-based method use a large window to significantly suppress noise, it cannot preserve the detail information such as the edge of a changed area. To overcome this drawback, we propose a spatial-temporal adaptive neighborhood-based ratio (STANR) approach for change detection in SAR images. STANR employs heterogeneity to adaptively select the spatial homogeneity neighborhood and uses the temporal adaptive strategy to determine multi-temporal neighborhood windows. Experimental results on two data sets show that STANR can both suppress the negative influence of noise and preserve edge details, and can obtain a better difference image than other state-of-the-art methods. Full article
(This article belongs to the Special Issue Analysis of Multi-temporal Remote Sensing Images)
Show Figures

Figure 1

33 pages, 23004 KiB  
Article
Fractal-Based Local Range Slope Estimation from Single SAR Image with Applications to SAR Despeckling and Topographic Mapping
by Gerardo Di Martino, Alessio Di Simone and Daniele Riccio
Remote Sens. 2018, 10(8), 1294; https://doi.org/10.3390/rs10081294 - 15 Aug 2018
Cited by 6 | Viewed by 3627
Abstract
In this paper, we propose a range slope estimation procedure from single synthetic aperture radar (SAR) images with both methodological and applicative innovations. The retrieval algorithm is based on an analytical linearized direct model, which relates the SAR intensity data to the range [...] Read more.
In this paper, we propose a range slope estimation procedure from single synthetic aperture radar (SAR) images with both methodological and applicative innovations. The retrieval algorithm is based on an analytical linearized direct model, which relates the SAR intensity data to the range local slopes and encompasses both a surface model and an electromagnetic scattering model. Scene topography is described via fractal geometry, whereas the Small Perturbation Method is adopted to represent the scattering behavior of the surface. The range slope map is then used to estimate the surface topography and the local incidence angle map. For topographic mapping applications, also referred to as shape from shading, a regularization procedure is derived to recover the azimuth local slope and reduce distortions. Then we present a new intriguing application of the inversion procedure in the field of SAR despeckling. Proposed techniques and high-level products are tested in a wide series of experiments, where the algorithms are applied to both simulated (canonical) and actual SAR images. It is proved that the proposed range slope retrieval technique can (1) provide an estimate of the surface shape, with overall better performance w.r.t. typical models used in this field and (2) be useful in advanced despeckling techniques. Full article
Show Figures

Graphical abstract

32 pages, 8903 KiB  
Article
Using Near-Infrared-Enabled Digital Repeat Photography to Track Structural and Physiological Phenology in Mediterranean Tree–Grass Ecosystems
by Yunpeng Luo, Tarek S. El-Madany, Gianluca Filippa, Xuanlong Ma, Bernhard Ahrens, Arnaud Carrara, Rosario Gonzalez-Cascon, Edoardo Cremonese, Marta Galvagno, Tiana W. Hammer, Javier Pacheco-Labrador, M. Pilar Martín, Gerardo Moreno, Oscar Perez-Priego, Markus Reichstein, Andrew D. Richardson, Christine Römermann and Mirco Migliavacca
Remote Sens. 2018, 10(8), 1293; https://doi.org/10.3390/rs10081293 - 15 Aug 2018
Cited by 61 | Viewed by 8785 | Correction
Abstract
Tree–grass ecosystems are widely distributed. However, their phenology has not yet been fully characterized. The technique of repeated digital photographs for plant phenology monitoring (hereafter referred as PhenoCam) provide opportunities for long-term monitoring of plant phenology, and extracting phenological transition dates (PTDs, e.g., [...] Read more.
Tree–grass ecosystems are widely distributed. However, their phenology has not yet been fully characterized. The technique of repeated digital photographs for plant phenology monitoring (hereafter referred as PhenoCam) provide opportunities for long-term monitoring of plant phenology, and extracting phenological transition dates (PTDs, e.g., start of the growing season). Here, we aim to evaluate the utility of near-infrared-enabled PhenoCam for monitoring the phenology of structure (i.e., greenness) and physiology (i.e., gross primary productivity—GPP) at four tree–grass Mediterranean sites. We computed four vegetation indexes (VIs) from PhenoCams: (1) green chromatic coordinates (GCC), (2) normalized difference vegetation index (CamNDVI), (3) near-infrared reflectance of vegetation index (CamNIRv), and (4) ratio vegetation index (CamRVI). GPP is derived from eddy covariance flux tower measurement. Then, we extracted PTDs and their uncertainty from different VIs and GPP. The consistency between structural (VIs) and physiological (GPP) phenology was then evaluated. CamNIRv is best at representing the PTDs of GPP during the Green-up period, while CamNDVI is best during the Dry-down period. Moreover, CamNIRv outperforms the other VIs in tracking growing season length of GPP. In summary, the results show it is promising to track structural and physiology phenology of seasonally dry Mediterranean ecosystem using near-infrared-enabled PhenoCam. We suggest using multiple VIs to better represent the variation of GPP. Full article
(This article belongs to the Section Biogeosciences Remote Sensing)
Show Figures

Graphical abstract

10 pages, 3483 KiB  
Article
Symmetric Double-Eye Structure in Hurricane Bertha (2008) Imaged by SAR
by Guosheng Zhang and William Perrie
Remote Sens. 2018, 10(8), 1292; https://doi.org/10.3390/rs10081292 - 15 Aug 2018
Cited by 5 | Viewed by 3373
Abstract
Internal dynamical processes play a critical role in hurricane intensity variability. However, our understanding of internal storm processes is less well established, partly because of fewer observations. In this study, we present an analysis of the hurricane double-eye structure imaged by the RADARSAT-2 [...] Read more.
Internal dynamical processes play a critical role in hurricane intensity variability. However, our understanding of internal storm processes is less well established, partly because of fewer observations. In this study, we present an analysis of the hurricane double-eye structure imaged by the RADARSAT-2 cross-polarized synthetic aperture radar (SAR) over Hurricane Bertha (2008). SAR has the capability of hurricane monitoring because of the ocean surface roughness induced by surface wind stress. Recently, the C-band cross-polarized SAR measurements appear to be unsaturated for the high wind speeds, which makes SAR suitable for studies of the hurricane internal dynamic processes, including the double-eye structure. We retrieve the wind field of Hurricane Bertha (2008), and then extract the closest axisymmetric double-eye structure from the wind field using an idealized vortex model. Comparisons between the axisymmetric model extracted wind field and SAR observed winds demonstrate that the double-eye structure imaged by SAR is relatively axisymmetric. Associated with airborne measurements using a stepped-frequency microwave radiometer, we investigate the hurricane internal dynamic process related to the double-eye structure, which is known as the eyewall replacement cycle (ERC). The classic ERC theory was proposed by assuming an axisymmetric storm structure. The ERC internal dynamic process of Hurricane Bertha (2008) related to the symmetric double-eye structure here, which is consistent with the classic theory, is observed by SAR and aircraft. Full article
(This article belongs to the Special Issue Sea Surface Roughness Observed by High Resolution Radar)
Show Figures

Graphical abstract

9 pages, 1620 KiB  
Technical Note
Distributed Fiber Optic Sensors for the Monitoring of a Tunnel Crossing a Landslide
by Aldo Minardo, Ester Catalano, Agnese Coscetta, Giovanni Zeni, Lei Zhang, Caterina Di Maio, Roberto Vassallo, Roberto Coviello, Giuseppe Macchia, Luciano Picarelli and Luigi Zeni
Remote Sens. 2018, 10(8), 1291; https://doi.org/10.3390/rs10081291 - 15 Aug 2018
Cited by 49 | Viewed by 6376
Abstract
This work reports on the application of a distributed fiber-optic strain sensor for long-term monitoring of a railway tunnel affected by an active earthflow. The sensor has been applied to detect the strain distribution along an optical fiber attached along the two walls [...] Read more.
This work reports on the application of a distributed fiber-optic strain sensor for long-term monitoring of a railway tunnel affected by an active earthflow. The sensor has been applied to detect the strain distribution along an optical fiber attached along the two walls of the tunnel. The experimental results, relative to a two-year monitoring campaign, demonstrate that the sensor is able to detect localized strains, identify their location along the tunnel walls, and follow their temporal evolution. Full article
Show Figures

Graphical abstract

Previous Issue
Back to TopTop