Abstract
The purpose of the paper is to evaluate the quality and hydrological utility of four popular satellite precipitation products, including the Tropical Rainfall Measuring Mission (TRMM) Multi-satellite Precipitation Analysis (TMPA) product (3B42V7), near real-time product (3B42RT), and the Climate Prediction Center (CPC) MORPHing technique (CMORPH) satellite–gauge merged product (CMORPH BLD) and bias-corrected product (CMORPH CRT) over Fujiang River basin, China. First, we provided a statistical assessment of the four precipitation products at multiple spatiotemporal scales. The results show that: (1) all the products except 3B42RT capture the spatial pattern of annual precipitation fairly well; (2) in general, CMORPH BLD benefits from the application of the probability density function-optimal interpolation (PDF-OI) gauge adjustment algorithm and performs best among all the products with Pearson correlation coefficients (CC) of 0.84 and 0.94, equitable threat score (ETS) of 0.56 and 0.63 in grid and basin scales, respectively, followed by 3B42V7 and CMORPH CRT; whereas 3B42RT performs worst across all the metrics; (3) according to the occurrence frequencies of rainfall, satellite estimates mainly fall into the bin of 0–1 mm/day and tend to underestimate light precipitation. In addition, the performance of all the products in warm season is much better than in cold season in both grid and basin scales. Subsequently, a physically based distributed model is established to further evaluate the hydrological utility of different precipitation products. The results reveal that: (1) the errors in precipitation products mainly propagate into hydrological simulations, resulting in the best hydrological performance in CMORPH BLD in both daily and monthly scales after recalibrating the model, while 3B42RT shows limited skills in reproducing the daily observed hydrograph; (2) after recalibrating the model with the respective satellite data, significant improvements are observed for all the products; (3) CMORPH BLD no longer shows its superiority during near-real-time monitoring of floods. There is still a great challenge for the application of current satellite-based estimates into local flood monitoring. This study could be used as guidance for choosing alternative satellite precipitation products for hydrological applications in a local community, particularly in basins in which rainfall gauges are scarce.
1. Introduction
Precipitation is the key forcing variable in atmospheric, hydrological and energy cycles at local, regional and global scales, which is of great importance to agricultural irrigation, water resources management and disaster monitoring linked to floods, droughts, and landslides [1,2,3]. It is thus crucial to acquire accurate and reliable precipitation at high spatial and temporal resolutions. Generally, there are three ways to measure precipitation, i.e., rain gauges, weather radars, and satellite-based sensors [4,5]. A conventional rain gauge is a straightforward way to provide precipitation observations. However, it is always insufficient for precipitation monitoring due to its sparse and uneven distributions in some regions [5]. A weather radar can monitor precipitation accurately, but it may suffer from the problem of high cost and limited coverage in mountainous regions in terms of distorted signals [6]. In contrast, satellite-based rainfall products have recently been accepted as a result of wide spatial coverage, fine spatio-temporal resolutions and easy data acquisition, providing an alternative and effective way to obtain large-scale precipitation measurement [7,8]. Currently, global satellite precipitation products are made from calibrated infrared (IR), microwave (MW) and MW plus IR measurements [4,9]. IR sensors are designed to provide precipitation estimates at high temporal resolutions but show inferiority in capturing accurate precipitation. In contrast, MW sensors are advantageous in precipitation estimation but are limited to low temporal sampling. Thus, it is recognized and recommended to integrate IR and MW sensors to improve the accuracy and time resolution of satellite precipitation products.
Since the launch of Tropical Rainfall Measuring Mission (TRMM) in 1997, satellite-based precipitation retrieval algorithms have witnessed rapid development. To date, a growing number of multi-sensor blended, quasi-global satellite precipitation products have been developed and released. These products include the TRMM Multi-satellite Precipitation Analysis (TMPA) [10], Precipitation Estimation from Remotely Sensed Imagery using Artificial Neural Networks (PERSIANN) [11], Climate Hazards Group Infrared Precipitation with Station data (CHIRPS) [12], Climate Prediction Center (CPC) MORPHing technique (CMORPH) [13], Global Satellite Mapping of Precipitation and Moving Vector with Kalman filter (GSMaP-MVK) [14] and Integrated Multi-satellite Retrievals for Global Precipitation Measurement (GPM-IMERG) [9]. These products were designed to provide high (0.25° and 3 h or finer) spatiotemporal resolution-forcing datasets, and can serve as forcing for distributed hydrologic models to facilitate regional and global investigations into hydrology [15,16]. Among these precipitation products, the most popular products are TRMM-TMPA, CMORPH and GPM-IMERG. As one of the TRMM-era mainstream products, TMPA includes real-time 3B42RT and gauge-adjusted post real-time 3B42V7 precipitation estimates, which is intended to provide the ‘‘best’’ estimate of quasi-global precipitation of TRMM [17]. According to [13], CMORPH produces global precipitation estimates from passive microwave (PMW) and IR data at high spatial and temporal resolution. After a series of reprocessing, CMORPH has evolved to the third generation of products. TRMM and CMORPH have been widely used in hydrological simulations and predictions all over the world [17,18]. As the TRMM successor, the GPM mission Core Observatory was launched in February 2014, providing the next generation global rain and snow product. Recently, many studies have evaluated the quality of GPM IMERG from a statistical perspective [1,19,20]. However, IMERG is rarely used in operational hydrologic applications [21], partly due to the lack of long-term in situ discharge record as input for distributed hydrological model to demonstrate its applicability. For the same reason, IMERG was not used in this study. In the future, it is expected that IMERG will be further used as rainfall forcing to facilitate hydrological applications.
Nevertheless, satellite precipitation products are always subject to seasonal and regional systematic biases and random errors, arising from indirect measurements, retrieval algorithms and sampling uncertainties [22,23,24]. In fact, there are errors existing in ground reference data, thus leading to errors in the matching procedure of satellite precipitation products and ground reference data [25]. Meanwhile, the errors of satellite precipitation products can be propagated into streamflow simulations through the hydrologic integration processes [21]. Obviously, without the identification of errors associated with these popular products in a local community, efforts to better use them in hydrological applications will not bear fruit. Furthermore, evaluation results could also provide feedback to developers which enables them to improve the quality of satellite products. With a statistical evaluation-oriented view, researchers have conducted numerous studies to investigate the accuracy of satellite precipitation products across the world [26,27,28]. In addition, extreme flood events have highlighted the increasing importance of studies on floods monitoring. As a cost-effective source, satellite precipitation products provide increasing potential to monitor and predict extreme floods under a variety of circumstances [29]. Therefore, it is necessary to conduct hydrological evaluation work emphasizing the application purpose to enhance disaster predictability using diverse satellite precipitation products. With a hydrological application-oriented view, Li et al. [18] evaluated the hydrologic applications of CMORPH and TMPA and found that 3B42V7 has a better performance in annual water budgeting and monthly streamflow simulation. The adequacy of 3B42RT and 3B42V7 in driving the SWAT model was evaluated by Li et al. [30] and it was reported that 3B42RT allowed considerable room for improvement in hydrological application.
Precipitation is a function of local climate and topography, so the performance of satellite precipitation products could vary from region to region [31]. Despite the continuing efforts to improve the evaluation of satellite precipitation products, the performance of satellite precipitation products has not been evaluated thoroughly, especially their hydrologic applicability in local community [32]. It was suggested by Guo et al. [8] that more studies on quantitatively evaluating the performance of satellite products over mountainous regions need to be conducted in future work. In addition, basin scale plays an important role in the performance of streamflow simulation. It was reported by Gao et al. [33] that hydrological modeling performance will be better with larger watershed size in the Jialing River basin. As part of a large basin, a small basin is more susceptible to local climate regimes and land surface conditions, and affects the hydrological processes of large-scale basin to some extent. However, modeling-based investigations are mainly concentrated in medium- and large-sized watersheds at present [17,34], while only a few studies have been carried on small basins [35,36]. As a tributary of the Yangtze River, Fujiang River basin is highlighted because of its geographical position as a relatively small but flood-prone zone with complex terrain and drainage area less than 25,000 km2, which deserves more attention. In 2018, rainfall-triggered severe floods (with its largest discharge of 21,400 m3/s) occurred in the Fujiang River basin and resulted in a loss of ~1.8 billion USD (http://www.mca.gov.cn/), posing great threat to human property and national safety. It is therefore urgent to conduct hydrological applications in this specific basin, to bridge the gap between the remote-sensing technologies community and the hydrologic prediction community [5].
This study is the first to evaluate the four commonly used precipitation products from statistical and hydrological perspectives in Fujiang River basin with sparsely-distributed rainfall gauges. The rest of this paper is organized as follows. Section 2 introduces the materials and methods, including a brief introduction of study area, datasets, a set of diagnostic statistics and the Coupled Routing and Excess Storage (CREST) distributed model. Section 3 discusses the results of the study, followed by Section 4 with discussion. Section 5 includes the conclusions.
2. Materials and Methods
2.1. Study Area
The Fujiang River basin, with a drainage area of 24,752 km2 above the Shehong hydrological station, is the largest tributary of the right bank of the Jialing River that is the largest branch of the Yangtze River. It is located within 30°50′N–33°24′N and 103°45′E–105°38′E in southeast China (Figure 1). Surrounded by high mountains in the upstream and dominated by low hills in the middle part, the topography of Fujiang River basin is complex, with elevations ranging from 300 to 5000 m. Soils in the basin are mainly composed by purple soil (30%), yellow-brown soil (30%) and paddy (14%) according to the China soil classification system [37].
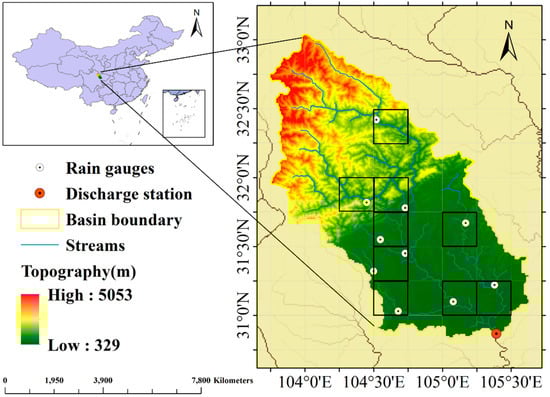
Figure 1.
The Fujiang River basin of the Shehong hydrological station and locations of rain gauges. Black squares represent the 9 selected 0.25° × 0.25° grids for precipitation comparison.
The basin has a subtropical humid monsoon climate with average annual precipitation of ~1200 mm, 60–85% of which falls into the warm season (June–September). Fujiang River basin is one of the most populous parts of Sichuan province and a significant crop-producing region of grain and wheat [38]. Meanwhile, the combination of extreme precipitation and sloping topography make it a typical flood-prone region. Rainfall-triggered floods have caused tremendous losses on the economy and society. These are the reasons for additional investigation, especially in a region with few rain gauges. Therefore, it is meaningful to conduct a study to evaluate different satellite precipitation products in this basin comprehensively.
2.2. Datasets
2.2.1. Ground Gauge Data
The China Gauge-based Daily Precipitation Analysis (CGDPA) [39] is a new precipitation analysis over mainland China, which was developed by the National Meteorological Information Center (http://cdc.nmic.cn). CGDPA was produced based on about 2400 national rain gauges from 1955 to the present and is updated in real time at 0.25° × 0.25° resolution. A modified interpolation method of climatology-based optimal interpolation (OI) with topographic corrections was used to reduce errors caused by the spatial discontinuity of rainfall [39,40]. In retrospective studies, CGDPA has been proven to be of high quality in both statistical and hydrological assessments over mainland China [4,33]. Therefore, it is reasonable to use CGDPA as the benchmark over the study area. The national rain gauges used in CGDPA in the study are shown in Figure 1. There are 9 grid boxes at 0.25° × 0.25° with at least one rain gauge over Fujiang River basin. Table 1 briefly lists the summary information of CGDPA and the four satellite precipitation products. Daily discharge data (in m3/s) from 2006 to 2013 were collected from the basin outlet of Shehong station for evaluating hydrologic modeling performance.

Table 1.
Description of the gauged China Gauge-based Daily Precipitation Analysis (CGDPA) and four satellite-based precipitation products in this study.
2.2.2. Satellite Precipitation and Evapotranspiration Data
The satellite precipitation products to be evaluated in the study include four popular high-resolution multi-sensor blended precipitation products: TRMM 3B42 V7, TRMM 3B42 RT, CMORPH BLD and CMORPH CRT (Table 1). To make it comparable, the four satellite products were aggregated into the uniform 0.25° × 0.25° spatial grid and daily resolution.
TRMM is a joint mission of National Aeronautics and Space Administration (NASA) and Japan Aerospace Exploration Agency (JAXA), with its core observatory launched in 1997. In this study, two latest Version-7 products of the TMPA were used, namely post-real-time 3B42V7 covering between 60°N to 60°S and near-real-time 3B42RT covering between 50°N to 50°S, hereafter 3B42V7 and 3B42RT, respectively. The original data provides 0.25° × 0.25° and 3-hourly resolution and was obtained from NASA archive (https://pmm.nasa.gov/data-access/downloads/trmm). Both 3B42V7 and 3B42RT products are generated by combining information from passive microwave sensors, active microwave sensors and infrared sensors. Compared with 3B42RT, 3B42V7 incorporating Global Precipitation Climatology Center (GPCC) monthly precipitation gauge analysis through inverse-error-variance weighting was designed to remove the bias [10]. There are 194 Global Telecommunications System (GTS) rain gauge observations from the GPCC products in China [41].
CMORPH produces global precipitation analyses at very high spatial and temporal resolution based on microwave and infrared precipitation estimates [13]. Compared with TRMM, CMORPH uses a different technique named the Lagrangian interpolation method to combine PMW and IR estimates, where PMW measurements are propagated by IR-derived motion vectors [5,42]. This strategy fully takes advantage of the high accuracy of the microwave data and the high temporal resolution of the infrared data. The latest CMORPH V1.0 product contains CMORPH RAW, CMORPH CRT and CMORPH BLD (ftp://ftp.cpc.ncep.noaa.gov/precip/CMORPH_V1.0/). CMORPH RAW V1.0 has been reprocessed for the period of 1998–present using the same algorithm as old operational CMORPH products (Version 0.x). To generate CMORPH CRT, probability density function (PDF) matching against CPC unified daily gauge analysis was used to reduce bias over land [41]. The original CMORPH CRT covers between 60°N to 60°S, with 0.25° × 0.25° spatial and 3-hourly temporal resolution. As a successor of CMORPH CRT, CMORPH BLD not only adopt the same PDF strategy as CMORPH CRT, but also apply the OI to merge CMORPH CRT with CPC unified daily gauges to further reduce bias (PDF-OI strategy) [43]. CMORPH BLD is available on global coverage with of daily and 0.25° × 0.25° resolution.
Potential evapotranspiration (PET) data used in this study were achieved from the global daily database, provided by the Famine Early Warning Systems Network (https://earlywarning.usgs.gov/fews/search/Global) at 1° spatial resolution. The PET was extracted from the Global Data Assimilation System (GDAS) analysis fields using the Penman–Monteith equation with global coverage [44].
2.2.3. Geographical Data
Geographical data used in the study includes the digital elevation model (DEM), the land use and the soil data. The DEM data was obtained from hydrological data and maps based on Shuttle Elevation Derivatives at multiple Scales (HydroSHEDS) (https://hydrosheds.cr.usgs.gov/), with 30 arc-second spatial resolution. Other basic data including flow direction, flow accumulation, stream and slope were extracted from DEM. All of them were used as the key data enabling the implementation of the CREST model. The land use data was obtained from Data Center for Resources and Environmental Sciences (RESDC), Chinese Academy of Sciences (http://www.resdc.cn) with 6 categories and 25 sub-categories. Soil parameters were provided by the Food and Agriculture Organization of the United Nations (FAO; http://www.fao.org/AG/agl/agll/dsmw.htm), both of land use data and soil parameters were used to generate a prior parameter of CREST model [45].
2.3. Methodologies
2.3.1. Statistical Metrics
Nine widely used statistical metrics were selected to quantitatively evaluate the performance of multi-satellite precipitation products against gauge observations as well as streamflow simulations (Table 2). The metrics could be generally divided into three categories [35,46]. The first category contains the Pearson correlation coefficient (CC), representing the agreements between the “test” field and the reference field. The second category includes the relative bias (BIAS), the mean error (ME) and the root mean square error (RMSE). BIAS denotes the error characteristics of satellite products, while RMSE evaluates the average error magnitude and ME was selected to measure average difference between the two fields.
Table 2.
List of the statistical metrics used in the comparison and evaluation.
The final category includes probability of detection (POD), false alarm ratio (FAR), equitable threat score (ETS), and frequency bias (FB), which are calculated from the 2 × 2 contingency table (Table 3) for different thresholds. POD gives the fraction of occurred events that were correctly detected. FAR gives the fraction of the detected events for which the event had not occurred. The ETS can provide more comprehensive judgment of satellite products, and is, therefore, a more equitable score. FB is expressed as a ratio of total number of detected events to the total number of occurred events.
Table 3.
Two-by-two contingency table with a threshold of X mm.
Additionally, the most commonly used statistical criteria, the Nash–Sutcliffe Coefficient of Efficiency (NSCE), were utilized to evaluate the goodness of fit between simulated streamflow and gauged streamflow.
2.3.2. Hydrological Model and Calibration Method
The CREST model [45,47] is a raster-based distributed hydrological model developed by the NASA SERVIR Project Team (www.servir.net) and the University of Oklahoma (http://hydro.ou.edu). It aims to provide regional and global hydrological prediction on regular grid cells of arbitrary user-defined resolution, which enables regional and global applications [48]. The CREST model has already been widely implemented in multiscale hydrological studies [17,33,47]. The version of CREST v2.1 with a upgrade using a fully distributed linear reservoir routing scheme (FDLRR) [49] is employed to evaluate the hydrologic availability of four satellite precipitation products.
The input of CREST model includes 7 physical parameters and 5 conceptual parameters [45]. The above parameters were calibrated by an auto-calibration method based on the shuffled complex evolution optimization algorithm (SCE-UA) [50]. The SCE scheme has been successfully applied in the field of hydrological model calibration and has proven to be robust and efficient for global optimization [51].
3. Results
3.1. Statistical Evaluation and Comparison of Precipitation
To investigate the continuity and difference between the different satellite precipitation estimates, the four products were evaluated and compared at grid and basin scales with CGDPA. One thing to be noted is that the rainfall gauges used for the generation of CGDPA are independent of those used for the generation of TRMM and CMORPH (Table 1), and thus the reliability of the evaluation results is guaranteed. Another thing to be noted is that in the grid-scale comparison, only grid boxes with at least one gauge (9 grids) were selected to calculate the metrics in order to avoid additional error by interpolating the gauge data and ensure the reliability of the results [19,31,52]. However, every grid box over the study area was assigned a calculated metric value to enable the visualization of distribution (Figure 2 and Figure 3).
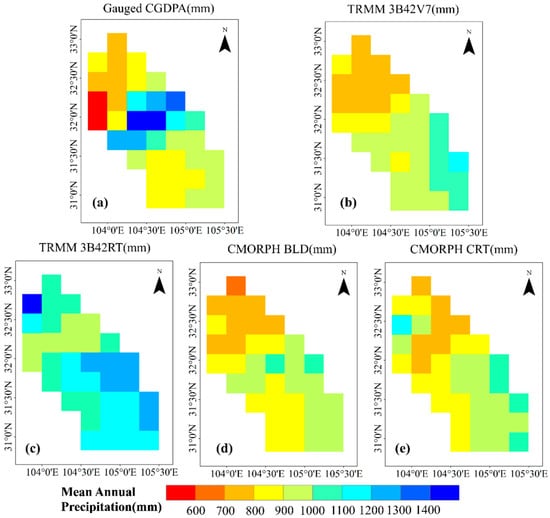
Figure 2.
Spatial maps of mean annual precipitation over Fujiang River basin for the period of 2006–2013, from (a) gauge observations, (b) TRMM 3B42V7, (c) TRMM 3B42RT, (d) CMORPH BLD and (e) CMORPH CRT.
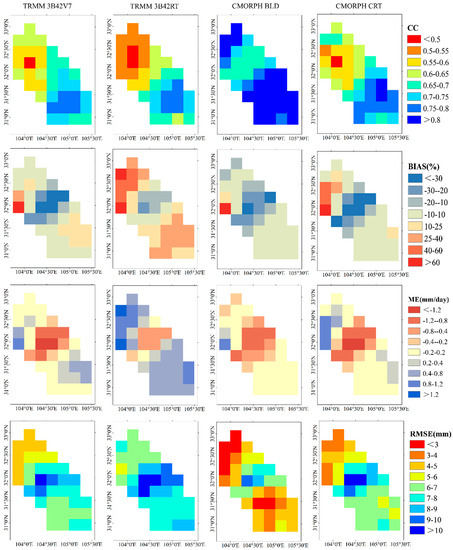
Figure 3.
Spatial maps of metrics between the four satellite precipitation products and CGDPA for CC, BIAS, ME and RMSE (from top to the bottom) during 2006–2013.
3.1.1. Grid-Scale Evaluation
Figure 2 shows the spatial distribution of multiyear (2006–2013) mean annual precipitation. In general, all the products (except 3B42RT) captured the spatial distribution and magnitude of mean annual precipitation compared to the gauged precipitation, exhibiting the similar precipitation pattern with the precipitation increasing from northwest to southeast. Note that there is an obvious enhancement of CGDPA (greater than 1400 mm) in the middle hilly area, which could be attributed to the orographic enhancement effect of the hills [32].
Figure 3 presents the spatial distribution of metrics between the four satellite precipitation products and CGDPA. Overall, CMORPH BLD shows the best performance over the entire basin with the highest CC and lowest RMSE, followed by 3B42V7 and CMORPH CRT while 3B42RT displays the lowest quality. The distribution of CC shows an overall increasing trend from northwest to southeast. In terms of BIAS, all products underestimated precipitation in the middle hilly area and overestimated precipitation in the northwest mountainous area, especially in TRMM 3B42RT, which exhibits the severest overestimation. Apart from RMSE, all the metrics showed similar spatial characteristics to those of mean annual precipitation (Figure 2). It was demonstrated that the southeast areas with relatively greater precipitation and flatter topography were beneficial to precipitation detection.
Figure 4 shows box plots of grid-scale statistics for different precipitation products at daily timescale. As shown in Figure 4, CMORPH BLD performed best among the different products with CC ranging from 0.66 to 0.94, RMSE ranging from 2.84 mm/day to 6.90 mm/day and ETS ranging from 0.41 to 0.70, although it had greater dispersion in terms of POD and ETS compared with other products. Apart from the remarkable overestimation of 3B42RT with average BIAS of 19.11%, the average BIAS values of the other products were within ±10%, which coincides with the results of previous studies [35,36].
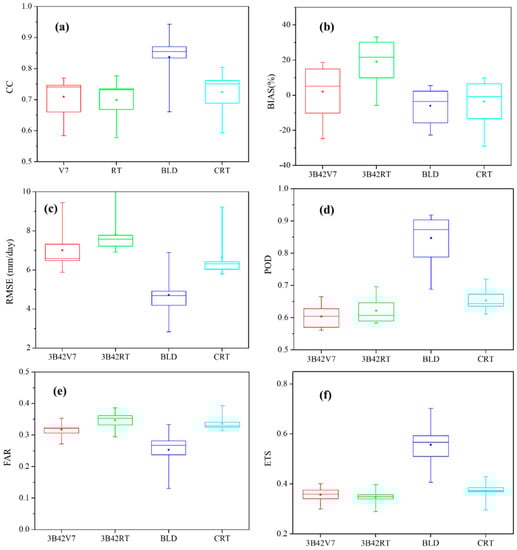
Figure 4.
Box plots of grid based metrics for different precipitation products at daily timescale from 2006–2013: (a–f) represents CC, BIAS, RMSE, POD, FAR, and ETS, respectively.
In Fujiang River basin, the rainfall mainly concentrates in the warm season (June–September) while the rainfall falling into the cold season (December–March) accounts for less than 20%. Therefore, it is of great significance to conduct comparisons in both warm and cold seasons. Figure 5 shows box plots of grid-scale statistics in both cold and warm seasons for different precipitation products. During the cold season (red box), all the metrics (except the metrics of CMORPH BLD) were unsatisfactory, indicating that the satellite precipitation products are less capable of depicting slight precipitation in winter. The performance of TMPA series estimators 3B42V7 and 3B42RT were comparable, while CMORPH BLD most resampled the gauged observations with its performance far more than other products (mean POD of 0.68, ETS of 0.49 and FAR of 0.30). In contrast, CMORPH CRT showed little ability to capture slight precipitation in winter with low ETS and extremely high FAR (Figure 5). It was demonstrated that the OI procedure applied in CMORPH BLD greatly improves its performance. It can be seen from FB scores that 3B42V7 and 3B42RT showed apparent underestimation, while CMORPH products displayed a more balanced error pattern, suggesting insufficient detection of rainfall of TMPA products in winter.
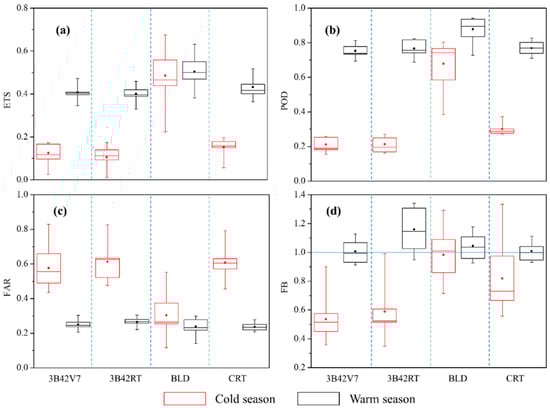
Figure 5.
Box plots of grid based metrics in cold and warm seasons for different precipitation products at daily timescale from 2006–2013: (a–d) represents ETS, POD, FAR and FB, respectively.
For the warm season (black box), the performance of all the products has been greatly improved with POD all above 0.69, ETS all above 0.33 and FAR all below 0.3. The results are consistent with many other previous studies that satellite retrieval is generally more accurate in humid season [3,18,26,53]. In general, CMORPH BLD still performs the best and stably shows the highest POD (ranging from 0.73 to 0.95) and ETS (ranging from 0.38 to 0.63) while CMORPH CRT ranks second with relatively high ETS and low FAR. 3B42V7 and 3B42RT share considerable similarities among all the metrics, although 3B42RT performs slightly worse than 3B42V7 in regard to FAR and ETS. For FB, CMORPH BLD exhibited slight over-detection while 3B42RT showed extreme over-detection of precipitation in the warm season. The difference of error features between CMORPH and TMPA products could be attributed to the different retrieval algorithms.
3.1.2. Basin-Scale Evaluation
Figure 6 shows the frequency distribution of gauged and satellite-based daily precipitation at different rainfall ranges from 2006 to 2013. As witnessed in Figure 6, about 60% daily precipitation fell within the range of 0–1 mm/day, whereas heavy precipitation (>20 mm/day) accounted for only about 3%. All the satellite precipitation products tended to underestimate light rainfall (0–1 mm/day) and moderate to heavy precipitation (>10 mm/day) except 3B42RT, but overestimate daily precipitation at the rates from 1 to 10 mm/day. CMORPH BLD showed good agreement with the reference data in slight and moderate precipitation (0–20 mm/day). Apart from 3B42RT, the other three products tended to underestimate heavy and torrential rain events (>20 mm/day). In conclusion, both 3B42V7 and CMORPH BLD reproduced the frequency distribution of various precipitation intensities fairly well, especially for light precipitation, while 3B42RT deviated most significantly from the observed frequencies.
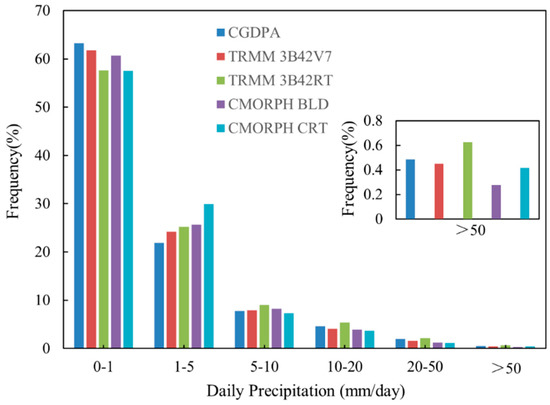
Figure 6.
The occurrence frequencies of different daily precipitation products during 2006–2013 based on mean aerial precipitation.
Figure 7 shows density-plot scatter diagrams of different precipitation products based on mean areal precipitation. All the products displayed the precipitation mostly within 5 mm, indicating the study area was dominated by light precipitation, and this is also depicted in Figure 6. Generally, CMORPH BLD showed the best agreement with the reference data with CC up to 0.94 and RMSE of 2.06 mm/day and outperformed other products (Figure 7c). Furthermore, CMORPH BLD also performed well with POD of 0.91, FAR of 0.15 and ETS of 0.63, demonstrating that CMORPH BLD can predict most of the precipitation events over the region. Similar to grid-scale comparison, 3B42RT performed a significant overestimation with BIAS of 17.20% while other products underestimated precipitation. Notably, the low BIAS (−3.14% and −5.67%) and ME (−0.8 mm/day and −1.4 mm/day) for 3B42V7 and CMORPH CRT were probably due to the offset between the positive and negative values over the entire basin.
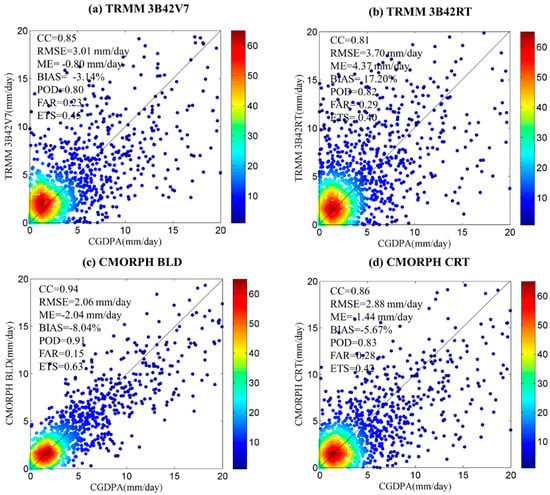
Figure 7.
Density-colored scatterplots of basin-averaged precipitation comparison of four products against CGDPA rainfall rate for (a) TRMM 3B42V7, (b) TRMM 3B42RT, (c) CMORPH BLD and (d) CMORPH CRT. The color represents the occurrence frequency. The dark solid line denotes 1:1 line.
Figure 8 presents the results of four metrics (POD, FAR, ETS and FB) at different precipitation thresholds. The results shows that the overall accuracy of all the products declined (POD and ETS were reduced and FAR was increased) with increasing rainfall rate, which indicated the limited capability of satellite sensors for depicting intense precipitation [54]. In contrast, according to FAR, CMORPH BLD performed best with a more stable discrimination skill across all the thresholds. Moreover, CMORPH BLD was superior to other products with the highest ETS and POD for rainfall rates of 1 mm/day, 5 mm/day and 50 mm/day. The performance of TMPA products was comparable, while CMORPH CRT performed worst based on most metrics, particularly in FB. The underestimation in CMORPH products for medium and heavy rainfall could be attributed to the limited GTS reports used in error correction (Figure 8d).
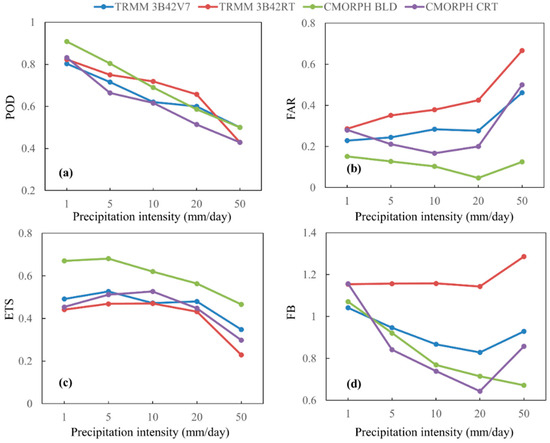
Figure 8.
Metrics of (a) POD, (b) FAR, (c) ETS and (d) FB of different daily satellite products against CGDPA at the thresholds of 1 mm/day, 5 mm/day, 10 mm/day, 20 mm/day and 50 mm/day during 2006–2013.
Figure 9 summarizes the metrics of POD, FAR, ETS and FB of the four satellite-based products on a monthly scale to further analyze the performance of seasonal variations. As shown in Figure 9, all the products exhibited notable seasonal variations, i.e., the skill of all the products was relatively higher in the warm season than in the cold season with higher POD and ETS and lower FAR, which accords with the conclusions showed in grid-scale comparison (Figure 5).
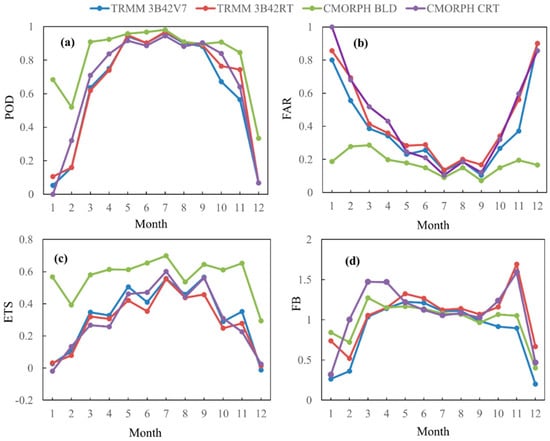
Figure 9.
Monthly statistics of (a) POD, (b) FAR, (c) ETS and (d) FB of different daily satellite products against CGDPA at the threshold of 1 mm/day during 2006–2013.
Generally, CMORPH BLD was more suitable for characterizing the seasonal variation of precipitation, with its performance far more than other products in winter. In contrast, CMORPH CRT performs worst in winter with almost no detection skills (POD = 0, FAR = 1, ETS < 0 in January), suggesting the advance of OI algorithm applied in CMORPH BLD. In terms of FB, all the products tended to overestimate precipitation that spreads over two peaks in spring and autumn, but underestimated precipitation in winter.
3.2. Hydrological Evaluation and Comparison with Two Simulation Scenarios
Using the SCE-UA calibration scheme, two different parameter setup scenarios were designed to evaluate the streamflow simulation skills of four satellite precipitation products.
- Static parameters (Scenario I): the model parameters were first calibrated using gauged data (CGDPA) from January 2006 through December 2009. Then the model was driven by the four satellite precipitation products as forcing inputs for the independent validation period from January 2010 through December 2013 using the rain gauge-calibrated model parameters.
- Dynamic parameters (Scenario II): these parameters were recalibrated with individual satellite products as the forcing inputs over the same calibration period; then we use the product-specific parameter sets to simulate streamflow during the same validation period.
Scenario I is widely used in the regions with dense gauge network, while Scenario II is regarded as an alternative strategy over regions with few or no gauges where remotely sensed data are available for use [4,36].
3.2.1. Scenario I: Static Parameters
First, the CREST model was calibrated using rain gauged inputs against streamflow observations for the period of 2006–2009, using one year period (2005) to spin up the model. The calibrated model was then validated using CGDPA during 2010–2013. Figure 10 and Figure 11 show the hydrological comparison of CGDPA and the four satellite products on daily and monthly time scales. Four representative years (2008–2011) were selected to enable the clear presentation of daily simulation in Figure 10. However, the metrics were calculated based on the whole period (2006–2009) for reasonability (Table 4). Figure 10a and Figure 11a shows that general agreement existed between gauged and simulated discharge in the calibration period, followed by favorable hydrological performance with high NSCE (0.77 and 0.96), low BIAS (−11% and −9.6%) and high CC (0.88 and 0.99) on daily and monthly time scales, respectively (Table 4 and Table 5). It was also observed that reasonable simulations occurred in the validation period, despite yielding an underestimation at some high flood peaks. The results indicated that it is viable to use CGDPA as a benchmark for evaluating the utility of the satellite products [33]. However, there is a slight decline of all the metrics in the validation period. This phenomenon could be associated with the increased human activities in the catchment in recent years [47].
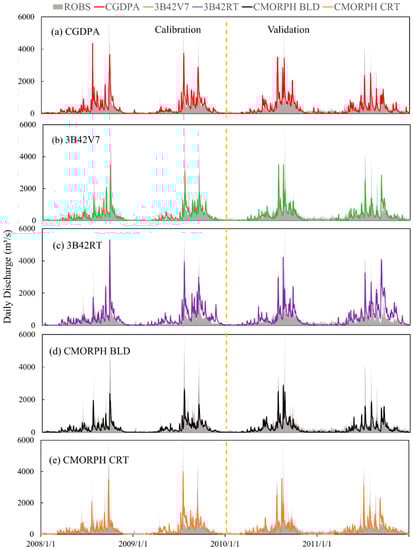
Figure 10.
Comparison of observed and simulated daily discharge in Scenario I from (a) CGDPA, (b) 3B42V7, (c) 3B42RT, (d) CMORPH BLD and (e) CMORPH CRT in both calibration (2008–2009) and validation (2010–2011) periods.
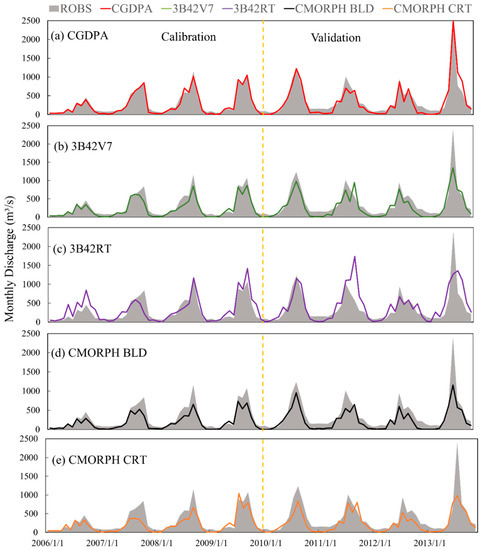
Figure 11.
Comparison of observed and simulated monthly discharge in Scenario I from (a) CGDPA, (b) 3B42V7, (c) 3B42RT, (d) CMORPH BLD and (e) CMORPH CRT in both calibration (2006–2009) and validation (2010–2013) periods.
Table 4.
Comparison of daily observed and simulated streamflow under the two calibration scenarios.
Table 5.
As in Table 4, but for monthly streamflow.
The gauge-benchmarked model was subsequently driven by the four different satellite precipitation forcings, respectively. In the validation period, all the products except 3B42RT performed acceptable skill in hydrological simulations, with the NSCE greater than 0.53, BIAS constrained within −25.9% to −41.8% and high CC. Notably, the 3B42RT product almost had no hydrological prediction ability with the smallest NSCE and CC. Based on Figure 10c and Figure 11c, there was a coexistence of overestimation and underestimation existing in 3B42RT simulation, which is to largely account for a small BIAS for 3B42RT. The 3B42V7 product matched relatively well with the observed discharge, especially for the moderate and high peak flows, but tended to misrepresent some minor peak flows. Figure 10 and Figure 11 also show that both in calibration and validation periods, CMORPH-driven model captured a majority of peak flows, but underestimated peak flows with magnitudes greater than 2000 m3/s and 500 m3/s on daily and monthly time scales, respectively.
As summarized in Table 4, in the validation period, the performance of 3B42V7, CMORPH BLD and CMORPH CRT are similar with the same NSCE of 0.53 on the daily scale. But on the smoothed monthly scale (Table 5), the performance of CMORPH products generally degraded compared with 3B42V7 (i.e., 3B42V7/CMORPH BLD/CMORPH CRT: NSCE = 0.72/0.64/0.58, CC = 0.90/0.92/0.86, BIAS = −25.9%/−40.0%/−35.5%). In addition, similar to precipitation error estimates (Figure 4 and Figure 7), the simulation of 3B42RT yielded an overestimation with the positive BIAS, whereas the simulation of other three products showed an underestimation with the negative BIAS. The negative BIAS may be due to the underestimation of precipitation by the retrieval algorithms of satellite products. Moreover, all the simulated hydrographs generally reproduced the respective precipitation pattern (Figure 10 and Figure 11). The results indicated that the errors of precipitation estimates can propagate into hydrologic predictions through hydrologic modeling.
3.2.2. Scenario II: Dynamic Parameters
In Scenario II, the four different satellite products were separately used to recalibrate the CREST model and were validated for the same period as Scenario I, to further assess the effectiveness of satellite products on streamflow simulation. As summarized in Table 4 and Table 5, the performance of all the simulations has been improved for Scenario II relative to Scenario I with improved NSCE and CC and reduced BIAS. This phenomenon could be due to the parameter compensation effect, i.e., after the parameter recalibration, the parameter sets were closer to the truth, consequently improved their hydrological performance [36]. Compared with Scenario I, CMORPH BLD estimates provided encouraging results with maximum improvement, even exceeded 3B42V7 (e.g., in calibration period and on daily time scale, CMORPH BLD/3B42V7: NSCE = 0.73/0.63, CC = 0.86/0.80 and BIAS = −14.7%/−16%) both on daily and monthly time scales. The results indicated that the effect of the recalibrated parameter sets was to largely compensate for rainfall underestimation in CMORPH BLD and enhanced its hydrological performance. Similar to Scenario I, 3B42RT estimates showed the worst results in both calibration and validation periods through larger error propagations.
Overall, all the products perform promising hydrological performance in Scenario II, but still showing a difference: CMORPH BLD came close secondarily to the reference CGDPA and outperformed the post real-time 3B42V7 product, followed by CMORPH CRT product, while the near-real-time 3B42RT product ranked the lowest. The experiments also confirmed that satellite precipitation products played a critical role in hydrological simulation in terms of parameter compensation effect for the Fujiang River basin, which lacks rain gauges.
3.2.3. Extreme Flood Events Modelling
To further examine the capability of satellite precipitation products to predict extreme and rare events, Figure 12 shows the observed and simulated extreme flood events under two scenarios. In July 2013, torrential rain occurred in the Fujiang River basin, thus leading to a severe flood according to the Ministry of Civil Affairs of China (http://www.mca.gov.cn/). The flood event sustained up to one month with three major floods which happened continuously in early, middle and late July. The floods occurring in early July (1 July to 7 July) and mid-July (10 July to 16 July) were the heaviest, whereas the late July flood (17 July to 31 July) was relatively flat.
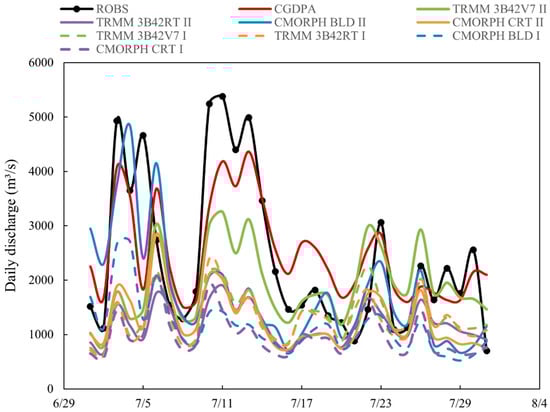
Figure 12.
Observed and simulated extreme flood events under both Scenario I (dashed lines) and Scenario II (solid lines) during July 2013 on the Fujiang River basin.
According to Figure 12, CGDPA-forced simulations mostly reproduced the observed extreme flood events. Meanwhile, all the flood forecasts based on gauge-benchmarked simulations (dashed lines) resulted in significant and substantial underestimation of the observed flood magnitude. This suggests that the model simulations under Scenario I were unsuitable to forecast a flood event. In scenario II, the flood forecasts based on CMORPH BLD and 3B42V7 simulations (solid lines) matched some of the observed flood peaks, while CMORPH CRT and 3B42RT simulations (solid lines) still miss most flood peaks. This phenomenon has proved the incompetence of CMORPH CRT and 3B42RT-forced simulations to characterize extreme flood events. Then again, it reflects the necessity of recalibrating the hydrologic model by satellite products in extreme flood modelling, particularly for remote regions with poor rainfall gauges.
For the 4–7 July flood period, all the satellite products forced simulation under two scenarios slightly delayed the flood peaks. This is mainly attributable to the inherent deficiencies of satellite precipitation products [18]. Despite missing the first flood event, 3B42V7-driven simulation in scenario II (solid lines) reasonably reproduced the magnitude and key pattern of the other two flood events. For the period of 10–16 July, 3B42V7 recalibrated simulations captured the flood event to some extent, whereas other simulations failed to detect the flood event, which can be inferred from the incorrect precipitation distribution of the torrential rainfall on 10–16 July, which has not been captured well by other satellite products (Figure 6). There is a large drop of simulated discharge for the late July flood period (17–31 July). This may be caused by the emergency flood relief by local government [32].
4. Discussion
In the study, we aim to compare quantitatively and comprehensively the four standard Day-1 satellite products (TRMM 3B42V7, TRMM 3B42RT, CMORPH BLD and CMORPH CRT) during the period from 2006 to 2013 over a mountainous and small southeast China basin with few rainfall gauge observations. This study first focused on statistical evaluation and comparison of the four precipitation estimates; then, a multi-scale evaluation based on hydrological modeling was conducted. In statistical evaluation, all the products were evaluated against CGDPA at 0.25° × 0.25° resolution and various temporal (daily, monthly and annual) and spatial scales (grid and basin).
In general, apart from 3B42RT, other products captured the spatial pattern of annual precipitation over the Fujiang River basin fairly well: increasing from northwest to southeast. This may be attributed to two main reasons. First, the rainfall gauges using in CGDPA are unevenly distributed, which is sparse in the northwest area (Figure 1). This may lead to deviation from the interpolated precipitation to real values, thus reducing the reliability of metrics calculated against such ground reference [46]. Second, the topography and climate over this region are complex, which pose a great challenge for accurate satellite precipitation estimation. In a grid-scale comparison, CMORPH BLD showed its superiority among the four products with CC ranging from 0.66 to 0.94 and ETS ranging from 0.41 to 0.70, while 3B42RT exhibited the worst performance. Lack of ground observations for error correction could be the main reason for the poor performance of 3B42RT. Apart from the obvious overestimation of 3B42RT, the average BIAS values of other products were within ±10%. We speculated this is mostly linked to overestimation by the PMW land algorithm of 3B42RT [55]. All the products showed much better performance in the warm season than in the cold season. This could be caused by the interference with microwave sensors from satellites due to land surface snow cover in winter [24]. CMORPH BLD showed stable performance with inconspicuous seasonal variations, whereas TMPA and CMORPH CRT were depicted by remarkable seasonal variations.
Regarding basin scale comparison, metrics are generally improved compared to the grid scale comparison, but this effect is less obvious as the comparison changes from the cold season to the warm season. In general, CMORPH BLD showed the best agreement with the reference data with CC of 0.94 and ETS of 0.63 and outperformed other products. Daily precipitation input is very important for hydrological applications. The frequency distribution showed that the satellite daily precipitation in Fujiang River basin mainly concentrated in the range of 0–1 mm/day and tended to underestimate light precipitation. It was also pointed out by Chen et al. [1] that satellite precipitation estimates tended to underestimate light rainfall. In addition, both 3B42V7 and CMORPH BLD reproduced the frequency distribution of different precipitation intensities reasonably.
When the daily precipitation thresholds increased, the performance of all the satellite products declined, indicating the insufficient capability of satellite products for detecting intense precipitation. The reason is that heavy precipitation makes radar signals attenuate, thus leading to inaccurate detection [1]. It was also reported by Shiva et al. [54] that satellite sensors are not sensitive to extreme precipitation, which constrains the ability of detecting precipitation. Metrics are improved as the temporal resolution increases from daily to monthly. For monthly comparison, all the products showed apparent seasonal variations, and this is also reported in Figure 5. Generally, CMORPH BLD showed stable and the best performance throughout the year, while CMORPH CRT performs were worst, especially in winter, with almost no detection skills. It was demonstrated that CMORPH BLD can make up for the limitations of CMORPH CRT regarding detecting light rainfall in terms of the employment of OI procedure. Therefore, special caution should be taken when we apply CMORPH CRT into hydrological applications in winter.
For the hydrological evaluation, the four satellite products were applied to drive the CREST model against observed discharge to examine the hydrologic utilities of satellite precipitation products. We designed two scenarios of hydrologic parameter sets. Scenario I, benchmarked by in situ gauges, is conventionally used over gauged basins, while scenario II with input-specific recalibration, is deemed as an alternative over regions with sparse rainfall gauge network where only a remote-sensing platform is available for use.
For Scenario I, the CGDPA-driven model reproduced the observed streamflow fairly well, indicating that the CREST model was able to reproduce daily observed discharge in magnitude and time evolution reasonably and effectively. It is also found that the errors in precipitation products mainly propagated into hydrological simulations. In general, apart from 3B42RT, the hydrological performance of the other three satellite products is comparable in terms of the same NSCE of 0.53 on the daily scale, but 3B42V7 showed a superiority on the monthly scale. Fusion of the GPCC monthly gauge analysis into 3B42V7 may be the main reason for the superiority of 3B42V7. In addition, 3B42RT simulation tended to overestimate streamflow, while other three products showed an underestimation of streamflow. The significant underestimation in CMORPH simulations (−30~−40%) may be attributed to the defective morphing processes in the CMORPH RAW data, which determines precipitation values as the weighted mean of passive microwave (PMW) estimates from multiple sensors, thus leading to the underestimation of heavy precipitation in CMORPH products (Figure 6 and Figure 7) [16,32]. Then, the errors were enlarged and propagated into hydrological simulations.
For Scenario II, significant improvements are observed for all the simulations both on daily and monthly time scales. It was demonstrated that the parameter compensation effect plays an important role in promoting hydrological performance. CMORPH BLD showed consistent satisfactory performance (NSCE = 0.59–0.85), whereas 3B42RT showed the worst results (NSCE = 0.37–0.65) through larger error propagations. In addition, CMORPH BLD can produce much better hydrologic predictions than 3B42V7 with the least reduced error propagation from input to discharge through parameter recalibration. The parameter compensation effect is often recognized over regions with few or no gauges and still used by the hydrology community. However, this strategy may be problematic because such a calibration scheme may destroy the inherent error structure of the forcing products, which may ultimately limit the model’s predictive capability under different climate and initial conditions [36].
For near real-time flood monitoring, all the flood forecasts based on gauge-benchmarked simulations failed to capture flood peaks. Despite capturing some of the observed flood peaks, CMORPH BLD no longer shows its superiority during near real-time monitoring of floods compared with accuracy assessment and hydrological application. It was demonstrated that the PDF-OI strategy used in CMORPH BLD did not guarantee a better result for extreme flood simulation. At this point, a denser gauge network is needed to calibrate satellite data to improve their performance for flood forecasting [32]. It should be alert to apply current satellite rainfall products into the monitoring and warning of local floods due to their inherent deficiencies.
There are also large uncertainties in observed discharge and basin conditions, which may affect the streamflow simulations. In fact, the discharge data of the Shehong station was inevitably affected by human activities, more or less. With the development of the economy, more and more facilities were built, like dams and reservoirs. Man-made interference of discharge will cause the observed discharge to deviate from the actual natural discharge. Furthermore, the consumption of water by humans can lead to much lower observed discharge than actual values.
5. Conclusions
Satellite precipitation products have broad application potential for global and regional hydrologic studies, particularly in areas with few gauge stations, in which case a rigorous product assessment is required before implementation. In this study, a comprehensive assessment of the four commonly used precipitation products (TRMM 3B42V7, TRMM 3B42RT, CMORPH BLD and CMORPH CRT) was carried out over the Fujiang River basin with a sparse gauge network. This study reveals that CMORPH BLD has an outstanding performance both in terms of accuracy and in its promising hydrological utilities due to the application of the probability density function-optimal interpolation (PDF-OI) gauge adjustment algorithm. The effect of the recalibrated parameter sets was to largely compensate for rainfall underestimation in CMORPH BLD. However, CMORPH BLD no longer shows its superiority during near real-time monitoring of floods. We believe the present study will promote better utilization of satellite precipitation products in small mountainous basins with a sparse gauge network. Future studies are advocated to explore the hydrologic utility of the latest IMERG in various hydrologic applications, especially in the basins that lack ground observations.
Author Contributions
W.S. and J.M. analyzed the data, performed the experiments, and wrote the draft of the manuscript; W.L. gave comments and provided the data; G.Y. designed the framework of this study, gave comments, and significantly revised the manuscript.
Funding
This research was funded in part by the National Natural Science Foundation under Grant U1609203, Grant 41671342 and Grant 41801256, in part by Key Laboratory of Earth Observation and Geospatial Information Science of NASG (201804), in part by the Ningbo Natural Science Foundation under Grant 2017A610294, and in part by the K. C. Wong Magna Fund from Ningbo University.
Acknowledgments
The authors acknowledged Guoqiang Tang and Zhe Li for providing and modifying the MATLAB code for calculating error metrics, and Ruosun Chen and Cheng Chen for consulting the CMORPH information.
Conflicts of Interest
The authors declare no conflict of interest.
References
- Chen, C.; Chen, Q.; Duan, Z.; Zhang, J.; Mo, K.; Li, Z.; Tang, G. Multiscale Comparative Evaluation of the GPM IMERG v5 and TRMM 3B42 v7 Precipitation Products from 2015 to 2017 over a Climate Transition Area of China. Remote Sens. 2018, 10, 944. [Google Scholar] [CrossRef]
- Wu, H.; Adler, R.F.; Hong, Y.; Tian, Y.; Policelli, F. Evaluation of Global Flood Detection Using Satellite-Based Rainfall and a Hydrologic Model. J. Hydrometeorol. 2012, 13, 1268–1284. [Google Scholar] [CrossRef]
- Ma, Y.; Yang, Y.; Han, Z.; Tang, G.; Maguire, L.; Chu, Z.; Hong, Y. Comprehensive evaluation of Ensemble Multi-Satellite Precipitation Dataset using the Dynamic Bayesian Model Averaging scheme over the Tibetan plateau. J. Hydrol. 2018, 556, 634–644. [Google Scholar] [CrossRef]
- Tang, G.; Zeng, Z.; Long, D.; Guo, X.; Yong, B.; Zhang, W.; Hong, Y. Statistical and Hydrological Comparisons between TRMM and GPM Level-3 Products over a Midlatitude Basin: Is Day-1 IMERG a Good Successor for TMPA 3B42V7? J. Hydrometeorol. 2016, 17, 121–137. [Google Scholar] [CrossRef]
- Li, Z.; Yang, D.; Hong, Y. Multi-scale evaluation of high-resolution multi-sensor blended global precipitation products over the Yangtze River. J. Hydrol. 2013, 500, 157–169. [Google Scholar] [CrossRef]
- Sharifi, E.; Steinacker, R.; Saghafian, B. Assessment of GPM-IMERG and Other Precipitation Products against Gauge Data under Different Topographic and Climatic Conditions in Iran: Preliminary Results. Remote Sens. 2016, 8, 135. [Google Scholar] [CrossRef]
- Tan, M.; Duan, Z. Assessment of GPM and TRMM Precipitation Products over Singapore. Remote Sens. 2017, 9, 720. [Google Scholar] [CrossRef]
- Guo, H.; Chen, S.; Bao, A.; Hu, J.; Gebregiorgis, A.S.; Xue, X.; Zhang, X. Inter-Comparison of High-Resolution Satellite Precipitation Products over Central Asia. Remote Sens. 2015, 7, 7181–7211. [Google Scholar] [CrossRef]
- Hou, A.Y.; Kakar, R.K.; Neeck, S.; Azarbarzin, A.A.; Kummerow, C.D.; Kojima, M.; Oki, R.; Nakamura, K.; Iguchi, T. The global precipitation measurement mission. Bull. Am. Meteorol. Soc. 2014, 95, 701–722. [Google Scholar] [CrossRef]
- Huffman, G.J.; Bolvin, D.T.; Nelkin, E.J.; Wolff, D.B.; Adler, R.F.; Gu, G.; Hong, Y.; Bowman, K.P.; Stocker, E.F. The TRMM multisatellite precipitation analysis (TMPA): Quasi-global, multiyear, combined-sensor precipitation estimates at fine scales. J. Hydrometeorol. 2007, 8, 38–55. [Google Scholar] [CrossRef]
- Sorooshian, S.; Hsu, K.-L.; Gao, X.; Gupta, H.V.; Imam, B.; Braithwaite, D. Evaluation of PERSIANN system satellite-based estimates of tropical rainfall. Bull. Am. Meteorol. Soc. 2000, 81, 2035–2046. [Google Scholar] [CrossRef]
- Funk, C.; Peterson, P.; Landsfeld, M.; Pedreros, D.; Verdin, J.; Shukla, S.; Husak, G.; Rowland, J.; Harrison, L.; Hoell, A. The climate hazards infrared precipitation with stations—A new environmental record for monitoring extremes. Sci. Data 2015, 2, 150066. [Google Scholar] [CrossRef] [PubMed]
- Joyce, R.J.; Janowiak, J.E.; Arkin, P.A.; Xie, P. CMORPH: A method that produces global precipitation estimates from passive microwave and infrared data at high spatial and temporal resolution. J. Hydrometeorol. 2004, 5, 487–503. [Google Scholar] [CrossRef]
- Ushio, T.; Sasashige, K.; Kubota, T.; Shige, S.; Okamoto, K.; Aonashi, K.; Inoue, T.; Takahashi, N.; Iguchi, T.; Kachi, M.; et al. A Kalman Filter Approach to the Global Satellite Mapping of Precipitation (GSMaP) from Combined Passive Microwave and Infrared Radiometric Data. J. Meteorol. Soc. Jpn. 2009, 87A, 137–151. [Google Scholar] [CrossRef]
- Wu, H.; Adler, R.F.; Tian, Y.; Huffman, G.J.; Li, H.; Wang, J.J. Real-time global flood estimation using satellite-based precipitation and a coupled land surface and routing model. Water Resour. Res. 2014, 50, 2693–2717. [Google Scholar] [CrossRef]
- Shen, Y.; Xiong, A.; Wang, Y.; Xie, P. Performance of high-resolution satellite precipitation products over China. J. Geophys. Res. Atmos. 2010, 115. [Google Scholar] [CrossRef]
- Meng, J.; Li, L.; Hao, Z.; Wang, J.; Shao, Q. Suitability of TRMM satellite rainfall in driving a distributed hydrological model in the source region of Yellow River. J. Hydrol. 2014, 509, 320–332. [Google Scholar] [CrossRef]
- Li, Z.; Yang, D.; Gao, B.; Jiao, Y.; Hong, Y.; Xu, T. Multiscale Hydrologic Applications of the Latest Satellite Precipitation Products in the Yangtze River Basin using a Distributed Hydrologic Model. J. Hydrometeorol. 2015, 16, 407–426. [Google Scholar] [CrossRef]
- Li, C.; Tang, G.; Hong, Y. Cross-Evaluation of Ground-based, Multi-Satellite and Reanalysis Precipitation Products: Applicability of the Triple Collocation Method across Mainland China. J. Hydrol. 2018, 562, 71–83. [Google Scholar] [CrossRef]
- Guo, H.; Chen, S.; Bao, A.; Behrangi, A.; Hong, Y.; Ndayisaba, F.; Hu, J.; Stepanian, P.M. Early assessment of integrated multi-satellite retrievals for global precipitation measurement over China. Atmos. Res. 2016, 176, 121–133. [Google Scholar] [CrossRef]
- Bitew, M.M.; Gebremichael, M. Evaluation of satellite rainfall products through hydrologic simulation in a fully distributed hydrologic model. Water Resour. Res. 2011, 47. [Google Scholar] [CrossRef]
- Villarini, G.; Mandapaka, P.V.; Krajewski, W.F.; Moore, R.J. Rainfall and sampling uncertainties: A rain gauge perspective. J. Geophys. Res. Atmos. 2008, 113. [Google Scholar] [CrossRef]
- Gebremichael, M.; Bitew, M.M.; Hirpa, F.A.; Tesfay, G.N. Accuracy of satellite rainfall estimates in the Blue Nile Basin: Lowland plain versus highland mountain. Water Resour. Res. 2015, 50, 8775–8790. [Google Scholar] [CrossRef]
- Ebert, E.E.; Janowiak, J.E.; Kidd, C. Comparison of Near-Real-Time Precipitation Estimates from Satellite Observations and Numerical Models. Bull. Am. Meteorol. Soc. 2007, 88, 47. [Google Scholar] [CrossRef]
- Porcù, F.; D’Adderio, L.P.; Prodi, F.; Caracciolo, C. Rain drop size distribution over the Tibetan Plateau. Atmos. Res. 2014, 150, 21–30. [Google Scholar] [CrossRef]
- Zheng, D.; Liu, J.; Ye, T.; Chiogna, G.; Disse, M. Evaluation of eight high spatial resolution gridded precipitation products in Adige Basin (Italy) at multiple temporal and spatial scales. Sci. Total Environ. 2016, 573, 1536–1553. [Google Scholar]
- Gebregiorgis, A.S.; Tian, Y.; Peters-Lidard, C.D.; Hossain, F. Tracing hydrologic model simulation error as a function of satellite rainfall estimation bias components and land use and land cover conditions. Water Resour. Res. 2012, 48, 11509. [Google Scholar] [CrossRef]
- Yong, B.; Wang, J.; Ren, L.; You, Y.; Xie, P.; Hong, Y. Evaluating Four Multi-satellite Precipitation Estimates over Diaoyu Islands during Typhoon Seasons. J. Hydrometeorol. 2016, 17. [Google Scholar] [CrossRef]
- Harris, A.; Rahman, S.; Hossain, F.; Yarborough, L.; Bagtzoglou, A.C.; Easson, G. Satellite-based Flood Modeling Using TRMM-based Rainfall Products. Sensors 2007, 7, 3416–3427. [Google Scholar] [CrossRef] [PubMed]
- Li, D.; Christakos, G.; Ding, X.; Wu, J. Adequacy of TRMM satellite rainfall data in driving the SWAT modelling of Tiaoxi catchment (Taihu lake basin, China). J. Hydrol. 2018, 556, 1139–1152. [Google Scholar] [CrossRef]
- Xu, R.; Tian, F.; Yang, L.; Hu, H.; Lu, H.; Hou, A. Ground Validation of GPM IMERG and TRMM 3B42V7 Rainfall Products over Southern Tibetan Plateau Based on a High-Density Rain-Gauge Network. J. Geophys. Res. Atmos. 2017, 122, 910–924. [Google Scholar] [CrossRef]
- Sun, R.; Yuan, H.; Liu, X.; Jiang, X. Evaluation of the latest satellite–gauge precipitation products and their hydrologic applications over the Huaihe River basin. J. Hydrol. 2016, 536, 302–319. [Google Scholar] [CrossRef]
- Gao, Z.; Long, D.; Tang, G.; Zeng, C.; Huang, J.; Hong, Y. Assessing the potential of satellite-based precipitation estimates for flood frequency analysis in ungauged or poorly gauged tributaries of China’s Yangtze River basin. J. Hydrol. 2017, 550, 478–496. [Google Scholar] [CrossRef]
- Tong, K.; Su, F.; Yang, D.; Hao, Z. Evaluation ofsatellite precipitation retrievals and their potential utilities in hydrologic modeling over the Tibetan Plateau. J. Hydrol. 2014, 519, 423–437. [Google Scholar] [CrossRef]
- Yong, B.; Ren, L.L.; Hong, Y.; Wang, J.H.; Gourley, J.J.; Jiang, S.H.; Chen, X.; Wang, W. Hydrologic evaluation of Multisatellite Precipitation Analysis standard precipitation products in basins beyond its inclined latitude band: A case study in Laohahe basin, China. Water Resour. Res. 2010, 46. [Google Scholar] [CrossRef]
- Xue, X.; Hong, Y.; Limaye, A.S.; Gourley, J.J.; Huffman, G.J.; Khan, S.I.; Dorji, C.; Chen, S. Statistical and hydrological evaluation of TRMM-based Multi-satellite Precipitation Analysis over the Wangchu Basin of Bhutan: Are the latest satellite precipitation products 3B42V7 ready for use in ungauged basins? J. Hydrol. 2013, 499, 91–99. [Google Scholar] [CrossRef]
- Shi, X.; Yu, D.; Gao, P.; Wang, H.; Sun, W.; Zhao, Y.; Gong, Z. Soil information system of China (SISChina) and its application. Soils 2007, 39, 329–333. [Google Scholar]
- Ma, J.; Sun, W.; Yang, G.; Zhang, D. Hydrological Analysis using Satellite Remote Sensing Big Data and CREST Model. IEEE Access 2018, 6, 9006–9016. [Google Scholar] [CrossRef]
- Shen, Y.; Xiong, A. Validation and comparison of a new gauge-based precipitation analysis over mainland China. Int. J. Climatol. 2016, 36, 252–265. [Google Scholar] [CrossRef]
- Xie, P.; Chen, M.; Yang, S.; Yatagai, A.; Hayasaka, T.; Fukushima, Y.; Liu, C. A gauge-based analysis of daily precipitation over East Asia. J. Hydrometeorol. 2007, 8, 607–626. [Google Scholar] [CrossRef]
- Chen, M.; Shi, W.; Xie, P.; Silva, V.B.S.; Kousky, V.E.; Wayne Higgins, R.; Janowiak, J.E. Assessing objective techniques for gauge-based analyses of global daily precipitation. J. Geophys. Res. Atmos. 2008, 113. [Google Scholar] [CrossRef]
- Joyce, R.J.; Xie, P.; Yarosh, Y.; Janowiak, J.E.; Arkin, P.A. CMORPH: A “Morphing” Approach for High Resolution Precipitation Product Generation. In Satellite Rainfall Applications for Surface Hydrology; Springer: Berlin, Germany, 2010; pp. 23–37. [Google Scholar]
- Xie, P.; Xiong, A.Y. A conceptual model for constructing high-resolution gauge-satellite merged precipitation analyses. J. Geophys. Res. Atmos. 2011, 116. [Google Scholar] [CrossRef]
- Verdin, J.; Funk, C.; Senay, G.; Choularton, R. Climate science and famine early warning. Philos. Trans. R. Soc. B 2005, 360, 2155–2168. [Google Scholar] [CrossRef] [PubMed]
- Wang, J.; Hong, Y.; Li, L.; Gourley, J.J.; Khan, S.I.; Yilmaz, K.K.; Adler, R.F.; Policelli, F.S.; Habib, S.; Irwn, D.; et al. The coupled routing and excess storage (CREST) distributed hydrological model. Hydrol. Sci. J. 2011, 56, 84–98. [Google Scholar] [CrossRef]
- Tang, G.; Ma, Y.; Long, D.; Zhong, L.; Hong, Y. Evaluation of GPM Day-1 IMERG and TMPA Version-7 legacy products over Mainland China at multiple spatiotemporal scales. J. Hydrol. 2016, 533, 152–167. [Google Scholar] [CrossRef]
- Khan, S.I.; Adhikari, P.; Hong, Y.; Vergara, H.; Adler, R.; Policelli, F.; Irwin, D.; Korme, T.; Okello, L. Hydroclimatology of Lake Victoria region using hydrologic model and satellite remote sensing data. Hydrol. Earth Syst. Sci. 2011, 15, 107–117. [Google Scholar] [CrossRef]
- Khan, S.I.; Hong, Y.; Wang, J.; Yilmaz, K.K.; Gourley, J.J.; Adler, R.F.; Brakenridge, G.R.; Policelli, F.; Habib, S.; Irwin, D. Satellite remote sensing and hydrologic modeling for flood inundation mapping in Lake Victoria basin: Implications for hydrologic prediction in ungauged basins. IEEE Geosci. Remote Sens. 2011, 49, 85–95. [Google Scholar] [CrossRef]
- Shen, X.; Hong, Y.; Zhang, K.; Hao, Z. Refining a distributed linear reservoir routing method to improve performance of the CREST model. J. Hydrol. Eng. 2016, 22, 04016061. [Google Scholar] [CrossRef]
- Duan, Q.; Sorooshian, S.; Gupta, V. Effective and efficient global optimization for conceptual rainfall-runoff models. Water Resour. Res. 1992, 28, 1015–1031. [Google Scholar] [CrossRef]
- Kan, G.; Liang, K.; Li, J.; Ding, L.; He, X.; Hu, Y.; Amo-Boateng, M. Accelerating the SCE-UA global optimization method based on multi-core CPU and many-core GPU. Adv. Meteorol. 2016, 2016, 8483728. [Google Scholar] [CrossRef]
- Tang, G.; Long, D.; Hong, Y.; Gao, J.; Wan, W. Documentation of multifactorial relationships between precipitation and topography of the Tibetan Plateau using spaceborne precipitation radars. Remote Sens. Environ. 2018, 208, 82–96. [Google Scholar] [CrossRef]
- Lu, X.; Tang, G.; Wei, M.; Yang, L.; Zhang, Y. Evaluation of multi-satellite precipitation products in Xinjiang, China. Int. J. Remote Sens. 2018, 39, 7437–7462. [Google Scholar] [CrossRef]
- Ebrahimi, S.; Chen, C.; Chen, Q.; Zhang, Y.; Ma, N.; Zaman, Q. Effects of temporal scales and space mismatches on the TRMM 3B42 v7 precipitation product in a remote mountainous area. Hydrol. Process. 2017, 31, 4315–4327. [Google Scholar] [CrossRef]
- Tian, Y.; Peters-Lidard, C.D.; Eylander, J.B.; Joyce, R.J.; Huffman, G.J.; Adler, R.F.; Hsu, K.L.; Turk, F.J.; Garcia, M.; Zeng, J. Component analysis of errors in satellite-basd precipitation estimates. J. Geophys. Res. Atmos. 2009, 114. [Google Scholar] [CrossRef]
© 2018 by the authors. Licensee MDPI, Basel, Switzerland. This article is an open access article distributed under the terms and conditions of the Creative Commons Attribution (CC BY) license (http://creativecommons.org/licenses/by/4.0/).