Article

Comparison of TMPA-3B42RT Legacy Product and the Equivalent IMERG Products over Mainland China

1
School of Geographic and Oceanographic Sciences, Nanjing University, Nanjing 210023, China
2
Fenner School of Environment and Society, Australian National University, Canberra, ACT 0200, Australia
*
Author to whom correspondence should be addressed.
Remote Sens. 2018, 10(11), 1778; https://doi.org/10.3390/rs10111778
Submission received: 24 October 2018 / Revised: 3 November 2018 / Accepted: 3 November 2018 / Published: 9 November 2018
(This article belongs to the Special Issue Remote Sensing of Precipitation)

Abstract

:
The near-real-time legacy product of Tropical Rainfall Measuring Mission Multi-satellite Precipitation Analysis (3B42RT) and the equivalent products of Integrated Multi-satellite Retrievals for Global Precipitation Measurement mission (IMERG-E and IMERG-L) were evaluated and compared over Mainland China from 1 January 2015 to 31 December 2016 at the daily timescale, against rain gauge measurements. Results show that: (1) Both 3B42RT and IMERG products overestimate light rain (0.1–9.9 mm/day), while underestimate moderate rain (10.0–24.9 mm/day) to heavy rainstorm (≥250.0 mm/day), with an increase in mean (absolute) error and a decrease in relative mean absolute error (RMAE). The IMERG products perform better in estimating light rain to heavy rain (25.0–49.9 mm/day), and heavy rainstorm, while 3B42RT has smaller error magnitude in estimating light rainstorm (50.0–99.9 mm/day) and moderate rainstorm (100.0–249.9 mm/day). (2) Higher rainfall intensity associates with better detection. Threshold values are <2.0 mm/day, below which 3B42RT is unreliable at detecting rain; and <1.0 mm/day, below which both 3B42RT and IMERG products are more likely to cause false alarms. (3) Generally, both 3B42RT and IMERG products perform better in wet areas with relatively heavy rainfall intensity and/or during wet season than in dry areas with relatively light rainfall intensity and/or during dry season. Compared with 3B42RT, IMERG-E and IMERG-L constantly improve performance in space and time, but it is not obvious in dry areas and/or during dry season. The agreement between IMERG products and rain gauge measurements is low and even negative for different rainfall intensities, and the RMAE is still at a high level (>50%), indicating the IMERG products remain to be improved. This study will shed light on research and application during the transition in multi-satellite rainfall products from TMPA to IMERG and future algorithms improvement.

Graphical Abstract

1. Introduction

Accurate and timely knowledge of when, where and how much rain falls is essential to water resource management, natural hazard monitoring and decision support [1,2,3]. Despite its importance, rainfall measurement at high resolution across regional and global scale remains a challenge for scientific community [4,5]. Common approaches for measuring rainfall are rain gauges, weather radars and satellite-based sensors [6]. Rain gauges provide direct physical measurements of surface rainfall at specific sites. While areal rainfall estimates may be obtained by interpolating rain gauge measurements, the accuracy of rainfall estimates is largely areas with dense rain gauge network coverage. However, such networks are not feasible in the vast expanses of oceanic, desert and mountainous areas, and sparsely distributed in remote regions [7,8,9]. Weather radars estimate rainfall from reflectivity signal strength via hydrometeors (i.e., raindrops and ices) that result in surface rainfall, within ~250 km distance of the station in minutes [10]. However, some deficiencies also remain, such as beam blockage in mountains, and limited spatial coverage [11,12].
Satellite-based sensors have become a viable approach to address the problem of comprehensive rainfall coverage. In recent years, some algorithms have been developed to combine the respective advantages of the range available satellite sensors for estimating rainfall, namely geostationary-orbit infrared (geo-IR) sensors, low-Earth-orbit passive microwave (leo-PMW) sensors, and precipitation radars (PR) [13,14]. Many quasi-global satellite rainfall products with various temporal and spatial resolutions have been released to the public, such as the Tropical Rainfall Measuring Mission (TRMM) Multi-satellite Precipitation Analysis (TMPA) [15], the Precipitation Estimation from Remotely Sensed Information using Artificial Neural Networks (PERSIANN) [16], the Climate Prediction Center Morphing (CMORPH) technique [17], and the Integrated Multi-satellite Retrievals for Global Precipitation Measurement (GPM) mission (IMERG) [4].
The TRMM satellite was launched on 27 November 1997 as the first Earth Science mission dedicated to studying tropical and subtropical rainfall. TMPA was intended to provide the best multi-satellite rainfall estimates in TRMM-era, and has undergone three upgrades (i.e., Versions 5, 6 and 7) since its inception as results of new sensors integration and upgrades to retrieval algorithms [18]. After over 17 years of productive data gathering, the Precipitation Radar (PR, 13.8 GHz) and TRMM Microwave Imager (TMI, 10.65, 19.35, 37.0 and 85.5 GHz at dual polarization, and 22.235 GHz at single polarization) aboard TRMM satellite were decommissioned in October 2014 and April 2015, respectively. Nevertheless, the TMPA continues to produce merged multi-satellite rainfall analyses until the equivalent IMERG products are deemed satisfactory [19]. The GPM Core Observatory was launched on 27 February, 2014, designed to unify and advance rainfall measurement from a constellation of research and operational satellites. The GPM Core Observatory carries the first space-borne Ku-band and Ka-band (13 and 35 GHz) Dual-frequency Precipitation Radar (DPR) and a multi-channel (10–183 GHz) GPM Microwave Imager (GMI), which extend the measurement range attained by TRMM to include light-intensity rainfall (i.e., <0.5 mm/h) and snowfall [4].
There have been a multitude of statistical and hydrological studies evaluating and comparing the performance of TMPA and IMERG products on varying surface backgrounds, latitudes, elevations and seasons. Kim et al. [20] demonstrated that IMERG “final” product (hereinafter referred to as IMERG-F) performs ~8% better than TMPA-3B42V7 during the pre-monsoon and monsoon seasons over far-east Asia. Xu et al. [21] showed that IMERG-F performs better than 3B42V7 in high-elevation region while the opposite is true in low-elevation regions over southern Tibetan Plateau. Tang et al. [22] found that IMERG-F performs better than 3B42V7 legacy product at mid- and high-latitudes, as well as dry climate regions over Mainland China. Prakash et al. [1] indicated IMERG-F shows a notable improvement in detecting heavy rainfall event frequency across India at a daily time scale during the southwest monsoon season over 3B42V7. The above research results provide important insights into the performance of the TMPA and IMERG research quality products, as well as their suitability for hydrological applications. However, the near-real-time TMPA legacy product (currently Version 7) and the equivalent IMERG products (currently Version 5) remain largely unstudied. It is necessary to investigate the products’ performance, which will shed light on research and application during the transition from TMPA to IMERG, and future algorithm improvement.
The objective of this study was to conduct a thorough quantitative evaluation of the performance near-real-time products from TMPA and IMERG over the common overlap period between TRMM and GPM eras. We specifically evaluated TMPA-3B42RT legacy product and the equivalent IMERG products (see Section 2.2) over Mainland China between 1 January 2015 and 31 December 2016. We conducted our evaluation of daily aggregated quantities against data from rain gauge measurements, to see whether the shifts in input data and algorithms impact on the product’s performance. We specifically focused on the dependence of product’s performance for different levels of rainfall intensity.

2. Materials and Methods
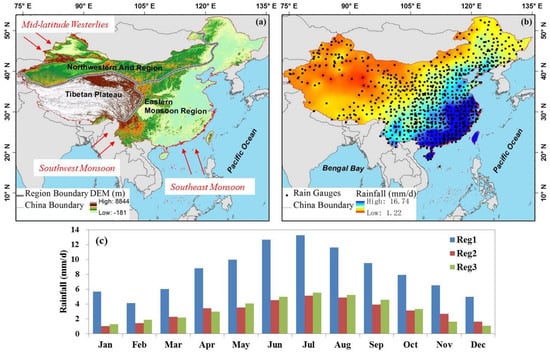
2.1. Study Area

The study area is Mainland China, located within 73°–135°E and 18°–53°N (Figure 1). The landscape of Mainland China includes alluvial plains in the east, hills and low mountains in the south, high mountains in the west, and high plateaus in the north. The climate of Mainland China includes from tropical in the far south, subarctic in the far north, and alpine in the Tibetan Plateau. The diverse topography and climate make Mainland China a good test-bed for evaluating the performance of satellite rainfall products, as these factors affect the accuracy of the retrieval methods.
Mainland China is divided into three sub-regions based on topographic and climatic features: the Eastern Monsoon Region (Reg1), the Northwestern Arid Region (Reg2) and the Tibetan Plateau (Reg3) [23]. Reg1 is primarily controlled by the East Asian monsoon, with warm and wet summers caused by summer monsoon, and cold and dry winters caused by the Siberian High. Reg2 is influenced by the temperate continental climate, with annual rainfall from ~400 mm (semi-arid climate) in the east to <200 mm (arid climate) in the west, mostly concentrated in summer [24]. Reg3 is dominated by the plateau mountain climate, characterized by high elevation, complex topography and variable climate.

2.2. TMPA-3B42RT Legacy Product and the Equivalent IMERG Products

Figure 2 shows the flowcharts of TMPA and IMERG near-real-time rainfall estimation algorithms. The common feature in both workflows is that brightness temperature (Tb) observations from all available PMW sensors are calibrated using the TMI or GMI as reference. These data are subsequently calibrated to combined microwave imager and PR, i.e., TRMM Combined Instrument (TCI) product or GPM Combined Radar-Radiometer (CORRA) product. These PMW estimates are then combined into 3-hourly or half-hourly rainfall fields for each near-real-time product, respectively.
For the TMPA-3B42RT algorithm, calibrated geo-IR Tb are converted to geo-IR estimates, and then combined with PMW estimates into TMPA-3B42RT product (hereinafter referred to as 3B42RT) with ~8 h latency and 0.25°/3 h resolution over the latitudes 50°N–50°S.
For the IMERG algorithm, the calibrated geo-IR Tb are provided to both the PERSIANN-Cloud Classification System (PERSIANN-CCS) [25] and CMORPH-Kalman Filter (CMORPH-KF) [26] algorithms. PERSIANN-CCS is designed to improve the relationship between geo-IR Tb and rainfall rate. The Tb field is segmented into separable cloud patches, and then classified into different groups based on the similarities of patch features. Every group is specified a cloud rainfall function by a training set of PMW estimates, using histogram-matching and exponential regression to derive the parameters. CMORPH-KF is developed to mitigate the gaps in PMW coverage by propagating the instantaneous PMW estimates though time to the closest analysis time (within a 90-min window) using cloud motion vectors computed from consecutive geo-IR images. This approach is run once forward in time to generate the near-real-time IMERG “Early” run estimates (hereinafter referred to as IMERG-E), and then both forward and backward in time for the IMERG “Late” run estimates (hereinafter referred to as IMERG-L). IMERG-E and –L have latencies of ~4 h and ~12 h, respectively. Products are gridded to 0.1°/30-min resolution over the latitudes 60°N–60°S.
The daily 3B42RT legacy product, and the equivalent IMERG-E and IMERG-L from 1 January 2015 to 31 December 2016 were used in this study, downloaded from the Precipitation Measurement Missions website (https://pmm.nasa.gov/data-access/downloads).

2.3. Rain Gauge Measurement

Rain gauge measured rainfalls are normally employed as reference to validate satellite rainfall products [27]. In this study, we used a network of 830 rain gauges (Figure 1b) which provided rainfall measurements from 1 January 2015 to 31 December 2016. Data were obtained from the China Meteorological Data Service Center (http://data.cma.cn/) which is an authoritative and unified shared service platform for China Meteorological Administration [22]. Rain gauges record 24-h accumulated rainfall twice daily, namely, at 08:00 and 20:00 local time, or 00:00 and 12:00 UTC. These data are released three months after the day of interest. To have a consistent definition of daily rainfall between gauge and satellite precipitation products, we chose accumulations to 00:00 UTC. As shown in Figure 1b, the rain gauges are densely spaced in the eastern and southern parts of Mainland China, while sparsely spaced in the northern and western parts, especially in the Tibetan Plateau.

2.4. Methods

Cell values of satellite rainfall products were extracted based on the nearest rain gauge location. For grids with two or more rain gauges, an average of the gauge data was used as reference in the evaluation.
To investigate the performance of satellite rainfall products across different rainfall regimes, rainfall intensity was categorized according to the national standard of China (GB/T 28592-2012) as: light rain (0.1–9.9 mm/day), moderate rain (10.0–24.9 mm/day), heavy rain (25.0–49.9 mm/day), light rainstorm (50.0–99.9 mm/day), moderate rainstorm (100.0–249.9 mm/day) and heavy rainstorm (≥250.0 mm/day).
Seven performance metrics were used to evaluate satellite rainfall products against rain gauge measurements. Metrics are divided into two categories, i.e., continuous and categorical metrics (Table 1). The continuous metrics include correlation coefficient (CC), mean error (ME), mean absolute error (MAE) and relative mean absolute error (RMAE), which are used to measure the accuracy of satellite rainfall estimates. CC denotes the agreement between satellite rainfall estimates and rain gauge measurements. ME describes the systematic error, and can be either positive (denoting overestimation) or negative (denoting underestimation). MAE and RMAE represent the average and relative error magnitude, respectively. The categorical metrics include probability of detection (POD), false alarm ratio (FAR) and critical success index (CSI), which are used to measure the detection capability of satellite rainfall products. POD denotes the fraction of rainfall occurrences that are correctly detected. FAR measures the fraction of detected rainfall events that did not occur [21]. As function of POD and FAR, CSI gives more balanced score. A value of 0.1 mm/day was set for the rain/no rain threshold in calculation of the metrics.

3. Results

3.1. Performance of Satellite Rainfall Products at Different Rainfall Intensities

Continuous metrics for satellite rainfall products for different rainfall intensities over Mainland China are shown in Table 2. For all satellite rainfall products, the CC values were low and even negative (−0.19 to 0.23 for 3B42RT, −0.12 to 0.29 for IMERG-E, and −0.08 to 0.32 for IMERG-L), indicating that overall the satellite rainfall estimates showed a lack of agreement with rain gauge measurements. In other words, there is considerable non-linear error between satellite and rain gauge rainfall [28,29]. The ME showed a clear trend of increasing negative value with increasing rainfall intensity, from a base of relatively small positive values for light rain. The MAE similarly showed a systematic increasing in error with rainfall intensity. The ME and MAE in Table 2 indicated that all satellite rainfall products tended to overestimate light rain, while underestimating moderate rain to heavy rainstorm. In contrast, the RMAE decreased with increasing rainfall intensity as a whole. It is interesting that the IMERG products significantly reduced error magnitude (including MAE and RMAE) in estimating light rainfall compared with 3B42RT, which may be largely because the enhanced sensor characteristics which extend the measurement range over that used in 3B42RT to include light-intensity rainfall and snowfall.
Chen and Li [30] suggested that monthly satellite rainfall estimates are considered reliable when the relative root-mean-square error is less than 50%. Pipunic et al. [29] observed large differences between satellite and rain gauge rainfall, with the satellite rainfall estimates often ranging from twice to less than half that of the rain gauge record. Based on the 50% criteria alone, the results in Table 2 suggest that the estimation accuracy of satellite rainfall products for each rainfall intensity over Mainland China remains a challenge.
Categorical metrics for satellite rainfall products at different rainfall intensities over Mainland China are shown in Table 3 and Table 4. For the detection of rainfall occurrence, POD and FAR continuously improved along with increasing rainfall intensity. Compared with 3B42RT, the IMERG products significantly improved the detection skill in POD for light rain, while performing slightly poorer in FAR. It is worth noting that POD/FAR for light rain was significantly smaller/larger than that for moderate rain to heavy rainstorm. Hence, the prospect of satellite rainfall products detecting rainfall for intensity ≥10.0 mm/day are very good, while light rainfall (<10.0 mm/day) is an issue.
The POD and FAR were calculated for ten 1-mm intervals for rainfall intensity <10.0 mm/day, as shown in Figure 3. Generally, the POD increased with increasing rainfall intensity, in contrast to a decreasing trend for FAR. IMERG-L showed the best performance in detecting rainfall occurrence for each sub-sample, followed by IMERG-E and 3B42RT. We assumed a threshold of 0.5 for POD and FAR to determine whether the satellite rainfall estimates could have acceptable detection capability. It is evident from Figure 3 that for rainfall intensity <2.0 mm/day 3B42RT had little to no skill in detecting rainfall occurrence, and for rainfall intensity <1.0 mm/day both 3B42RT and IMERG products were more likely to cause false alarms.

3.2. Spatial Differences of the Performance of Satellite Rainfall Products

Spatial distributions of metrics for satellite rainfall products over Mainland China are shown in Figure 4. Boxplots of the distribution of the statistics over three sub-regions are shown in Figure 5. The performance of satellite rainfall products has significant spatial differences, especially among sub-regions.
The distributions of CC for three satellite rainfall products were identical in general pattern. The values of the first/third quartiles and upper/lower end of outliers were greatest in Reg1, followed by Reg3 and Reg2. The IMERG-E and IMERG-L constantly improved the agreement with rain gauge measurements compared with 3B42RT (Figure 5a). Besides, the weak and even negative correlation (CC < 0.1) mainly occurred along the junction of Reg2 and Reg3, where are rain shadow deserts formed by the Tibetan Plateau blocking summer monsoon reaching the inland areas (Figure 4a–c). The ME for 3B42RT was generally high over most parts of Mainland China, and characterized by an alternate distribution of positive and negative values in Reg1, and predominantly positive values in Reg2 and Reg3. For IMERG products, positive values mainly located in central and northern Reg1, and positive and negative values were, respectively, dominant in Reg2 and Reg3 (Figure 4d–f and Figure 5b). Figure 4g–i shows that the MAE for all satellite rainfall products gradually decreased from the southeast coast to the northwest inland, showing a similar pattern to the spatial distribution of rainfall intensity (Figure 1b). This phenomenon is reasonable because the MAE increased with increasing rainfall intensity (Table 2). The first/third quartiles and upper/lower end of outliers were closer to the median for IMERG products than that for 3B42RT, and the corresponding values were lower, indicating that IMERG products significantly reduce the average error magnitude compared with 3B42RT (Figure 5c). Similarly, IMERG-E and IMERG-L constantly reduced the relative error magnitude over three sub-regions, but the improvements were not obvious in western Reg2, and the junction of Reg2 and Reg3 (Figure 4j–l). As highlighted in Figure 5d, all satellite rainfall products were unreliable over Mainland China, adopting 50% as threshold for RMAE to determine whether the satellite estimates can be trusted. In terms of CSI, all satellite rainfall products showed higher value in the southeastern and southwestern parts of Mainland China, while lower value in the northwestern part (Figure 4m–o). Figure 5e shows that IMERG products could capture rainfall events better than 3B42RT over Mainland China. Nonetheless, both 3B42RT and IMERG products in Reg2 were more likely to cause misjudgments.

3.3. Temporal Characteristics of the Performance of Satellite Rainfall Products

The daily time series of metrics for satellite rainfall products from 1 January 2015 to 31 December 2016 are shown in Figure 6. All metrics showed symmetrical distribution along the timeline of 1 January 2016 (as indicated by a dashed black line), indicating the performance of satellite rainfall estimates have an annual periodic variation. Furthermore, the metrics generally demonstrated seasonal variation as well.
The CC values for all satellite rainfall products were low and unstable in dry season (October to April), and reached relatively high and stable in wet season (May to September). In general, IMERG-L showed the best agreement with rain gauge measurements, followed by IMERG-E and 3B42RT (Figure 6a–c). 3B42RT was characterized by overestimation, and the systematic error was larger in wet season than in dry season, especially in Reg3. In contrast, IMERG products showed a smaller systematic error (Figure 6d–f). The MAE presented an arched shape with vault in summer (Figure 6g–i). Compared with 3B42RT, the IMERG products significantly reduced average error magnitude, but with obvious differences among seasons and sub-regions. More specifically, the improvements mainly occurred during wet season in Reg1, while throughout the year in Reg2 and Reg3. Figure 6j–l shows that IMERG products outperformed 3B42RT in wet season, while both 3B42RT and IMERG products were violently fluctuant in dry reason. Generally, the use of three satellite rainfall products remains great challenge throughout the year over sub-regions, adopting 50% as threshold for RMAE to determine whether the satellite estimates can be trusted. Figure 6m–o shows temporal patterns of CSI were similar to those of MAE, but the differences among satellite rainfall products were small in each sub-region.

4. Discussion

4.1. Dependence of the Performance of Satellite Rainfall Products

Our evaluation and comparison of 3B42RT and the equivalent IMERG products have provided insights into how different errors vary with observed rainfall intensities, climate zones and rainfall seasonality. Results for the different rainfall bin ranges give a general indication of the likely error characteristics for certain rainfall intensities, that is, satellite rainfall products overestimated light rain, while underestimated moderate rain to heavy rainstorm (Table 2), which is consistent with the study of 3B42RT v7 over Mainland Australia [29]. However, the finding is different with the results in Southeast Asia, which suggested that 3B42, 3B42RT v7 and IMERG-F v4 products underestimate <1.0 mm/day rainfall and overestimate 1.0–20.0 mm/day rainfall over Singapore [31], while 3B42 and 3B42RT v7 products underestimate <1.0 mm/day rainfall and overestimate 1.0–50.0 mm/day rainfall over Malaysia [32]. This highlights the varying performance of satellite rainfall estimates over regions. In this study, the possible reason for overestimating light rainfall is that hydrometeors that are detected by infrared and microwave sensors as well as precipitation radars might partially or even totally be evaporated before they are observed by rain gauges [33,34,35]. Moreover, sensitivity to attenuation in the vertical direction for microwave wavelengths has been reported to result in underestimate heavy-intensity rainfall [36].
Higher rainfall intensity associated with increased mean (absolute) error and decreased relative mean absolute error, which could explain the spatial-temporal distributions of the corresponding metrics to some extent. However, 3B42RT overestimated rainfall over most of Mainland China (Figure 4d–f). Similar results were also seen in the conterminous United States [37]. Amitai et al. [38] indicated that the overestimation is probably due to overcorrection of attenuation by the TRMM PR algorithms.
Furthermore, higher rainfall intensity associated with better detection given the relationships between rainfall intensity and detection capability highlighted in Section 3.1. The results indicate threshold values of <2.0 mm/day, below which 3B42RT is unreliable at detecting rain, and <1.0 mm/day, below which both 3B42RT and IMERG products are more likely to cause false alarms. Recall that, since light rain and snowfall account for significant fractions of rainfall occurrences in middle and high latitudes, a key advancement of GPM over TRMM is the extended capability to measure light-intensity rainfall (i.e., <0.5 mm/h) and solid precipitation, which could lead to the improved probability of detection for IMERG products compared with 3B42RT, as shown in Figure 7a–c. However, it raises false alarms as well (Figure 7d–f), and several factors may contribute to this phenomenon: (1) hydrometeors that are detected by sensors as shallow rainfall might totally be evaporated before they are observed by rain gauges, especially over hot and/or dry regions; and (2) desert and Gobi, with wide distribution in the western Reg2, scatter the upwelling microwave radiation in manner similar to light rain [39], which makes it more likely to detect the signals as rainfall for IMERG products compared with 3B42RT. Based on the analysis of POD and FAR above, it can explain the spatial distributions of CSI.

4.2. Cause of the Performance Differences

In this study, the IMERG products generally performed better than 3B42RT, which could be attributed to the satellite overpasses and sensor capability. As near-real-time systems, the individual satellite overpasses are the basis for data used to estimate instantaneous rainfall rate, and result in data coverage gaps. The PMW Tb have strong physical relationship with hydrometeors, but with poor sampling frequency [20,40]. In contrast, geo-satellites give frequent sampling, while the IR Tb are related to cloud-top features (temperature and albedo) rather than to surface precipitation directly [41,42]. Therefore, PMW estimates are used in preference to IR estimates, meaning that deficiency is minimized in satellite rainfall products.
Recall that 3B42RT draws on data from SSMIS, MHS and geo-IR sensors [19]. Additional GMI, AMSR2, ATMS and SAPHIR sensor data are involved in the IMERG products [43]. That is, the IMERG products narrow PMW coverage gaps compared with 3B42RT. Besides, the CMORPH-KF morphing scheme used in IMERG algorithm interpolates PMW estimates with the cloud motion vectors, which further mitigates the PMW coverage gaps [37].
Furthermore, the PMW estimates are calibrated to TCI or CORRA products, and then provide calibration for geo-IR estimates in the TMPA or IMERG algorithms, respectively. Thus, the time series of the completed data tend to follow that of calibrator. The TCI and CORRA products are derived from post and coincident data, respectively. Experience shows that calibrators computed from coincident data perform better than those from post data (i.e., climatological calibration) [19].

4.3. Uncertainty of the Evaluation Results

As rain gauges measure rainfall directly by physical methods, rain gauge measurements are normally employed as reference to validate satellite rainfall products. However, the rain gauge measurements are subject to errors, due to wind-induced error, wetting loss, evaporation loss and trace amount [44,45]. Besides, rain gauge measurements at point-scale might deviate far from true areal rainfall. Jensen and Pedersen [46] found that variation in accumulated rainfall is up to 100% between neighboring rain gauges within a 500 m × 500 m pixel over a four-day period. Villarini et al. [47] indicated that there is a tendency for the error (averaging the rainfall measurements from rain gauges to represent the true areal rainfall) to decrease for increasing number of rain gauges. There are at most two rain gauges in a 0.25° × 0.25° pixel in this study. Therefore, the rain gauge measurements based on scarce rain gauges could not perfectly represent areal rainfall, and the evaluation results may be impacted by the mismatch between satellite rainfall estimates and rain gauge measurements. It is worth noting that Tang et al. [27] suggested that the actual quality of satellite rainfall estimates could be better than the evaluation results, when using rain gauge measurements at point-scale to evaluate areal satellite rainfall estimates.

5. Conclusions

In this study, we evaluated and compared the performance of the daily 3B42RT legacy product and the equivalent IMERG products, using rainfall data from 830 gauges as reference across Mainland China. We particularly concerned about the accuracy of satellite rainfall estimates at different rainfall intensities, and the spatial-temporal distribution patterns of their performance. The major conclusions are summarized as follows:
(1)
Both 3B42RT and IMERG products overestimated light rain, while underestimated moderate rain to heavy rainstorm, with an increase in mean (absolute) error and a decrease in relative mean absolute error. The 3B42RT had smaller error magnitude in estimating light rainstorm and moderate rainstorm, while the equivalent IMERG products performed better in estimating light rain to heavy rain, and heavy rainstorm.
(2)
Higher rainfall intensity associated with better detection. Threshold values of <2.0 mm/day, below which 3B42RT is unreliable at detecting rain, and <1.0 mm/day, below which both 3B42RT and IMERG products are more likely to cause false alarms, were found.
(3)
Generally, both 3B42RT and IMERG products performed better in wet areas with relatively heavy rainfall intensity and/or during wet season than in dry areas with relatively light rainfall intensity and/or during dry season. Compared with 3B42RT, the IMERG-E and IMERG-L constantly improved the performance in space and time, but it is not obvious in dry areas and/or during dry season.
Our work suggests that IMERG products generally perform better than 3B42RT legacy product during the overlap period, but the agreement between IMERG products and rain gauge measurements is low and even negative for different rainfall intensities, and the RMAE is still at a high level (>50%), indicating that IMERG products remain to be improved. Experiments demonstrated that numerical weather prediction (NWP) models show greatest skill for shallow convection rain and/or in winter [41]. Therefore, an important research focus for future work will be combining the respective advantages of IMERG products (or algorithms) and NWP models [48], to estimate more accurate near-real-time rainfall.

Author Contributions

Conceptualization, L.W.; Formal analysis, L.W.; Funding acquisition, Y.X.; Supervision, Y.X.; Writing—original draft, L.W.; and Writing—review and editing, L.W. and S.W.

Funding

This study was financially supported by the National Key Research and Development Program of China (2016YFC0401502), the National Natural Science Foundation of China (41771032), the Water Conservancy Science and Technology Foundation of Jiangsu Province (2015003) and the State Foundation for Studying Abroad (201706190207).

Acknowledgments

We are very much indebted to Luigi Renzullo for his supervision, review and editing in this research effort. We thank Lingjie Li, Yongqing Bai, Qingfang Hu and Juanle Wang for technical assistance in data processing. We acknowledge the editors and three anonymous reviewers for their insightful and constructive comments which improved the manuscript substantially.

Conflicts of Interest

The authors declare no conflict of interest.

References

  1. Prakash, S.; Mitra, A.K.; Pai, D.S.; AghaKouchak, A. From TRMM to GPM: How well can heavy rainfall be detected from space? Adv. Water Resour. 2016, 88, 1–7. [Google Scholar] [CrossRef]
  2. Tekeli, A.E.; Fouli, H. Evaluation of TRMM satellite-based precipitation indexes for flood forecasting over Riyadh City, Saudi Arabia. J. Hydrol. 2016, 541, 471–479. [Google Scholar] [CrossRef]
  3. Li, D.; Christakos, G.; Ding, X.X.; Wu, J.P. Adequacy of TRMM satellite rainfall data in driving the SWAT modeling of Tiaoxi catchment (Taihu lake basin, China). J. Hydrol. 2018, 556, 1139–1152. [Google Scholar] [CrossRef]
  4. Hou, Y.; Kakar, R.K.; Neeck, S.; Azarbarzin, A.A.; Kummerow, C.D.; Kojima, M.; Oki, R.; Nakamura, K.; Iguchi, T. The global precipitation measurement mission. Bull. Am. Meteorol. Soc. 2014, 95, 701–722. [Google Scholar] [CrossRef]
  5. Guo, H.; Chen, S.; Bao, A.M.; Behrangi, A.; Hong, Y.; Ndayisaba, F.; Hu, J.J.; Stepanian, P.M. Early assessment of Integrated Multi-satellite Retrievals for Global Precipitation Measurement over China. Atmos. Res. 2016, 176–177, 121–133. [Google Scholar] [CrossRef]
  6. Li, Z.; Yang, D.; Hong, Y. Multi-scale evaluation of high-resolution multi-sensor blended global precipitation products over the Yangtze River. J. Hydrol. 2013, 500, 157–169. [Google Scholar] [CrossRef]
  7. Collischonn, B.; Collischonn, W.; Tucci, C.E.M. Daily hydrological modeling in the Amazon basin using TRMM rainfall estimates. J. Hydrol. 2008, 360, 207–216. [Google Scholar] [CrossRef]
  8. Islam, T.; Rico-Ramirez, M.A.; Han, D.W.; Srivastava, P.K.; Ishak, A.M. Performance evaluation of the TRMM precipitation estimation using ground-based radars from the GPM validation network. J. Atmos. Sol.-Terr. Phys. 2012, 77, 194–208. [Google Scholar] [CrossRef]
  9. Pombo, S.; de Oliveira, R.P. Evaluation of extreme precipitation estimates from TRMM in Angola. J. Hydrol. 2015, 523, 663–679. [Google Scholar] [CrossRef]
  10. Mahmoud, M.T.; Al-Zahrani, M.A.; Sharif, H.O. Assessment of global precipitation measurement satellite products over Saudi Arabia. J. Hydrol. 2018, 559, 1–12. [Google Scholar] [CrossRef]
  11. Chappell, A.; Renzullo, L.J.; Raupach, T.H.; Haylock, M. Evaluating geostatistical methods of blending satellite and gauge data to estimate near real-time daily rainfall for Australia. J. Hydrol. 2013, 493, 105–114. [Google Scholar] [CrossRef]
  12. Schneebeli, M.; Dawes, N.; Lehning, M.; Berne, A. High-resolution vertical profiles of X-band polarimetric radar observables during snowfall in the Swiss Alps. J. Appl. Meteorol. Clim. 2013, 52, 378–394. [Google Scholar] [CrossRef]
  13. Kidd, C.; Kniveton, D.R.; Todd, M.C.; Bellerby, T.J. Satellite Rainfall Estimation Using Combined Passive Microwave and Infrared Algorithms. J. Hydrometeorol. 2003, 4, 1088–1104. [Google Scholar] [CrossRef]
  14. Turk, F.J.; Miller, S.D. Toward improved characterization of remotely sensed precipitation regimes with MODIS/AMSR-E blended data techniques. IEEE Trans. Geosci. Remote Sens. 2005, 43, 1059–1069. [Google Scholar] [CrossRef]
  15. Huffman, G.J.; Adler, R.F.; Bolvin, D.T.; Gu, G.J.; Nelkin, E.J.; Bowman, K.P.; Hong, Y.; Stocker, E.F.; Wolff, D.B. The TRMM multi-satellite precipitation analysis (TMPA): Quasi-global, multiyear, combined-sensor precipitation estimates at fine scale. J. Hydrometeorol. 2007, 8, 38–55. [Google Scholar] [CrossRef]
  16. Hsu, K.L.; Gupta, H.V.; Gao, X.G.; Sorooshian, S. Estimation of physical variables from multichannel remotely sensed imagery using a neural network: Application to rainfall estimation. Water Resour. Res. 1999, 35, 1605–1618. [Google Scholar] [CrossRef] [Green Version]
  17. Joyce, R.J.; Janowiak, J.E.; Arkin, P.A.; Xie, P.P. CMORPH: A method that produces global precipitation estimates from passive microwave and infrared data at high spatial and temporal resolution. J. Hydrometeorol. 2004, 5, 487–503. [Google Scholar] [CrossRef]
  18. Yong, B.; Liu, D.; Gourley, J.J.; Tian, Y.D.; Huffman, G.J.; Ren, L.L.; Hong, Y. Global view of real-time TRMM Multisatellite Precipitation Analysis: Implications for its successor Global Precipitation Measurement Mission. Bull. Am. Meteorol. Soc. 2015, 96, 1–15. [Google Scholar] [CrossRef]
  19. Huffman, G.J.; Bolvin, D.T. Real-Time TRMM Multi-Satellite Precipitation Analysis Data Set Documentation. NASA Goddard Space Flight Center. Available online: https://pmm.nasa.gov/sites/default/files/document_files/3B4XRT_doc_V7_180426.pdf (accessed on 28 May 2018).
  20. Kim, K.Y.; Park, J.M.; Baik, J.J.; Choi, M.H. Evaluation of topographical and seasonal feature using GPM IMERG and TRMM 3B42 over Far-East Asia. Atmos. Res. 2017, 187, 95–105. [Google Scholar] [CrossRef]
  21. Xu, R.; Tian, F.Q.; Yang, L.; Hu, H.C.; Lu, H.; Hou, A.Z. Ground validation of GPM IMERG and TRMM 3B42V7 rainfall products over southern Tibetan Plateau based on a high-density rain gauge network. J. Geophys. Res. Atmos. 2017, 122, 1–15. [Google Scholar] [CrossRef]
  22. Tang, G.Q.; Ma, Y.Z.; Long, D.; Zhong, L.Z.; Hong, Y. Evaluation of GPM Day-1 IMERG and TMPA Version-7 legacy products over Mainland China at multiple spatiotemporal scales. J. Hydrol. 2016, 533, 152–167. [Google Scholar] [CrossRef]
  23. Zhao, S.Q. A new scheme for comprehensive physical regionalization in China. Acta Geogr. Sin. 1983, 38, 1–10. [Google Scholar]
  24. Bothe, O.; Fraedrich, K.; Zhu, X.H. Precipitation climate of Central Asia and the large-scale atmospheric circulation. Theor. Appl. Climatol. 2012, 108, 345–354. [Google Scholar] [CrossRef]
  25. Hong, Y.; Hsu, K.L.; Sorooshian, S.; Gao, X. Precipitation estimation from remotely sensed imagery using an Artificial Neural Network Cloud Classification System. J. Appl. Meteorol. 2004, 43, 1834–1852. [Google Scholar] [CrossRef]
  26. Joyce, R.J.; Xie, P.P. Kalman Filter-based CMORPH. J. Hydrometeorol. 2011, 12, 1547–1563. [Google Scholar] [CrossRef]
  27. Tang, G.Q.; Behrangi, A.; Long, D.; Li, C.M.; Hong, Y. Accounting for spatiotemporal errors of gauges: A critical step to evaluate gridded precipitation products. J. Hydrol. 2018, 559, 294–306. [Google Scholar] [CrossRef]
  28. Hong, Y.; Hsu, K.L.; Moradkhani, H.; Sorooshian, S. Uncertainty quantification of satellite precipitation estimation and Monte Carlo assessment of the error propagation into hydrologic response. Water Resour. Res. 2006, 42, 1–15. [Google Scholar] [CrossRef]
  29. Pipunic, R.C.; Ryu, D.; Costelloe, J.F.; Su, C.H. An evaluation and regional error modeling methodology for near-real-time satellite rainfall data over Australia. J. Geophys. Res. Atmos. 2015, 120, 10767–10783. [Google Scholar] [CrossRef]
  30. Chen, F.R.; Li, X. Evaluation of IMERG and TRMM 3B43 monthly precipitation products over Mainland China. Remote Sens. 2016, 8, 472. [Google Scholar] [CrossRef]
  31. Tan, M.L.; Duan, Z. Assessment of GPM and TRMM Precipitation Products over Singapore. Res. Atmos. 2017, 9, 720. [Google Scholar] [CrossRef]
  32. Tan, M.L.; Ibrahim, A.L.; Duan, Z.; Cracknell, A.P.; Chaplot, V. Evaluation of six high-resolution satellite and ground-based precipitation products over Malaysia. Remote Sens. 2015, 7, 1504–1528. [Google Scholar] [CrossRef]
  33. Villarini, G.; Krajewski, W.F. Evaluation of the research version TMPA three hourly 0.25°×0.25° rainfall estimates over Oklahoma. Geophys. Res. Lett. 2007, 34, 1–5. [Google Scholar] [CrossRef]
  34. Chen, S.; Hong, Y.; Cao, Q.; Gourley, J.J.; Kirstetter, P.E.; Yong, B.; Tian, Y.D.; Zhang, Z.X.; Shen, Y.; Hu, J.J.; et al. Similarity and difference of the two successive V6 and V7 TRMM multisatellite precipitation analysis performance over China. J. Geophys. Res. Atmos. 2013, 118, 13060–13074. [Google Scholar] [CrossRef]
  35. Zhao, H.G.; Yang, B.G.; Yang, S.T.; Huang, Y.C.; Dong, G.T.; Bai, J.; Wang, Z.W. Systematical estimation of GPM-based global satellite mapping of precipitation products over China. Atmos. Res. 2018, 201, 206–217. [Google Scholar] [CrossRef]
  36. Zhao, H.G.; Yang, S.T.; Wang, Z.W.; Zhou, X.; Luo, Y.; Wu, L.N. Evaluating the suitability of TRMM satellite rainfall data for hydrological simulation using a distributed hydrological model in the Weihe River catchment in China. J. Geogr. Sci. 2015, 25, 177–195. [Google Scholar] [CrossRef]
  37. Gebregiorgis, A.S.; Kirstetter, P.E.; Hong, Y.E.; Gourley, J.J.; Huffman, G.J.; Petersen, W.A.; Xue, X.W.; Schwaller, M.R. To what extent is the day 1 GPM IMERG satellite precipitation estimate improved as compared to TRMM TMPART? J. Geophys. Res. Atmos. 2018, 123, 1694–1707. [Google Scholar]
  38. Amitai, E.; Liort, X.; Liao, L.; Meneghini, R. A framework for global verification of space-borne radar estimates of precipitation based on rain type classification. In Proceedings of the 2nd TRMM International Science Conference, Nara, Japan, 6–10 September 2004. [Google Scholar]
  39. Grody, N.C.; Weng, F.Z. Microwave emission and scattering from deserts: Theory compared with satellite measurements. IEEE Trans. Geosci. Remote Sens. 2008, 46, 361–375. [Google Scholar] [CrossRef]
  40. Kidd, C.; Levizzani, V. Status of satellite precipitation retrievals. Hydrol. Earth Syst. Sci. 2011, 15, 1109–1116. [Google Scholar] [CrossRef] [Green Version]
  41. Pretty, G.W. The status of satellite-based rainfall estimation over land. Remote Sens. Environ. 1995, 51, 125–137. [Google Scholar] [CrossRef]
  42. Ebert, E.E.; Janowiak, J.E.; Kidd, C. Comparison of near-real-time precipitation estimates from satellite observations and numerical models. Bull. Am. Meteorol. Soc. 2007, 88, 1–18. [Google Scholar] [CrossRef]
  43. Huffman, G.J.; Bolvin, D.T.; Nelkin, E.J. Integrated Multi-Satellite Retrievals for GPM (IMERG) Technical Documentation. NASA Goddard Space Flight Center. Available online: https://pmm.nasa.gov/sites/default/files/document_files/IMERG_doc_180207.pdf (accessed on 28 May 2018).
  44. Adam, J.C.; Lettenmaier, D.P. Adjustment of global gridded precipitation for systematic bias. J. Geophys. Res. Atmos. 2003, 108, 1–9. [Google Scholar] [CrossRef]
  45. Ma, Y.Z.; Zhang, Y.S.; Yang, D.Q.; Farhan, S.B. Precipitation bias variability versus various gauges under different climatic conditions over the Third Pole Environment (TPE) region. Int. J. Climatol. 2015, 35, 1201–1211. [Google Scholar] [CrossRef]
  46. Jensen, N.E.; Pedersen, L. Spatial variability of Rainfall: Variations within a single radar pixel. Atmos. Res. 2005, 77, 269–277. [Google Scholar] [CrossRef]
  47. Villarini, G.; Mandapaka, P.V.; Krajewski, W.F.; Moore, R.J. Rainfall and sampling errors: A rain gauge perspective. J. Geophys. Res. Atmos. 2008, 113, 1–12. [Google Scholar] [CrossRef]
  48. Zhang, X.X.; Anagnostou, E.N.; Schwartz, C.S. NWP-based adjustment of IMERG precipitation for flood-inducing complex terrain storms: evaluation over CONUS. Remote Sens. 2018, 10, 642. [Google Scholar] [CrossRef]
Figure 1. Study area of the evaluation of TMPA-3B42RT legacy product and the equivalent IMERG products: (a) terrain elevation and sub-regions; (b) rain gauge network (830 gauges) overlaid on a grid of daily average rainfall; and (c) monthly average daily rainfall, based on rain gauge measurements from 2015 to 2016.
Remotesensing 10 01778 g001
Figure 2. Flowcharts of: (a) TMPA-3B42RT algorithm; and (b) IMERG algorithm. The dashed boxes indicate the profiles were terminated since October 2014, and the calibrator for HQ shifted from using coincident data to past data.
Remotesensing 10 01778 g002
Figure 3. (a) POD; and (b) FAR for satellite rainfall products at rainfall intensity <10.0 mm/day.
Remotesensing 10 01778 g003
Figure 4. Spatial distributions of metrics for satellite rainfall products over Mainland China: (ac) CC; (df) ME; (gi) MAE; (jl) RMAE; and (mo) CSI.
Remotesensing 10 01778 g004
Figure 5. Boxplots of metrics for satellite rainfall products over three sub-regions: (a) CC; (b) ME; (c) MAE; (d) RMAE; and (e) CSI. The boxes indicate the 25th, 50th, and 75th percentiles of the distribution, and the vertical lines indicate the 5th and 95th percentiles. Note that some metric values are beyond the scope of vertical axis.
Remotesensing 10 01778 g005
Figure 6. Daily time series of metrics for satellite rainfall products over sub-regions from 1 January 2015 to 31 December 2016: (ac) CC; (df) ME; (gi) MAE; (jl) RMAE; and (mo) CSI. Note that some metric values are beyond the scope of vertical axis.
Remotesensing 10 01778 g006
Figure 7. Spatial distributions of metrics for satellite rainfall products over Mainland China: (ac) POD; and (df) FAR.
Remotesensing 10 01778 g007
Table 1. List of the metrics used to quantify the performance of satellite rainfall products.
MetricsEquationPerfect ValueUnit
Correlation Coefficient C C = i = 1 n ( E i E ¯ ) ( G i G ¯ ) i = 1 n ( E i E ¯ ) 2 i = 1 n ( G i G ¯ ) 2 1NA
Mean Error M E = 1 n i = 1 n ( E i G i ) 0mm
Mean Absolute Error M A E = 1 n i = 1 n | E i G i | 0mm
Relative Mean Absolute Error R M A E = M A E G ¯ × 100 % 0%
Probability of Detection P O D = H i t s H i t s + M i s s e s 1NA
False Alarm Ratio FAR = F a l s e H i t s + F a l s e 0NA
Critical Success Index C S I = H i t s H i t s + M i s s e s + F a l s e 1NA
where n is the number of samples; E i is the estimate; G i is the observation; G ¯ is the mean observation; Hits is the number of observed rainfall that are detected; Misses is the number of observed rainfall that are not detected; False is the number of rainfall that are detected but there is no observed rainfall.
Table 2. Continuous metrics for satellite rainfall products at different rainfall intensities.
Observation (mm/day)3B42RTIMERG-EIMERG-L
CCMEMAERMAECCMEMAERMAECCMEMAERMAE
0.1–9.90.232.134.89190.230.291.053.51136.880.320.903.32129.69
10.0–24.90.15−0.6613.9688.800.16−2.8511.5873.660.17−2.8311.3071.89
25.0–49.90.15−6.7222.8766.520.14−10.3321.3862.210.15−10.1921.0461.23
50.0–99.90.17−19.7436.3755.030.14−26.1937.5456.810.15−25.7237.0756.10
100.0–249.90.20−58.2671.7153.130.20−66.0776.0756.350.19−65.3776.2356.47
≥250.0-0.19−201.02201.0265.92−0.12−180.68190.0062.30−0.08−184.26186.5161.16
Table 3. POD for satellite rainfall products at different rainfall intensities.
Observation (mm/day)Hits + MissesHitsPOD
3B42RTIMERG-EIMERG-L3B42RTIMERG-EIMERG-L3B42RTIMERG-EIMERG-L
0.1–9.9148,089149,877149,87770,524103,995106,5270.480.690.71
10.0–24.929,69529,92029,92023,85628,25428,6320.800.940.96
25.0–49.911,84811,89311,89310,91011,67711,7220.920.980.99
50.0–99.93,9183,9233,9233,8003,8763,8890.970.990.99
100.0–249.96736746746616736740.981.001.00
≥250.02222222222221.001.001.00
All Samples194,245196,309196,309109,773148,497151,4660.570.760.77
Table 4. FAR for satellite rainfall products at different rainfall intensities.
Estimate (mm/day)Hits + FalseFalseFAR
3B42RTIMERG-EIMERG-L3B42RTIMERG-EIMERG-L3B42RTIMERG-EIMERG-L
0.1–9.9109,084216,613214,82046,619108,990103,8200.430.500.48
10.0–24.932,59828,27627,6826,3082,1341,4390.190.080.05
25.0–49.915,35311,06310,1751,5676491500.100.060.01
50.0–99.96,2983,6093,4683052890.050.010.00
100.0–249.91,21667167525110.020.000.00
≥250.02025250000.000.000.00
All Samples164,569260,257256,84554,824111,802105,4190.330.430.41

