You are currently viewing a new version of our website. To view the old version click .
Sustainability
  • Article
  • Open Access

17 December 2017

Impact of Organizational Culture Values on Organizational Agility

,
and
Department of Business Administration and Marketing, Universidad de Sevilla, Seville 41018, Spain
*
Authors to whom correspondence should be addressed.
This article belongs to the Special Issue Modern Statistical Techniques and Sustainability Studies: Selected Papers from the 9th International Conference on PLS and Related Methods (PLS'17)

Abstract

To remain competitive within the current, uncertain business scenario, it is vital for firms to develop capabilities that lead them to adapt and offer quick responses to market changes. Under the dynamic capabilities view of the firm, this paper proposes a model that presents an exhaustive analysis of two relevant research gaps: (i) the underlying relationships that determine the impact exerted by each of the four organizational culture typologies, comprised in Cameron and Quinn’s Competing Values Framework on organizational agility and, (ii) the contingency effect exerted by a key environmental factor, the industry’s technology intensity. An empirical study is performed to test the relationships proposed, using data collected from 172 Spain-based companies. To examine the contingency effect of technology intensity, the sample is divided into two subsamples, high and medium tech companies. This work uses partial least squares path-modeling, a variance-based structural equations modeling technique, in order to test and validate the research model and hypotheses posited. In addition, thorough analyses are carried out to assess the predictive performance of our model.

1. Introduction

Nowadays, firms must face extremely turbulent environments whose main characteristics are high levels of uncertainty, complexity and dynamism. If firms aim to survive in such volatile environments, they must develop capabilities to detect environmental changes early and to offer accurate responses to them, gaining new business opportunities and competitive advantages to exploit. In this context, the concept of organizational agility (OA) appears as one of the key issues that are attracting the attention of researchers and practitioners [1].
OA has been defined as an organization’s capability to sense environmental changes and to respond efficiently and effectively to them [2]. Assuming the dynamic capabilities view (DCV) as the theoretical framework [3], OA is a critical dynamic capability that influences firms’ competitive actions and therefore it becomes a significant antecedent of their performance [4]. In this vein, this paper approaches OA as a dynamic capability that organizations can deliberately use to reach and sustain competitive advantages [5] and to survive crises and changing environments [6].
Following Vinodh [7] in the current business scenario, OA needs to be coupled with sustainability. OA is a paradigm that enables firms to survive within the current hypercompetitive and dynamic business environment. Simultaneously, companies are nowadays incrementally required to become more respectful towards the environment. Concretely, fostering sustainability implies seeking the minimization of the firm’s environmental impact. Thus, numerous firms have turned to the design and development of eco-friendly products and services and the deployment of more eco-efficient processes [8]. Therefore, sustainability also stands out as a central concept for organizational survival. This implies that in the current scenario, OA and sustainability are both considered as performance indicators for modern firms [7]. Moreover, several studies have recently posited that OA exerts a positive impact on corporate sustainability [9,10].
OA has been approached from a wide variety of academic disciplines since the mid-1990s, the information systems (IS) field being the one that has been most developed. This field has mainly addressed the influence of IS and their related capabilities (ISC) in the achievement of high levels of OA in firms [4,11].
The focus on the technological aspects that may affect the OA level in an organization has led to some relevant organizational and contextual factors [12] and their influence on OA being forgotten. This fact has been identified as an important research gap: technology is only one piece of a complex puzzle, where other relevant aspects might play an important role in developing the mechanisms that allow firms to become agile through a more inclusive social-technical approach [13]. One of the most commonly ignored variables that may affect OA is organizational culture (OC) [2]. The previous literature has developed few attempts to study the effects of OC on OA, people and organizations’ characteristics are understudied dimensions if they are compared with technological and operational factors [12].
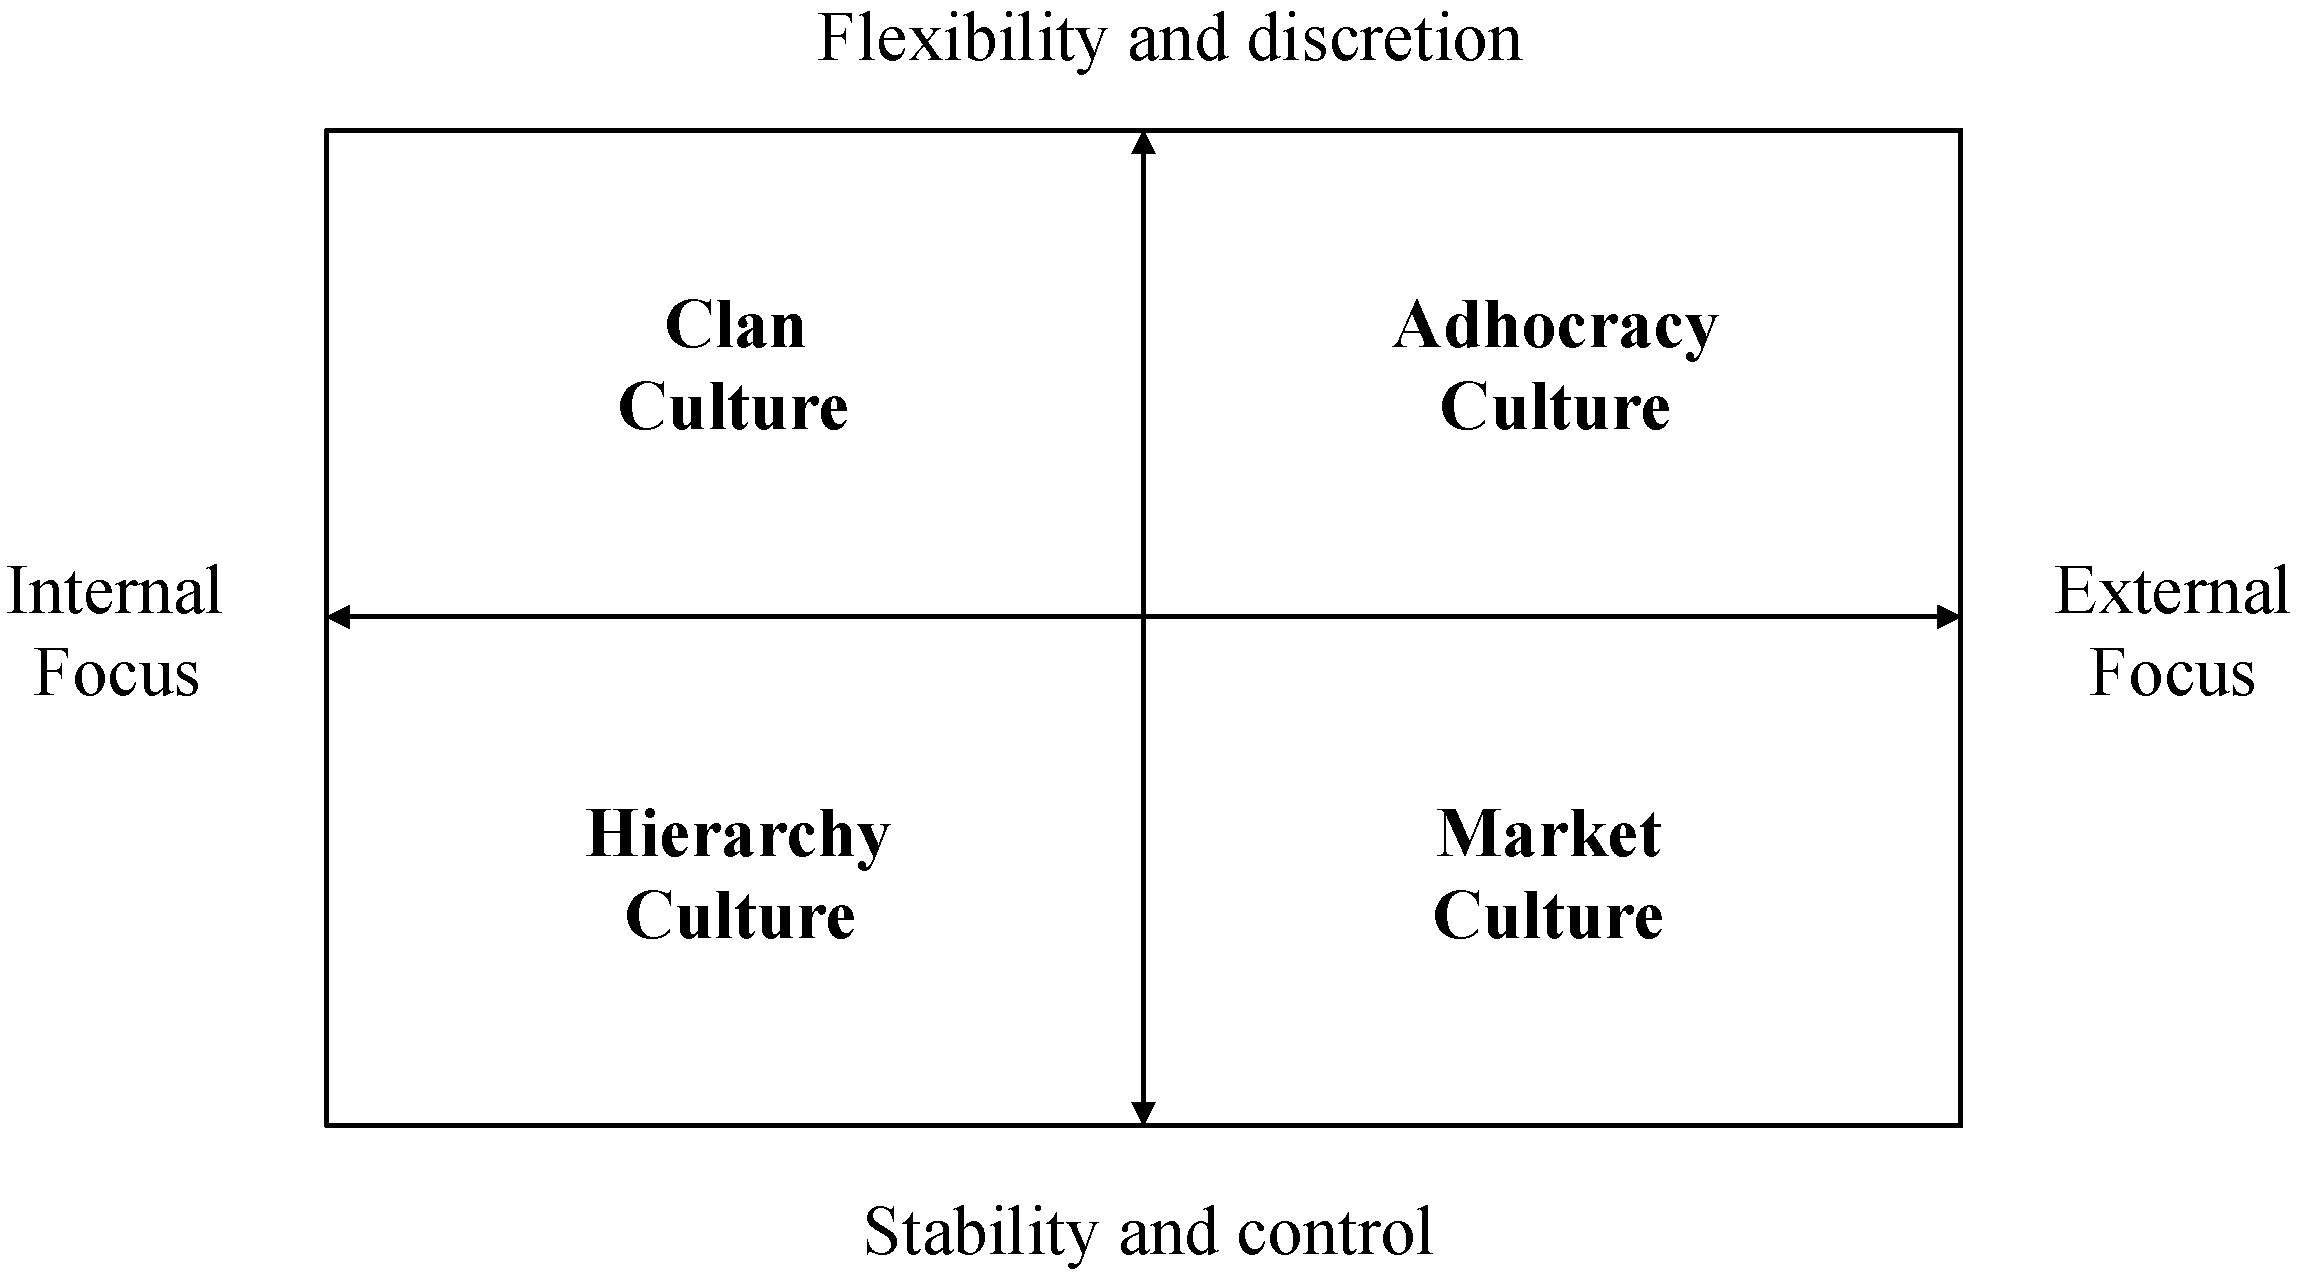
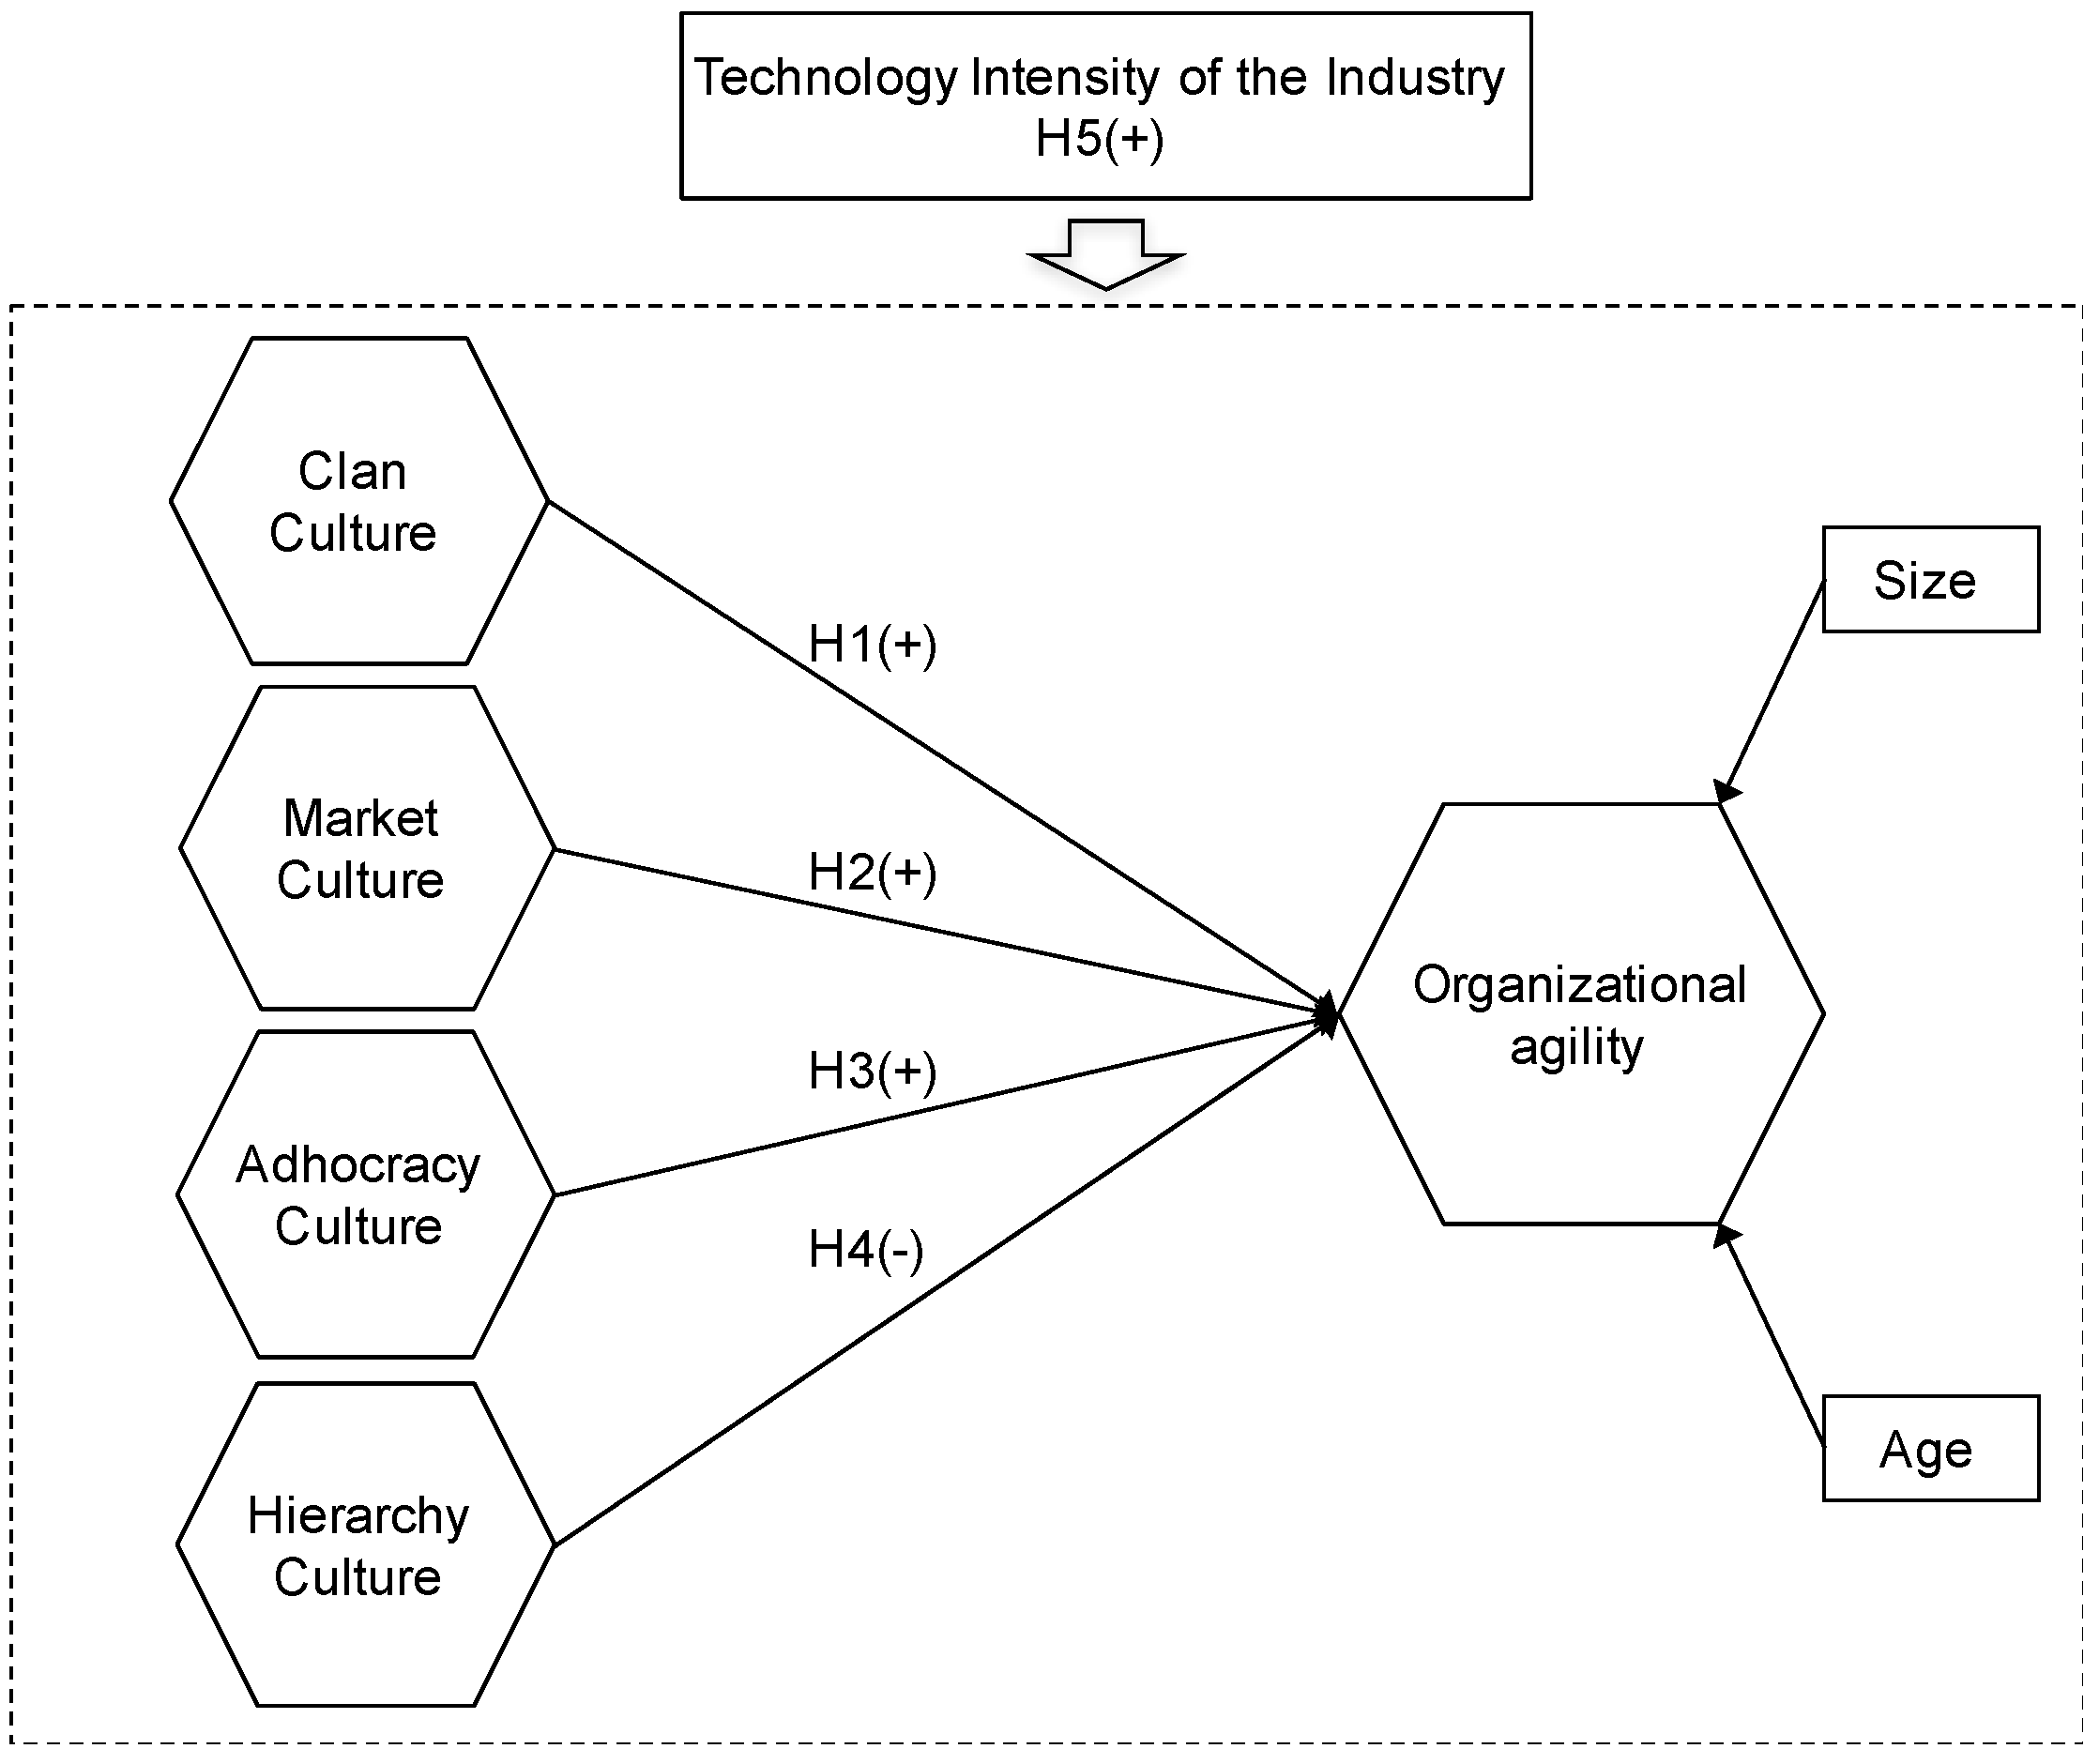
The purpose of this paper is hence to go deeper into the study of the antecedents of OA by approaching another relevant gap, the influence that might be exerted by diverse cultural values in achieving a higher level of OA. Following Cameron and Quinn’s [14] four major cultural typologies (Hierarchy, Market, Clan and Adhocracy Cultures), this paper builds up a model that posits these four cultural values as drivers of a firms’ OA levels. This theoretical model will not only serve for explanatory purposes but will also be a predictive model. This fact is a significant novelty in the OA literature.
Moreover, researchers tend to focus on internal organizational mechanisms to improve OA, while they ignore the external aspects of organizations [15]. The impact of cultural values and principles in the OA level is influenced by a complex set of factors that includes not only internal but environmental factors [11]. This paper proposes that the impact of the different types of OC values on OA may be moderated by one of these environmental variables, the technology intensity of the industry. This factor has traditionally been considered as one of the primary contingent variables in terms of organizational conditions [16]. Technology intensity at industry level can moderate the impact that OC values have on different organizational attributes that are linked to OA, such as adaptability to change, knowledge-based work and decentralization of authority, among others.
This work means to answer the following research questions:
RQ1: Could the presence of certain OC values become an antecedent of OA?
RQ2: Are the aforementioned relationships contingent on the technology intensity level of the industry?
RQ3: Are the four OC values able to generate accurate predictions of OA?
This paper carries out an empirical study to test the research hypotheses and the predictive performance of the research model. Sectors classified as innovative are the population selected for this study, as these industries can be considered as the most suitable, due to their hypercompetitive markets that require a flexible and quick response from organizations. This selection represents a population of 2360 firms. An off-line survey is the data collection instrument, the outcome being 172 usable surveys (a 7.3% response rate). The sample is split into two different groups (the high-tech and the medium-tech companies) to assess the contingency effect of the technology intensity of the industry.
The study proceeds as follows. The next section presents the theoretical background together with the research model and hypotheses. The third section gives a description of the research methodology. The fourth section presents the results of the different data analyses carried out. Finally, the fifth section brings together the discussion and implications.
This paper will bring new contributions to prior literature, as the results will shed light on the question of how firms can gain agility. As this remains unclear, new insights and lines of research are brought to the academic community as well as important implications for practitioners and executives, enabling a more effective management of companies’ resources and capabilities, in order to prepare them to survive and succeed in such hypercompetitive environments.

2. Literature Review and Research Hypotheses

2.1. The Competing Values Framework

This paper uses OC taxonomies following the Competing Values Framework (CVF) theorized by Cameron and Quinn [14]. The ‘competing values framework’ is among the most recognized and widely applied frameworks within organizational culture research. The search for this term leads to 1,900,000 results in Google Scholar. This same search yields a total of 1630 document results within the Scopus database. Hence, CVF has served as a guideline and source of theoretical inspiration and managerial insights for many scholars and practitioners [17].
The CVF model comprises two dimensions. One dimension opposes an emphasis on flexibility, adaptability and dynamism to an emphasis on stability, order and control, while the second dimension confronts an internal orientation with a focus on integration, collaboration and unity, with an external orientation with a focus on differentiation, competition and rivalry. These dimensions, combined jointly against each other, lead to the identification of four distinctive culture types (i.e., clan culture, market culture, adhocracy culture and hierarchy culture) that involve particular and idiosyncratic characteristics. A brief conceptual delimitation of the four cultural archetypes is given below (Figure 1).
Figure 1. The Competing Values Framework.
Clan culture is often categorized with the following features: family-oriented, trustworthiness, closeness, empowerment and community [14]. This culture type is primarily oriented to its human capital, emphasizes individuals’ level of wellbeing and fosters a positive working atmosphere over optimizing financial ratios and market goals [18]. Clan organizations combine a lower concern for structure and control and a greater focus on flexibility. Hence, instead of strict rules and procedures, the firm’s members are driven through vision, shared goals, outputs and outcomes.
Market culture is recognized as being clearly concerned with a goal (or objective) accomplishment culture type. Hence, the predominant corporate values inherent to this culture are productivity, effectiveness, competitiveness and results optimization. These organizations normally stress gaining prestige, status and profitability and their main purpose is to end in transactions (i.e., exchanges, sales, contracts), with other parties, in the hope of achieving competitive advantages [19]. In market organizations, both internal and external transactions (exchanges of value) are viewed in market terms. In effective market organizations, value flows between their different members and stakeholders, with minimal cost and delay.
Adhocracy culture is regularly labelled as original, dynamic, entrepreneurial, innovative, risk-taking, prepared for changes, aggressive and flexible [20]. Firms possessing this culture type often pursue success while focusing on innovation development, sustained in the development of innovative products, services and processes. Therefore, this is the most innovation-oriented culture, whose main target deals with fostering adaptability, flexibility and creativity, in order to face uncertainty, ambiguity and information overload [21].
Finally, Hierarchy culture is normally described as extremely bureaucratic, rule-driven, by-the-book and top-down directed [22]. This archetype traditionally embraces an approach that highlights structure and control that emanates from a strict chain of command, as in Max Weber’s original theory of bureaucracy. This culture stresses the minimization of ambiguity levels and the promotion of an intense sense of security, certainty, predictability, effectiveness, stability, formalization and standardization. This culture type endorses a long-lasting concern for order and control mechanisms, embodied in an explicit and very precise range of norms, rules, instructions and procedures. In summation, this culture is mainly focused on efficiency and internal control.

2.2. Organizational Agility

The notion of organizational agility (OA), as proposed by Sherehiy et al. [23], is rooted in two previously developed, related concepts (i.e., organizational adaptability, a reactive facet and organizational flexibility, a proactive facet). Concretely, OA encompasses companies’ capability of sensing environmental changes and responding readily to them, by reconfiguring their set of resources, business processes and strategies [24]. In addition, Sambamurthy et al. [4] postulate that three interrelated dimensions shape OA: (i) customer agility, which involves leveraging customers’ opinions to gain enhanced market intelligence; (ii) partnering agility, which comprises absorbing knowledge from the distinct business partners to enhance the firm’s response to market requests; and, (iii) operational agility, which entails quick process redesign to exploit dynamic environmental and market conditions [25]. Consequently, following the inclusive approach proposed by previous works, such as that by Charbonnier-Voirin [26], this paper conceptualizes OA as the organization’s deliberate response capability, aimed at enabling more efficient behavior, within highly turbulent and complex environments. This behavior not only involves reacting rapidly to change but also the firm’s capability to anticipate and seize opportunities, especially through innovation and learning.

2.3. Linking OC Typologies to OA

In the words of Cameron and Quinn [14] (p. 1) “No organization in the twenty-first century would boast about its constancy, sameness or status quo compared to ten years ago. […] The frightening uncertainty that traditionally accompanied major organizational change has been superseded by the frightening uncertainty now associated with staying the same.” These authors point out in their seminal work ‘Diagnosing and changing organizational culture based on the competing values framework,’ that most organizations frequently fail in their attempt to manage change effectively, due to their inability to implement cultural change accurately. The CVF has been effectively applied to distinct key aspects of organizational performance (i.e., total quality management, human resource management roles and cultural change, among others) [14]. Hence, the application of the CVF might also stand as a powerful tool to analyze the influence of OC on OA.
The linkages between OC and diverse forms of OA have been suggested, to a certain extent but until now there has been a scarcity of empirical works aimed at providing explanatory or predictive evidence for these relationships [12]. This paper posits that the four OC typologies shaping the CVF involve idiosyncratic features and particularities that might exert different effects on OA. Moreover, it is intended to explore which cultures actually exert a stronger influence on the endogenous construct.
Organizations’ awareness and struggle toward the development and wellbeing of their human capital, distinctive of clan culture, may be a good predictor of OA, since it may contribute to strengthening collaboration ties and the dissemination of knowledge [27]. Precisely, a key feature of agile companies is their ability to continuously manage the creation, adaptation, distribution and application of knowledge, throughout the organization [6], clan culture being a relevant breeding ground for these activities. Furthermore, clan culture is characterized by flat hierarchies based on autonomous individuals and teams, with leaders acting as facilitators, mentors and supporters [28], which may also enhance the OA level. However, its clear emphasis on individual issues might also hinder the implementation of new IS developments, which entail a certain degree of formalization and standardized procedures [29]. Nevertheless, the flexible organizational structure that supports the clan culture, in conjunction with open communication and employee commitment can overcome this limitation. A positive relationship between the clan culture and the OA level in an organization is therefore hypothesized (Figure 2):
Hypothesis 1 (H1).
Clan culture is positively related to OA.
Figure 2. Research model and hypotheses.
Market culture may lead to positive outcomes for OA. Its external focus and commitment toward predicting, understanding and reacting to market needs, trends and competitive changes may enable access to an extensive set of valuable external knowledge. Moreover, the market culture would maximize what Worley and Lawyer [30] call the “surface area,” typical of agile organizations: the external orientation encourages the continuous contact of employees with regulators, suppliers, customers and any other key stakeholders. This fact will provide the firm with valuable information for the decision making and will prepare it for properly sensing and responding to unexpected environmental changes [30]. Besides, market culture decisively supports the managerial processes of strategic planning, directing and objective setting. Such a clear emphasis on uncertainty reduction might also enable OA. This is in line with previous works that argue that elements, such as strict deadlines and team effectiveness, reflect values inherent to market culture [31]. Moreover, OA often benefits from a business context that stresses values linked to productivity and goals attainment. Thus, it is hypothesized that market culture will positively influence on OA (Figure 2):
Hypothesis 2 (H2).
Market culture is positively related to OA.
Due to its values, the adhocracy culture represents the most suitable cultural type to lead an organization in its way to becoming agile. Agile organizations work on potential alternative futures and they must be able to design and implement innovative responses to those foreseen scenarios, in a timely manner and with ease [32]. Therefore, given the tremendously uncertain, changing and complex business context where firms compete nowadays, an adhocratic culture that proactively emphasizes change, adaptability and innovativeness may be an effective driver of OA. In this line, Iivari and Iivari [31] (p. 513) argue that “enterprise agility is usually associated with adaptability and flexibility, i.e., an organizations’ ability to adjust in response to changes in the environment, implying external focus and change.” Indeed, change is the foundation of OA, which is defined as the capability that enables the firm to continuously reconfigure its resources to create responses to emerging futures, in the form of new products, services or business models [33]. Thus, as adhocracy cultures understand change as a positive phenomenon and a real source of opportunities, it is hypothesized that this culture type is positively related to OA (Figure 2):
Hypothesis 3 (H3).
Adhocracy culture is positively related to OA.
Finally, hierarchy culture, in short, is viewed as a culture type that is primarily focused on efficiency and internal control. Likewise, this culture is internally focused and consequently, stresses preserving a stagnant and rigid hierarchical structure over seeking market opportunities. Moreover, an evident and unambiguous outcome of this culture is the methodical gathering and dissemination of extremely accurate, highly detailed, punctual, quantified, reliable and objective data [34]. The hierarchy culture hinders knowledge management, as it is strongly formalized and dependent on operating procedures, rules and regulations, as standard guides for decision making [35]. This excess of standardization in the hierarchy culture may lead to efficiency but it is just the opposite to the idea of agility. Managers used to working in a perfect bureaucratic system will find it difficult to adapt to a challenging market competition that demands continuous reconfiguration to meet environmental requirements [12]. In brief, this typology appears to be quite the opposite to what an agile organization should be, to sense and respond to continuous environmental changes. Hence, it is hypothesized that the hierarchy culture leads to lower levels of OA in organizations (Figure 2):
Hypothesis 4 (H4).
Hierarchy culture is negatively related to OA.

2.4. The Contingent Effect of the Technology Intensity of the Industry

From the Dynamic Capabilities View (DCV) approach, OA has been identified as a dynamic capability by researchers [4,36]. The DCV is an extension of the Barney’s [37] and Peteraf’s [38] resource-based view (RBV) of the firm, in response to highly dynamic environments. A dynamic capability can be defined as the firm’s ability to integrate, build and reconfigure internal and external competences, to address rapidly changing environments [3].
A traditional RBV approach tends to focus on the internal mechanism of organizations but dynamic capabilities are influenced by external environmental factors [15]. In this vein, the greater the uncertainty and the dynamism in the business environment, the more critical strong dynamic capabilities become for the firm’s growth [39]. Therefore, the effectiveness of dynamic capabilities in companies is context dependent, although limited information is available on the joint effect of the internal and external mechanisms of organizations [15].
This paper has considered OC to be an antecedent of OA but the acceptance of agile values and principles can also be strongly influenced by environmental factors [11]. Considering technology intensity as one of the most relevant contingent variables in terms of organizational conditions [16], it is proposed as one of these external variables that may moderate the effects between OC in the firm and the OA level.
Technology intensity at industrial level refers to cross-sectional differences in the innovation potential of industries, which are derived from investments in knowledge and creative activities and its use in new applications [40]. In practice, this means that intensive technology industries invest a relatively high proportion of output in internal R&D [41]. Prior literature [42,43,44] operationalizes the environmental technological intensity following the OECD’s technology-based classification of industries [45]. The OECD proposes to distinguish four technology groups (high, medium-high, medium-low and low-technology industries), according to two indicators of technology intensity, R&D expenditure divided by value added and R&D expenditure divided by production. The INE’s (Spanish National Statistical Institute) classification of industries by their technological intensity, which adapts the OECD’s to the Spanish economy, is used in this paper. Attention is focused on two different industry groups: high-tech and medium-tech industries. It can be assumed that these industries show rather different organizational characteristics derived from different sectorial and environmental features, such as accelerating and complex technologies, operational dynamics, continuous innovation, etc. [46]. Therefore, it is interesting to test whether this fact has any impact on the culture type that is most effective in order to improve OA.
Technology-intense industries are dynamic environments in which companies must be highly flexible and quick to implement changes [47]. High technology environments will require knowledge intensity and sophistication from firms, pushing them to adopt alternative organizational designs and new management techniques. Technologically driven industries need to be more creative and innovative than any others, if they want to survive [48]. The value of these companies lies increasingly in the creation and sharing of knowledge, rather than in any other type of assets or resources. Thus, the presumption can be made that OC values that improve the OA level in an organization will find more favorable conditions in this type of environmental context to exert its positive influence.
Moreover, high-tech industries demand highly educated skilled workers [46], contrary to medium and low-tech industries, which usually have a higher labor intensity and employ less human capital [49]. These facts lead to the consideration that in a high-tech context people are more self-motivated/directed and enjoy the autonomy and freedom of decision making and assuming responsibilities [46]. Thus, these environmental conditions will positively affect the agility values that could be involved in any of the four different OC typologies, as has been explained above (Section 2.3). Under such conditions, the agility values will be widely spread and smoothly assumed by the organization. Therefore, high technology intensity will enhance the OC values that are linked to a superior OA level, in a stronger manner than in a medium or low-tech context.
Furthermore, technology intensity has previously been noted as a moderator in the relationships between diverse organizational variables. Prior research has demonstrated that technology intensity moderates the impact on a firm’s performance of cooperation and strategic renewal activities [42], foreign corporate-ownership [50], quality capabilities [51], or employment flexibility [52].
With this theoretical support, it is proposed that the technology intensity of the industry will positively moderate the relationship between culture typology and OA.
Hence, the following hypothesis is posited (Figure 2):
Hypothesis 5 (H5).
The technology intensity level of the industry positively moderates the link between OC and OA.
Hypothesis 5a (H5a).
The technology intensity level of the industry positively moderates the link between clan culture and OA.
Hypothesis 5b (H5b).
The technology intensity level of the industry positively moderates the link between market culture and OA.
Hypothesis 5c (H5c).
The technology intensity level of the industry positively moderates the link between adhocracy culture and OA.
Hypothesis 5d (H5d).
The technology intensity level of the industry positively moderates the link between hierarchy culture and OA.

3. Methods

3.1. Sample and Data Collection

Innovative sectors shape the population for this research. Both scholars and practitioners catalogue these industries as hypercompetitive, requiring a flexible and quick response from firms. This sector was chosen on the basis of the taxonomy developed by the Spanish National Institute of Statistics [53], which distinguishes between high and medium-high technology industries. This selection yields a population of 2360 companies. The data collection instrument consists of an off-line survey. Since the level of analysis is the organization, the survey respondents are senior managers. After one mailing effort, 189 questionnaires were initially received. Once those observations that did not satisfy the criteria suggested by Hair et al. [54] to handle missing data were removed, 172 valid surveys (a 7.3% response rate) were selected. This lower-than expected response rate might be explained by the fact that respondents (mostly executive managers) might possibly be overwhelmed by surveys. Nonetheless, this lower than expected response rate is not a severe source of bias, as we examined the generalizability through two different non-response bias tests. We assessed the potential non-response bias by means of a series of t-tests that compared early (responses to the initial mailing) with late (responses to the follow-up mailing) respondents, in terms of all the key constructs. Responding firms were compared with those that did not respond in terms of size and performance. No significant differences were found between these two groups, thus suggesting that non-response bias is not a serious concern. Finally, considering a statistical power of 0.8 at an alpha level of 0.05, our sample (n = 172) permits detecting an effect size (f2) up to 0.036 [55], a figure very close to 0.02, a small influence according to Cohen [56].
The firms involved belong largely to the following industries: computer systems design (26.7%); machinery manufacturing (18%), chemical (17.4%); transportation equipment manufacturing sectors (8.1%); electrical equipment (7.6%); and, computer and electronic products (7%). Consistent with the European Union classification, 23.8% of the firms participating are large enterprises, more than 250 employees. Concerning the respondents’ area of specialization, 23.8% of the respondents belong to the R&D department, followed by the marketing department (20.9%), general management (14%) and the engineering department (9.3%). Regarding the respondents’ gender, 66% are male, whereas women represent 34%.
To analyze the industry contingency effect, the sample is split into two subsamples: (i) the high-tech; and, (ii) the medium-tech companies, following the classification established by the Spanish National Institute of Statistics [53] mentioned above. Results from the split are: 88 high-tech firms (51%) and 84 medium-tech firms (49%).

3.2. Measures

The variables included in our study have been modeled as composites. These variables can be described as design constructs or artifacts that consist of more elementary components, such as dimensions or facts. In this manner, composites are formed as linear combinations of their respective indicators or dimensions [57]. Consequently, dropping an indicator (or dimension) usually alters the meaning of the composite [58], since they represent different facets, whilst high correlations are common among indicators and dimensions but not required [59]. To measure the OC variables, this study adapts the OC Assessment Instrument proposed by Cameron and Quinn [19], which is based on the Competing Values Framework and encompasses six items that measure each of the four culture typologies as unidimensional constructs. Besides, following Sambamurthy et al. [4], OA is measured as a multidimensional composite shaped by three dimensions: customer agility, partnering agility and operational agility and a total of eleven items. This work adapts the scales proposed by Lu and Ramamurthy [60] for customer and operational agility and from Yang and Liu [61], Bradley, Pratt, Byrd, Outlay and Wynn [62] and Tallon and Pinsonneault [63] for partnering agility. All the constructs are measured through a seven-point Likert scale, with the exception of the control variables. In this case, using archival data from the SABI NEO database (Sistema de Análisis de Balances Ibéricos), size was measured as the number of employees and age as the number of years since its founding.

3.3. Data Analysis

Partial Least Squares (PLS), a variance-based structural equation modeling approach [64], was the technique chosen to test the research model. This decision is firstly based on the characteristics of the constructs included in our research model. These are composites. Therefore, as theoretical contributions [57,65] and empirical simulation studies [66,67] have demonstrated, the use of PLS is suitable when a composite measurement model is supported. In this case, the PLS path modeling estimates are consistent [68] and there is no bias [67]. Secondly, following Chin [69]. PLS is used because component scores are used in a subsequent analysis for modeling a multidimensional construct applying the two-stage approach [70]. Lastly, this study is mainly oriented to identifying key driver cultural constructs in order to predict a company’s OA level [71].
The four culture variables have been modeled as composites and estimated in Mode B (regression weights). Given the original instrument used, an additive operation in order to generate scores by each type of culture and where the existence of correlated items or internal consistency was not presupposed, it was decided to apply Mode B as the estimation method for the culture variables. On the other hand, Mode A was selected for the OA variable, both at the dimension and the second-order construct level. Mode A used correlation weights, which is advisable for the estimation of standardized regression coefficients in small to medium samples and when the indicators are correlated [66]. Finally, SmartPLS 3.2.7 software was used [72].

3.4. Common Method Bias

Common method bias (CMB) refers to the difference between the trait score and measured score that is attributed to the use of a common method to take more than one measurement of the same or different traits [73]. Therefore, CMB could imply a threat in social science research given that bias may affect findings, due to systematic errors [74]. Consequently, it has been attempted to prevent CMB during the research design phase by applying the procedural remedies proposed by Podsakoff, MacKenzie and Podsakoff [75]. In addition, a statistical technique was used to detect a potential CMB situation. This was a full collinearity test based on variance inflation factors (VIFs) [76]. The guidelines followed were those described by Kock and Lynn [77], who proposed such a test in order to assess both vertical and lateral collinearity. Kock [76] indicates that when a VIF achieves a value greater than 3.3, there would be an indication of pathological collinearity. This would warn that a model may be contaminated by CMB. The present model, with a maximum VIF of 2.11 (Table 1), may be considered free of CMB.
Table 1. Full collinearity VIFs.

4. Results

4.1. Measurement Model

When the measurement model is assessed, composites estimated in Mode A and Mode B are distinguished. Consequently, the OA construct which has been estimated in Mode A is evaluated. Since this multidimensional construct is an artifact (design construct), it is expected that the indicators (or dimensions) of the composites will be correlated [59]. This means that traditional measures of internal consistency, reliability and validity can be applied [58]. Both indicators and dimensions generally have loadings above 0.7. Consequently, the individual item reliability is considered satisfactory (Table 2). Additionally, both dimensions and the high order construct, achieve composite reliability (CR) figures greater than 0.7 (Table 2). This means that these variables meet the CR requirement. The average variance extracted (AVE) is used to evaluate the convergent validity. All the constructs and dimensions satisfy this criterion since their AVEs exceed the 0.5 level (Table 2). Finally, it can be observed that the OA construct attains discriminant validity. This is achieved by applying the Fornell-Larcker criterion [78] (Table 3). This means that this multidimensional construct differs from the other constructs.
Table 2. Measurement model results.
Table 3. Measurement model. Discriminant validity.
On the other hand, the four cultural variables have been estimated in Mode B. Therefore, these composites are assessed on two levels, at the construct (discriminant validity) and at the indicator level (multicollinearity and weight assessment). Urbach and Ahlemann [79] propose an easy way to assess discriminant validity using inter-construct correlations. If correlations between the composites and all other constructs are less than 0.7, then the constructs differ sufficiently from one another. This is the case here (Table 2). On the other hand, at the indicator level, the analysis is started by testing potential multicollinearity between items [64]. Petter, Straub and Rai [80] indicate that a variance inflation factor (VIF) statistic, greater than 3.3, signals a high multicollinearity. Here, the maximum VIF value for indicators came to 2.6, below this threshold. Next, the magnitude and significance of the weights were checked (Table 2). Weights provide information about how each indicator contributes to the respective composite [81]. Hence, they allow indicators to be ranked according to their contribution. Also, a significance level of at least 0.05 suggests that a measure is relevant for the construction of the composite construct [64].

4.2. Structural Model

Table 4 shows the explained variance (R2) in the OA variable and the direct effects included in our research model. Bootstrapping (5000 samples) provides t-values and confidence intervals that enable the assessment of the relationships’ statistical significance [64]. Thus, two of the hypothesized relationships (H1 and H2) are supported, whereas H4 (-) is not supported as there is a significant relationship but with an opposite sign, regarding the sign postulated. Finally, market culture (H3) has a non-significant effect on the endogenous variable. In this vein, market culture shows an extremely low f2 value, under the minimum level of 0.02. Moreover, the control variables show negligible (see magnitude and f2 values) and non-significant effects on OA (Table 4).
Table 4. Effects on the endogenous variable.
Furthermore, the coefficient of determination (R2) is examined to assess the predictive power (in-sample prediction) for OA as the endogenous construct [69] (Table 4). Hence, OA achieves an explained variance of 0.485, which surpasses the moderate level (0.33) set up by Chin [81]. The model has also been evaluated by analyzing the cross-validated redundancy index (Q2) for the dependent variable. A Q2 greater than 0 implies that the model shows predictive relevance. In our case, the structural model obtained satisfactory predictive relevance for OA (Table 4).
Finally, we have carried out a multi-group analysis [82] in order to test the potential moderating influence of the industry’s technology intensity on the relationships included in our research model. Accordingly, the sample was split into two groups, high and medium technology firms. As a first step, the three-step procedure to analyze the measurement invariance of composite models was applied (MICOM) [58]. Establishing the measurement invariance of composites will allow it to be ensured that the effect of the industry’s technology intensity is restricted to the path coefficients of the structural model and not to the parameters of the measurement model. As Table 5 describes, the full measurement invariance of both groups was achieved for all the variables. Then, the permutation-based procedure developed by Chin and Dibbern [83] was applied, which represents a non-parametric approach to conduct multi-group analyses. As Table 6 illustrates, no significant differences were detected in the direct effects considered, although different results were obtained in both groups. Consequently, neither of the moderating hypotheses is supported.
Table 5. Results of the measurement invariance of composite models (MICOM) procedure.
Table 6. Direct effects for high and medium technologies subsamples. Multi-group analysis based on permutation test.

4.3. Assessment of the Predictive Validity Using Holdout Samples

The predictive power of a model is a model’s ability to generate accurate predictions of new interpretable observations, temporal or cross-sectional [84]. Predictive validity indicates that a given set of measures of a particular construct can predict a given outcome variable [85]. Predictive validity (out-of-sample prediction) was evaluated using cross-validation with holdout samples. Specifically, this study applies the approach suggested by Shmueli et al. [86], where using the current PLS predict algorithm in the SmartPLS software version 3.2.7. [72], k-fold cross-validated prediction errors and prediction error summaries statistics were obtained, such as the root mean squared error (RMSE) and the mean absolute error (MAE), to assess the predictive performance of their PLS path model for the indicators and the constructs. On the basis of these statistics, the two new benchmarks developed by the SmartPLS team were used in order to assess the predictive performance of a specific PLS path model [87]:
(1)
The Q² value, which compares the prediction errors of the PLS path model against simple mean predictions. If the Q² value is positive, the prediction error of the PLS-SEM results is smaller than the prediction error of simply using the mean values. Accordingly, the PLS-SEM model offers an appropriate predictive performance. This is the case here at three levels (Table 7), at the construct (i.e., OA), at the dimension (operational, customer and partnering variables) and at the indicator levels.
Table 7. PLS predict assessment.
(2)
The linear regression model (LM) approach regresses all exogenous indicators on each endogenous indicator to generate predictions. In comparison with the LM outcomes, the PLS-SEM results should have a lower prediction error (e.g., in terms of RMSE or MAE) and greater Q² values, than the LM. This would mean a theoretically established path model improves (or at least does not worsen) the predictive performance of the available indicator data. Once again, this is the scenario for our model. The RMSE and MAE values for the PLS model are lower than for the LM. In addition, the Q² values for the indicators of the PLS model are larger than those generated for the LM model (Table 7).
Next, with the invaluable help of the research team led by Galit Shmuelit at the National Tsing Hua University (Taiwan), it was attempted to assess the predictive validity of our model focusing on the “overfit” issue. Is the model fit too specifically to training data or will the model perform comparably with new data? In order to offer a response, in-sample versus out-of-sample predictions were compared to actual composite scores. With this aim in mind, the following steps were followed [88]:
(1)
The actual composite scores for organizational agility (OA) were estimated for all cases, by estimating the model on the whole sample (n = 172).
(2)
In-sample predictions for OA composite scores were calculated using a k-fold (k = 10) cross-validation procedure. The in-sample RMSE was than calculated by comparing each case’s in-sample predicted OA score, versus its actual OA score.
(3)
Out-of-sample predictions for OA composite scores were obtained using a k-fold cross-validation procedure (where k = 10). The out-of-sample RMSE was then calculated by comparing each case’s out-of-sample predicted OA score, versus its actual OA score.
Using this procedure, the following metrics were given for the composite OA: In-sample RMSE: 0.708; Out-of-sample RMSE: 0.795. Given that the composite scores are normalized and have mean 0 and variance 1, RMSE can be interpreted in the sense of a standard deviation. The difference between in-sample and out-of-sample RMSE of 0.09 is less than a tenth of a standard deviation. Since the difference in RMSE is not substantial, overfit is not a problem for this study. The density plots of the in-sample and out-of-sample residuals are provided in Figure 3.
Figure 3. Density plots of the in-sample and out-of-sample residuals.
Consequently, as a result of the different analyses shown above, this work finds enough evidence that supports the predictive validity (out-of-sample prediction) of our research model, in order to predict values for new cases of OA. Therefore, the four cultural values together with the controls can predict the OA in additional samples that are separate from the dataset used to test the theoretical research model [89]. As a result, this predictive validity offers an additional support for the research model tested in this work.

5. Discussion

Quick technological updates, increased risks and challenges due to globalization, environmental awareness and an amplified desire for customization, are some of the features intrinsic to the business setting that most companies have to face these days [90]. To remain successful within such a context, OA may bring firms a competitive advantage that should be sustained through maintaining a good reputation for innovation, excellence and sustainability [12]. In this way, agile organizations combine their business processes and human capital with advanced technology, to satisfy clients’ demands for customized, excellent and more sustainable products and services in a rather short time frame [91].
It can therefore be assumed that OA facilitates the firm’s adaptation and quick response and is currently related to business success. In fact, OA has turned out to be more an imperative for organizational subsistence than a choice in itself [1]. Nevertheless, the academic sphere is asking for a more exhaustive assessment of this phenomenon. According to Chan et al. [92], due to the high complexity underlying the OA concept, its main drivers or antecedent variables require a much deeper research and supplementary empirical evidence. In this vein, our findings enable a richer understanding of the underlying effects that the distinct CVF OC typologies exert on OA.
An important finding deals with the positive effect found between adhocracy culture and OA. This is in line with prior related studies that have labelled agile organizations as highly adaptive and flexible. Actually, Sherehiy et al. [23] describe OA as a firm’s ability to adjust and respond to changes in the environment, entailing a prevalence of external focus and change. This finding also fits with prior studies’ empirical support of the adhocracy culture being an important precondition for innovation success [28]. The adhocracy culture, due to its lack of bureaucratization and complexity, enables the organization to be flexible and to rapidly reconfigure resources and processes. This fact provides a strong success basis for companies operating in dynamic environments.
This paper has also supported the clan culture’s positive relationship with OA, though it is not as strong as that of the adhocratic type. An explanation of this result can be found in the clan’s deep focus on internal aspects (loyalty, teamwork, shared goals and values) that would lead to relaxing the vigilance of environmental dynamics. However, this clan culture gathers together management practices and values that are intrinsically linked to what an agile organization must be: managers who enable self-organizing teams, different ways of coordinating work (dynamic linking), continuous improvement, radical transparency and communication awareness [93].
On the other hand, contrary to expectations, this study did not find a negative link between hierarchy culture and OA but a positive significant effect. This finding was certainly unexpected and suggests that certain features inherent to hierarchy culture lead to more agile organizations. We believe that this is an interesting finding, since it denotes that although adaptability and flexibility are fundamental features that shape agile organizations, these firms may also benefit from a certain degree of stability, control and order, especially in a scenario of crisis and uncertainty, such as that in which the empirical study was conducted. Precisely, in a time of crisis, an upper-level decision provides a faster response to any threat or critical situation than a lower-level decision, which would require too much time [1]. In this sense, some of the characteristic values that shape hierarchy culture are in line with some of the requirements that customers and stakeholders are demanding from firms within the environment described above. On occasions, in these circumstances, a company has performed better than its industry competitors over a sustained period of time on the basis of a strong culture focused on keeping their customers satisfied, while remaining efficient and controlling their costs [94]. Consequently, the presence of a solid and developed array of formalized structures and procedures, along with precise coordination mechanisms, may also become critical aspects when attempting to boost OA in such circumstances. Accordingly, certain aspects inherent to the attainment of OA will benefit from a certain degree of formalization, standardization and stability, typical of this cultural typology. Nevertheless, it must not be forgotten that although hierarchy culture may lead to short-term success, it may also hinder an organization’s long-term capability to change, adapt, or innovate [94].
No evidence was found for the positive effect of the market culture on OA, contrary to what had been hypothesized. A priori, its external focus on markets and customers’ needs could lead to improvement of the company’s capability to capture external information and leverage it in order to offer agile responses and seize emerging opportunities. Yet, its emphasis on control and stability rather than flexibility would limit this effect. This result is in line with previous studies that have empirically tested that market culture has no significant effect on innovation [95].
Moreover, the results have confirmed none of the environmental contingency hypotheses related to the technology intensity of the industry, in the CVF typologies—OA relationship. Although there are slight differences between the two industries considered (high-tech and medium-tech), the effect is not statistically significant. This fact may indicate that the impact of the internal organizational factors regarding culture on OA is sound. Every effort that the organization makes to promote cultural values which enhance OA will be effective, regardless of the R&D intensity of the sector. To prepare the organization internally and the people who integrate it to better face environmental challenges, become key points in organizational strategy. It is clear that “change is much easier if a culture exists that embraces change” [31] (p. 26). Another reason that could sustain this result is that, currently, differences between the two groups (high tech and medium tech industries) are not so significant, as new technology developments have narrowed the gap between them. As the ODCE’s scale shows four different groups (high, medium-high, medium-low and low), results could have differed if the sample had been selected according to more technologically separate groups (high and medium-high versus medium-low and low).
Finally, the model has shown a predictive power for the sample used in the study. In addition, enough evidence was found that supports the predictive validity (out-of-sample) of our model. The model of four cultural typologies is an adequate predictor of OA. This means that our model provides much more information than noise [89]. Therefore, those four cultural types are able to accurately predict the OA variable in new interpretable observations, both in a temporal and cross-sectional manner. As a result, the satisfactory level of predictive power achieved helps to support the research model proposed [85].

6. Conclusions

In brief, this work is among the scant empirical studies that aim to clarify the links between OC typologies and OA. Hence, a theoretical model was developed which combines Cameron and Quinn’s [14] CVF of OC typologies with literature on OA. Our results stress the positive influence that adhocracy, clan and hierarchy culture exert on OA. These findings provide some support for the conceptual premise that the four cultural typologies are just ideal categories, meaning that a company is rather unlikely to, in isolation, reflect one single typology [96,97]. Indeed, the CVF theorists suggest a reasonable equilibrium between reverse focuses, although certain cultural aspects may be predominant. Agile methods illustrate this need for a reasonable balance between different but complementary cultural approaches, successful firms usually concentrate on a diversified mix of values and cultures [19].
These findings may help managers to understand the importance of adapting their firms’ corporate culture to the aspiration of becoming more effective and agile organizations. Therefore, although we are aware of the significance of contextual factors [98] and accept that the promotion of an ideal culture typology that could be endorsed and effective in a particular context is certainly utopian, our findings advocate that certain foundations intrinsic to adhocracy and hierarchy culture are actual drivers of OA. Consequently, we praise those managers who aim to improve their companies’ level of agility to combine the empowerment and knowledge sharing inclination, intrinsic to adhocracy culture, with the rigorous formalization and coordination mechanisms that characterize hierarchy culture.
The generalizability of these results is subject to certain limitations. For instance, we acknowledge that we only relied on managers’ perceptions and failed to collect data from other groups within the company. Hence, we are unable to check the possible presence of different subcultures. Second, this paper only contemplates companies operating within a single geographical context (Spain). Therefore, extrapolating these results to different contexts must be approached with some caution. Third, this is a cross-sectional study that only analyzes the relationships at a static moment and fourth, the moderation effects of technology intensity need to be assessed from different industry groupings that will reflect more diverse technological contexts.
In conclusion, contemporary, non-peaceful and uncertain business contexts, are increasingly leading companies to face huge challenges, not only to remain successful but also to subsist. In these settings, scholars and managers are starting to internalize the central role of OA. Nevertheless, further research should be undertaken to investigate the main drivers or antecedents of OA and much needs to be explored with regard to the concrete actions and internal mechanisms underlying agility.

Acknowledgments

The authors acknowledge and are grateful for the cooperation and financial support provided by the Junta de Andalucía (Consejería de Economía, Innovación y Ciencia), Spain (P10-SEJ-6081), through the “Proyecto de Investigación de Excelencia P10-SEJ-6081.” The authors also express their gratitude to Galit Shmueli, Soumya Ray and Nicholas Danks (College of Technology Management, National Tsing Hua University, Taiwan) for their invaluable help in carrying out the assessment of the predictive validity of this research model.

Author Contributions

Carmen M. Felipe developed the theoretical approach to organizational agility and the contingent effect of the technology intensity of the industry. Antonio L. Leal-Rodríguez developed the theoretical approach to organizational culture. Both of them jointly developed and supported the research model and the relationships hypothesized. José L. Roldán conducted the empirical analysis. All authors contributed to the conclusions, as well as writing, reading and improving the final manuscript.

Conflicts of Interest

The authors declare no conflict of interest.

References

  1. Harraf, A.; Wanasika, I.; Tate, K.; Talbott, K. Organizational agility. J. Appl. Bus. Res. 2015, 31, 675–686. [Google Scholar] [CrossRef]
  2. Ashrafi, N.; Xu, P.; Sathasivam, M.; Kuilboer, J.P.; Koelher, W.; Heimann, D.; Waage, F. A framework for implementing business agility through knowledge management systems. In Proceedings of the Seventh IEEE International Conference on E-Commerce Technology Workshops, CEC 2005 Workshops, Munich, Germany, 19 July 2005; IEEE: New York, NY, USA, 2005; pp. 116–121. [Google Scholar]
  3. Teece, D.J.; Pisano, G.; Shuen, A. Dynamic capabilities and strategic management. Strateg. Manag. J. 1997, 18, 509–533. [Google Scholar] [CrossRef]
  4. Sambamurthy, V.; Bharadwaj, A.; Grover, V. Shaping agility through digital options: Reconceptualizing the role of information technology in contemporary firms. MIS Q. 2003, 27, 237–263. [Google Scholar] [CrossRef]
  5. Dunlop-Hinkler, D.; Parente, R.; Marion, T.J.; Friar, J.H. The role of technology agility on business processes and organizational agilities. In Proceedings of the IEEE International Technology Management Conference, San Jose, CA, USA, 27–30 June 2011; IEEE: New York, NY, USA, 2011; pp. 67–75. [Google Scholar]
  6. Nijssen, M.; Paauwe, J. HRM in turbulent times: How to achieve organizational agility? Int. J. Hum. Resour. Manag. 2012, 23, 3315–3335. [Google Scholar] [CrossRef]
  7. Vinodh, S. Improvement of agility and sustainability: A case study in an Indian rotary switches manufacturing organisation. J. Clean. Prod. 2010, 18, 1015–1020. [Google Scholar] [CrossRef]
  8. Leal-Rodríguez, A.L.; Ariza-Montes, A.J.; Morales-Fernández, E.; Albort-Morant, G. Green innovation, indeed a cornerstone in linking market requests and business performance. Evidence from the Spanish automotive components industry. Technol. Forecast. Soc. Chang. 2017, in press. [Google Scholar] [CrossRef]
  9. Pham, D.T.; Thomas, A.J. Fit manufacturing: A framework for sustainability. J. Manuf. Technol. Manag. 2011, 23, 103–123. [Google Scholar] [CrossRef]
  10. Ivory, S.B.; Brooks, S.B. Managing Corporate Sustainability with a paradoxical lens: Lessons from strategic agility. J. Bus. Ethics 2017, 1–15. [Google Scholar] [CrossRef]
  11. Wendler, R. Dimensions of Organizational Agility in the Software and IT Service Industry—Insights from an Empirical Investigation. Commun. Assoc. Inf. Syst. 2016, 39, 439–482. [Google Scholar]
  12. Crocitto, M.; Youssef, M. The human side of organizational agility. Ind. Manag. Data Syst. 2003, 103, 388–397. [Google Scholar] [CrossRef]
  13. Bi, R.; Davidson, R.; Kam, B.; Smyrnios, K. Developing Organizational Agility through IT and Supply Chain Capability. J. Glob. Inf. Manag. 2013, 21, 38–55. [Google Scholar] [CrossRef]
  14. Cameron, K.S.; Quinn, R.E. Diagnosing and Changing Organizational Culture: Based on the Competing Values Framework, 1st ed.; Addison-Wesley: Reading, MA, USA, 1999. [Google Scholar]
  15. Mao, H.; Liu, S.; Zhang, J. How the effects of IT and knowledge capability on organizational agility are contingent on environmental uncertainty and information intensity. Inf. Dev. 2015, 31, 358–382. [Google Scholar] [CrossRef]
  16. Mintzberg, H. The Structuring of Organizations; Prentice-Hall: Upper Saddle River, NJ, USA, 1979. [Google Scholar]
  17. Leidner, D.E.; Kayworth, T. A review of culture in information systems research: Toward a theory of information technology culture conflict. MIS Q. 2006, 30, 357–399. [Google Scholar] [CrossRef]
  18. Keskin, H.; Akgün, A.E.; Günsel, A.; İmamoğlu, S.Z. The relationships between adhocracy and clan cultures and tacit oriented KM strategy. J. Transnatl. Manag. 2005, 10, 39–53. [Google Scholar] [CrossRef]
  19. Cameron, K.; Quinn, R. Diagnosing and Changing Organizational Culture: Based on the Competing Values Framework, 3rd ed.; John Wiley & Sons: San Francisco, CA, USA, 2011. [Google Scholar]
  20. Leal-Rodríguez, A.L.; Ariza-Montes, J.A.; Morales-Fernández, E.J.; Eldridge, S. Assessing the links between organisational cultures and unlearning capability: Evidence from the Spanish automotive components industry. Int. J. Innov. Learn. 2016, 20, 422–436. [Google Scholar] [CrossRef]
  21. Deshpandé, R.; Farley, J.U.; Webster, F.E., Jr. Corporate culture, customer orientation, and innovativeness in Japanese firms: A quadrad analysis. J. Market. 1993, 57, 23–37. [Google Scholar] [CrossRef]
  22. Zammuto, R.F.; Gifford, B.; Goodman, E.A. Managerial ideologies, organization culture and the outcomes of innovation: A competing values perspective. In Handbook of Organizational Culture and Climate; Askhanasy, N.H., Wilderom, C.P.M., Peterson, M.F., Eds.; Sage Publications: Thousand Oaks, CA, USA, 2000. [Google Scholar]
  23. Sherehiy, B.; Karwowski, W.; Layer, J.K. A review of enterprise agility: Concepts, frameworks, and attributes. Int. J. Ind. Ergon. 2007, 37, 445–460. [Google Scholar] [CrossRef]
  24. Overby, E.; Bharadwaj, A.; Sambamurthy, V. Enterprise agility and the enabling role of information technology. Eur. J. Inf. Syst. 2006, 15, 120–131. [Google Scholar] [CrossRef]
  25. Felipe, C.M.; Roldán, J.L.; Leal-Rodríguez, A.L. An explanatory and predictive model for organizational agility. J. Bus. Res. 2016, 69, 4624–4631. [Google Scholar] [CrossRef]
  26. Charbonnier-Voirin, A. The development and partial testing of the psychometric properties of a measurement scale of organizational agility. Management 2011, 14, 119–156. [Google Scholar]
  27. Boothby, D.; Dufour, A.; Tang, J. Technology adoption, training and productivity performance. Res. Policy 2010, 39, 650–661. [Google Scholar] [CrossRef]
  28. Matzler, K.; Abfalter, D.E.; Mooradian, T.A.; Bailom, F. Corporate Culture as an Antecedent of Successful Exploration and Exploitation. Int. J. Innov. Manag. 2013, 17, 1350025. [Google Scholar] [CrossRef]
  29. Büschgens, T.; Bausch, A.; Balkin, D.B. Organizational culture and innovation: A meta-analytic review. J. Prod. Innov. Manag. 2013, 30, 763–781. [Google Scholar] [CrossRef]
  30. Worley, C.G.; Lawler, E.E. Agility and Organization Design: A Diagnostic Framework. Org. Dyn. 2010, 39, 194–204. [Google Scholar] [CrossRef]
  31. Iivari, J.; Iivari, N. The relationship between organizational culture and the deployment of agile methods. Inf. Softw. Technol. 2011, 53, 509–520. [Google Scholar] [CrossRef]
  32. Van Oosterhout, M.; Waarts, E.; van Hillegersberg, J. Change factors requiring agility and implications for IT. Eur. J. Inf. Syst. 2006, 15, 132–145. [Google Scholar] [CrossRef]
  33. Teece, D.; Peteraf, M.; Leih, S. Dynamic Capabilities and Organizational Agility: Risk, Uncertainty, and Strategy in the Innovation Economy. Calif. Manag. Rev. 2016, 58, 13–35. [Google Scholar] [CrossRef]
  34. Buckley, J.W.; Lightner, K.M. Accounting: An Information Systems Approach; Dickenson Publishing Company: Encino, LA, USA, 1973. [Google Scholar]
  35. Becerra-Fernandez, I.; Leidner, D.E. Knowledge Management and Organizational Culture. In Knowledge Management: An Evolutionary View. Advances in Management Information System; Becerra-Fernandez, I., Leidner, D., Eds.; M.E. Sharpe, Inc.: Amonk, NY, USA, 2008; Volume 12, pp. 40–60. [Google Scholar]
  36. Cai, Z.; Huang, Q.; Liu, H.; Davison, R.M.; Liang, L. Developing Organizational Agility through IT Capability and KM Capability: The Moderating Effects of Organizational Climate. In Proceedings of the 17th Pacific Asia Conference on Information Systems (PACIS), Jeju Island, Korea, 18–22 June 2013. [Google Scholar]
  37. Barney, J. Firm Resources and Sustained Competitive Advantage. J. Manag. 1991, 17, 99–120. [Google Scholar] [CrossRef]
  38. Peteraf, M.A. The corner-stones of competitive advantage: A resource-based view. Strateg. Manag. J. 1993, 14, 179–191. [Google Scholar] [CrossRef]
  39. Wilden, R.; Gudergan, S.P.; Nielsen, B.B.; Lings, I. Dynamic Capabilities and Performance: Strategy, Structure and Environment. Long Range Plan. 2013, 46, 72–96. [Google Scholar] [CrossRef]
  40. Sarkar, M.B.; Echambadi, R.; Agarwal, R.; Sen, B. The effect of the innovative environment on exit of entrepreneurial firms. Strateg. Manag. J. 2006, 27, 519–539. [Google Scholar] [CrossRef]
  41. Smith, K. Industrial structure, technology intensity and growth: Issues for policy. In Proceedings of the DRUID Conference on National Innovation Systems, Industrial Dynamics and Innovation Policy, Rebild, Denmark, 9–12 June 1999. [Google Scholar]
  42. Sáez-Martínez, F.J.; González-Moreno, Á. Strategic Renewal, Cooperation, and Performance: A Contingency Approach. J. Manag. Strategy 2011, 2, 43–55. [Google Scholar] [CrossRef]
  43. Xiao, Y.; Tylecote, A.; Liu, J. Why not greater catch-up by Chinese firms? The impact of IPR, corporate governance and technology intensity on late-comer strategies. Res. Policy 2013, 42, 749–764. [Google Scholar] [CrossRef]
  44. Sandven, T.; Smith, K.; Kaloudis, A. Structural change, growth and innovation: The roles of medium and low tech industries, 1980–2000. In Low-Tech Innovation in the Knowledge Economy; Hirsch-Kreinsen, H., Jacobson, D., Laestadius, S., Eds.; Peter Lang: Frankfurt, Germany, 2005; pp. 31–59. [Google Scholar]
  45. OECD. Science, Technology and Industry Scoreboard—Towards a Knowledge Based Economy; OECD: Paris, France, 2001. [Google Scholar]
  46. Thamhain, H.J. Management of Technology: Managing Effectively in Technology-Intensive Organizations; John Wiley & Sons: Hoboken, NJ, USA, 2013. [Google Scholar]
  47. Garcés-Galdeano, L.; Larraza-Kintana, M.; García-Olaverri, C.; Makri, M. Entrepreneurial orientation in family firms: The moderating role of technological intensity and performance. Int. Entrep. Manag. J. 2016, 12, 27–45. [Google Scholar] [CrossRef]
  48. Sadegh Sharifirad, M.; Ataei, V. Organizational culture and innovation culture: Exploring the relationships between constructs. Leadersh. Org. Dev. J. 2012, 33, 494–517. [Google Scholar] [CrossRef]
  49. Neirotti, P.; Paolucci, E. Industry and firm effects on IT diffusion processes: Firm-level evidence in Italian enterprises. Ind. Corp. Chang. 2014, 23, 717–757. [Google Scholar] [CrossRef]
  50. He, X.; Chakrabarty, S.; Eden, L. The global emergence of Chinese multinationals: A resource-based view of ownership and performance. Asian Bus. Manag. 2016, 15, 1–31. [Google Scholar] [CrossRef]
  51. Prajogo, D.; McDermott, C.; Jayaram, J. The role of technological intensity in services on the capability to performance relationships—An examination in the Australian context. J. Eng. Technol. Manag. 2014, 31, 58–72. [Google Scholar] [CrossRef]
  52. Lepak, D.; Takeuchi, R.; Snell, S. Employment flexibility and firm performance: Examining the interaction effects of employment mode, environmental dynamism, and technological intensity. J. Manag. 2003, 29, 681–703. [Google Scholar]
  53. Cotec. Tecnología e innovación en España. Informe COTEC 2009; Fundación Cotec: Madrid, Spain, 2009. [Google Scholar]
  54. Hair, J.F.; Hult, G.T.M.; Ringle, C.M.; Sarstedt, M. A Primer on Partial Least Squares Structural Equation Modeling (PLS-SEM), 2nd ed.; SAGE Publications: Thousand Oaks, CA, USA, 2017. [Google Scholar]
  55. Faul, F.; Erdfelder, A.; Buchner, A.; Lang, A.G. Statistical Power Analyses Using G*Power 3.1: Tests for Correlation and Regression Analyses. Behav. Res. Methods 2009, 41, 1149–1160. [Google Scholar] [CrossRef] [PubMed]
  56. Cohen, J. Statistical Power Analysis for the Behavioral Sciences, 2nd ed.; Lawrence Erlbaum Associated: Hillsdale, NJ, USA, 1998. [Google Scholar]
  57. Henseler, J.; Dijkstra, T.K.; Sarstedt, M.; Ringle, C.M.; Diamantopoulos, A.; Straub, D.W.; Ketchen, D.J.; Hair, J.F.; Hult, G.T.M.; Calantone, R.J. Common Beliefs and Reality About PLS: Comments on Ronkko and Evermann (2013). Org. Res. Methods 2014, 17, 182–209. [Google Scholar] [CrossRef]
  58. Henseler, J.; Ringle, C.M.; Sarstedt, M. Testing measurement invariance of composites using partial least squares. Int. Market. Rev. 2016, 33, 405–431. [Google Scholar] [CrossRef]
  59. Henseler, J. Bridging design and behavioral research with variance-based structural equation modeling. J. Advert. 2017, 46, 178–192. [Google Scholar] [CrossRef]
  60. Lu, Y.; Ramamurthy, K. Understanding the link between information technology capability and organizational agility: An empirical examination. MIS Q. 2011, 35, 931–954. [Google Scholar] [CrossRef]
  61. Yang, C.; Liu, H.M. Boosting firm performance via enterprise agility and network structure. Manag. Decis. 2012, 50, 1022–1044. [Google Scholar] [CrossRef]
  62. Bradley, R.V.; Pratt, R.M.; Byrd, T.A.; Outlay, C.N.; Wynn, D.E., Jr. Enterprise architecture, IT effectiveness and the mediating role of IT alignment in US hospitals. Inf. Syst. J. 2012, 22, 97–127. [Google Scholar] [CrossRef]
  63. Tallon, P.P.; Pinsonneault, A. Competing perspectives on the link between strategic information technology alignment and organizational agility: Insights from a mediation model. MIS Q. 2011, 35, 463–486. [Google Scholar] [CrossRef]
  64. Roldán, J.L.; Sánchez-Franco, M.J. Variance-based structural equation modelling: Guidelines for using partial least squares in information systems research. In Research Methodologies, Innovations and philosophies in Software Systems Engineering and Information Systems; Mora, M., Steenkamp, A.L., Gelman, O., Raisinghani, M.S., Eds.; IGI Global: Hershey, PA, USA, 2012; pp. 193–221. [Google Scholar]
  65. Rigdon, E.E. Rethinking Partial Least Squares Path Modeling: In Praise of Simple Methods. Long Range Plan. 2012, 45, 341–358. [Google Scholar] [CrossRef]
  66. Becker, J.-M.; Rai, A.; Rigdon, E. Predictive validity and formative measurement in structural equation modeling: Embracing practical relevance. In Proceedings of the Thirty Fourth International Conference on Information Systems, Milan, Italy, 15–18 December 2013. [Google Scholar]
  67. Sarstedt, M.; Hair, J.F.; Ringle, C.M.; Thiele, K.O.; Gudergan, S.P. Estimation issues with PLS and CBSEM: Where the bias lies! J. Bus. Res. 2016, 69, 3998–4010. [Google Scholar] [CrossRef]
  68. Rigdon, E.E. Choosing PLS path modeling as analytical method in European management research: A realist perspective. Eur. Manag. J. 2016, 34, 598–605. [Google Scholar] [CrossRef]
  69. Chin, W.W. How to write up and report PLS analyses. In Handbook of Partial Least Squares; Springer: Berlin/Heidelberg, Germany, 2010; pp. 655–690. [Google Scholar]
  70. Wright, R.T.; Campbell, D.E.; Thatcher, J.B.; Roberts, N. Operationalizing multidimensional constructs in structural equation modeling: Recommendations for IS research. Commun. Assoc. Inf. Syst. 2012, 30, 367–412. [Google Scholar]
  71. Hair, J.F.; Ringle, C.M.; Sarstedt, M. PLS-SEM: Indeed a silver bullet. J. Market. Theory Pract. 2011, 19, 139–152. [Google Scholar] [CrossRef]
  72. Ringle, C.M.; Wende, S.; Becker, J.-M. SmartPLS 3; SmartPLS GmbH: Boenningstedt, Germany, 2015. [Google Scholar]
  73. Podsakoff, P.M.; MacKenzie, S.B.; Lee, J.-Y.; Podsakoff, N.P. Common method biases in behavioral research: A critical review of the literature and recommended remedies. J. Appl. Psychol. 2003, 88, 879–903. [Google Scholar] [CrossRef] [PubMed]
  74. Schwarz, A.; Rizzuto, T.; Carraher-Wolverton, C.; Roldán, J.L.; Barrera-Barrera, R. Examining the Impact and Detection of the “Urban Legend” of Common Method Bias. DATA BASE Adv. Inf. Syst. 2017, 48, 93–119. [Google Scholar] [CrossRef]
  75. Podsakoff, P.M.; MacKenzie, S.B.; Podsakoff, N.P. Sources of Method Bias in Social Science Research and Recommendations on How to Control It. Annu. Rev. Psychol. 2012, 63, 539–569. [Google Scholar] [CrossRef] [PubMed]
  76. Kock, N. Common method bias in PLS-SEM: A full collinearity assessment approach. Int. J. E-Collab. 2015, 11, 1–10. [Google Scholar] [CrossRef]
  77. Kock, N.; Lynn, G.S. Lateral Collinearity and Misleading Results in Variance-Based SEM : An Illustration and Recommendations. J. Assoc. Inf. Syst. 2012, 13, 546–580. [Google Scholar]
  78. Henseler, J.; Ringle, C.M.; Sarstedt, M. A new criterion for assessing discriminant validity in variance-based structural equation modeling. J. Acad. Market. Sci. 2015, 43, 115–135. [Google Scholar] [CrossRef]
  79. Urbach, N.; Ahlemann, F. Structural equation modeling in information systems research using partial least squares. JITTA J. Inf. Technol. Theory Appl. 2010, 11, 5. [Google Scholar]
  80. Petter, S.; Straub, D.; Rai, A. Specifying formative constructs in information systems research. MIS Q. 2007, 31, 623–656. [Google Scholar] [CrossRef]
  81. Chin, W.W. The partial least squares approach to structural equation modeling. Mod. Methods Bus. Res. 1998, 295, 295–336. [Google Scholar]
  82. Henseler, J.; Fassott, G. Testing moderating effects in PLS path models: An illustration of available procedures. In Handbook of Partial Least Squares; Springer: Berlin/Heidelberg, Germany, 2010; pp. 713–735. [Google Scholar]
  83. Chin, W.W.; Dibbern, J. An introduction to a permutation based procedure for multi-group PLS analysis: Results of tests of differences on simulated data and a cross cultural analysis of the sourcing of information system services between Germany and the USA. In Handbook of Partial Least Squares; Springer: Berlin/Heidelberg, Germany, 2010; pp. 171–193. [Google Scholar]
  84. Shmueli, G.; Koppius, O. Predictive Analytics in Information Systems Research. MIS Q. 2011, 35, 553–572. [Google Scholar] [CrossRef]
  85. Straub, D.; Boudreau, M.C.; Gefen, D. Validation Guidelines for IS Positivist Research. Commun. Assoc. Inf. Syst. 2004, 13, 380–427. [Google Scholar]
  86. Shmueli, G.; Ray, S.; Velasquez Estrada, J.M.; Chatla, S.B. The elephant in the room: Predictive performance of PLS models. J. Bus. Res. 2016, 69, 4552–4564. [Google Scholar] [CrossRef]
  87. SmartPLS. PLS Predict SmartPLS. 2017. Available online: https://www.smartpls.com/documentation/algorithms-and-techniques/predict (accessed on 10 October 2017).
  88. Danks, N.; Ray, S.; Shmueli, G. Evaluating the Predictive Performance of Constructs in PLS Path Modeling (Working Paper October 18, 2017). Available online: https://papers.ssrn.com/sol3/papers.cfm?abstract_id=3055222 (accessed on 19 October 2017).
  89. Woodside, A.G. Moving beyond multiple regression analysis to algorithms: Calling for adoption of a paradigm shift from symmetric to asymmetric thinking in data analysis and crafting theory. J. Bus. Res. 2013, 66, 463–472. [Google Scholar] [CrossRef]
  90. Narasimhan, R.; Das, A. Manufacturing agility and supply chain management practices. Prod. Inventory Manag. J. 1999, 40, 4. [Google Scholar]
  91. Kidd, P.T. Agile Manufacturing: A Strategy for the 21st Century. In Proceedings of the IEE Colloquium on Agile Manufacturing (Digest No. 1995/179), Coventry, UK, 26 October 1995; pp. 1/1–1/6. [Google Scholar]
  92. Chan, Y.; Denford, J.; Wang, J. The Influence of IT and Knowledge on Firm Agility and Performance. In Proceedings of the 21st Americas Conference on Information Systems (AMCIS), Fajardo, Puerto Rico, 13–15 August 2015; pp. 1–14. [Google Scholar]
  93. Denning, S. Why Agile can be a game changer for managing continuous innovation in many industries. Strategy Leadersh. 2013, 41, 5–11. [Google Scholar] [CrossRef]
  94. Boisnier, A.; Chatman, J.A. The role of subcultures in the agile organization. In Leading and Managing People in the Dynamic Organization; Peterson, R.S., Mannix, E.A., Eds.; Lawrence Erlbaum Associates, Publishers: Mahwah, NJ, USA, 2003; pp. 87–112. [Google Scholar]
  95. Sanz-Valle, R.; Naranjo-Valencia, J.C.; Jiménez-Jiménez, D.; Perez-Caballero, L. Linking organizational learning with technical innovation and organizational culture. J. Knowl. Manag. 2011, 15, 997–1015. [Google Scholar] [CrossRef]
  96. Denison, D.R.; Spreitzer, G.M. Organizational culture and organizational development: A competing values approach. Res. Org. Chang. Dev. 1991, 5, 1–21. [Google Scholar]
  97. Roldán, J.L.; Leal-Rodríguez, A.L.; Leal, A.G. The influence of organizational culture on the Total Quality Management programme performance. Investigaciones Europeas de Dirección y Economía de la Empresa 2012, 18, 183–189. [Google Scholar] [CrossRef]
  98. Lawrence, P.R.; Lorsch, J.W. Differentiation and integration in complex organizations. Adm. Sci. Q. 1967, 12, 1–47. [Google Scholar] [CrossRef]

Article Metrics

Citations

Article Access Statistics

Multiple requests from the same IP address are counted as one view.