Abstract
An optimization system that supports the production of concrete while minimizing carbon dioxide (CO2) emissions or costs is presented that incorporates an evolution algorithm for the materials’ mix design stage, a trigonometric function for the transportation stage, and a stochastic model for the manufacturing stage. A case study demonstrates that applying the optimization system reduced CO2 emissions by 34% compared to the standard concrete production processes typically used. When minimizing the cost of concrete production was prioritized, the cost dropped by 1% compared to the cost of conventional concrete production. These findings confirm that this optimization system helps with the design of the concrete mix and the choice of a material supplier, thus reducing both CO2 emissions and costs.
1. Introduction
The Korean government plans to reduce its greenhouse gas emissions by 37% by 2030. However, carbon dioxide (CO2) emissions per capita in Korea have actually increased by 113% since 1990, the highest for any of the Organization for Economic Co-operation and Development (OECD) countries.
Because the CO2 emissions created by the Korean construction industry account for 40% of the nation’s total, it is essential to reduce the amount of CO2 generated by construction activities if Korea is to attain its ambitious greenhouse gas reduction goal [1]. Concrete is known to emit particularly high amounts of environmentally damaging waste over its life cycle of production, construction, maintenance and, eventually, demolition. The industry is well aware of this; the amount of CO2 emissions produced is specified in a ready-mixed concrete (RMC) report that is provided whenever concrete is sold commercially in Korea. Although this has led to many studies addressing the quantitative evaluation and reduction of the environmental effects of concrete, little research has considered the development of optimization systems that would enable concrete production companies to reduce the CO2 emissions associated with concrete. This study therefore focused on developing an optimization system, dubbed the concrete life cycle assessment system (CLAS), to recommend options to help minimize CO2 emissions and/or the costs incurred at every stage of the concrete production process.
2. Review of Life Cycle Assessment Programs
A number of software programs have been developed to help those seeking to perform life cycle assessment (LCA) calculations to assess the environmental impact of different construction materials. The TOTAL (Tool for Type labeling and LCA) program was developed by researchers at the Korean Ministry of the Environment to define how product labels must comply with the data format required by the country’s environmental performance declaration system [2].
An additional program, Product Assessment for Sustainable Solutions (PASS), was developed by staff at the Korean Ministry of Knowledge Economy to perform LCA calculations. The energy section of the associated Life Cycle Index database includes fuels such as diesel, gasoline and coal, while the construction-related materials section includes items such as cement, concrete and different types of glass [3]. Another useful tool is the COOL program, which was exclusively designed to help companies create accurate carbon footprint labels and was developed by the Korean Environmental Industry & Technology Institute to assist companies applying for carbon footprint label certification [4].
The effort to identify environmental impacts is international. For example, the Building for Environmental and Economic Sustainability (BEES) program was developed by the National Institute of Standards and Technology in the United States to help designers make informed materials decisions by integrating the environmental impacts and costs for buildings and materials into a single tool. BEES helps architects and engineers select a suitable product for their desired application that balances environmental considerations with economic performance [5]. The ATHENA Impact Estimator was developed by Canadian researchers to facilitate building design by modelling the environmental impact of changing the shape, design, or material makeup of a building, allowing designers to optimize the operating energy effects over the complete building life cycle [6].
In Europe, GaBi software was developed to manage sustainability through LCA and to assess environmental design and energy efficiency. The associated database is managed by the GaBi database manager and the program provides detailed classification of substances and production processes [7]. In the United Kingdom, the building LCA program ENVEST2 was developed by the Building Research Establishment to assess building structures. It not only simplifies the multiple processes of determining life cycle costs and environmental impacts when designing buildings, but also identifies the elements with the greatest influence on a building’s environmental impact and life cycle cost, and shows the effects of selecting different materials [8]. Also in the UK, the program LCA in Sustainable Architecture (LISA) was developed by Newcastle University and BHP Research Laboratories with a convenient interface consisting of a simple input–output form to facilitate its use [9]. Also in Europe, the BECOST building LCA program was developed by the VTT Technical Research Centre of Finland for use in developing carbon emission reduction technologies based on the environmental impact data deduced from the life cycle assessment of buildings, including their design, construction, maintenance, and demolition [10]. Elsewhere, Eco-Quantum is Australia’s leading life cycle assessment program, providing LCA and greenhouse gas and carbon assessment services based on the life cycle data for various products or services. Eco-Quantum is the first building life cycle assessment program to assess environmental effects based on the energy consumption incurred in building structures [11].
3. Development of an Optimization System
3.1. Characteristics of the Optimization System
The CLAS optimization system developed for this study is designed to evaluate the CO2 emissions and costs of concrete from an LCA perspective and suggest methods to reduce both. The system includes a method and database that allows users to evaluate CO2 emissions and costs relatively simply. The first step in the development of the new system was to establish a system boundary for the life cycle CO2 emission and cost evaluations for concrete that would be used in the program (Figure 1). The product stage of concrete (the so-called “cradle to gate” for the product, up to the point at which it leaves the manufacturer’s premises), based on ISO 14044 [12] and ISO 21930 [13], was selected as a convenient system boundary. The product stages for concrete were divided into three stages: raw material, transportation, and manufacturing.
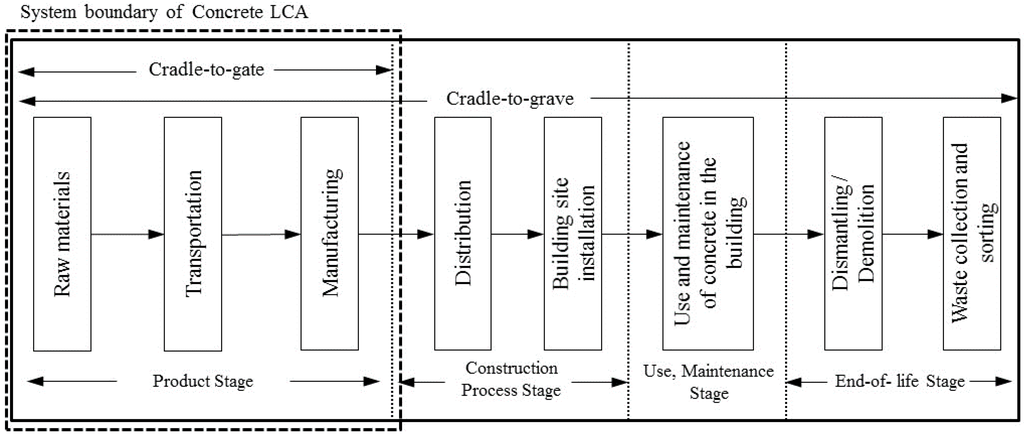
Figure 1.
System Boundary for Concrete Life Cycle Assessment (LCA).
The raw material stage includes the CO2 emissions created during the production of the major components of concrete, namely cement, aggregate, and water, while the transportation stage looks at the CO2 emissions due to the transportation of raw materials to the RMC manufacturing plant and the manufacturing stage considers the CO2 emissions caused by the generation of electricity and the use of fossil fuels in the concrete batch plant. CLAS assesses the CO2 emissions and costs when the optimization technique is applied during the product stages of concrete, and then identifies the specific mix design and/or supplier that will minimize either the CO2 emissions or costs. The methods applied at each stage, as well as the database and input/output items, are shown in Figure 2. A mechanism to cope with fluctuations in the basic unit of CO2 emission (kg-CO2/kg) and the costs of concrete components such as cement and aggregate was incorporated into CLAS; its database structure was designed to allow the basic units of CO2 emission and costs to be easily updated and changed. The updated database is then accessed by the program when calculating the optimal result.
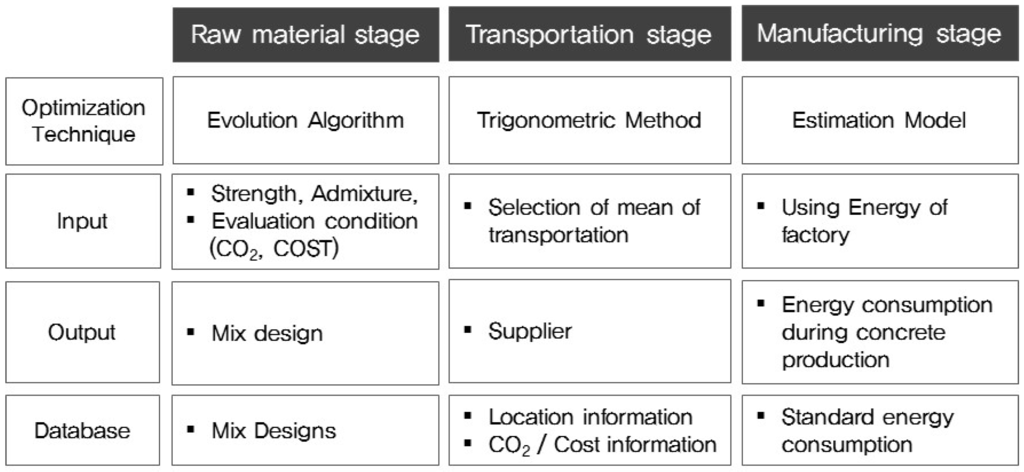
Figure 2.
Evaluation Process for the Optimization System.
3.1.1. Raw Material Stage
CO2 emission from concrete production was calculated as the sum of the quantity of each ingredient used for producing 1 m3 of concrete and the CO2 emission base units. The base units of the CO2 emission for cement, aggregate, and water were based on the Korea LCI (Life Cycle Inventory) database (DB). In addition, blast furnace slag, fly ash, and chemical admixtures which are not database units in Korea, were applied to the overseas LCI database [13,14]. Equation (1) is used for calculating of CO2 emission during the production of the raw material required for manufacturing 1 m3 of concrete. Table 1 lists the CO2 emission reference of each ingredient.
CO2 M = ∑(M(i) × CO2 emission factor M)
(i = 1: cement, 2: aggregate, 3: admixture, 4: water)
(i = 1: cement, 2: aggregate, 3: admixture, 4: water)
Cost M = ∑(M(i) × Unit price M)
(i = 1: cement, 2: aggregate, 3: admixture, 4: water)
(i = 1: cement, 2: aggregate, 3: admixture, 4: water)

Table 1.
LCI (Life Cycle Inventory) database (DB) of raw materials.
CO2 M is the CO2 emission at the raw material stage for the production of 1 m3 concrete (kg-CO2/m3); CO2 emission factor M is the CO2 emission factor for each material (kg-CO2/kg); Cost M is the cost at the raw material stage for the production of 1m3 concrete ($/m3); Unit price M is the cost for each material ($/kg); and M(i) is the amount of material used of concrete (kg/m3).
3.1.2. Transportation Stage
For assessing the CO2 emission due to transportation, the total quantity used and the load for each component were measured for calculating the vehicle number required for transportation. The calculated number of vehicles, distance, and fuel efficiency of each vehicle were used for assessing the CO2 emissions. In this study, a truck’s speed and traffic weren’t considered. Equation (3) gives the quantity of CO2 emission equation for the transportation stage. Table 2 lists the CO2 emission reference of each transportation method.
CO2 T = ∑[(M(i)/Lt) × (d/e) × CO2 emission factor T]
(i = 1: cement, 2: coarse aggregate, 3: fine aggregate, 4: admixture)
(i = 1: cement, 2: coarse aggregate, 3: fine aggregate, 4: admixture)
Cost T = ∑[(M(i)/Lt) × (d/e) × Unit price T]
(i = 1: cement, 2: coarse aggregate, 3: fine aggregate, 4: admixture)
(i = 1: cement, 2: coarse aggregate, 3: fine aggregate, 4: admixture)
Table 2.
LCI DB of transportation method.
CO2 T is the CO2 emission at the transportation stage for the production of 1 m3 concrete (kg-CO2/m3); CO2 emission factor T is the CO2 emission factor of the energy resource (kg-CO2/kg); Cost T is the cost at the transportation stage for the production of 1m3 concrete ($/m3); Unit price T is the cost of the energy resource (oil) ($/L); M(i) is the amount of material used of concrete (kg/m3); Lt is the transportation load (tons), d is the transportation distance (km); and e is the fuel efficiency (km/L).
3.1.3. Manufacturing Stage
The CO2 emitted from concrete manufacturing can be calculated using the amount of energy consumed by the manufacturing equipment for producing 1 m3 of concrete and converting that to CO2. For following this approach, the concrete manufacturing process must be divided and the consumed energy must be calculated. The concrete manufacturing process can be divided into the following five stages: loading; storage; transportation; measurement for mixing; and mixing. The equipment required and the data related to the power and fossil fuel energy consumed in each stage are examined; then, by analyzing the ratio between the capacity of each piece of equipment and the total amount of electricity used, the energy consumed for manufacturing 1 m3 of concrete can be calculated. Equation (5) is used for calculating the quantity of CO2 emitted during the manufacturing process, and Table 3 lists the CO2 emission reference of energy source.
CO2 F = ∑[(E(i)/R) × CO2 emission factor F]
(i = 1: electricity usage, 2: oil usage, 3: water usage)
(i = 1: electricity usage, 2: oil usage, 3: water usage)
Cost F = ∑[(E(i)/R) × Unit price F]
(i = 1: electricity usage, 2: oil usage, 3: water usage)
(i = 1: electricity usage, 2: oil usage, 3: water usage)
Table 3.
LCI DB of energy source.
CO2 F is the CO2 emission at the manufacturing stage for production of 1 m3 concrete (kg-CO2/m3); CO2 emission factor F is the CO2 emission factor (kg-CO2/kwh, L, kg)] of an energy resource; Cost F is the cost at the manufacturing stage for production of 1 m3 concrete (kg-CO2/m3); Unit price F is the cost of an energy resource ($/kwh, L, kg), R denotes the annual RMC production (m3/year)]; and E(i) denotes the annual energy usage (unit/year).
3.2. Application of Optimization Techniques
3.2.1. Evolution Algorithm for the Materials Stage
The evolution algorithm applied in this stage generates a probable variable from the first parent group. The initial variable is set to be close to the preset objective value in order to generate the next-generation group [14,15]. The variable most suited to the objective can then be obtained through a mutation and reproduction process [16]. The parent group’s selection is critical, because the reactions of concrete mix designs depend on the amount of each raw material. However, the evolution algorithm can reduce the error in the next-generation group because it selects the parent group nearest to the target to derive the mix design [17,18,19,20,21,22].
- (1)
- Mix Design by Applying the Evolution Algorithm
To minimize CO2 emissions, the maximum possible amount of admixture (granulated blast furnace slag/fly ash (GGBS/FA)) is included in the mix design. This means that the mix design can be derived by using the evolution algorithm and inputting the strength, mix ratio (%), and admixture type without the need for basic information, such as the water/binder ratio, slump, air content, coarse aggregate size, or specific gravity. We can also establish an objective function by analyzing the amounts of the materials involved and their costs for the mix, the admixture types and CO2 emissions, and the admixture mix ratios and CO2 emissions [23].
- (2)
- Process of Mix Design Deduction
Figure 3 shows the process of deriving the concrete mix design using the evolution algorithm. After information regarding the concrete strength, admixture types, and mix ratio has been entered, it is immediately transferred to the established database of mix designs, where mix designs that are consistent with the input data (for example, strength, admixture type, and mix ratio) are identified and established as the initial group. These processes are performed to generate the initial group needed to apply the evolution algorithm [17].
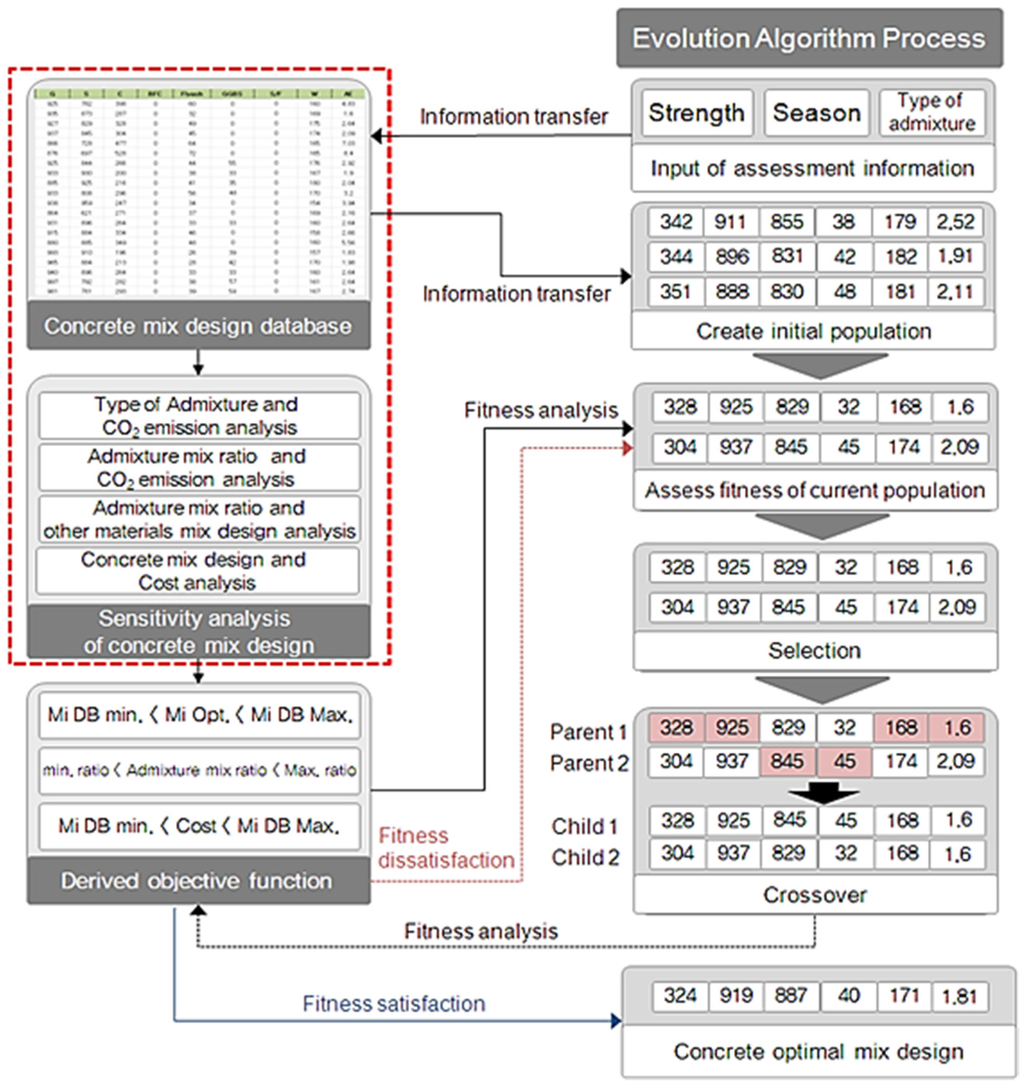
Figure 3.
Process Used to Derive the Mix Design Based on the Evolution Algorithm.
A test of fit is performed on the mix designs that constitute the generated initial group. This test is performed to establish the maximum and minimum range of CO2 emissions, costs, and mix amounts of materials by analyzing the CO2 emissions and the cost of each mixture design. A test fit is also conducted to evaluate the fit of the mix designs derived from the initial mix design group and any recombination options.
- (3)
- Analysis for the Mix Design Selection Process
Among the initial mix design groups, those mix designs that satisfy the fit test are selected to generate a new group of mix designs according to the approach proposed by Kim et al. [17].
M(i) DB min. mix volume < M(i) mix volume < M(i) DB max. mix volume
(i = mixing materials)
(i = mixing materials)
M(i) DB min. ratio < M(i) admixture mix ratio < M(i) DB max. ratio
M(i) CO2 emission < M(i) DB min. CO2 emission
M(i) DB min. cost < M(i) cost < M(i) DB max. cost
(i = compressive strength)
(i = compressive strength)
Intersection and combination processes are also performed on the mix designs to derive the new mix design, which is again analyzed using a fit test. These processes are performed repeatedly until the fit criteria are satisfied.
As shown in Figure 4, when the mix types are classified into plain, GGBS mixtures, fly ash mixtures, and GGBS/fly ash mixtures in mix designs with a strength of 24 MPa, the minimum CO2 emissions identified using this procedure are 319 [kg/m3], 295 [kg/m3], 271 [kg/m3], and 254 [kg/m3], and the maximum CO2 emissions are 348 [kg/m3], 317 [kg/m3], 307 [kg/m3], and 282 [kg/m3], respectively. These results therefore establish the maximum and minimum ranges of CO2 emissions based on the mix ratios of the admixtures for a given strength of concrete. This allows the quantity of CO2 emissions to be analyzed for each of the admixtures based on the designs for nominal strengths of 18, 21, and 24 MPa. The mix designs with strengths of 21 and 24 MPa, in which both fly ash and granulated blast-furnace slag are mixed, result in the lowest CO2 emissions for this example. CO2 emissions are reduced by approximately 29% and 26%, respectively, relative to those of the plain mix design that did not include any admixture [17].
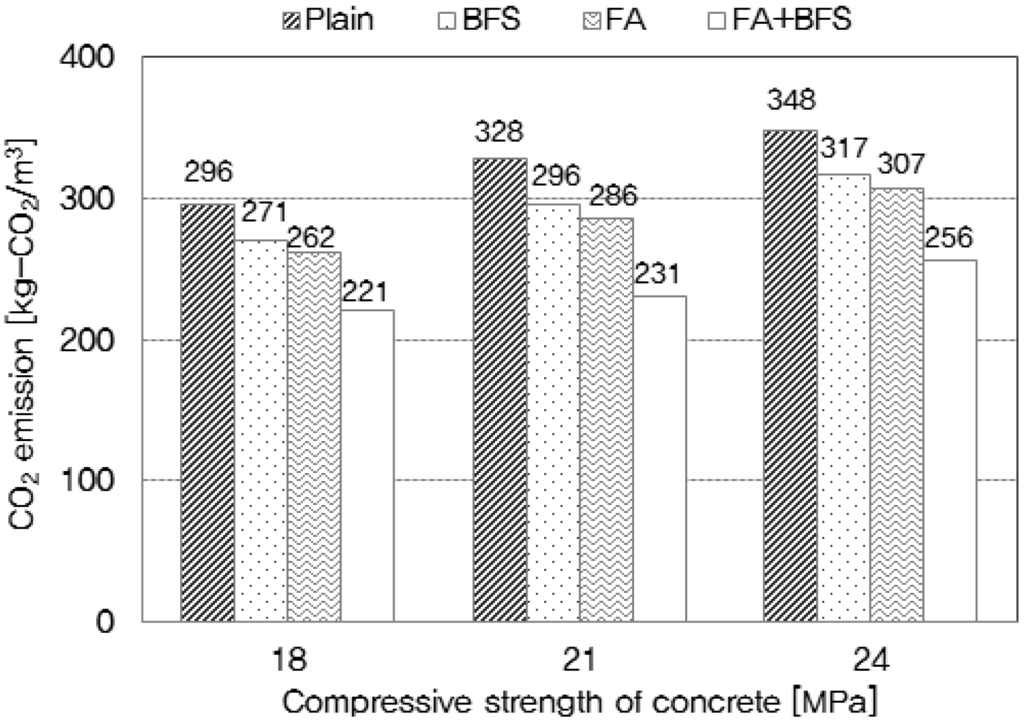
Figure 4.
Carbon dioxide (CO2) Emission Analysis of Concrete by Type of Admixture.
As shown in Figure 5, the CO2 emissions of the 18 MPa strength concrete vary between 251 [kg/m3] and 310 [kg/m3] when the mix ratio of the admixtures is increased from 10% to 30%. This analysis demonstrates that it is indeed possible to determine the maximum and minimum range of the CO2 emissions for specific mix ratios of the admixtures for a given concrete strength. The CO2 emissions decrease as the mix ratios of admixtures such as fly ash and granulated blast-furnace slag increase. Kim et al. [17] analyzed 18, 21, and 24 MPa strength concretes and demonstrated that the concrete mix designs with admixtures of 30% showed CO2 emission that were reduced by 27%, 29%, and 32%, respectively, compared to those with admixtures of 10%.

Figure 5.
Analysis of the CO2 Emissions for Various Admixture Mix Ratio.
Looking at the admixture mixing ratios identified in the study by Kim et al. [17], the amount of coarse aggregate ranged from a minimum of 865 kg/m3 to a maximum of 997 kg/m3; the amount of fine aggregate ranged from 781 kg/m3 to 982 kg/m3; the amount of cement was between a minimum of 158 kg/m3 and a maximum of 389 kg/m3; and the amount of water was between 105 kg/m3 and 185 kg/m3, as shown in Figure 6. Based on these results, the maximum and minimum mix amounts of cement, aggregate, and water for each mix ratio were established.
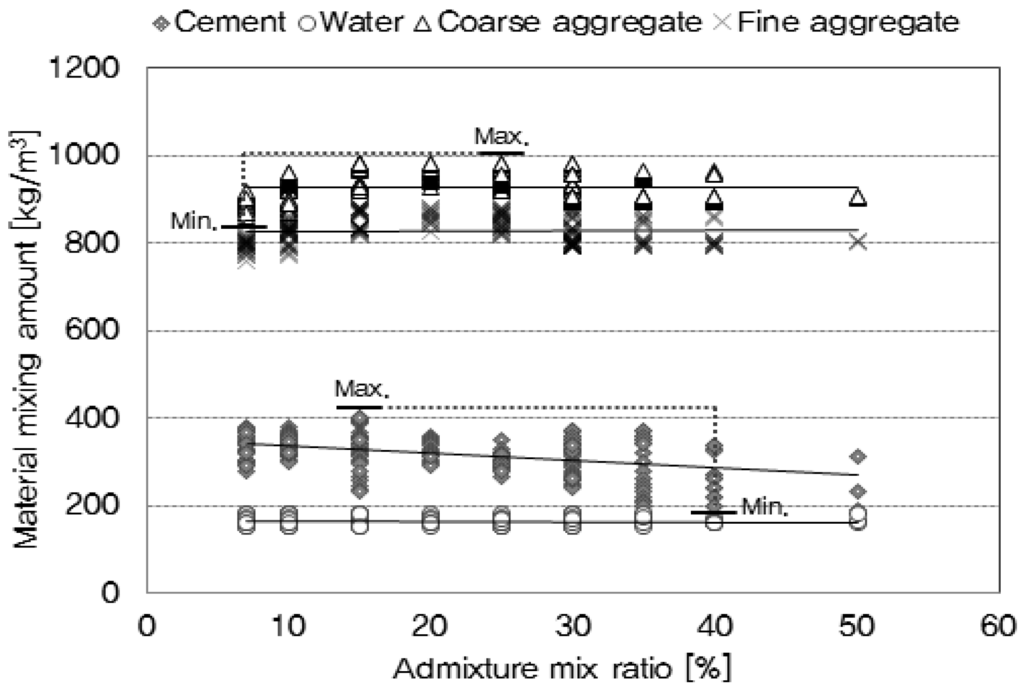
Figure 6.
Analysis of Admixture Mix Ratio and Other Materials.
The cost analysis performed for the mix design process utilizes information from Korea’s price database to determine the product cost [24]. As shown in Figure 7, the cost of concrete with a strength of 24 MPa ranged between US$59.20 and 70.60/m3 , and that of concrete with a strength of 30 MPa ranged between US$63.20 and 73.70/m3. As a result of this analysis, the maximum and minimum costs as a function of concrete strength were established.
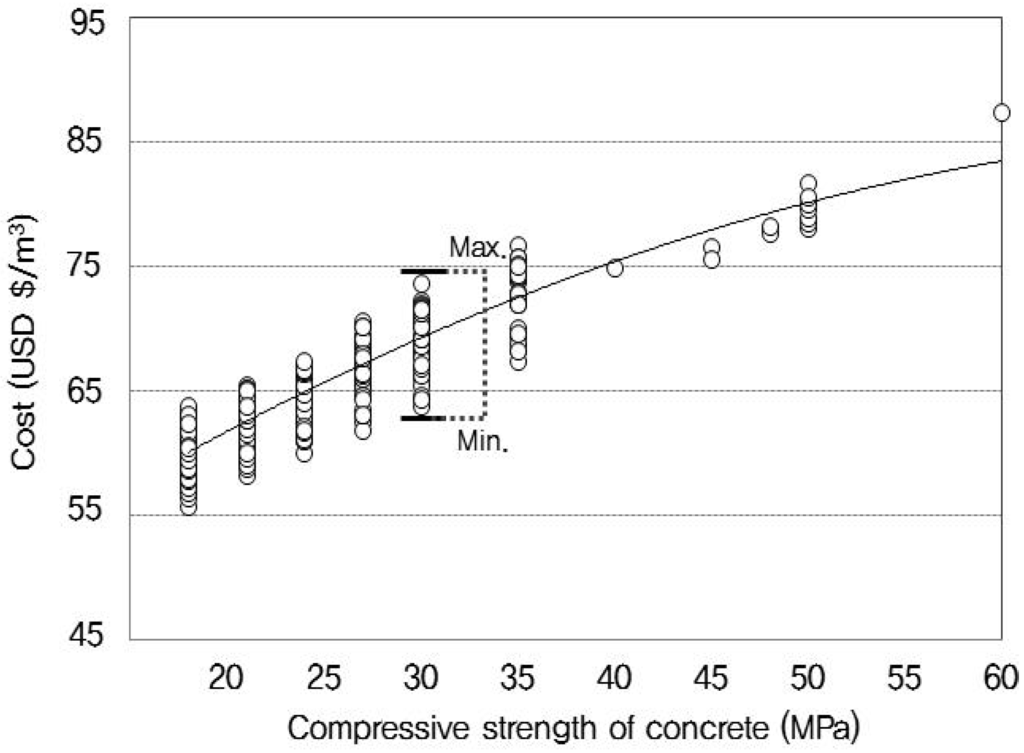
Figure 7.
Cost Analysis Based on the Compressive Strength of Concrete.
The largest contributing factor to the cost per m3 of concrete in the example given here was the mix proportion of cement and aggregate. Not surprisingly, the analysis also showed that the cost increased with strength because the mix ratio for the most expensive cement (in US$/kg) increased with strength. Adjusting the amount of the coarse aggregate and fine aggregate mixed in to the less expensive cement had less effect on the overall concrete cost.
3.2.2. Trigonometric Function Method for the Transportation Stage
This step determines which supplier to select to minimize CO2 emissions and costs when the raw materials for the concrete are transported to a ready mix concrete (RMC) production plant. Looking at the production of each of the possible raw material plants, the optimum supplier is identified by analyzing the CO2 emissions, the unit cost of production and the distance to the concrete production plant. As shown in Figure 8, the distance between the plants can be measured by finding the interval angle (°) between the two points using latitude and longitude coordinates. This can then be multiplied by the radius of the spherical surface, with the surface of the Earth being assumed to be spherical and the distance calculated using the equation below [25,26,27,28]:
where R is the angle between two points (°); X is the latitudinal value of the initial point in radians (°); X′ is the latitudinal value of the terminal point in radians (°); M is the difference between the longitudinal values of the initial point and the terminal point in radians (°); T is the radius of the earth, D is the distance between the two points to be measured (km); and Ed is the radius of the earth (km).
R = Tcos(sin(X) × sin(X′) + cos(X) × cos(X′) × cos(M))
D = R × Ed
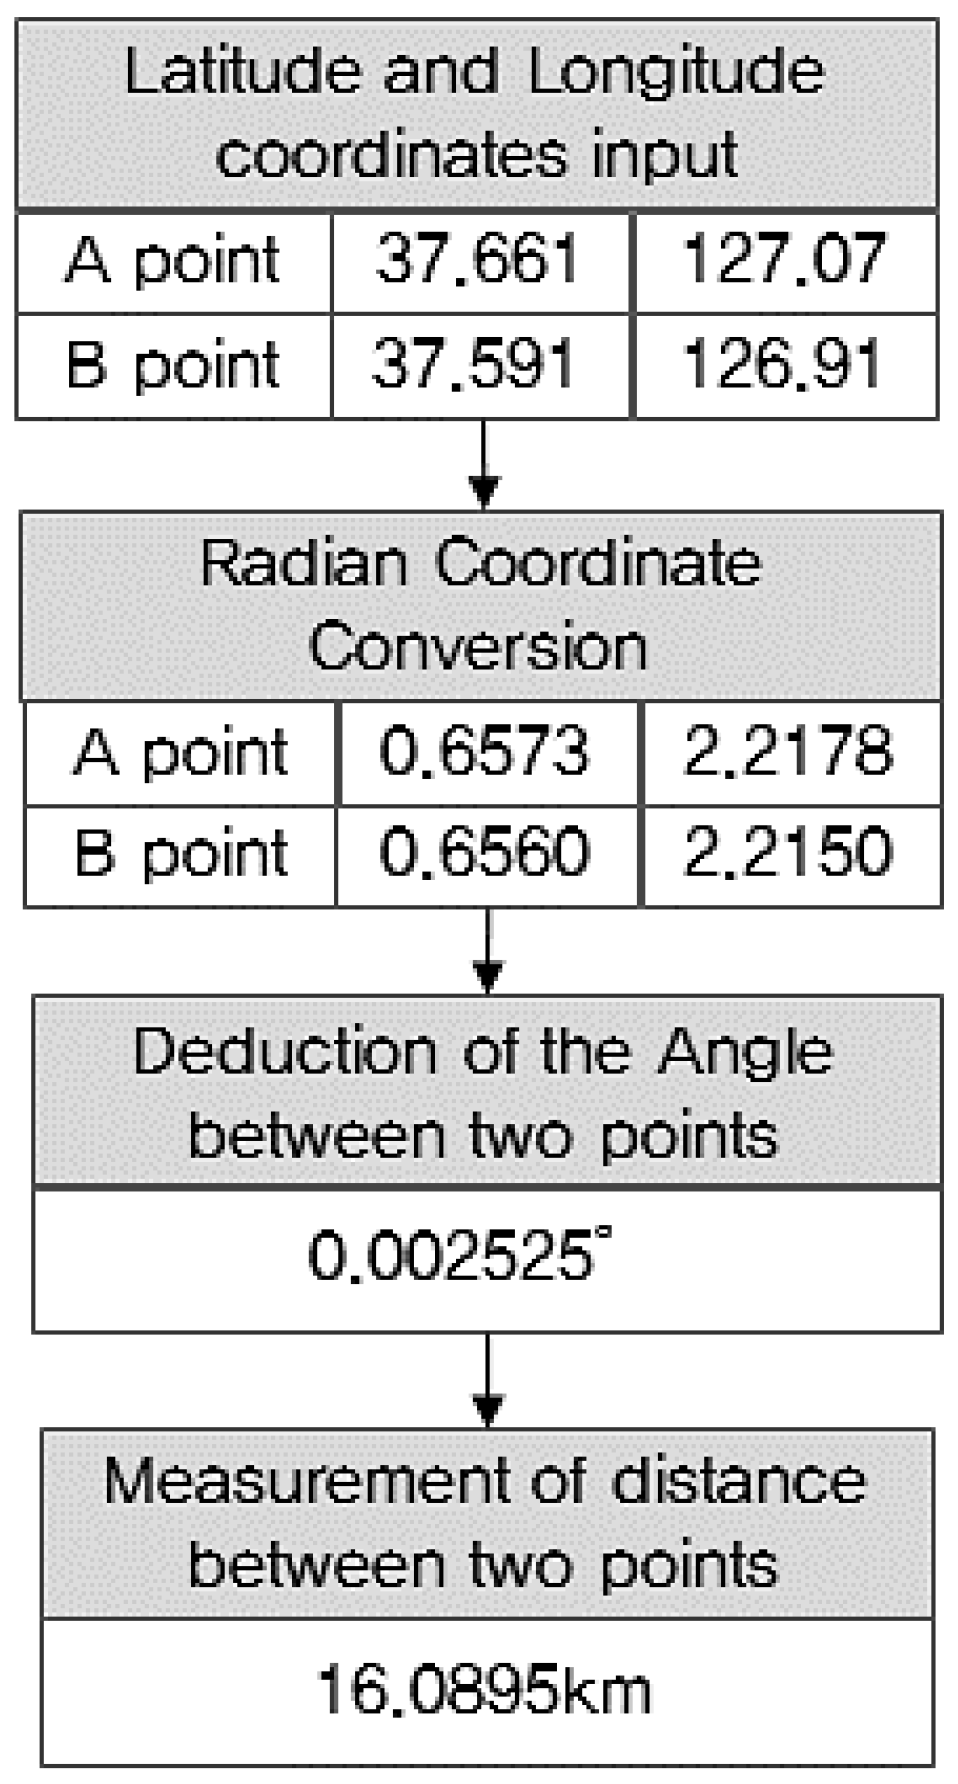
Figure 8.
Process of Measuring the Distance Between Latitude and Longitude Coordinates.
As indicated in Table 4, the location information must be collected for the various plants producing cement, aggregate, and admixtures and transformed into latitude and longitude coordinates. These can then be used to create a database to determine the transportation distance. Within Korea, this location information was collected for 100 cement production plants, 390 aggregate production plants, 15 fly ash production companies, five granulated blast-furnace slag production plants, and 15 chemical admixture production plants. The means of transportation for each component material of concrete was limited to either rail or truck, which were classified into cement freight trains and trucks with capacities of 1, 2.5, 3.5, 5, 8, 15, 18, and 25.5 tons, allowing the number of transportation vehicles for each material to be calculated on the basis of the total quantity (kg) of each component material of the concrete and the capacity (in tons) of the various transport options. The number of transportation vehicles was used to evaluate CO2 emissions and costs by applying the transportation distance, basic unit of CO2 emissions, and fuel cost [29,30,31,32]. Figure 9 depicts the optimal support algorithm for concrete.
Table 4.
Example Database of Contractor Information for Each Material.
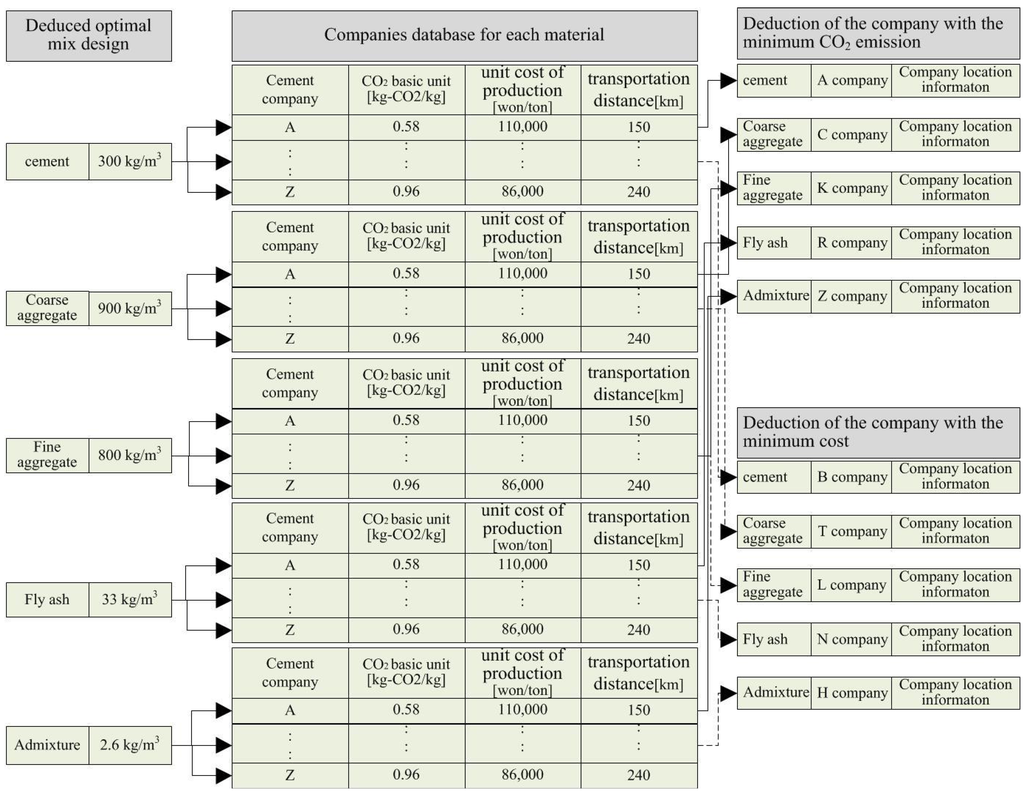
Figure 9.
Optimal Support Algorithm for Concrete.
3.2.3. Stochastic Model for the Manufacturing Stage
The CO2 emissions and costs incurred during the manufacturing stage are determined using manufacturing equipment selection and stochastic model methods. The process begins by gathering data on the actual processes and the equipment capacity of the RMC plant. The energy consumption of the manufacturing equipment is calculated using data from the daily energy consumption of a batch plant comprising a material storage silo and blending mixer.
To identify the amount of energy used to produce 1 m3 of concrete, an analysis was conducted by classifying the batch plant manufacturing equipment into the various types of equipment used for material loading, storage, and mixing (Table 5). Other equipment, such as dust collectors and boilers, must also be classified appropriately. For this step, as indicated in Table 6, a database was established to guide this process by analyzing the annual consumption of electricity, oil, and water at five major concrete production companies in Korea. The analysis revealed that the amounts of energy used and concrete produced varies with the season; there is a significant difference between the summer (April to October) and winter (November to March) figures.
Table 5.
Equipment Survey for Manufacturing Process.
Table 6.
Yearly Energy Consumption and Concrete Production.
3.3. Verification of the Optimization Techniques
3.3.1. Mix Design
Actual concrete mix designs were compared and analyzed to assess the reliability of the mix designs derived using the evolution algorithm. The results confirmed that the actual mix design and the mix design derived using the evolution algorithm were indeed similar, as shown in Figure 10, regardless of the concrete strength. The mix design error rates for the cement, water, and aggregate, which determine the physical properties of the concrete, were consistently within 5%. We therefore concluded that this mixture algorithm could be used in the development of the new optimization system, CLAS [33,34,35].
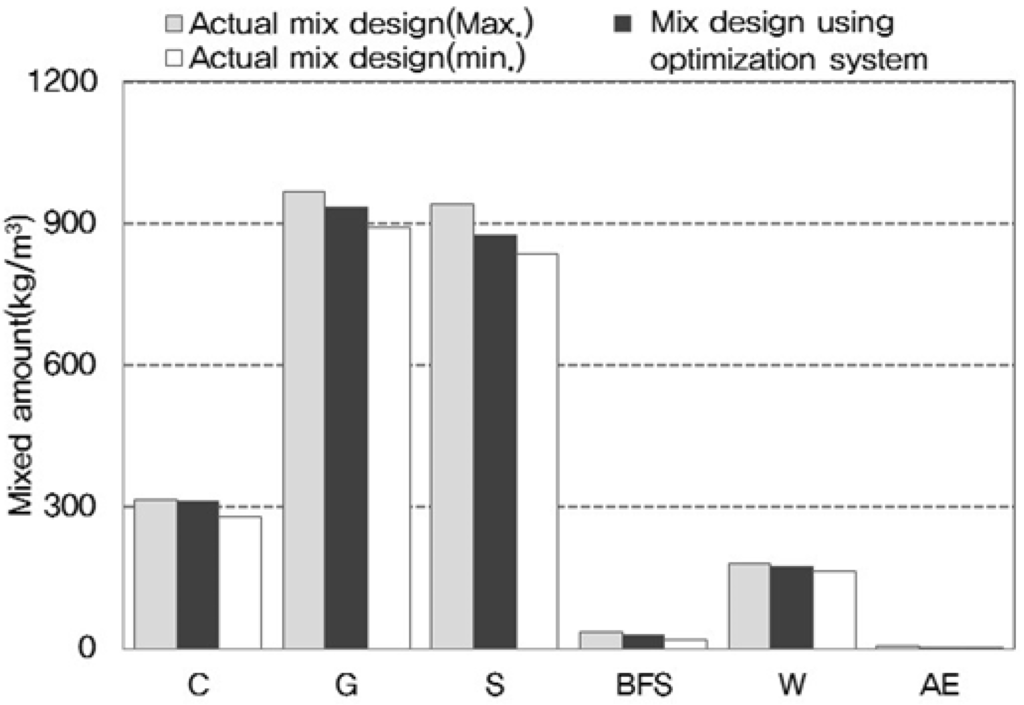
Figure 10.
Comparison of mix design for concrete.
3.3.2. Investigation of the Manufacturing Equipment
To establish an appropriate database, a survey requesting information on aspects such as batch plant facilities, production capacities and operation times was distributed to 51 Korean RMC companies. Based on our analysis of the questionnaire survey responses, 80% (43 of 51) of the companies surveyed were determined to be suitable within the terms of the production process and batch plant facility status proposed in this study.
4. Development of CLAS
CLAS, which assesses CO2 emissions and the costs associated with concrete made using the optimization method, was developed using Visual Basic, as shown in Figure 11. An evaluation of the projected CO2 emissions and costs can be performed on the basis of the information input by the user [36,37,38].
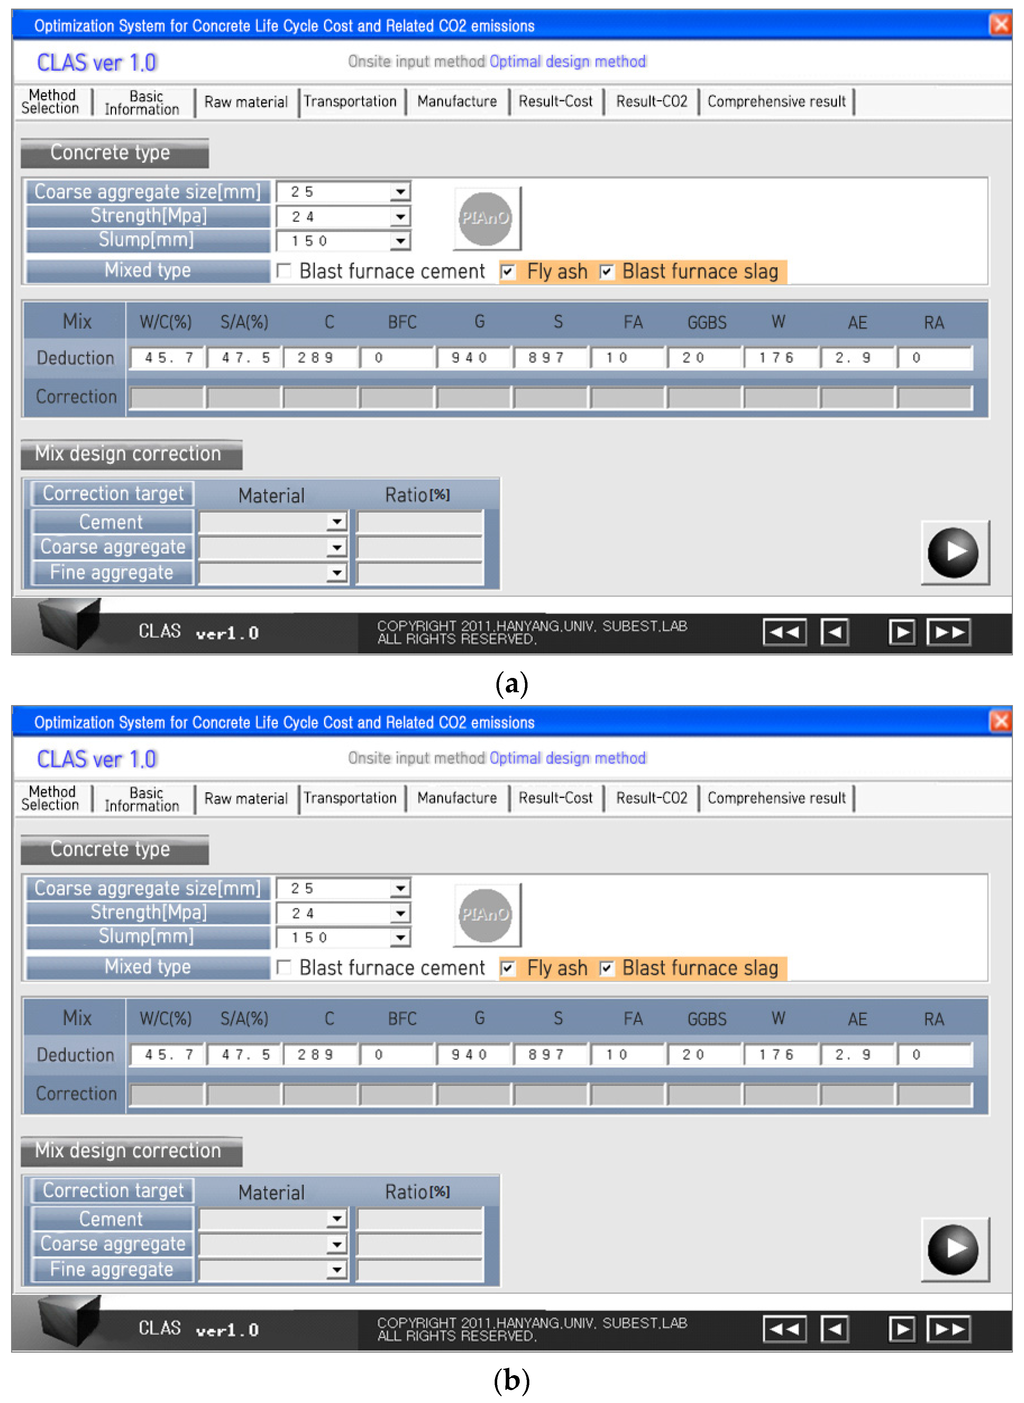
Figure 11.
Screenshots of the New Optimization System (Concrete Life Cycle Assessment System (CLAS)). (a) Basic Information Input Sheet; (b) Materials Stage Input Sheet.
4.1. Basic Information Input Sheet
The basic information input sheet for CLAS asks for the RMC manufacturer, the evaluation date, and the evaluator. The evaluation company can be selected from the database previously established, and the coordinates deduced by directly entering the address for sites that are not yet in the database. The expected production season (summer or winter), volume, and priority (CO2 emissions or cost) must also be entered in turn.
4.2. Raw Materials Stage Input Sheet
In the raw materials stage, the nominal strength, admixture types, and mix ratios (%) of the admixtures are selected. The mix design is derived from the input data, and the evaluator considers the calibration. In terms of calibrating the mix design, cement can be replaced with blast-furnace cement, ground granulated blast-furnace slag, or fly ash; the natural aggregate can be replaced with recycled aggregate [39].
4.3. Transportation Stage Input Sheet
When a means of transportation is selected, the corresponding load capacity and fuel efficiency are automatically assigned. As explained earlier, cement is usually transported by either rail or bulk truck and users will select an option from those offered on a drop-down menu.
4.4. Manufacturing Stage Input Sheet
To calculate the energy consumption, either the equipment selection method or the estimation model method can be selected. When the manufacturing and accessory equipment used in the storage, transportation, and mixing processes are selected as the input values in the equipment selection method, the energy consumption of the evaluation company is automatically computed. For the input values of the estimation model method, the yearly concrete output and the oil, running water, and electrical consumption of the company being evaluated are entered.
4.5. Evaluation Results Sheet
The evaluation result stage determines the mix design and supplier by evaluating the CO2 emissions and the cost of the concrete based on the basic information and the evaluation priority selected. The system then calculates the results automatically based on the data provided and the results of the calculation are displayed as both a table and graph.
5. Case Analysis
5.1. Method
Applying CLAS, the amount of concrete (m3) with a nominal strength of 24 MPa that was actually produced by the RMC plant in May (summer season) was evaluated in terms of the CO2 emissions and cost by applying both the input method currently used and the new optimization system. The conventional input method is applied to the actual mix design and transportation distance, energy consumption, while for the optimization system the priority is set as either minimizing the CO2 emissions or minimizing the costs. The methods for the two approaches are compared in Table 7.
Table 7.
Evaluation Method.
5.2. Results
As the data in Table 8 show, the CO2 emissions generated at the raw materials stage accounted for approximately 96% of the overall emissions and the cost for this stage was approximately 93% of the overall total. The CO2 emissions and costs incurred in the transportation and manufacturing stages accounted for only an insignificant fraction. The CO2 emissions per m3 were 340.9 kg-CO2/m3 for the conventional input method, significantly more than the 225.8 kg-CO2/m3 obtained when minimizing the CO2 emissions was prioritized using the new optimization system. These results indicate that a potential reduction in CO2 emissions of 34% can be obtained compared to those obtained using the conventional input method for the example shown here.
Table 8.
Evaluation Results.
During concrete production, the cost per m3 was determined to be US$49.30/m3 when using the conventional input method; this value was 1% higher than the value obtained when minimizing the cost was prioritized using the new optimization system (US$45.50/m3).
5.2.1. Materials Stage
The mix design used in both the conventional method and the new optimization system for this case analysis is shown in Table 9. The results in Table 9 indicate clear differences between the two methods for the cement, fine aggregate, and admixtures, but the coarse aggregate, water, and other compounds are very similar. For the raw materials stage, the CO2 emissions are 221.8 kg-CO2/m3 when the priority is to minimize the CO2 emissions for the optimization system calculation. These values are 33% less than those predicted for the conventional input method (332.4 kg-CO2/m3).
Table 9.
Mix Designs Applied for Evaluation Method.
A further reduction is found for cement production when minimizing the CO2 emissions is prioritized by the optimization system, with the CO2 emissions dropping to 178.2 kg-CO2/m3, well below the 228.2 kg-CO2/m3 obtained by the conventional method at the raw materials stage. This is because the CO2 emissions due to the cement production processes are significantly greater than those for the aggregate and admixtures. When minimizing the cost is prioritized by the optimization system, the cost drops to US$44.20/m3, which is 6% lower than the value obtained with the conventional input method (US$46.30/m3) because more cement, which has a higher unit production cost, is used in the actual mix design. The unit costs for the production of the aggregate and admixtures have only a relatively insignificant effect.
5.2.2. Transportation Stage
The results shown in Table 10 reveal that the quantity of CO2 emissions is 1.2 kg-CO2/m3 when minimizing the CO2 emissions is prioritized by the optimization system. This is 70% less than that obtained with the typical input method (5.7 kg-CO2/m3) because minimizing CO2 emissions assumes the raw material supplier incurring the shortest transportation distance will be selected to minimize fuel consumption when transporting the raw materials to the RMC plants.
Table 10.
Location of Raw Material Suppliers.
When minimizing the cost is prioritized by the optimization system, the cost is US$0.60/m3, 70% below that obtained using the conventional input method (US$2.30/m3). This is because the fuel costs vary according to the transportation distance for the different raw materials suppliers. The supplier that incurs the lowest production unit cost for the raw materials, regardless of the transportation distance, will be selected when minimizing the cost is prioritized.
5.2.3. Manufacture Stage
As indicated in Table 11, both the conventional input method and the new optimization system applied the same estimation model to calculate the cost of the energy and water required for the manufacturing process. In this case, the evaluation is performed using the data (i.e., the annual amount of concrete produced and the energy consumption in terms of the electricity, oil, and water) of the target concrete production company. The results indicate that the CO2 emissions are 2.8 kg-CO2/m3 and the cost US$0.70/m3 for both methods.
Table 11.
Energy Output Applied for Evaluation Method.
6. Discussion and limitation
This study aimed to develop an optimum design system (concrete life cycle assessment system: CLAS) which can minimizes CO2 emissions and maximize economic efficiency at the life cycle assessment (LCA) of concrete. The CLAS which assesses the CO2 emissions and economic efficiency of concrete to which optimum design technique is applied is a program that finds the concrete mix design (kg/m3) which satisfies minimum CO2 emissions or costs and selects a raw material supplier.
However, this study has the following limitations:
First, there has been an advancement of studies on the capture and storage of CO2 emitted by the consumption of fossil fuels in cement manufacturing facilities. Among construction materials, cement is a material with high CO2 emissions so that carbon dioxide capture and storage (CCS) are important.
However, this study covers CO2 emissions and costs which occur during the production of concrete.
Regarding the CO2 emissions of cement, therefore, the conventional national life cycle database (LCI DB) and each cement manufacturer’s database were applied. For cement costs as well, Korea price information and each cement manufacturer’s database were applied. It is unknown if the results were derived after reflecting the CCS in the national LCI DB and each cement manufacturer’s database. This study did not separately consider CO2 emissions and costs after the CCS during the production of cement. However, CCS is so important that it would be considered in future studies.
Second, in this study, the Euclidean distance between two latitude and longitude points was applied. Currently, the coordinates-based Euclidean distance would differ from the geodesic distance. Therefore, if correction factors are applied, the information would become more reliable. Since the program in this study is already designed in Visual Basic, it failed to consider this information.
7. Conclusions
The new CLAS optimization system proposed here, developed using Visual Basic, applies an evolution algorithm to calculate the mix of materials, a trigonometric function method for the raw material transportation method and a stochastic model for the manufacturing process. The reliability of the resulting program was improved through a thorough analysis of the various mix designs and supplier options. CLAS assesses the CO2 emissions and costs when the optimization technique is applied during the concrete production stage and identifies the concrete mix design and supplier that will minimize either the CO2 emissions or the cost, depending on the user’s requirements.
A case analysis was performed for a specific RMC plant in Korea. The results indicated that the CO2 emissions and costs per m3 of RMC were 340.9 kg-CO2/m3 and US$49.70/m3, respectively, using the conventional input method currently used in the industry. Applying the new CLAS program, the CO2 emissions could be reduced by 34% to 225.7 kg-CO2/m3 when minimizing the CO2 emissions was prioritized, and the costs dropped by 1% to US$48.80/m3 when minimizing the cost was prioritized. Based on the case analysis, the most significant way to reduce the CO2 emissions and costs associated with the manufacture of ready mix concrete are to select the mix design and raw material supplier based on whether the CO2 emission or cost are to be minimized.
Acknowledgments
This research was supported by Basic Science Research Program through the National Research Foundation of Korea (NRF) funded by the Ministry of Science, ICT & Future Planning (No.2015R1A5A1037548) and the National Research Foundation of Korea (NRF) grant funded by the Korea government (MSIP) (No.20110028794).
Author Contributions
All authors contributed substantially to all aspects of this article.
Conflicts of Interest
The authors declare no conflict of interest.
References
- World Energy Outlook. International Energy Agency: Paris, France, 2015. Available online: http://www.worldenergyoutlook.org/ (accessed on 11 January 2016).
- Korea Environmental Industry & Technology Institute. Environmental Declaration of Products. Available online: http://www.edp.or.kr/en/ (accessed on 11 January 2015).
- Korea National Cleaner Production Center. Korea LCI DB Information Network. Available online: http://www.kncpc.or.kr/main/main.asp (accessed on 15 January 2015).
- Korea Environmental Industry & Technology Institute. Korea LCI DB Information Network. Available online: http://www.edp.or.kr/en/lci/lci_intro.asp (accessed on 11 January 2015).
- Peuporier, B.; Putzeys, K. Inter-Comparison and Benchmarking of LCA-based Environmental Assessment and Design Tool. Final Report. Practical Recommendations for Sustainable Construction (PRESCO). Available online: http://www.etn-presco.net/library/index.html (accessed on 11 January 2015).
- ASMI. Athena Sustainable Materials Institute. Available online: http://www.athenasmi.org (accessed on 11 January 2016).
- thinkstep GaBi. Available online: http://www.gabi-software.com/international/index/ (accessed on 13 January 2016).
- Building Research Establishment. Envest 2. Available online: http://envest2.bre.co.uk/account.jsp (accessed on 11 January 2016).
- Erin, T. LISA (LCA In Sustainable Architecture). Available online: http://sustainableresourcedatabase.weebly.com/lca-in-sustainable-architecture.html (accessed on 11 March 2016).
- VTT Technical Research Center. Available online: http://www.vttresearch.com/ (accessed on 12 March 2016).
- Scott, M. Eco Quantum Life Cycle and Greenhouse Gas Assessment. Available online: http://ecoquantum.com.au/ (accessed on 11 January 2015).
- International Standard. ISO 14044: Life Cycle Assessment (Requirements and Guidelines); International Organization for Standardization: Geneva, Switzerland, 2006; Available online: http://www.iso.org/iso/home/store/catalogue_tc/catalogue_detail.htm?csnumber=38498 (accessed on 19 March 2015).
- International Standard. ISO 21930: Environmental Declaration of Building Products; International Organization for Standardization: Geneva, Switzerland, 2007; Available online: http://www.iso.org/iso/home/store/catalogue_tc/catalogue_detail.htm?csnumber=40435 (accessed on 19 March 2015).
- Peng, C.H.; Yeh, I.C.; Lien, L.C. Modeling strength of high-performance concrete using genetic operation trees with pruning techniques. Comput. Concr. 2009, 6, 203–223. [Google Scholar] [CrossRef]
- Tae, S.H.; Shin, S.W.; Woo, J.H.; Roh, S.J. The development of environmental load evaluation system of a standard Korean apartment house. Renew. Sustain. Energy Rev. 2011, 15, 1239–1249. [Google Scholar]
- Parichatprecha, R.; Nimityongskul, P. An integrated approach for optimum design of HPC mix proportion using genetic algorithm and artificial neural networks. Comput. Concr. 2009, 6, 253–268. [Google Scholar] [CrossRef]
- Kim, T.H.; Tae, S.H.; Roh, S.J. Assessment of the CO2 emission and cost reduction performance of a low-carbon-emission concrete mix design using an optimal mix design system. Renew. Sustain. Energy Rev. 2013, 25, 729–741. [Google Scholar] [CrossRef]
- Kewalramani, M.; Gupta, R. Concrete compressive strength prediction using ultrasonic pulse velocity through artificial neural networks. Autom. Constr. 2006, 15, 374–379. [Google Scholar] [CrossRef]
- Goldberg, D. Genetic Algorithms in Search, Optimization and Machine Learning; Addison-Welsley: Reading, MA, USA, 1989. [Google Scholar]
- Habert, G.; Roussel, N. Study of two concrete mix-design strategies to reach carbon mitigation objectives. Cem. Concr Compos. 2009, 31, 397–402. [Google Scholar] [CrossRef]
- Holland, J.H. Adaptation in Natural and Artificial Systems; University of Michigan Press: Ann arbor, MI, USA, 1975. [Google Scholar]
- Jeong, M.J. Integrated Support System for Decision Making in Optimization. Ph.D. Thesis, The University of Tokyo, Tokyo, Japan, 2003; pp. 6–14. [Google Scholar]
- Thomas, B. Evolutionary Algorithms in Theory and Practice; Oxford University Press: Oxford, UK, 1996. [Google Scholar]
- Korea Price Information. Available online: http://www.kpi.or.kr/ (accessed on 15 March 2016).
- Liu, Y.; Xi, N. Low-cost and automated calibration method for joint offset of industrial robot using single-point constraint. Ind. Robot 2011, 38, 577–584. [Google Scholar] [CrossRef]
- Park, C.S.; Hong, S.E.; Park, J.O.; Jeong, T.S.; Sung, B.Y. A study on converting cadastral coordinate system into global coordinate system. J. Korean Soc. Geosp. Inf. Sys. 2010, 18, 105–114. [Google Scholar]
- Badekas, J. Investigations Related to the Establishment of a World Geodetic System; Report 124; Department of Geodetic Science, Ohio State University: Columbus, OH, USA, 1969. [Google Scholar]
- Bursa, M. The theory for the determination of the non-parallelism of the minor axis of the reference ellipsoid and the inertial polar axis of the earth, and the planes of the initial astronomic and geodetic meridians from observations of artificial earth satellites. Stud. Geophys. Geod. 1962, 6, 209–214. [Google Scholar]
- Krakiwsky, E.J.; Thomson, D.B. Mathematical models for the combination of terrestrial and satellite networks. Can. Surv. 1974, 28, 606–615. [Google Scholar]
- Molodensky, M.S.; Eremeev, V.F.; Yurkina, M.I. Methods for Study of the External Gravitational Field and Figure of the Earth; Israeli Program for the Translation of Scientific Publications: Jerusalem, Israel, 1962. [Google Scholar]
- Ramsey, P. The State of Open Source GIS; Refractions Research Inc.: Victoria, BC, Canada, 2004; pp. 3–10. [Google Scholar]
- Wolf, H. Geometric connection and re-orientation of three-dimensional triangulation nets. Bull. Géod. 1963, 68, 165–169. [Google Scholar] [CrossRef]
- Chou, J.; Tsai, C. Concrete compressive strength analysis using a combined classification and regression technique. Autom. Constr. 2012, 24, 52–60. [Google Scholar] [CrossRef]
- Zain, M.F. An expert system for mix design of high-performance concrete. Adv. Eng. Softw. 2005, 36, 325–337. [Google Scholar] [CrossRef]
- Oner, A.; Akyuz, A.; Yildiz, R. An experimental study on strength develpoment of concrete containing fly ash and optimum usage of fly ash in concrete. Cem. Concr Res. 2005, 35, 1165–1171. [Google Scholar] [CrossRef]
- Kim, T.H.; Tae, S.H.; Lee, J.S. A Study on development of a CO2 assessment program of concrete. Int. Conf. Sustain. Build. Asia 2010, 1, 303–310. [Google Scholar]
- Tae, S.H.; Shin, S.W.; Ha, S.G. Life cycle environmental loads and economic efficiencies of apartment buildings with plaster board drywall. Renew. Sustain. Energy Rev. 2011, 15, 4145–4155. [Google Scholar] [CrossRef]
- Kjellsen, K.O.; Guimaraes, M.; Nilsson, A. The CO2 Balance of Concrete in a Life Cycle 430 Perspective; Nordic Innovation Centre: Stensberggt, Norway, 2005. [Google Scholar]
- Ko, J.H.; Kim, G.T.; Kim, D.H.; Kim, H.S. Development of an optimal design program for a triple-band PIFA using the evolutionary strategy. J. Korean Inst. Electromagn. Eng. Sci. 2009, 2, 746–753. [Google Scholar] [CrossRef]
© 2016 by the authors; licensee MDPI, Basel, Switzerland. This article is an open access article distributed under the terms and conditions of the Creative Commons by Attribution (CC-BY) license (http://creativecommons.org/licenses/by/4.0/).