Abstract
Residential energy renovation remains a central pillar of climate mitigation and social sustainability strategies, yet renovation rates persistently lag behind policy targets, particularly in older urban neighborhoods. This study investigates the underlying causes of renovation inertia using a neighborhood-scale mixed-methods approach that combines door-to-door household surveys, façade infrared thermography, and expert focus groups. Using a post-industrial residential district in Liège, Belgium, as an exploratory case, the study jointly analyzes building conditions, household characteristics, and renovation contexts. The results reveal that renovation failure cannot be explained solely by technical deficiencies. Instead, three interacting socio-technical mechanisms emerge: adaptive occupant behaviors that mask poor building performance, a constrained renovation agency shaped by tenure and income asymmetries, and the stratification of energy awareness along social lines. Together, these mechanisms reinforce a form of renovation lock-in in which technical degradation, behavioral adaptation, and institutional fragmentation mutually sustain inaction. By integrating physical diagnostics with social and experiential data, the study explains why conventional incentive-based renovation policies systematically underperform in comparable urban contexts. Rather than treating energy renovation as a purely technical or economic decision, the findings highlight the need for policy instruments that explicitly address agency constraints, behavioral compensation, and unequal exposure to energy-related risks. The proposed mixed-method framework is transferable to other urban neighborhoods and offers a replicable approach for diagnosing renovation barriers, supporting more socially sustainable energy transition strategies.
1. Introduction
The European Union (EU) [1] has committed to reducing its emissions by 55% in 2030. European countries are expected to achieve net-zero greenhouse gas emissions by 2050. However, 40% of the energy consumed in the EU is used in buildings. The revised EPBD [2] places particular emphasis on implementing an ER plan tailored to each country’s building stock, aiming to renovate the 26% worst-performing buildings by 2033. This objective has been transposed in the Stratégie Wallonne de Rénovation à Long Terme (Walloon Long-Term Renovation Strategy) [3]. But despite long-standing announcements, the average and deep ER (>30% energy savings) rate is stagnating at around 1% in Europe [4].
The Walloon region, in particular, shows little sign of an acceleration in ER rates despite its many benefits [5]. This can be explained, among other things [6], by an old building stock (77% constructed before 1981) and a significant proportion of single-family homes (76%) [7]. The wide variety of building types makes it difficult to implement industrialized ER programs such as EnergieSprong in The Netherlands [8]. And while city centers can rely on a more compact building typology, with more apartment buildings and terraced houses, they have a particularly old building stock and a higher concentration of vulnerable populations [9]. These densely populated dwellings must also address specific technical issues, such as interior insulation [10]. The risk of overheating after renovation work is also greater [11].
However, barriers to ER—high initial investment costs, uncertain profitability, administrative difficulties, and lack of knowledge [10,11,12]—depend as much on the building as on the occupant. This interaction between technical and socio-economic characteristics is central to the definition of an effective strategy. It has been the subject of two studies aimed at clarifying its distribution [9,12].
At the same time, the 2022 energy crisis highlighted the vulnerability of the entire European energy system and of the most vulnerable households. The Energy Poverty (EP) barometer [13] estimates the EP rate in Wallonia at 29.2%. This EP has significant effects on the ability to heat homes, physical health, mental well-being, and social integration of the households concerned [14,15]. It has been proven that effectively combating EP requires major ERs to be brought to their homes [14,16,17]. Socio-economic aspects can therefore be considered both determinants and objectives of ER.
Several studies have already raised the relevance of examining these ER dynamics at the local level [18,19,20]. A smaller scale allows us to validate and refine conclusions drawn at the regional level regarding the joint distribution of technical and socio-economic characteristics. It paves the way for a more detailed analysis of motivations and obstacles as a function of these characteristics. It enables the proposal of strategies adapted to this urban and social context. It is therefore worth considering using a tool such as IRT to enable a socio-energy diagnosis at the neighborhood level [21]. In this study, infrared thermography (IRT) is not considered as a substitute for detailed energy audits or building-level diagnostics. Rather, it is mobilized as a rapid, non-destructive screening and mediation tool at the neighborhood scale, capable of highlighting relative thermal weaknesses, usage patterns, and socio-technical contrasts between dwellings. When combined with household surveys and qualitative insights, IRT contributes to the prioritization of intervention areas and the support of locally adapted renovation strategies. Despite extensive research on building energy performance and on socio-economic determinants of renovation, few studies explicitly integrate building conditions, household realities, and energy poverty within a single neighborhood-scale analytical framework. Existing approaches often rely on either technical diagnostics or socio-economic surveys, limiting their capacity to inform locally actionable renovation strategies.
Through a specific analysis of an old neighborhood in the city of Liège, we therefore seek to (a) understand the dynamics of ER at work in this neighborhood based on its specific technical and socioeconomic characteristics, (b) understand how these ER dynamics relate to the specific issue of EP, and (c) assess the relevance of the IRT for quickly estimating these technical and socio-economic characteristics.
The corresponding research questions are as follows:
- What are the technical characteristics of the housing and the socio-economic characteristics of the inhabitants in a former urban suburb in the Walloon region? And what are the links in between?
- What are the motivations and obstacles to ER based on these technical and socio-economic characteristics?
- What are the specific risks associated with EP in this neighborhood, and how can ER strategies address them?
- How does the IRT contribute to our understanding of ER dynamics?
The results enable us to identify dominant building/occupant profiles that require locally adapted ER strategies. These results also highlight the need to integrate the issue of EP directly into ER strategies, not only as an objective but also as a determinant of these strategies. Finally, the IRT demonstrates its capacity for rapid neighborhood-scale screening while also revealing its technical limitations.
Against this background, this paper addresses a critical gap in current research on renovation and policy practice. While most studies focus either on building performance metrics or on household socioeconomic characteristics in isolation, fewer investigate how technical conditions, lived experiences, and institutional contexts interact at the neighborhood scale to produce persistent renovation inertia. This study adopts a mixed-method diagnostic approach that combines infrared thermography, household surveys, and expert focus groups to examine these interactions in an integrated manner. Rather than aiming for statistical representativeness or predictive modeling, the objective is to identify the socio-technical mechanisms that prevent renovation policies from translating into action in real residential contexts. By doing so, the paper moves beyond a local case description and contributes to a broader understanding of why energy renovation strategies repeatedly underperform in older urban neighborhoods across Europe.
2. State of the Art
Technical characteristics primarily determine the need to renovate a building to improve its energy efficiency. The EPC [2] models these characteristics to estimate energy use under specified technical and behavioral assumptions. More precise energy audits or renovation passports [22] are available to better target interventions. These audits go further in analyzing the building and make specific proposals regarding the work to be undertaken [23] and, at their command, to respect the Trias Energetica and avoid the lock-in effect [24,25]. They are also responsible for adapting energy renovation solutions to the specific technical characteristics of the building in question. Managing the hygrothermal behavior of walls—particularly those insulated from the inside [10,26]-and the installation of suitable ventilation [27] requires special attention. The risk of increased summer overheating must be properly taken into account [11]. While it is possible to limit its effects, the lack of appropriate measures leads to a significant increase in the risk of overheating and the energy requirements for air conditioning [28]. EPC and audits serve as the basis for regulations, communication on sales and rentals, and future performance requirements. They could also be used to determine eligibility for loans or subsidies. They may even offer an estimate [29] on the profitability of the proposed works. They are, therefore, key elements in defining and promoting energy renovation strategies [30]. But actual energy use may differ significantly from estimated use [29,31,32] due to simplifying assumptions about behaviors and technical characteristics that are unknown. These simplifications lead to both overestimating energy use in inefficient buildings and underestimating it in high-performance buildings [33]. This performance gap must be considered to estimate the financial profitability of an energy renovation project accurately [31]. These assessment tools must also go beyond energy use to analyze the entire life cycle [34,35,36]. A more comprehensive assessment of sustainability is even desirable. [37]. While certification and auditing are useful steps in guiding ER [23,30]. They should be improved [29,31] and cannot be the sole determinants of a strategy for widespread ER.
“The Energiesprong business model instead offers an integrated approach based on an energy performance guarantee, industrialised supply chain, simple customer journey and self-sustaining financial model.” [8].
Following Energiesprong’s business model, several initiatives are being implemented across Europe to promote large-scale, high-performance ER programs [38,39]. The Walloon Region has thus incorporated a massification plan into its ER strategy [40], yet this has not been reflected in an increase in the renovation rate. Pellegrino identifies six major obstacles to this widespread adoption: (i) Regulatory and urban planning constraints that limit projects; (ii) Significant initial costs coupled with uncertainties regarding return on investment; (iii) The multiplicity of actors involved in renovation markets; (iv) The small size of projects and the inertia of large companies; (v) Inadequate performance assessments, no verification of performance after work is completed, no consideration of the life cycle, and little consideration of occupant comfort [39]. Taking these obstacles into account requires identifying the appropriate scale of intervention, which enables pooling of study costs inherent to this type of market, offers solutions optimized for the geophysical characteristics of the territory, and considers the needs and capacities of the households concerned. Several studies have thus highlighted the importance of developing strategies adapted to a more local context, at the city or neighborhood level [9,19,40,41,42,43,44]. While the success of the Energiesprong approach is based on the industrialization of solutions, the approach was designed as a one-stop shop [45] that primarily meets the needs of occupants: “energy performance guarantee, industrialised supply chain, simple customer journey and self-sustaining financial model.” [8].
In fact, the decision to renovate depends less on a dwelling’s energy efficiency than on the occupant’s ability and willingness to undertake the renovation. In Belgium, ER activities depend largely on household age, region, education level, type of ownership, and construction period [46]. The economic aspect—the need for initial funding or the work’s uncertain profitability—is the primary barrier to ER [47]. Subsidies should therefore target major energy-efficient renovations rather than minor works [48]. Administrative difficulties and a lack of knowledge among stakeholders also constitute significant barriers. [47,49]. At the same time, thermal [49] and acoustic comfort [47] are recurring motivations for renovation, as important as purely financial gain. The occupants’ commitment and support are important. We are already seeing that the people most sensitive to energy issues, who might be interested in ER work, are also, in part, those who already adopt energy-saving behaviors [49,50]. This paradoxical observation underscores that the economic profitability of the works is highly dependent on user behavior and inevitable rebound effects [51]. However, financial gain is not the main driver behind home renovation. Currently, the primary motivations for prospective renovators are: (i) rational use of living area, (ii) quality improvement, (iii) comfort improvement, (iv) higher quality of life [52]. Communication campaigns that focus heavily on energy savings should perhaps draw more inspiration from what residents are looking for. Nevertheless, involving residents early on in ER projects ensures that their needs are taken into account [15], while raising awareness leads to better use of buildings after ER, and limits the rebound effect [53]. ER programs must therefore take these socioeconomic factors into account [49] in addition to the technical characteristics of the built stock.
Taking these socioeconomic factors into account enables us to consider specific yet common situations arising from their diversity. The renovation of condominium buildings, for example, is a well-known issue. Each occupant of the building has their own interests, needs, and financial capabilities [44,47]. The ER of a building does not have the same financial benefit for the occupant of the first floor as it does for the occupant of the top floor. Nor does ER confer the same benefit on an owner-occupier as it does on a landlord [54]. The situation in which the landlord finances major works while the tenant reaps the primary benefits in terms of comfort and lower energy bills is known as a split incentive [55,56]. A future carbon dioxide (CO2.equiv.) emissions tax (GHG emissions equivalent) could therefore impose an additional burden on tenants [57]. Among tenants, households experiencing EP are overrepresented and therefore more likely to face split incentives [57]. These households generally live in substandard housing but lack the means to finance ER work [58]. This EP has direct impacts: some households significantly reduce ancillary expenses to pay their energy bills, while others significantly reduce heating energy use [15]. These impacts then reverberate throughout society, which bears the costs directly (e.g., energy subsidies) or indirectly (e.g., declines in physical and mental health, social isolation) [59,60]. All these situations must be incorporated into renovation strategies in three ways: (i) adapting regulations to both facilitate the work and enforce energy performance standards for the housing in question; (ii) raising awareness among various stakeholders by developing training courses and information tools focused on energy renovation; (iii) implementing viable financial solutions that correspond to each individual’s economic capacity [42,57,61].
Thermography appears here as an interesting tool for specifying the technical characteristics of the building stock and user behavior, while raising awareness of their energy use. Infrared thermography measures the temperature of the target object by analyzing its infrared radiation. When applied to the exterior surfaces of a building, infrared thermography can generally be used to assess the heat loss from these surfaces and identify specific defects (thermal bridges, water infiltration) that cause greater losses [62,63,64,65,66,67]. This rapid, non-destructive assessment has established itself as the preferred solution for building energy audits. It is a solution attracting growing interest for auditing entire neighborhoods [66,67], particularly through aerial thermography [65,68,69]. The IRT only evaluates the performance of the part of the envelope that is surveyed. However, part of the envelope can be used as a proxy for the overall performance of buildings at the neighborhood level [68]. The results of infrared thermography are even more accurate and informative when combined with other sources, such as photographs, LiDAR, and EPC. [66,70,71,72]. To process the large volume of data generated, deep neural networks, LVM, and LLMs show promise for improving the speed and quality of IRT data interpretation [62,73,74]. A previous review of the literature allows us to define the advantages and disadvantages of IRT more extensively [21]. Thermography results are also powerful educational and awareness-raising tools for promoting energy savings [75,76]. However, the results remain limited by the definition of thermography, the lack of information on lower floors, and the dissemination of information to the affected populations. To our knowledge, there are no studies on the impact of internal temperature variation on external infrared thermography, even though a building’s heat loss is logically dependent on user behavior. This state-of-the-art underscores the interest in large-scale facade thermography as an assessment and awareness-raising tool, even though a better understanding of the impact of user behavior is necessary, and clearer communication with users is required.
Given the reviewed literature, a more detailed examination of energy renovation (ER) dynamics at the neighborhood scale is necessary to better capture the interactions among building conditions, household characteristics, and local implementation constraints. Such an approach enables analysis of socio-technical mechanisms that are insufficiently addressed in studies at broader spatial scales, particularly in relation to rental housing and energy poverty. This study adopts an integrated perspective that combines technical assessment and socio-economic analysis to examine how ER strategies may influence the evolution of the energy performance of the residential building stock. Infrared thermography (IRT) is employed in this approach to assess its capacity to support an initial neighborhood-scale diagnosis when combined with social inquiry. The analysis is applied to an old urban neighborhood in the Walloon Region, providing empirical insights of scientific and policy relevance for the design of locally adapted ER strategies in similar urban contexts. These proposals must be adapted to the context in which they are applied. Climatic conditions, construction methods, building types, urban organization, socio-economic characteristics of residents, cultural habits, available budgets, and political dynamics are all factors that influence energy renovation strategies.
3. Methodology
This study uses a convergent mixed-methods design at the neighborhood scale to examine how building envelope conditions and household socio-economic realities interact in the context of residential energy renovation. Three complementary sources of evidence are collected in parallel and then integrated during interpretation: (i) a door-to-door household survey, (ii) façade infrared thermography (IRT), and (iii) a professional focus group. The overall conceptual logic and data flow are summarized in Figure 1. Triangulation is applied to enhance credibility by examining convergence and divergence across methods while giving comparable interpretive weight to each stream [77,78].
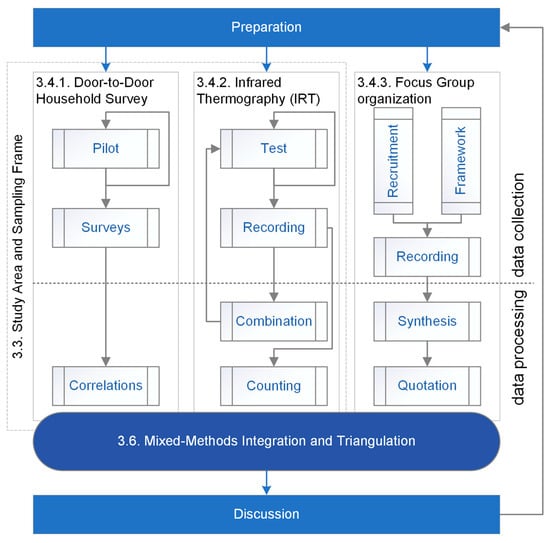
Figure 1.
Study Conceptual Framework.
The approach is exploratory and diagnostic, not predictive. Its objective is to identify structural patterns, barriers, and mismatches between the technical performance of residential buildings and the socio-economic realities of households, rather than to estimate energy performance indicators or simulate renovation outcomes. This positioning is consistent with neighborhood-scale studies of energy renovation and energy poverty, in which heterogeneous household conditions interact with relatively homogeneous building stocks.
The overall research design, data flows, and integration logic are summarized in Figure 1, which illustrates how the three methods inform each other during the interpretation phase. All primary quantitative and qualitative data generated in this study are documented and shared through an open mixed-methods dataset hosted on Harvard Dataverse [79].
3.1. Research Design and Conceptual Framework
The methodological framework is structured around the complementarity of three empirical tools that capture different dimensions of residential energy renovation. Household surveys provide self-reported information on socio-economic conditions, dwelling characteristics, energy use, comfort, and renovation status. Infrared thermography of façades offers systematic, instrument-based observations of relative heat-loss patterns at the building level, independent of occupant perception. Focus group discussions with professionals and stakeholders yield contextual and interpretive insights into renovation barriers, energy poverty dynamics, and policy implementation challenges.
Each method has intrinsic strengths and limitations. The survey enables direct linkage between household characteristics and dwelling attributes, but is non-representative and subject to self-reporting bias [80]. IRT provides comprehensive spatial coverage of the neighborhood and allows comparison across buildings, but does not deliver calibrated thermal performance metrics and must be interpreted qualitatively through relative temperature contrasts [21]. Focus groups generate rich, in-depth qualitative information but are limited in generalizability and sensitive to group dynamics [81].
The integration of these three methods compensates for individual weaknesses while strengthening analytical robustness. Equal analytical weight is given to each data stream, in line with triangulation principles [77]. Convergences across methods are interpreted as reinforced findings, while discrepancies are treated as analytically valuable signals that may reveal perception gaps, measurement limitations, or socio-technical tensions. This integration strategy underpins all subsequent analysis and interpretation.
The complete structure of the mixed-methods design, including survey instruments, infrared imagery, focus group transcripts, and synthesized integration outputs, is documented in the associated Harvard Dataverse dataset [79].
3.2. Variables, Indicators, and Operationalization
The analytical framework is built on the explicit operationalization of technical building variables and household socio-economic variables, allowing their joint examination at the dwelling and neighborhood scales. Variables were selected based on their relevance in the literature on residential energy renovation, energy poverty, and building performance, as well as their feasibility for collection through non-intrusive field methods.
3.2.1. Technical Building Variables
Technical characteristics of dwellings are described using six primary indicators:
- Construction period, expressed as building age in years.
- Building typology and geometry, distinguishing apartments and single-family dwellings and the number of exposed facades.
- floor area (m2).
- Energy performance certificate (EPC) label, reported on a categorical scale from A to G.
- Reported annual energy use, expressed either in monetary terms or technical units and subsequently harmonized.
- Relative façade heat-loss patterns, derived from infrared thermographic imagery and interpreted through surface-temperature contrasts.
IRT indicators do not represent absolute thermal transmittance values but provide qualitative diagnostics of envelope performance, such as wall insulation continuity, window and frame losses, thermal zoning, and signs of non-occupancy. These indicators are used comparatively across buildings rather than as calibrated performance metrics.
3.2.2. Household Socio-Economic Variables
Socio-economic characteristics of households are captured through the survey and include:
- Net household income category.
- Tenure status (owner-occupier or tenant).
- Household composition, including the number and age of occupants.
- Education level of adult household members.
Additional variables describe energy-related practices and perceptions, such as reported energy expenditure, heating setpoints, ventilation practices, perceived comfort, satisfaction with dwelling performance, and attitudes toward energy renovation and regulatory instruments.
3.2.3. Analytical Intent
The analytical focus is placed on relationships and patterns between technical and socio-economic variables rather than on causal inference or prediction. Correlations and associations are examined to identify recurring configurations of building conditions and household circumstances that may explain differences in renovation behaviors, comfort outcomes, or vulnerability to energy poverty. These relationships form the basis for the subsequent mixed-methods integration and interpretation.
All variable definitions, coding schemes, and anonymized survey responses are provided in the associated open dataset [79], enabling transparency and reuse.
3.3. Study Area and Sampling Frame
The empirical investigation is conducted in the Saint-Léonard district of Liège, Belgium (Figure 2). This neighborhood was selected because it combines a relatively homogeneous residential building stock with a high diversity of socio-economic household profiles, making it suitable for exploratory analysis of the interactions between building conditions and household realities.
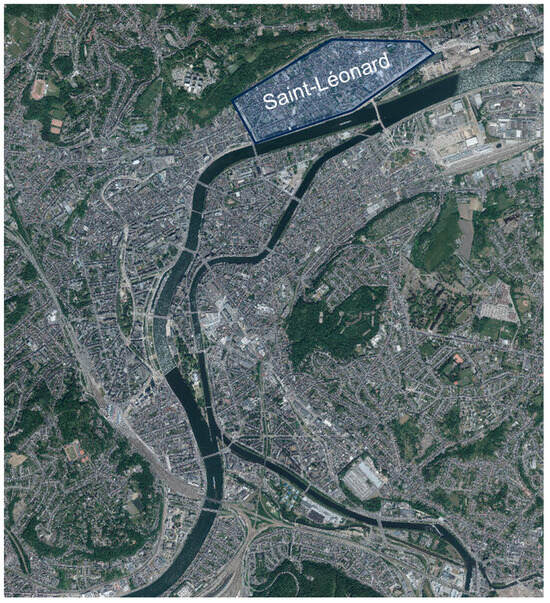
Figure 2.
Map of the city of Liège and the location of the case study “https://geoportail.wallonie.be/walonmap (accessed on 12 December 2025)”.
The building stock is largely composed of terraced houses and small apartment blocks constructed more than 50 years ago, typically featuring masonry façades, wooden floors and frames, and limited or absent thermal insulation. These characteristics are representative of the former working-class neighborhoods found in many Belgian and North-Western European post-industrial cities [82]. A check in the Walonmap database [83] confirms that no heritage-protected buildings are located within the study area. Two dwellings are listed in the heritage inventory but are not subject to any special protection measures. The residents of these two buildings did not respond to the survey. From a methodological perspective, this relative homogeneity reduces structural variability in envelope performance and allows greater analytical focus on differences related to occupancy, socio-economic status, and renovation trajectories.
At the same time, the Saint-Léonard district exhibits pronounced social heterogeneity, simultaneously housing low-income and energy-vulnerable households alongside higher-income residents attracted by proximity to the city center and housing quality, reflecting early stages of gentrification [84]. This combination makes the area particularly relevant for studying energy renovation and energy poverty in parallel.
The study focuses on a contiguous subset of the neighborhood comprising 288 street-facing buildings. Buildings located within inner courtyards were excluded because their facades were not accessible for infrared thermographic observation from public space. 21 additional buildings were identified in these courtyards using satellite imagery. Three of the 288 buildings are not aligned with the road frontage, which constitutes a major technical constraint, strongly encouraging interior renovation for all the others. Based on doorbell counts, letterbox numbers, and survey observations, these buildings are estimated to contain approximately 522 individual dwellings. For data protection reasons, the precise geographic delineation of the study area is not disclosed.
The selected area does not aim to be statistically representative of the city of Liège, the Walloon Region, or the Belgian housing stock. Instead, it constitutes a purposeful sampling frame designed for neighborhood-scale diagnostic analysis, where depth of information and methodological triangulation take precedence over representativeness. Institutional collaboration with the City of Liège and academic-stakeholder platforms facilitated access to the field and informed the design of the study’s qualitative components.
All spatial descriptors and anonymized contextual information related to the study area are documented in the associated Harvard Dataverse dataset [79].
3.4. Data Collection
3.4.1. Door-to-Door Household Survey
A door-to-door household survey was implemented to collect detailed socio-economic, technical, and behavioral information directly from residents. This approach was selected to ensure access to population groups that are often underrepresented in online or self-selected surveys, including older residents, low-income households, and households with limited digital access [85]. These groups are particularly relevant in the context of energy renovation and energy poverty. Door-to-door surveys also allow the interviewer to explain the meaning of questions if necessary, particularly technical concepts that could be misunderstood, such as the EPC label or the presence of insulation.
The survey instrument was designed based on the research objectives and a review of comparable questionnaires in the literature. It is structured into two main parts. The first part collects descriptive and status information to characterize respondents and their dwellings, including socio-economic profile, household composition, dwelling typology, construction period, floor area, energy systems and reported energy use, setpoint temperatures, EPC label, insulated parts of the envelope and ventilation and air conditioning systems. This section supports comparison between the survey sample and broader population statistics and enables linkage between household characteristics and building attributes. Several questions have a “Don’t know” answer option in order to reduce the risk of false positives (people who answer without really knowing the answer), even though this answer also increases the risk of false negatives (people who do not answer even though they know the answer) [86].
The second part is tailored according to tenure status (owner or tenant) and renovation status (renovated or non-renovated dwelling). It focuses on any ER work that has been carried out, perceived thermal comfort, energy affordability, renovation decisions, motivations, barriers, satisfaction with renovation outcomes, and attitudes toward energy performance regulations. Opinion-based questions predominantly use Likert-scale response formats to facilitate response consistency and subsequent analysis [87].
A pilot survey was conducted with 11 volunteer households, who were chosen for the diversity of their profiles, including people with no knowledge and people who had carried out energy renovations with significant knowledge. Respondents were asked about the relevance of the questions (apparent validity), the completeness of the questions (content validity), logical flow, length, and respondent burden (construct validity) [88]. Based on feedback from this phase, questions were reworded, reordered, or removed to reduce ambiguity and limit completion time to approximately 15 min, which is considered optimal for maximizing response rates in face-to-face surveys [89]. The finalized questionnaire is provided in the associated dataset [79].
The main survey was conducted between February and April 2025, concurrently with the infrared thermography campaign. Residents were informed in advance through notices distributed in letterboxes. Surveyors systematically visited all dwellings in the study area, briefly explained the study objectives and data protection measures, and invited residents to participate. Surveys were primarily self-administered, with researchers providing clarification when needed. In cases of language barriers or respondent preference, questions were administered orally by the researcher.
A total of 67 households completed the questionnaire. Paper questionnaires were digitized and checked for completeness and legibility. In line with established methodological recommendations, questionnaires with excessive missing data (more than 5% of unanswered items) were excluded from analysis [90]; no complete questionnaires met this exclusion criterion. Among these respondents, two households responded twice. One person responded twice, while a couple responded separately several days apart. This test–retest allows us to verify the reliability of the survey. The responses are broadly similar, although there is greater variability in the responses on energy consumption (“I don’t know” on the first test, specific response on the second) and comfort (in the case of the couple). The motivations on the Likert scale show similar results, with one level of difference.
Reported energy use values were expressed in monetary units (€) or physical units (kWh, m3, liters, steres) according to the respondents’ preference, to improve the response rate. Most questionnaires were completed in €, with only 7 respondents using one or more physical units. None of these 7 respondents benefited from a social energy tariff. As a result, these physical units were harmonized by converting them into monetary equivalents using average regional energy tariffs provided by the Walloon energy regulator (CWaPE). This standardization enabled comparison across households reporting different energy vectors and units. The decision to favor monetary units over physical units in the analysis of the results meets three objectives. (i) As noted, energy consumption was mainly expressed by respondents in euros, as this is the unit they are most familiar with. Some respondents also benefit from a social tariff, which makes it more complex to estimate the quantities of energy consumed. (ii) The objective of the study is to examine renovation dynamics, which we believe are more dependent on energy expenditure than on energy consumption. (iii) The calculation of standardized primary energy, which is the most relevant in terms of environmental impact, requires the integration of a coefficient that leads to a significant loss of meaning in relation to the perception of the public.
All anonymized survey responses, variable coding, and documentation are included in the Harvard Dataverse dataset [79].
3.4.2. Infrared Thermography (IRT)
Façade infrared thermography (IRT) was conducted to obtain systematic, non-intrusive observations of relative heat-loss patterns across the residential buildings in the study area. Unlike indoor monitoring or invasive diagnostics, facade IRT enables neighborhood-scale coverage from public space and supports comparative analysis between buildings and dwelling types.
Thermal images were acquired using a FLIR TG267 (Teledyne FLIR LLC, Wilsonville, OR, USA) infrared camera. This handheld device has significantly lower resolution and thermal sensitivity than higher-quality instruments. That is why a preliminary test survey was carried out in December 2024 on buildings with similar characteristics to assess image quality, operational constraints, and protocol adjustments prior to the main campaign. This test phase highlighted the importance of allowing sufficient camera warm-up time to stabilize automatic calibration and ensure consistency across recordings. The test also highlights the camera’s limitations in terms of the accuracy of absolute temperature measurements. The absolute temperatures measured will therefore not be used in the rest of the study, and only relative temperature differences will be examined. The main IRT campaign comprised five recording sessions conducted on 23 January, 5 February, 6 February, 13 February, and 14 February 2025. Sessions were scheduled under meteorological conditions aligned with established IRT guidelines and literature recommendations: outdoor air temperatures below 5 °C, overcast conditions, and absence of direct solar radiation to minimize thermal disturbance of façade surfaces [21,91,92]. For each session, recording times and corresponding dry-bulb temperatures measured at the Bierset meteorological station were documented [93].
Images were captured from the opposite pavement to maximize the field of view and reduce perspective distortion. Obstacles may have interfered with the shooting by obscuring part of the facade. As all facades face the street, these obstacles are mainly vehicles (Figure 3). Cars only obscure the lower part of the facade and do not constitute a significant loss of data, as shown in the qualitative analysis below. Of the 1209 images produced for the IRT of the 522 facades in the case studies, only six images were affected by the presence of a van significantly obscuring the ground floor. Nevertheless, it should be noted that these obstacles pose three problems: (i) they could be much more numerous for other urban typologies, (ii) they constitute a significant loss of data in the case of a more precise analysis of the thermal characteristics of the walls, and (iii) in the event of automated image processing, it will be necessary to integrate these obstacles, in particular vehicles with hot engines. Due to the camera’s limited angular coverage, multiple images were taken per facade and subsequently assembled using image-processing software (Gimp 3.0.6-1) to reconstruct complete façade views (Figure 3). These reconstructions facilitate comparative analysis across buildings but are not strictly required for single-building interpretation.
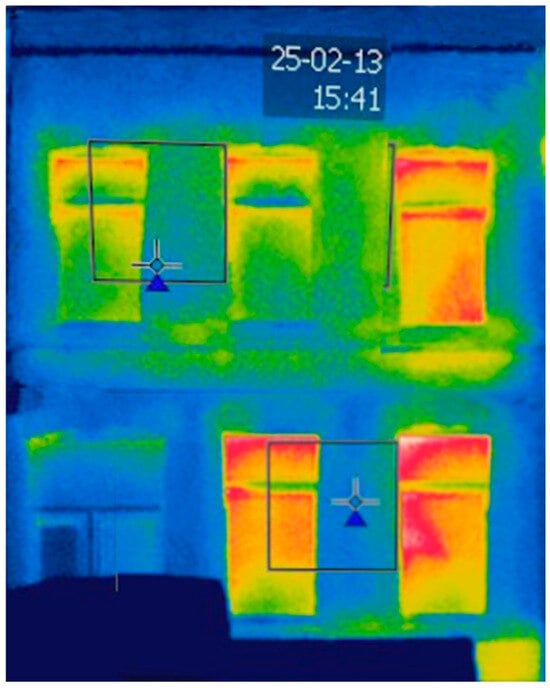
Figure 3.
Reconstruction of a thermal photograph of a facade (here with 4 source photos).
Given the camera’s resolution-inspection-oriented design and the losses of information related to the shooting method, thermograms were interpreted qualitatively, focusing on relative surface-temperature contrasts rather than absolute temperature values. Observations targeted recurring envelope features, including wall insulation discontinuities, window and frame heat losses, apparent thermal zoning, open windows, and apparent non-occupancy (Figure 4). These indicators were used comparatively across the building sample to identify dominant heat-loss patterns at the neighborhood scale.
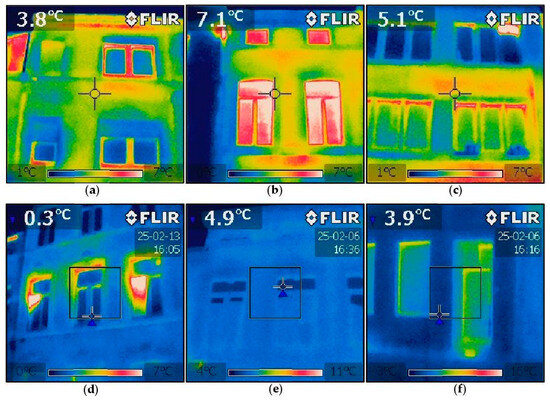
Figure 4.
Infrared image of buildings with (a) suspected low wall thermal insulation, (b) suspected low thermal resistance windows/glass, (c) apparent thermal zoning, (d) two open windows, (e) presumed unoccupation, and (f) presumed good insulation.
All thermal images, acquisition metadata, and qualitative interpretation notes are provided in the associated Harvard Dataverse dataset [79], enabling transparency and reuse.
3.4.3. Focus Group Organization
In parallel with the survey and infrared thermography, a focus group study was conducted to capture qualitative insights from professionals, institutional actors, and civil society stakeholders involved in housing, energy renovation, and energy poverty. This qualitative component was designed to contextualize and interpret the quantitative findings and to explore mechanisms, barriers, and policy-related dynamics that cannot be observed solely from household-level data.
The focus group was organized within the framework of the UNIC CityLabs initiative, which promotes collaboration between academia, public authorities, and societal actors in post-industrial urban contexts [94]. The session’s thematic focus was energy poverty and residential energy renovation in the city of Liège. The discussion framework and guiding questions were jointly developed by the research team and UNIC organizers, drawing on established focus group methodologies [95].
Participants were recruited through purposive sampling to ensure a diverse range of perspectives and expertise. Invitations were sent to researchers from the University of Liège, representatives and employees of the City of Liège, and professionals and stakeholders from civil society organizations and associations active in the housing and energy domains. In total, 25 participants took part in the focus group exercise, including researchers and academics, municipal staff, and civil society representatives. Participants were distributed across three parallel discussion groups, each comprising approximately eight participants, a size consistent with recommended focus group practices to encourage balanced participation and limit dominance effects [81,96]. The composition of stakeholder categories is illustrated in Figure 5.
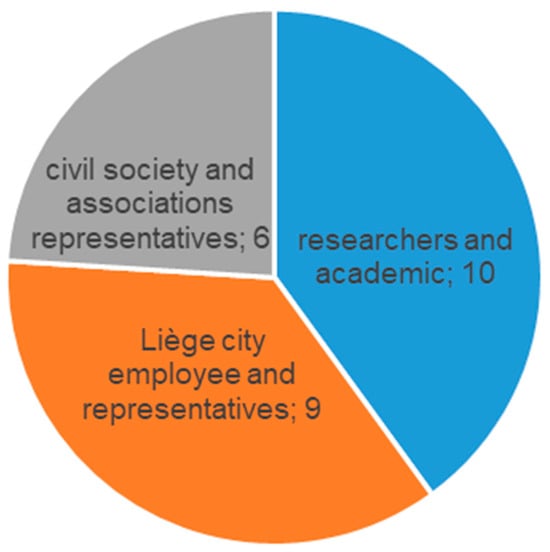
Figure 5.
Distribution of the different focus group stakeholders.
The focus group was structured in two discussion rounds. In the first round, participants discussed the determinants, manifestations, and recent evolution of energy poverty in Liège, guided by semi-structured questions introduced by moderators. Following a short break and a presentation of preliminary survey and IRT observations, a second round focused on potential responses, including behavioral strategies, renovation barriers, financing mechanisms, and priority policy measures at the local level.
Each discussion session was moderated by a trained facilitator and documented with dual audio recordings, complemented by handwritten notes from designated rapporteurs. All participants provided informed consent prior to recording. At the end of the sessions, rapporteurs presented preliminary syntheses of the discussions to verify the accuracy of the recorded content and to enable immediate clarification or correction.
Audio recordings were transcribed verbatim, with filler words and repetitions removed to facilitate analysis. Rapporteurs reviewed transcripts for verification. The three group transcripts were then jointly analyzed using a structured thematic extraction aligned with the guiding questions, enabling the identification of recurring themes, points of consensus, and divergent viewpoints across groups. An anonymized synthesis of the focus group findings was produced and shared with participants for feedback.
All anonymized transcripts, thematic syntheses, and supporting documentation are included in the associated Harvard Dataverse dataset [79].
3.5. Data Processing and Analysis
Data processing and analysis were conducted separately for each empirical component prior to mixed-methods integration, following a sequential but complementary logic. This approach ensured methodological rigor within each data stream while preserving the analytical independence required for triangulation.
3.5.1. Survey Representativity, Data Processing and Analysis
Survey responses collected on paper were digitized and encoded into a structured database. Data cleaning involved checking for completeness, internal consistency, and legibility. In accordance with established methodological recommendations, questionnaires with more than 5% missing responses were considered inadmissible and excluded from analysis [90]; no questionnaires met this exclusion criterion.
The study of the distribution of respondent categories in comparison with their actual distribution in the city of Liège (Figure 6) reveals any categories that may be underrepresented. We find that respondents with a higher education degree (a) and a high income (b) are overrepresented. Conversely, people with low levels of education and low incomes are underrepresented, as are older people (c). There are several reasons for these differences. Households with a high level of education are proportionally more open to responding to these surveys. In addition, as we will see in the results, high-income households tend to live in single-family homes, while low-income households tend to live in apartments, which are more difficult to contact due to the barrier represented by the intercom. All types of households are represented (d) despite an underrepresentation of single-person households and single-parent families, which is consistent with previous observations. Overall, our sample is composed of varied profiles, even if it is not fully representative of households in Liège and Wallonia.
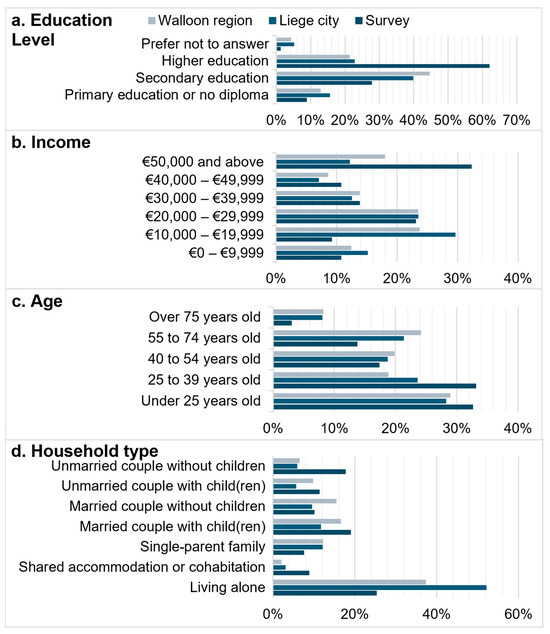
Figure 6.
Comparison of the distribution of (a) maximum level of education, (b) net household income, (c) age of household members and (d) household type, between survey respondents, residents of the city of Liège and residents of the Walloon Region.
Descriptive statistical analysis was conducted in three stages. First, univariate descriptive analysis was applied to all variables to examine distributions, frequencies, and central tendencies, and to identify potential anomalies [97]. This stage also enabled characterization of the survey sample and comparison with reference population data for the city of Liège and the Walloon Region.
Second, bivariate descriptive analysis was performed using contingency tables to explore associations between technical building variables and socio-economic household variables [98]. This approach is well-suited to mixed data types, including nominal, ordinal, and discrete quantitative variables. Third, for selected contingency tables with notable patterns, Cramér’s V was calculated to assess the strength of the association between variables. This statistic is particularly appropriate for small sample sizes and categorical data [99].
3.5.2. Infrared Thermography Analysis
Thermal images were processed and examined using a qualitative diagnostic approach. Individual thermograms and reconstructed façade images were reviewed to identify recurring heat-loss features, including wall insulation discontinuities, window and frame losses, thermal zoning, open windows, and signs of non-occupancy. Interpretation focused on relative temperature contrasts between facades rather than absolute surface temperatures, in line with the equipment’s limitations and the neighborhood-scale scope of the study.
Observations were systematically coded into predefined diagnostic categories to support comparisons across buildings. To ensure the robustness of the observations, a single person was responsible for systematic co-coding. Coding was carried out in a single day for the entire batch. Coding was repeated a second time on another day to identify any images that were open to debate and make a final decision on the choices. These codes were then linked to survey variables for dwellings where both survey and IRT data were available, enabling joint interpretation of envelope performance and reported occupancy or usage patterns.
3.5.3. Focus Group Analysis
Focus group transcripts were analyzed using a structured thematic approach aligned with the guiding discussion questions. For each initial question, all three group transcripts were reviewed in parallel to extract relevant statements and themes. Identified elements were then categorized according to their recurrence across groups, their perceived importance within discussions, and their consistency or divergence relative to existing literature.
Attention was paid to statements that explained observed quantitative patterns or highlighted institutional, behavioral, or policy-related barriers not directly observable in survey or IRT data. Selected quotations were retained to support and nuance the interpretation of results in the Section 5.
All processed datasets, coding schemes, and analytical outputs are documented and shared in the Harvard Dataverse repository [79].
3.6. Mixed-Methods Integration and Triangulation
Mixed-methods integration constitutes the core analytical step of the study and is implemented following a convergent triangulation strategy. Quantitative and qualitative findings are first analyzed independently and subsequently brought together during interpretation to examine convergence, complementarity, and divergence across data sources [77].
Integration is carried out in two stages. In the first stage, survey data and IRT observations are jointly examined for all dwellings for which both sources of information are available. Survey responses related to dwelling characteristics, occupancy, heating practices, and perceived comfort are used to contextualize and interpret façade thermograms. This step addresses a key limitation of IRT, namely its dependence on unknown internal conditions and usage patterns, by linking observed heat-loss features to reported household practices and building attributes. Convergences between survey responses and thermographic observations are interpreted as reinforced findings, while discrepancies are examined as potential indicators of reporting bias, measurement constraints, or heterogeneous occupancy conditions.
In the second stage, results from the survey–IRT integration are compared with themes emerging from the focus group discussions. This step enables interpretation of household-level observations considering professional and institutional perspectives on energy renovation, energy poverty, and policy implementation. Focus group insights are used to explain observed patterns, identify structural barriers, and highlight mismatches between household experiences, technical diagnostics, and stakeholder expectations.
Across both stages, contradictions between methods are not treated as methodological failures but as analytically meaningful signals. Such divergences may reveal differences in perception between residents and professionals, limitations of diagnostic tools, or socio-technical tensions inherent to residential energy renovation. The integrated analysis, therefore, explicitly documents both reinforced findings and points of tension, which jointly inform the discussion and conclusions.
The integrated datasets supporting this triangulation process are documented and shared in the Harvard Dataverse repository [79].
3.7. Ethics, Data Protection, and Data Management
This study involves the collection and processing of personal data as defined by the General Data Protection Regulation (GDPR). Ethical and data protection measures were implemented throughout all stages of data collection, analysis, publication, and storage to ensure compliance with legal requirements and institutional guidelines.
All data handling follows the principle of “as open as possible, as closed as necessary”, in line with FAIR data principles. Personally identifiable information, including names, exact addresses, and any elements that could enable direct identification of respondents or dwellings, was neither stored in the analytical datasets nor disclosed. For infrared thermographic images, distinctive façade elements that could allow location identification were blurred where necessary. No explicit linkage between façade images and household socio-economic data is disclosed.
Survey participants received written information explaining the study’s objectives, the nature of the data collected, the data protection measures, and their rights as participants. Informed consent was obtained explicitly through a mandatory confirmation question at the end of the questionnaire. Focus group participants were informed verbally and in writing about recording procedures and data use, and their consent was obtained prior to audio recording.
Paper questionnaires were securely stored in a restricted-access room at the University of Liège and digitized for analysis. Digital data was stored on secure university servers. All research data will be retained for up to 5 years after publication, after which it will be permanently deleted. In accordance with the University of Liège’s data protection procedures, the sensitivity of the data and the mitigation measures implemented did not require formal ethics committee approval.
Anonymized datasets, documentation, and metadata are shared via Harvard Dataverse to support transparency and reuse, while respecting all data protection constraints [79].
3.8. Quality Assurance, Robustness, and Limitations
Multiple complementary quality-assurance mechanisms ensure the study’s robustness. The primary safeguard is methodological triangulation, whereby three independent methods addressing similar research questions are applied and integrated [77,100]. Consistent findings across survey responses, IRT observations, and focus group discussions are interpreted as robust results.
In addition to methodological triangulation, researcher triangulation was applied. Different research teams were responsible for the development and execution of the survey, IRT campaign, and focus group, thereby providing complementary perspectives and reducing the influence of individual researchers’ bias. Survey instruments were pilot-tested, the IRT protocol was validated through a preliminary campaign, and focus group outputs were verified through member checking and cross-group comparison.
Several limitations must be acknowledged. The study is based on a single neighborhood case study and does not aim for statistical representativeness at the city or regional scale. Results should therefore be interpreted as context-specific and exploratory, rather than generalizable without caution. The survey’s non-representative nature limits inferential claims, though this limitation is mitigated by triangulation with systematic IRT coverage and qualitative insights.
Some limitations are more specifically related to the self-reported survey method. Respondents may be influenced by the social desirability of their answers. The accuracy of responses on technical concepts, such as energy labels or wall insulation, may also vary depending on the occupants’ knowledge in this area. To limit the effect of these limitations, this article (i) explains these limitations, (ii) describes their impact on the results, and (iii) outlines directions for future research [101]. From a technical perspective, the infrared camera’s limited spatial resolution and calibration constraints necessitated qualitative interpretation of thermograms. While this approach is appropriate for neighborhood-scale diagnostics, higher-resolution equipment could improve consistency and reduce analytical uncertainty in future studies. The lack of access to all dwellings located in interior courtyards also constitutes a limitation in the representativeness of the study. Qualitative analysis of defects also involves subjective judgment, which should subsequently be formalized, for example, by quantifying temperature variability on a higher-quality IRT.
Finally, while the focus group provided rich contextual insights, qualitative findings are inherently shaped by participant composition and discussion dynamics.
Despite these limitations, the structured combination of multiple data sources, standardized protocols, pilot testing, and explicit validation procedures ensures that the methodology is reproducible, transparent, and robust within its intended exploratory scope.
4. Results
4.1. Survey
The results presented below enable us to characterize the respondent profile. The most interesting data relating to the research questions will be highlighted.
By socioeconomic status, 55% of single residents live in apartments, whereas 91% of couples live in houses. Homeowners occupy an average of 153 m3 of living space, while renters occupy an average of 82 m2. 52% of homeowners live in homes that have undergone ER work, compared to only 17% of tenants. Among owners of renovated homes, 23% of household members are over 55, 24% are between 40 and 54, 22% are between 25 and 39, and 31% are under 24. Among owners of non-renovated homes, 19% of household members are over 55, 17% are between 40 and 54, 37% are between 25 and 39, and 27% are under 24. However, if we focus on ER visits over the last five years, 43% of occupants of these buildings are aged 25–39.
By building type, 44% of respondents’ homes were built before 1900, 38% between 1900 and 1945, and 14% between 1946 and 1970. Most respondents, therefore, live in homes built before energy standards were introduced. Most of these homes are terraced houses (57%). The remainder are apartments (24%), often formed by subdividing large terraced or semi-detached houses (14%). The building typology is therefore homogeneous, as desired when selecting the case study, with many buildings classified as traditional workers’ and middle-class houses, some of which have been subdivided into apartments.
As shown in Figure 7a, 57% of respondents reported that part of their window frames was insulated (at least double-glazed). This will not be considered ER work in the rest of the study, but rather maintenance work. 54% of respondents report that part of their roof is insulated. Only 27% of respondents reported that part of their walls was insulated, and 16% reported that part of their floors was insulated, which can be explained by the greater technical complexity involved in working on these walls. Finally, it should be noted that 19% of respondents report producing renewable energy, and 16% have mechanical ventilation. Window frames and roofs are the most common types of work carried out but they are not representative of a deep ER. On the other hand, 91% of homes that have insulated their walls have also insulated their roofs, window frames, and made at least one other energy improvement. Gas boilers are installed in 78% of homes (Figure 7b), compared to 10% for oil boilers and 6% for gas or oil stoves. Wood stoves (20%), electric radiators (15%) and heat pumps (10%) are mainly used as secondary systems coupled with a gas boiler. This reflects both the impact of the area studied being supplied by town gas and the cost of electricity in Belgium. Considering that urban housing must in future be heated by a district heating network or a heat pump, this means that none of the homes visited meet future energy source requirements.
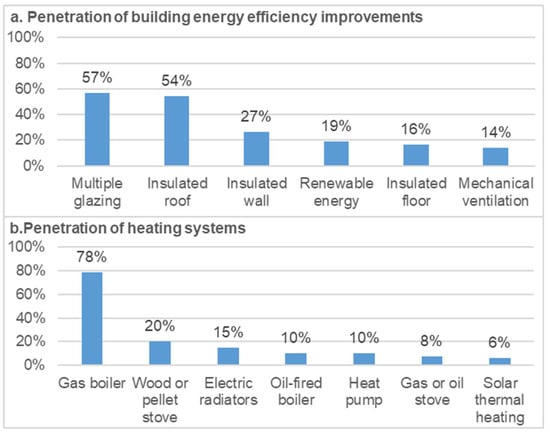
Figure 7.
Penetration of (a) energy efficiency improvements in buildings and (b) heating systems.
65% of tenants are unaware of the energy rating of their homes. However, the energy certificate must be provided at lease signing, and half of the households have lived in the home for two years or less. Only 32% of homeowners are unaware of their home’s energy rating, while 22% know that their building has not yet been certified.
Residents report heating their living rooms to an average of 19.1 °C and their bedrooms to 17.2 °C. However, tenants heat their living rooms to an average of 0.8 °C higher than homeowners do, and their bedrooms to 2 °C higher. Part of the explanation offered by some tenants lies in the method of paying for energy as a fixed charge, which does not incentivize energy conservation. There seems to be little correlation between heating temperature and ER work, except that the most energy-efficient buildings (A, B, C) do not drop below 19 °C in the living room.
Several observations can be made on the energy expenditure reported by respondents (Figure 8). The self-reported nature of the data collected may contribute to underestimating or overestimating energy expenditure, even though a large proportion of respondents consulted their energy bills when completing the questionnaire. It is therefore important to focus on general trends rather than outliers. First, an improvement in the energy rating does not necessarily result in a significant reduction in energy use; conversely, the absence of an energy rating can lead to high energy costs. Lack of knowledge about this energy rating has a more moderate effect. Tenants tend to have higher average use than owners. In any case, only 25% of residents are aware of their home’s energy performance, which is clearly insufficient to accelerate ER. Residents with a budget meter or a social tariff pay an average of €21.54 per m2. Owners consume an average of €17.87/m2, while tenants spend an average of €22.36/m2. Residents of renovated homes spend an average of €17.90 per m2, whereas residents of non-renovated homes spend an average of €20.41 per m2.
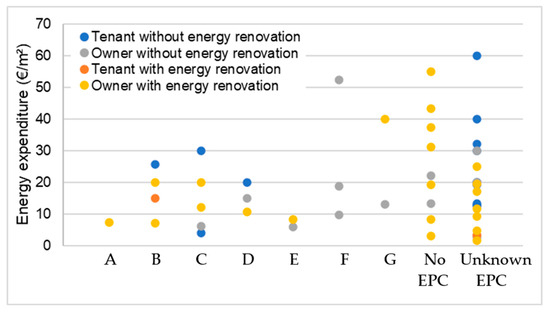
Figure 8.
Breakdown of energy expenditure according to EPC label, indicating occupant status and ER work.
Table 1 summarizes the main technical and socioeconomic criteria previously studied [9,12]. All apartments are grouped into a single category. Incomes are classified into two categories: low and medium income (below €39,999 per year) and high income (above €40,000 per year), allowing us to divide our sample into two groups of similar sizes. Three specific categories of resident/building pairs are particularly well represented in our sample: high-income owners of renovated terraced houses (23% of the sample), low-income owners of non-renovated terraced houses (15%), and low-income tenants of apartments (18%). The underrepresentation of detached and semi-detached houses in the case study precludes further conclusions regarding their distribution. Calculating Cramer’s V for this contingency table gives: 0.56. The literature suggests that this result indicates a strong association between the technical and socioeconomic criteria examined, which reinforces our previous observations.

Table 1.
Contingency table cross-tabulation of technical criteria (housing geometry and ER) with socio-economic criteria (occupancy status and income category) among survey respondents.
When creating the questionnaire, four sections were designed to elicit a more detailed understanding of the motivations and obstacles faced by four profiles: owners of renovated homes, owners of non-renovated homes, tenants of renovated homes, and tenants of non-renovated homes. As there were only a few tenants of renovated homes, we will focus mainly on the other profiles. Figure 9a shows that owners who have not renovated their homes may be motivated by multiple factors. However, the main motivations are financial gain (60% high or very high impact), energy prices (56% high or very high impact), and environmental awareness (52% high or very high impact). When compared to what actually motivated renovating homeowners to renovate (Figure 9b), we see that the primary trigger for ER is often a change related to the home, such as purchasing it (59% high or very high impact), ahead of environmental awareness (52% high or very high impact), and energy prices (44% high or very high impact). Although many levers could, in principle, be mobilized, the purchase of a home is the ideal time to renovate. Conversely, financial criteria remain a primary factor distinguishing those who have renovated from those who have not. Environmental awareness is particularly stable, with or without renovation. While this may reflect the penetration of these issues among the population, this high rate could also be representative of the social desirability of the response.
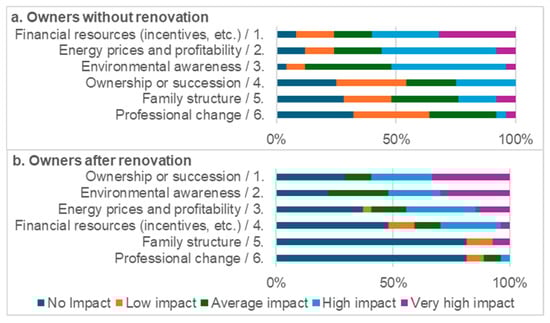
Figure 9.
Assessment of the importance of various changes that could (a) encourage homeowners to renovate or that have (b) encouraged homeowners to renovate from the most important to the least important.
Tenants do not have the same opportunities to undertake ER work. However, it should be noted that although only 17% of tenants took energy performance into account when choosing their current home, 79% consider it a deciding factor when looking for a future rental property. Respondents who will not consider this criterion report that they do not have the option to select housing based on it.
Finally, regarding comfort, owners who have renovated their homes report being satisfied or very satisfied. Conversely, owners who have not renovated report being dissatisfied or very dissatisfied with their winter (48%) and summer (33%) comfort. 43% of tenants living in non-renovated housing report being somewhat dissatisfied or very dissatisfied with their comfort in both winter and summer. ER therefore results in improved comfort in both winter and summer for the time being, although these results will need to be recontextualized in light of the effects of climate change.
4.2. Infrared Measurements
The study of IRT images allows us to make several observations about the technical characteristics of buildings visible from the street and their use. On the one hand, we can compare the number of buildings with presumed poor facade insulation, poor window insulation, thermal zoning, or high vacancy rates with the total number of buildings visible from the street. In addition, we can compare the number of open windows with the presumed number of dwellings that need ventilation. These observations are summarized in Table 2.
Table 2.
Main observations from IRT.
Poor insulation in buildings was an expected finding. It is clearly visible in more than half of them, not counting apparently unoccupied buildings whose performance cannot be determined. The rate of 59% of heat loss indicates an underestimation of the problem, given that these are largely terraced buildings facing the street, which can easily improve their compactness by insulating the roof and rear facade, but which are difficult to insulate at the front (esthetics, facade alignment, technical problems with interior insulation). However, this is also why this measure alone is insufficient to assess a building’s performance.
Poor window insulation is a better indicator. Replacing windows is among the first energy-efficiency measures to enhance comfort. Observing poorly performing window frames is a strong indication of the likely absence of energy-efficiency improvements in the rest of the building. This is especially true if it coincides with poor wall insulation.
It is also noticeable that a significant number of buildings are visibly thermally zoned. This apparent thermal zoning can be explained by a difference in wall insulation or a difference in indoor setpoint temperature. For thermal zoning to be visible on the IRT, given the camera’s low resolution, these differences in composition and/or temperature must be significant.
The number of empty buildings is consistent with findings from other indicators. Although this is not directly relevant to our study, it is an essential element in the public authorities’ assessment of the housing policies to be implemented in each neighborhood.
Finally, the most unexpected observation was the number of open windows. While it is recommended to open windows to ventilate homes without mechanical ventilation, this should be limited to a few minutes per day. Thermographic readings were taken at different times of day, thereby reducing the likelihood that windows were opened at a fixed time. Finally, some of these homes have CMV, while it is likely that other residents do not open their windows enough to ventilate. It is therefore likely that this opening rate reflects excessive ventilation in some homes, resulting in energy loss.
4.3. Focus Group
Following a study by three Focus Groups (FG01, 02, 03) on issues relating to EP in the city of Liège and the Walloon region, several lessons were summarized. First, the three groups (FG01, 02, 03) highlighted four factors that exacerbate EP in Liège. (i) The stock of buildings in Liège has some distinctive technical characteristics. It is old, aligned along property lines, with significant heritage issues and a general lack of maintenance. (ii) The population of Liège also has a high concentration of socio-economic disadvantages: households in precarious economic situations, people with disabilities, single-parent families, young people and students, people from immigrant backgrounds, and tenants. (iii) The energy crisis of 2022 has caused hardship for households that are less protected by existing assistance and safeguards, and which, until then, had been able to pay their energy bills. (iiii) According to participants, energy issues in housing require a great deal of knowledge: energy billing, how a home works, and administrative management of renovations and subsidies. The fragmentation of ownership makes it more difficult to pool this knowledge.
Liège is not a homogeneous entity; significant disparities exist among neighborhoods. In general, neighborhoods in valleys are denser and have a higher concentration of households in precarious economic situations, whereas neighborhoods on hillsides are less dense and have a lower concentration of households in precarious economic situations (FG01, 02, 03). However, some participants (FG02) note the success of certain urban renewal projects that have altered the dynamics in certain neighborhoods, thereby triggering a virtuous cycle.
From the perspective of households facing EP, two contrasting behaviors have been highlighted. (i) FG02 and 03 thus tended to focus on households that were cutting back on energy use, either directly on energy use or on other types of use, at the risk of putting themselves in danger. (ii) In addition, other participants in FG01 also highlighted the particularly energy-intensive behavior of certain households in precarious situations, who apparently had no idea how much energy they were consuming. However, all groups agree on the risks of social isolation and health depletion associated with EP.
The three focus groups unanimously agreed that there has been no structural response to these difficulties. After the significant expenditure in 2022, most residents and institutional actors have returned to their pre-crisis behavior. On the contrary, the rules governing ER subsidies have been revised, which has reduced confidence in public authorities (FG03). However, uncertainty remains very high regarding energy prices. Although winters are becoming less cold (FG01), the increase in heat waves is raising concerns among many stakeholders that households in precarious situations are overexposed to heat waves (FG02, 03). As mentioned in the state of the art section, this exposure to overheating affects both certain unrenovated buildings and other buildings that have been renovated without specific attention to summer comfort.
Following this observation, participants expressed their opinions on the various strategies to reduce the number of households in EP. We have grouped these strategies into three areas:
- The energy crisis of 2022 demonstrated that short-term financial assistance is essential to prevent many households from falling into poverty, but it is unsustainable in the long term for the state’s finances. Depending on how this aid is distributed, it can also be used for other purposes (FG01, 02). On the contrary, investing funds in energy-saving measures should prove more profitable or less risky in the long term. The first proposal is to reallocate ER assistance to prioritize comprehensive support for households most in need. This seems preferable to all participants compared with the current scattergun approach, which ultimately benefits households that are better able to invest (FG01, 02, 03). However, other actions were also mentioned, such as implementing ER programs (FG01, 02), working on heating networks to decarbonize and reduce energy prices (FG01, 03) and targeting social housing (FG01). To finance the additional investments, FG02 noted the possibility of redirecting funds and leveraging the future European carbon tax, while emphasizing the long-term profitability of energy-saving measures. FG01 also mentioned two additional difficulties: the lack of skilled labor in the building trades and rising land prices.
- Some participants noted that awareness campaigns on energy and housing always reach the same audience already invested in these issues (FG01, 03). While it is necessary to continue training, it is also necessary to develop tools to reach new people by drawing on local associations and cultural organizations that enjoy greater trust (FG01, 03) or by refining our understanding of the region (FG01). However, these awareness campaigns must take care not to stigmatize certain population groups (FG01), but rather to listen to them. We need to develop new housing standards that people want (FG01). This awareness-raising goes hand in hand with simplifying administrative procedures to reduce non-take-up (FG01, 02, 03). Support must continue after the work is completed to provide training on the proper use of the premises and limit the rebound effect (FG02).
- At the same time, regulations should continue to be developed to identify and encourage certain groups to renovate, such as landlords and co-owners, who are particularly prevalent in large cities such as Liège (FG01, 02, 03), as well as new buyers who find themselves at a turning point in the life of the building (FG02).
5. Discussion
5.1. Triangulation of Survey Data, Infrared Survey Data, and Focus Group Data
The first part of triangulation involves studying buildings for which we have both a survey response questionnaire and infrared imagery of the facade. By organizing these infrared images using the same logic as in Figure 6, we obtain a distribution of images based on the PEB and the respondent’s reported energy expenditure (Figure 10). The image heterogeneity is relatively significant. However, we still observe a trend among buildings for which PEB is known, with increasingly homogeneous and cold IRT. However, the energy production criterion appears to be more informative for assessing low energy expenditure, even in a very warm IRT. This observation appears to confirm that renewable energy production is more effective than envelope insulation at reducing energy costs. And that is without even mentioning the installation costs and technical difficulties involved in insulation. Unfortunately, this production of local renewable energy never translates into the priority installation of a carbon-free heating system. This highlights a partial failure of the certification system, which is unable to logically coordinate the various works undertaken.
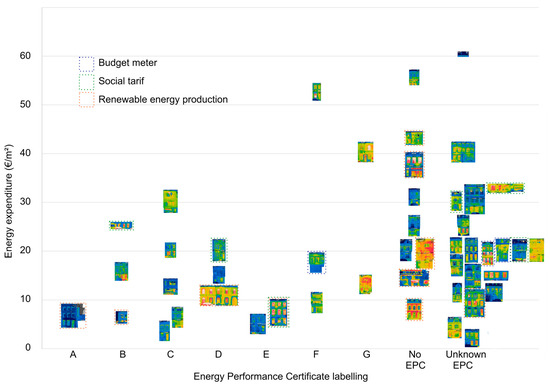
Figure 10.
Classification of facades IRT according to their energy expenditure and EPC label, with indication of buildings that produce renewable energy and buildings with special energy prices.
Furthermore, we note that respondents who benefit from the regulated social tariff on the purchase price of energy seem to have warmer IRT, probably because they live in lower-quality housing. As a result, the social tariff does not translate into financial savings, but rather as essential assistance in avoiding skyrocketing bills. Conversely, households using a budget meter have lower energy costs, which may indicate better budget control, although the sample size is too small to draw definitive conclusions.
Overall, the three methods converge on several common findings. Starting with the chronic inefficiency of Liège’s building stock and the total absence of energy transition in these dense, old neighborhoods, which still rely heavily on gas. The observation of thermal zoning is particularly interesting for single-family homes. Whether it is a deliberate reduction in temperature by the occupant or an unoccupied room that does not need to be heated, it illustrates the widespread practice of energy-saving behavior in poorly performing buildings. However, it is important to be aware that this thermal zoning will reduce the cost-effectiveness of the ER work recommended by an energy audit. This is especially true if the occupant pays less attention to their behavior after the work is completed (rebound effect).
However, there has been a slow but steady improvement in ER work. Rather than for financial gain, which remains limited due to relatively low energy prices, the work is being carried out as part of a broader renovation and redevelopment of the property, particularly at the time of purchase. Notably, people with the financial means to do so are increasingly taking this information into account, a pattern that was not necessarily the case before. However, they say they do not need a subsidy to do so. From this perspective, we can see that energy issues are indeed permeating the population, with more than half reporting that they are willing to consider energy-saving measures out of environmental awareness. The current financial incentives are ineffective. They are not the reason for the work that has been done, and they are insufficient to convince new households to undertake renovation, particularly those in precarious situations.
One of the most interesting findings of the study is the marked dichotomy between households that report being sensitive to these issues and attempting to implement energy-saving measures and those that are less concerned. This dichotomy is evident across household income and education levels, as observed in both the survey and the focus group conclusions. IRT also highlights these significant differences. Awareness of energy issues is likely to become a real social marker, but also a factor of exclusion, in the same way as income, level of education, language proficiency, etc.
At the same time, tenants emerge unanimously as big losers, even though they occupy more apartments that are theoretically more compact. They experience poorer-quality buildings, less power to influence them, energy charges that do not encourage energy-saving behavior, and a concentration of risk profiles that can be cumulative (e.g., lower incomes, isolated individuals, single-parent families, people with disabilities, people under guardianship).
From a ventilation perspective, the IRT survey findings were corroborated by the questionnaire and focus group. Indeed, 76% of respondents reported regularly opening their windows to ventilate, thereby ensuring a minimum degree of indoor air renewal. However, this habit often leaves windows open for too long. As shown in the IRT, this opening time results in significant heat loss, which presents an opportunity for energy savings, particularly if the home is equipped with a single-flow mechanical ventilation system.
The limitations of facade IRT do not diminish its value. In a large-scale mapping approach, it could be used to estimate heat loss from the building envelope with greater accuracy than aerial IRT. The facade IRT highlights differences between window frames and walls, as well as between apartments in the same building. This precision also enables raising awareness among all building residents while avoiding the “disappearance” of houses with unheated attics.
5.2. Key Findings and Recommendations
This study identifies three interacting mechanisms, listed in Table 3, that explain why residential energy renovation systematically stalls in energy-inefficient urban neighborhoods, even when technical need is evident.
Table 3.
Socio-technical mechanisms stabilizing residential renovation inertia at the neighborhood scale.
Together, these mechanisms produce a socio-technical lock-in in which technical degradation, behavioral adaptation, tenure asymmetry, and institutional fragmentation reinforce non-renovation as the least risky and most stable outcome. These lock-ins can be locally reinforced by the conflicting interests that guide local governments, architects, and historical heritage managers in their own vision of territorial development. These interests can hinder or even negate social and ecological priorities. Breaking this lock-in requires interventions that redistribute agency and coordinate action at the neighborhood scale, rather than relying solely on individual awareness or voluntary uptake.
5.3. Strengths and Limitations
The primary strength of this study lies in its integrated neighborhood-scale triangulation, which enables identification of mechanisms that remain invisible in single-method approaches. Survey data alone would underestimate technical inefficiency due to adaptive masking, while IRT alone would ignore the social constraints shaping renovation behavior. Focus group insights further reveal how institutional logic interacts with household-level realities. The convergence of these perspectives strengthens the credibility of the findings, while divergences are analytically productive rather than problematic.
A second strength is the deliberate focus on a homogeneous building stock with heterogeneous households, which allows socio-economic mechanisms to emerge clearly. This design choice allows attributing differences in renovation to agency, tenure, and institutional context rather than to building typology.
Several limitations must nonetheless be acknowledged. The study is exploratory and non-representative, and its findings cannot be statistically generalized. Surveys rely on residents’ statements and may suffer from potential biases, such as social desirability and lack of knowledge. IRT suffers from low resolution and imperfect representativeness. It is interpreted qualitatively and does not provide calibrated performance metrics. However, these limitations are consistent with the study’s diagnostic objective. The methodology is not intended to predict energy savings, but to explain why renovation does or does not occur under real-world conditions.
Importantly, these limitations do not weaken the core contribution: the identification of structural mechanisms that stabilize renovation inertia at the neighborhood scale. Nevertheless, improvements in these various areas would individually contribute to strengthening the overall quality of the results.
5.4. Implications on Practice and Research
The findings explain why many energy renovation policies systematically underperform. Policies centered on information provision, voluntary uptake, or individual financial incentives implicitly assume that households possess the agency to act once informed. The evidence contradicts this assumption. When renovation capacity is constrained by tenure, income, or institutional complexity, such instruments primarily benefit already advantaged households, leaving structurally vulnerable households behind.
Effective practice, therefore, requires shifting from individualized renovation logic to collective and tenure-sensitive strategies. Neighborhood-scale interventions, landlord-targeted obligations, coordinated renovation programs, and trusted local intermediaries are more likely to disrupt the identified lock-in mechanisms than are additional awareness campaigns or marginal increases in subsidies. Renovation techniques could be adapted to the specific characteristics of each building rather than being constrained by performance requirements for each element, which can prove counterproductive. An integrated approach is essential to transform opportunistic interventions into real environmental gains, such as local PV panels powering heat pumps.
For research, this study demonstrates the value of framing residential energy renovation as a socio-technical transition problem rather than a purely technical optimization challenge. Future work should replicate this approach across contrasting neighborhoods, explore longitudinal dynamics of adaptation and lock-in, and examine which institutional arrangements successfully reallocate agency. Comparing the results obtained with other methods, such as physical measurement campaigns and administrative records, would also help to strengthen the conclusions. Methodologically, the study supports further development of mixed-method diagnostic frameworks that prioritize explanation over prediction and equity over average performance gains.
In sum, residential energy renovation stalls not because solutions are unknown, but because existing systems reproduce non-renovation as a stable outcome. Understanding and dismantling this stability is the central challenge for both research and policy.
6. Conclusions
This study demonstrates that the persistent low uptake of residential energy renovation in older urban neighborhoods cannot be explained solely by technical deficiencies. Instead, renovation inertia emerges from a set of interacting socio-technical mechanisms that stabilize non-renovation as the most feasible outcome for many households.
At the building level, infrared thermography confirms widespread envelope inefficiencies across the neighborhood. Yet these deficiencies do not systematically trigger renovation. Survey and qualitative evidence show that households frequently rely on adaptive strategies, such as under-heating, spatial thermal zoning, or acceptance of reduced comfort, to cope with poor performance. These practices temporarily reduce energy expenditure while simultaneously masking technical inefficiencies, thereby reducing the perceived urgency of renovation.
Crucially, renovation capacity is unevenly distributed. Households most exposed to energy inefficiency and energy poverty are often tenants or low-income occupants who lack decision-making power, financial leverage, or long-term security. In contrast, households with sufficient agency to renovate are less exposed to energy stress. This misalignment between need, control, and benefit explains why policies centered on voluntary uptake, information provision, or generic financial incentives systematically underperform.
Methodologically, the study shows the added value of neighborhood-scale mixed-methods triangulation. Combining façade infrared thermography, household surveys, and stakeholder focus groups enables the identification of mechanisms that remain invisible in single-method approaches. Importantly, discrepancies between methods are not treated as noise but as signals revealing gaps between measured conditions, lived experience, and policy assumptions.
Beyond the Liège case, the findings highlight a broader challenge for residential energy transitions in post-industrial urban contexts. Effective renovation strategies must move beyond individual choice models and address structural constraints related to tenure, agency, and institutional fragmentation. Neighborhood-based, tenure-sensitive, and coordinated interventions are more likely to break renovation lock-in than incremental adjustments to existing incentive schemes.
Aligning building conditions with household realities is therefore not an implementation detail but a central requirement for equitable and effective residential energy renovation.
Author Contributions
Conceptualization, G.R.; methodology, G.R. and V.L.; validation, G.R. and S.A.; formal analysis, G.R.; investigation, G.R. and V.L.; resources, G.R. and S.A.; data curation, G.R.; writing—original draft preparation, G.R.; writing—review and editing, S.A.; visualization, G.R.; supervision, S.A.; project administration, G.R. All authors have read and agreed to the published version of the manuscript.
Funding
This research received no external funding.
Institutional Review Board Statement
This study did not require direct ethical approval from an Institutional Review Board (IRB) under the University of Liège regulations, as it is purely an observational, non-interventional study and relies solely on fully anonymized datasets. This exemption is in accordance with: Belgian Law of 7 May 2004 on experiments on the human person (which explicitly excludes purely observational studies from its scope), and EU Regulation 2016/679 (GDPR) principles on data anonymization (anonymous data being exempt). We have an Author Ethical Determination available for you to attach to the article. This document describes the activities carried out, the data collected, the anonymization process, and the Data Management Plan. Informed consent was also obtained from all subjects involved in the study. The consent form provided to all study participants is available upon request.
Informed Consent Statement
Informed consent was obtained from all subjects involved in the study. Participation in the survey was voluntary, and completion of the survey was considered implied informed consent.
Data Availability Statement
The original data presented in the study are openly available in https://orbi.uliege.be (accessed on 23 December 2025) at 10.7910/DVN/GJDA1I [79]. This data has been purged of all personal information in accordance with the GDPR.
Acknowledgments
We would like to thank the members of UNIC Liège for their proposal to collaborate and for their help in organizing the focus group on EP. We would also like to thank all the employees of the city of Liège, and particularly the members of the SCEPA project, who provided us with information and helped us choose and organize the survey. We are very grateful to all the residents of the Saint-Léonard neighborhood who took the time to participate in the survey, and we hope that this article will be of indirect use to them.
Conflicts of Interest
The authors declare no conflicts of interest.
Abbreviations
The following abbreviations are used in this manuscript:
| CWaPE | Commission Wallonne Pour l’Énergie |
| EPC | Energy Performance Certificate |
| ER | Energy Renovation |
| EU | European Union |
| GDPR | General Data Protection Regulation |
| IRT | InfraRed Thermography |
| LLM | Large Language Models |
| LVM | Large Visual Models |
| PV | PhotoVoltaic |
| SCEPA | Scaling-Up Energy Poverty-Actions |
References
- Regulation (EU). 2021/1119 of the European Parliament and of the Council of 30 June 2021 establishing the framework for achieving climate neutrality and amending Regulations (EC) No 401/2009 and (EU) 2018/1999 (‘European Climate Law’). J. Eur. Union 2021, 243, 50. Available online: http://data.europa.eu/eli/reg/2021/1119/oj (accessed on 11 December 2025).
- European Parliament; European Concil Directive (EU). 2024/1275 On the Energy Performance of Buildings; Publications Office of the European Union: Luxembourg, 2024; Available online: http://data.europa.eu/eli/dir/2024/1275/oj (accessed on 11 December 2025).
- DG TLPE. Stratégie Wallonne de Rénovation Energétique à Long Terme du Bâtiment; Service Public de Wallonie: Namur, Belgium, 2020; Available online: https://energie.wallonie.be/files/PEB/B%c3%a2timents%20non%20r%c3%a9sidentiels/Obligation/SRLT/gw-201112-strategie-renovation-2020-rapport-complet-final.pdf (accessed on 15 January 2021).
- Directorate-General for Energy (European Commission); IPSOS; Navigant. Comprehensive Study of Building Energy Renovation Activities and the Uptake of Nearly Zero-Energy Buildings in the EU: Final Report; Publications Office of the European Union: Luxembourg, 2019; Available online: https://op.europa.eu/publication-detail/-/publication/97d6a4ca-5847-11ea-8b81-01aa75ed71a1 (accessed on 11 December 2025).
- Ferreira, M.; Almeida, M. Benefits from Energy Related Building Renovation Beyond Costs, Energy and Emissions. Energy Procedia 2015, 78, 2397–2402. [Google Scholar] [CrossRef]
- Ruellan, G.; Attia, S. Les problématiques de la rénovation du stock bâti dans la ville de demain: Résultats d’une étude initiale en Belgique. Acad. J. Civ. Eng. 2016, 34, 348–355. [Google Scholar]
- Statbel. Statistique Cadastrale du Parc de Bâtiments, Belgique et Régions, Bâtiments et Logements; Publications Office of the Belgian Federal Government: Brussels, Belgium, 2025; Available online: https://bestat.statbel.fgov.be/bestat/crosstable.xhtml?view=1933a957-50d0-4a6d-bf31-4fd6d46fcb26 (accessed on 11 December 2025).
- Brown, D.; Kivimaa, P.; Sorrell, S. An energy leap? Business model innovation and intermediation in the ‘Energiesprong’ retrofit initiative. Energy Res. Soc. Sci. 2019, 58, 101253. [Google Scholar] [CrossRef]
- Ruellan, G.; Attia, S.; Haesbroeck, G. Clustering of archetypal building-inhabitant pairs to improve energy efficiency: The case of the Walloon region in Belgium. Energy Build. 2025, 335, 115549. [Google Scholar] [CrossRef]
- Freimanis, R.; Vanaga, R.; Balodis, V.; Zundans, Z.; Blumberga, A. Hygrothermal Assessment of Insulation Systems for Internal Insulation of Solid Masonry Walls under Various Conditions. Buildings 2023, 13, 2511. [Google Scholar] [CrossRef]
- Psomas, T.; Heiselberg, P.; Duer, K.; Bjørn, E. Overheating risk barriers to energy renovations of single family houses: Multicriteria analysis and assessment. Energy Build. 2016, 117, 138–148. [Google Scholar] [CrossRef]
- Ruellan, G.; Cools, M.; Attia, S. Analysis of the Determining Factors for the Renovation of the Walloon Residential Building Stock. Sustainability 2021, 13, 2221. [Google Scholar] [CrossRef]
- Meyer, S.; Coene, J. Baromètre de la Précarité Énergétique 2024, Analyse et Interprétation des Résultats de 2022 (No. 10). Fondation Roi Baudoin. 2024. Available online: https://kbs-frb.be/fr/barometre-de-la-precarite-energetique-2024 (accessed on 11 December 2025).
- Bartiaux, F.; Vandeschrick, C.; Moezzi, M.; Frogneux, N. Energy justice, unequal access to affordable warmth, and capability deprivation: A quantitative analysis for Belgium. Appl. Energy 2018, 225, 1219–1233. [Google Scholar] [CrossRef]
- Shwashreh, L.; Taki, A.; Kagioglou, M. Retrofit Strategies for Alleviating Fuel Poverty and Improving Subjective Well-Being in the UK’s Social Housing. Buildings 2024, 14, 316. [Google Scholar] [CrossRef]
- Mafalda Matos, A.; Delgado, J.M.P.Q.; Guimarães, A.S. Linking Energy Poverty with Thermal Building Regulations and Energy Efficiency Policies in Portugal. Energies 2022, 15, 329. [Google Scholar] [CrossRef]
- Van de Moortel, E.; Allacker, K. To What Extent Could Alternative Economic Models Increase Investment in the Renovation of and Reduce Energy Poverty in Social Housing in Flanders? Buildings 2023, 13, 3001. [Google Scholar] [CrossRef]
- Bergmann, L. Horizontal Building Interaction as an Element of Neighborhood Energy-Oriented Refurbishment. Buildings 2025, 15, 3918. [Google Scholar] [CrossRef]
- Conci, M.; Schneider, J. A District Approach to Building Renovation for the Integral Energy Redevelopment of Existing Residential Areas. Sustainability 2017, 9, 747. [Google Scholar] [CrossRef]
- Nematchoua, M.K.; Marie-Reine Nishimwe, A.; Reiter, S. Towards nearly zero-energy residential neighbourhoods in the European Union: A case study. Renew. Sustain. Energy Rev. 2021, 135, 110198. [Google Scholar] [CrossRef]
- Ruellan, G.; Attia, S. Integrating statistical data and thermographic survey for assessing energy renovation policies: A review. In Proceedings of the ENHR Conference 2024, Delft, The Netherlands, 26–30 August 2024; Available online: https://orbi.uliege.be/handle/2268/323326 (accessed on 5 November 2025).
- Sesana, M.M.; Rivallain, M.; Salvalai, G. Overview of the Available Knowledge for the Data Model Definition of a Building Renovation Passport for Non-Residential Buildings: The ALDREN Project Experience. Sustainability 2020, 12, 642. [Google Scholar] [CrossRef]
- Liberova, V.; Bremane, I.; Lauka, D.; Laktuka, K.; Bezrucko, T.; Zvirbule, K.; Bezrucko, A.E.; Blumberga, D. Unleashing Energy Potential: Insights of Energy Audit Practices. Energies 2025, 18, 522. [Google Scholar] [CrossRef]
- D’Agostino, D.; Parker, D.; Melià, P.; Dotelli, G. Optimizing photovoltaic electric generation and roof insulation in existing residential buildings. Energy Build. 2022, 255, 111652. [Google Scholar] [CrossRef]
- Felkner, J.; Nagy, Z.; Beck, A.L.; Reeves, D.C.; Richter, S.; Shastry, V.; Ramthun, E.; Mbata, E.; Zigmund, S.; Marshall, B.; et al. IMPACT pathways—A bottom-up modelling framework to guide sustainable growth and avoid carbon lock-in of cities. J. Build. Perform. Simul. 2025, 18, 371–388. [Google Scholar] [CrossRef]
- Vereecken, E.; Van Gelder, L.; Janssen, H.; Roels, S. Interior insulation for wall retrofitting—A probabilistic analysis of energy savings and hygrothermal risks. Energy Build. 2015, 89, 231–244. [Google Scholar] [CrossRef]
- Zender-Swiercz, E.; Telejko, M. Impact of Insulation Building on the Work of Ventilation. Procedia Eng. 2016, 161, 1731–1737. [Google Scholar] [CrossRef][Green Version]
- Ayikoe Tettey, U.Y.; Gustavsson, L. Energy savings and overheating risk of deep energy renovation of a multi-storey residential building in a cold climate under climate change. Energy 2020, 202, 117578. [Google Scholar] [CrossRef]
- Barbosa, G.; Almeida, M. Strategies for Implementing and Scaling Renovation Passports: A Systematic Review of EU Energy Renovation Policies. Sustainability 2025, 17, 2289. [Google Scholar] [CrossRef]
- Ferrantelli, A.; Kurnitski, J. Energy Performance Certificate Classes Rating Methods Tested with Data: How Does the Application of Minimum Energy Performance Standards to Worst-Performing Buildings Affect Renovation Rates, Costs, Emissions, Energy Consumption? Energies 2022, 15, 7552. [Google Scholar] [CrossRef]
- Monfils, S.; Hauglustaine, J.-M. Introduction of Behavioral Parameterization in the EPC Calculation Method and Assessment of Five Typical Urban Houses in Wallonia, Belgium. Sustainability 2016, 8, 1205. [Google Scholar] [CrossRef]
- Sesana, M.M.; Salvalai, G.; Della Valle, N.; Melica, G.; Bertoldi, P. Towards harmonising energy performance certificate indicators in Europe. J. Build. Eng. 2024, 95, 110323. [Google Scholar] [CrossRef]
- Coyne, B.; Denny, E. Mind the Energy Performance Gap: Testing the accuracy of building Energy Performance Certificates in Ireland. Energy Effic. 2021, 14, 57. [Google Scholar] [CrossRef] [PubMed]
- Bertini, A.; Al-Obaidy, M.; Dasse, M.; Amaripadath, D.; Gobbo, E.; Attia, S. Parametrization of variables affecting the whole life carbon performance of nearly zero energy residential building renovation. Build. Environ. 2025, 278, 113013. [Google Scholar] [CrossRef]
- Jo, K.; Wang, S. Development of an Indicator-Based Framework for a Sustainable Building Retrofit. Buildings 2025, 15, 3191. [Google Scholar] [CrossRef]
- Mirabella, N.; Röck, M.; Ruschi Mendes SAADE, M.; Spirinckx, C.; Bosmans, M.; Allacker, K.; Passer, A. Strategies to Improve the Energy Performance of Buildings: A Review of Their Life Cycle Impact. Buildings 2018, 8, 105. [Google Scholar] [CrossRef]
- Speccher, A.; Bruni, E. The Green Energy Audit, a new procedure for the sustainable auditing of existing buildings integrated with the LEED Protocols. Sustain. Cities Soc. 2012, 3, 54–65. [Google Scholar] [CrossRef]
- Haavik, T.; Mlecnik, E.; Rødsjø, A. From Demonstration Projects to Volume Market of Sustainable Construction. Energy Procedia 2012, 30, 1411–1421. [Google Scholar] [CrossRef]
- Pellegrino, M. Les acteurs du bâtiment face au défi de la massification de la rénovation énergétique très performante: Le cas de la démarche Energiesprong aux Pays-Bas et en France. Rev. Int. D’urbanisme 2019, 8. [Google Scholar] [CrossRef]
- Lihtmaa, L.; Kalamees, T. Emerging renovation strategies and technical solutions for mass-construction of residential districts built after World War II in Europe. Energy Strategy Rev. 2024, 51, 101282. [Google Scholar] [CrossRef]
- Civiero, P.; Pascual, J.; Arcas Abella, J.; Bilbao Figuero, A.; Salom, J. PEDRERA. Positive Energy District Renovation Model for Large Scale Actions. Energies 2021, 14, 2833. [Google Scholar] [CrossRef]
- Papantonis, D.; Tzani, D.; Burbidge, M.; Stavrakas, V.; Bouzarovski, S.; Flamos, A. How to improve energy efficiency policies to address energy poverty? Literature and stakeholder insights for private rented housing in Europe. Energy Res. Soc. Sci. 2022, 93, 102832. [Google Scholar] [CrossRef]
- Rose, J.; Thomsen, K.E.; Domingo-Irigoyen, S.; Bolliger, R.; Venus, D.; Konstantinou, T.; Mlecnik, E.; Almeida, M.; Barbosa, R.; Terés-Zubiaga, J.; et al. Building renovation at district level—Lessons learned from international case studies. Sustain. Cities Soc. 2021, 72, 103037. [Google Scholar] [CrossRef]
- Triantafyllopoulos, N. Investigating Energy Renovation of Multi-Owner Buildings and Real Estate Market Issues in a Degraded Greek Urban Area. Sustainability 2024, 16, 2903. [Google Scholar] [CrossRef]
- Bertoldi, P.; Boza-Kiss, B.; Della Valle, N.; Economidou, M. The role of one-stop shops in energy renovation—A comparative analysis of OSSs cases in Europe. Energy Build. 2021, 250, 111273. [Google Scholar] [CrossRef]
- Gepts, B.; Nuyts, E.; Verbeeck, G. Where is the potential for deep (energy) renovations? A large-scale study of the renovation activities of Belgian households between 2018 and 2022. Energy Build. 2025, 328, 115150. [Google Scholar] [CrossRef]
- Pérez-Navarro, J.; Bueso, M.C.; Vázquez, G. Drivers of and Barriers to Energy Renovation in Residential Buildings in Spain—The Challenge of Next Generation EU Funds for Existing Buildings. Buildings 2023, 13, 1817. [Google Scholar] [CrossRef]
- Dubois, M.; Allacker, K. Energy savings from housing: Ineffective renovation subsidies vs. efficient demolition and reconstruction incentives. Energy Policy 2015, 86, 697–704. [Google Scholar] [CrossRef]
- Ebrahimigharehbaghi, S.; Qian, Q.K.; de Vries, G.; Visscher, H.J. Identification of the behavioural factors in the decision-making processes of the energy efficiency renovations: Dutch homeowners. Build. Res. Inf. 2022, 50, 369–393. [Google Scholar] [CrossRef]
- Wang, Y.; Hirvonen, J.; Qu, K.; Jokisalo, J.; Kosonen, R. The Impact of Energy Renovation on Continuously and Intermittently Heated Residential Buildings in Southern Europe. Buildings 2022, 12, 1316. [Google Scholar] [CrossRef]
- Galvin, R.; Sunikka-Blank, M. Quantification of (p)rebound effects in retrofit policies—Why does it matter? Energy 2016, 95, 415–424. [Google Scholar] [CrossRef]
- Mlecnik, E.; Hilderson, W.; Cre, J.; Desmidt, I.; Uyttebroeck, R.; Van Den Abeele, S.; Van Quathem, A.; Vandaele, L.; Delem, L.; Dobbels, F.; et al. Low Energy Housing Retrofit (LEHR), Final Report; Belgian Science Policy: Brussels, Belgium, 2010; Available online: https://www.belspo.be/belspo/organisation/publ/pub_ostc/P2/rappP2-06_en.pdf (accessed on 30 November 2025).
- Seebauer, S. The psychology of rebound effects: Explaining energy efficiency rebound behaviours with electric vehicles and building insulation in Austria. Energy Res. Soc. Sci. 2018, 46, 311–320. [Google Scholar] [CrossRef]
- Fanghella, V.; Guetlein, M.-C.; Schleich, J.; Sebi, C. Preferences on financing mechanisms for thermal retrofit measures in multi-owner buildings: A discrete choice experiment with landlords and owner-occupiers in France. Resour. Energy Econ. 2023, 74, 101392. [Google Scholar] [CrossRef]
- Bird, S.; Hernández, D. Policy options for the split incentive: Increasing energy efficiency for low-income renters. Energy Policy 2012, 48, 506–514. [Google Scholar] [CrossRef]
- Melvin, J. The split incentives energy efficiency problem: Evidence of underinvestment by landlords. Energy Policy 2018, 115, 342–352. [Google Scholar] [CrossRef]
- Müller, A.; Hummel, M.; Smet, K.; Grabner, D.; Litschauer, K.; Imamovic, I.; Özer, F.E.; Kranzl, L. Why renovation obligations can boost social justice and might reduce energy poverty in a highly decarbonised housing sector. Energy Policy 2024, 191, 114168. [Google Scholar] [CrossRef]
- Meyer, S.; Laurence, H.; Bart, D.; Middlemiss, L.; Maréchal, K. Capturing the multifaceted nature of energy poverty: Lessons from Belgium. Energy Res. Soc. Sci. 2018, 40, 273–283. [Google Scholar] [CrossRef]
- Bartiaux, F.; Day, R.; Lahaye, W. Energy Poverty as a Restriction of Multiple Capabilities: A Systemic Approach for Belgium. J. Hum. Dev. Capab. 2021, 22, 270–291. [Google Scholar] [CrossRef]
- Maxim, A.; Mihai, C.; Apostoaie, C.-M.; Popescu, C.; Istrate, C.; Bostan, I. Implications and Measurement of Energy Poverty across the European Union. Sustainability 2016, 8, 483. [Google Scholar] [CrossRef]
- Economidou, M. Energy Efficiency Upgrades in Multi-Owner Residential Buildings: Review of Governance and Legal Issues in 7 EU Member States; European Commission: Ispra, Italy, 2018; Available online: https://publications.jrc.ec.europa.eu/repository/bitstream/JRC110289/energy_efficiency_upgrades_in_multiowner_apartment_buildings_final.pdf (accessed on 21 December 2025).
- Kim, H.; Lamichhane, N.; Kim, C.; Shrestha, R. Innovations in Building Diagnostics and Condition Monitoring: A Comprehensive Review of Infrared Thermography Applications. Buildings 2023, 13, 2829. [Google Scholar] [CrossRef]
- Kirimtat, A.; Krejcar, O. A review of infrared thermography for the investigation of building envelopes: Advances and prospects. Energy Build. 2018, 176, 390–406. [Google Scholar] [CrossRef]
- Kylili, A.; Fokaides, P.A.; Christou, P.; Kalogirou, S.A. Infrared thermography (IRT) applications for building diagnostics: A review. Appl. Energy 2014, 134, 531–549. [Google Scholar] [CrossRef]
- Lucchi, E. Applications of the infrared thermography in the energy audit of buildings: A review. Renew. Sustain. Energy Rev. 2018, 82, 3077–3090. [Google Scholar] [CrossRef]
- Martin, M.; Chong, A.; Biljecki, F.; Miller, C. Infrared thermography in the built environment: A multi-scale review. Renew. Sustain. Energy Rev. 2022, 165, 112540. [Google Scholar] [CrossRef]
- Tardy, F. A review of the use of infrared thermography in building envelope thermal property characterization studies. J. Build. Eng. 2023, 75, 106918. [Google Scholar] [CrossRef]
- Bitelli, G.; Conte, P.; Csoknyai, T.; Franci, F.; Girelli, V.A.; Mandanici, E. Aerial Thermography for Energetic Modelling of Cities. Remote Sens. 2015, 7, 2152–2170. [Google Scholar] [CrossRef]
- Videras Rodríguez, M.; Gómez Melgar, S.; Andújar Márquez, J.M. Evaluation of aerial thermography for measuring the thermal transmittance (U-value) of a building façade. Energy Build. 2024, 324, 114874. [Google Scholar] [CrossRef]
- Anselmo, S.; Boccardo, P.; Corgnati, S.P.; Ferrara, M. Integration of aerial thermography and energy performance certificates for the estimation of energy consumption in cities. Energy Build. 2025, 336, 115644. [Google Scholar] [CrossRef]
- El Masri, Y.; Rakha, T. A scoping review of non-destructive testing (NDT) techniques in building performance diagnostic inspections. Constr. Build. Mater. 2020, 265, 120542. [Google Scholar] [CrossRef]
- Shariq, M.H.; Hughes, B.R. Revolutionising building inspection techniques to meet large-scale energy demands: A review of the state-of-the-art. Renew. Sustain. Energy Rev. 2020, 130, 109979. [Google Scholar] [CrossRef]
- Shu, L.; Yeganeh, A.; Zhao, D. Large Language Models for Building Energy Retrofit Decision-Making: Technical and Sociotechnical Evaluations. Buildings 2025, 15, 4081. [Google Scholar] [CrossRef]
- Walter, I.; Tanasković, M.; Stanković, M. IR Building Analysis with Extraction of Elements Using Image Segmentation and RetinaNet. Buildings 2023, 13, 109. [Google Scholar] [CrossRef]
- García-Peralo, E.; Rodríguez-Martín, M.; Rodríguez-Gonzálvez, P. Thermography and Lighting Systems Methodology to Promote Sustainability and Energy Efficiency Awareness. Sustainability 2025, 17, 7196. [Google Scholar] [CrossRef]
- Hawas, A.; Al-Habaibeh, A. An innovative approach towards enhancing energy conservation in buildings via public engagement using DIY infrared thermography surveys. Energy Built Environ. 2022, 3, 1–15. [Google Scholar] [CrossRef]
- Zou, P.X.W.; Xu, X.; Sanjayan, J.; Wang, J. A mixed methods design for building occupants’ energy behavior research. Energy Build. 2018, 166, 239–249. [Google Scholar] [CrossRef]
- Venkatesh, V.; Brown, S.A.; Bala, H. Bridging the Qualitative-Quantitative Divide: Guidelines for Conducting Mixed Methods Research in Information Systems. MIS Q. 2013, 37, 21–54. [Google Scholar]
- Ruellan, G.; Attia, S. Neighborhood-Scale Mixed-Methods Dataset for Household Energy Renovation Analysis; Springer: Berlin/Heidelberg, Germany, 2025; Available online: https://orbi.uliege.be/handle/2268/338900 (accessed on 23 December 2025).
- Wang, W.; Rothschild, D.; Goel, S.; Gelman, A. Forecasting elections with non-representative polls. Int. J. Forecast. 2015, 31, 980–991. [Google Scholar] [CrossRef]
- Gailing, L.; Naumann, M. Using focus groups to study energy transitions: Researching or producing new social realities? Energy Res. Soc. Sci. 2018, 45, 355–362. [Google Scholar] [CrossRef]
- Hauglustaine, J.-M.; Monfils, S. Réno2020: Etude Énergétique et Typologique du Parc Résidentiel Wallon en Vue D’en Dégager des Pistes de Rénovation Prioritaires; Service Public de Wallonie: Namur, Belgium, 2013; Available online: https://orbi.uliege.be/bitstream/2268/247669/1/ULg_Rapport_EtudeTypologies.pdf (accessed on 13 March 2024).
- Service Public de Wallonie. Patrimoine; Géoportail de la Wallonie: Namur, Belgium, 2026; Available online: https://geoportail.wallonie.be/walonmap (accessed on 20 January 2026).
- Ruelle, C.; Marique, A.-F.; Reiter, S.; Teller, J. Les projets SUN et SOLEN: Soutenir la régénération durable des quartiers. In Proceedings of the HERA Awards 2013, Brussels, Belgium, 18–19 November 2013; Available online: http://orbi.ulg.be/handle/2268/148846 (accessed on 25 November 2015).
- Dodge, N.; Chapman, R. Investigating recruitment and completion mode biases in online and door to door electronic surveys. Int. J. Soc. Res. Methodol. 2018, 21, 149–163. [Google Scholar] [CrossRef]
- Gilljam, M.; Granberg, D. Should We Take Don’t Know for an Answer? Public Opin. Q. 1993, 57, 348–357. [Google Scholar] [CrossRef]
- Jebb, A.T.; Ng, V.; Tay, L. A review of key Likert scale development advances: 1995–2019. Front. Psychol. 2021, 12, 637547. [Google Scholar] [CrossRef]
- Fink, A.; Litwin, M.S. How to Measure Survey Reliability and Validity; Sage: Thousand Oaks, CA, USA, 1995; Volume 7, Available online: https://books.google.com/books?hl=fr&lr=&id=LGWLEJ-Yxk0C&oi=fnd&pg=PP9&dq=survey+reliability&ots=rtYWgPbaVv&sig=GpcXo1zeTnNlBKUpgq44N9saqpk (accessed on 22 January 2026).
- Revilla, M.; Höhne, J.K. How long do respondents think online surveys should be? New evidence from two online panels in Germany. Int. J. Mark. Res. 2020, 62, 538–545. [Google Scholar] [CrossRef]
- Attia, S.; Garat, S.; Cools, M. Development and validation of a survey for well-being and interaction assessment by occupants in office buildings with adaptive facades. Build. Environ. 2019, 157, 268–276. [Google Scholar] [CrossRef]
- ISO 6781-1:2023; Performance of Buildings—Detection of Heat, Air and Moisture Irregularities in Buildings by Infrared Methods—Part 1: General Procedures. General Procedures: Geneva, Switzerland, 2023. Available online: https://www.iso.org/standard/79848.html (accessed on 10 July 2024).
- UNE EN 13187:1998; Thermal Performance of Buildings—Qualitative Detection of Thermal Irregularities in Building Envelopes—Infrared Method (ISO 6781:1983 modified). AENOR: Madrid, Spain, 2024. Available online: https://www.en-standard.eu/une-en-13187-1998-thermal-performance-of-buildings-qualitative-detection-of-thermal-irregularities-in-building-envelopes-infrared-method-iso-6781-1983-modified/ (accessed on 10 July 2024).
- Institut Royal de Météorologie. Synoptic Observations—Bierset Station; Institut Royal de Météorologie: Uccle, Belgium, 2025; Available online: https://opendata.meteo.be/ (accessed on 10 October 2025).
- UNIC. The European University of Cities in Post-Industrial Transition: Mission Statement; UNIC: Rotterdam, The Netherlands, 2025; Available online: https://unic.eu/storage/app/media/35903_UNIC_Mission_Statement_3.pdf (accessed on 5 October 2025).
- Wilkinson, S. Focus group methodology: A review. Int. J. Soc. Res. Methodol. 1998, 1, 181–203. [Google Scholar] [CrossRef]
- Nyumba, T.O.; Wilson, K.; Derrick, C.J.; Mukherjee, N. The use of focus group discussion methodology: Insights from two decades of application in conservation. Methods Ecol. Evol. 2018, 9, 20–32. [Google Scholar] [CrossRef]
- Stockemer, D. Univariate Statistics. In Quantitative Methods for the Social Sciences; Springer International Publishing: Cham, Switzerland, 2019; pp. 73–99. [Google Scholar] [CrossRef]
- Everitt, B.S. The Analysis of Contingency Tables; CRC Press: Boca Raton, FL, USA, 1992; Available online: https://books.google.com/books?hl=fr&lr=&id=aSe1LbYz3v0C&oi=fnd&pg=PP11&dq=contingency+table&ots=HWowITxJx8&sig=oDk9kOEOuK3iOVBp5TMfQjXy2CU (accessed on 26 October 2025).
- Backhaus, K.; Erichson, B.; Gensler, S.; Weiber, R.; Weiber, T. Contingency Analysis. In Multivariate Analysis: An Application-Oriented Introduction; Backhaus, K., Erichson, B., Gensler, S., Weiber, R., Weiber, T., Eds.; Springer Fachmedien: Wiesbaden, Germany, 2025; pp. 359–386. [Google Scholar] [CrossRef]
- Donkoh, S.; Mensah, J. Application of triangulation in qualitative research. J. Appl. Biotechnol. Bioeng. 2023, 10, 6–9. [Google Scholar] [CrossRef]
- Brutus, S.; Aguinis, H.; Wassmer, U. Self-Reported Limitations and Future Directions in Scholarly Reports. J. Manag. 2012, 39, 48–75. [Google Scholar] [CrossRef]


Disclaimer/Publisher’s Note: The statements, opinions and data contained in all publications are solely those of the individual author(s) and contributor(s) and not of MDPI and/or the editor(s). MDPI and/or the editor(s) disclaim responsibility for any injury to people or property resulting from any ideas, methods, instructions or products referred to in the content. |
© 2026 by the authors. Licensee MDPI, Basel, Switzerland. This article is an open access article distributed under the terms and conditions of the Creative Commons Attribution (CC BY) license.