Abstract
To investigate the effects of mixed forests on soil bacterial characteristics in the Yellow River Delta, pure forests of Ailanthus altissima, Ulmus pumila, Robinia pseudoacacia, and Fraxinus velutina (hereafter Aa, Up, Rp, and Fv, respectively) and mixed forests of Aa-Rp, Up-Rp, Fv-Rp, and Ma (Melia azedarach)-Fv were selected as the research objects. High-throughput sequencing technology was employed to analyze the structure, diversity, and function of bacterial communities in this region. The results showed that Acidobacteria, Proteobacteria, and Actinobacteria were the dominant microbial groups. The relative abundance of Acidobacteria was reduced by mixed patterns of Up-Rp, Fv-Rp and Ma-Fv, and the abundance of Proteobacteria was increased in Ma-Fv. The Chao1, ACE and Shannon indices of Aa-Rp and Fv-Rp were increased, while the Chao1 and ACE indices of Up-Rp and Ma-Fv were decreased. Functional prediction revealed that chemoheterotrophic and aerobic chemoheterotrophic bacteria had the highest abundance, with mixed forests exerting variable effects on different functional bacterial groups. In conclusion, mixed forest management exerts a significant influence on shaping bacterial community structure, regulating its diversity, and facilitating the directional enrichment of functional bacteria, which is conducive to enhancing the stability and sustainability of plantations.
1. Introduction
Soil salinization is a severe global ecological problem with an ongoing expansion trend, which can significantly hinder the growth and development process of plants and reduce crop productivity [1,2]. The Yellow River Delta is one of the typical distribution areas of coastal saline–alkali soils in China, characterized by high groundwater mineralization, poor soil quality, and extensive salinization, all of which contribute to its ecological fragility [3,4]. Artificial forest establishment in saline–alkali areas serves as a critical approach to vegetation restoration of degraded ecosystems, which exhibits great application value in improving the natural environment and enhancing ecosystem services, such as soil and water conservation, saline soil improvement, and biodiversity protection [5]. Implementing forest conservation measures can effectively improve vegetation parameters and increase biomass and carbon storage, thereby strengthening the long-term resilience of ecosystems and facilitating the achievement of climate mitigation targets [6]. To optimize the ecological environment, large-scale plantations were built in the Yellow River Delta in the 1980s, and the main cultivated species include Ailanthus altissima, Ulmus pumila, Robinia pseudoacacia, Fraxinus velutina, Melia azedarach, etc. However, with long-term development, plantations dominated by a single tree species have encountered several issues, such as dieback of some trees, low forest productivity, and frequent occurrence of degradation, leading to a declining trend in ecosystem service functions [7]. The ecological practice of establishing artificial forests in saline–alkali areas still faces numerous global challenges. Exploring an artificial forest management model that meets the demands of ecological security and economic development is a core issue in the Yellow River Delta.
Soil is a vital component of forest ecosystems, influencing productivity and ecological health [8]. Bacteria are closely linked to soil health; they play a crucial role in the cycling of soil organic matter and regulate many ecological processes [9]. As a taxon highly sensitive to environmental fluctuations, alterations in environmental factors drive shifts in the structure and diversity traits of soil bacterial communities. The addition of soil amendments or the cultivation of leguminous plants can alter the bacterial richness and diversity in moderately saline–alkali soils [10]. In agroecosystems, long-term continuous cropping decreases the diversity of soil bacterial and fungal communities and leads to the enrichment of plant pathogens [11]. In contrast, in forest ecosystems, the active bacterial communities fostered by mixed forests are closely correlated with superior ecosystem stability, productivity, and service efficiency [12]. This comparison highlights the significant value of optimizing soil microbial conditions for maintaining ecosystem health and function. Soil microbial functional regulation mediated by vegetation is a research hotspot in global ecological studies. Existing studies have confirmed that vegetation growth and mountain forest restoration can effectively drive changes in soil microbial functions [13,14]. Against this background, this study explored the interaction mechanism between the mixed planting pattern of artificial forests and soil bacterial functions in saline–alkali areas, aiming to clarify the application value of this forest management pattern in ecological improvement of saline–alkali soils.
With the rational arrangement of various tree species, mixed forests develop diverse combinations that strengthen community structural complexity and functional redundancy [15,16] while systematically compensating for the inherent limitations of pure stands in ecological functions, stress resilience, and sustained productivity [17,18]. Therefore, the mixed forest management pattern has attracted increasing global attention [19,20]. Many studies confirm that mixed planting optimizes soil physicochemical properties and facilitates the healthy growth of plants. The mixture of Cunninghamia lanceolata and Schima superba could increase the content of soil nutrients, which was an effective measure to alleviate the decline in soil fertility in C. lanceolata plantations [21]. Through the establishment and evaluation of a global matched dataset for single-species and multispecies plantations, a study revealed that mixed forests remarkably enhance trees’ healthy growth level and forest productivity, exhibiting obvious advantages in key growth indicators such as average tree height, diameter at breast height (DBH), and above-ground biomass [22]. In addition, mixed cropping can increase yields and belowground biomass and strengthen ecosystem service functions. Converting monocultures into mixed stands of Fagus sylvatica L. and Abies alba Mil. in low mountain regions like the Black Forest can enhance a forest’s resistance to climate change-related extreme events, such as droughts and storms, thereby ensuring the sustainable provision of ecosystem services [23]. A mixed forest of Fraxinus mandshurica and Larix olgensis had elevated soil organic matter content and enhanced microbial community diversity [24]. Therefore, the establishment of mixed forests constitutes an effective approach to enhancing ecosystem functions and achieving sustainable development [18].
The Yellow River Delta is subject to special environmental filtering pressure, with the management and improvement of saline–alkali land as one of its core ecological issues [25]. Numerous scholars have conducted extensive studies on soil ecological characteristics and biological community structure in this region, yielding abundant research findings [4,26,27]. Ma et al. explored microbial biomass and community composition in the context of wetland restoration via freshwater introduction [28]. Liu et al. analyzed the responses of vegetation growth and soil properties to thinning management in artificial forests [29]. However, in-depth studies focusing on the mixed management of artificial forests in this region, especially the differences in the impact of various mixed patterns on soil bacterial communities and their functions, remain relatively scarce. Given the extensive application potential of mixed forests in global ecological restoration, this study puts forward the following hypotheses: mixed management can achieve the goal of improving the ecosystem in saline–alkali areas by (1) altering the soil bacterial community structure and increasing species richness and (2) indirectly regulating soil bacterial functional gene expression by improving the physicochemical properties of soils. High-throughput sequencing was employed to investigate two forest management models (pure forests and mixed forests) and examine the responses of soil bacterial community structure, diversity, and functions to mixed plantation practices. The findings of this study will help to clarify whether mixed forests enhance the sustainability of forest ecosystems by optimizing soil bacterial communities, exploring optimal mixed planting strategies, and providing scientific guidance for the sustainable development of forestry.
2. Materials and Methods
2.1. Overview of the Study Area
The experimental field site is located in Hekou District, Dongying City, Shandong Province (118°39′–119°8′ E, 37°47′–37°84′ N), covering an area of about 2366.7 hm2. The area is located on the north side of the estuary of the Yellow River, facing the Bohai Sea in the east and north, and features the typical topography of the Yellow River Delta. It belongs to the warm temperate monsoon continental climate with four distinct seasons. The mean annual sunshine hours are 2812.6 h, the mean annual temperature is 13.1 °C, and the mean annual precipitation is 554.6 mm. Due to the invasion of the tide, high groundwater level and mineralization, this area is susceptible to secondary salinization. The predominant soil types are classified as fluvo-aquic soils and saline soils [25]. In 1985, the Gudao plantation was built on a forest area of 100,000 acres, with the tree species dominated by R. pseudoacacia, as well as U. pumila, F. velutina, M. azedarach, etc.
2.2. Sample Collection and Processing
2.2.1. Sampling Method
The experiment was conducted in the Gudao plantation in October 2022. The experimental forest was planted in 1985, with the mixed forest configured in an inter-row mixing arrangement. Eight experimental plots with uniform terrestrial conditions were selected, including 4 pure forest plots of Ailanthus altissima, Ulmus pumila, Robinia pseudoacacia and Fraxinus velutina, which were denoted as Aa, Up, Rp and Fv, respectively, and 4 mixed forest plots of A. altissima–R. pseudoacacia, U. pumila–R. pseudoacacia, F. velutina–R. pseudoacacia and Melia azedarach–F. velutina, which were denoted as Aa-Rp, Up-Rp, Fv-Rp and Ma-Fv, respectively. Stand information of the plots is presented in Table 1. In each of the above 8 forest stands, three 20 m × 20 m standard plots were established. At three repeat sampling points, surface vegetation debris was first cleared. Then, using the S-shaped sampling method, five sub-samples of topsoil (0–20 cm) were collected from each plot. These were thoroughly mixed to obtain representative topsoil samples, with a total of 24 samples collected. Each homogenized sample was divided into two portions: one stored at −80 °C for soil bacterial analysis, and the other air-dried naturally, sieved through a 2 mm mesh, and then used to analyze soil physicochemical properties.

Table 1.
Basic information on forest stands.
2.2.2. Determination of Soil Physicochemical Properties
Soil pH was determined using the potentiometric method (water-to-soil ratio of 1:2.5). Soil electrical conductivity (EC) was determined by the conductance method. Deionized water was added at a soil-to-water ratio of 1:5 (w/v), followed by shaking for 30 min and subsequent standing. The supernatant was collected to measure the electrical conductivity with a conductivity meter. Soil bulk density (BD) was measured using the ring knife method. Soil organic matter (SOM) content was determined by the potassium dichromate oxidation–external heating method [30]. The total nitrogen (TN) was analyzed by the Kjeldahl method, and the total phosphorus (TP) was measured by the NaOH fusion–molybdenum–antimony colorimetric method [31].
The physicochemical properties of the soil at the sampling points are shown in Table 2.
Table 2.
Physicochemical properties of soil samples.
2.2.3. Soil Bacterial DNA Extraction and Sequencing
The extraction of DNA and the sequencing of the 16S rRNA gene amplicon were entrusted to Beijing Novogene Technology Co., Ltd. (Beijing, China). Genomic DNA was extracted from each sample using the CTAB method [32]. All gene amplifications were performed in a 50 μL reaction system, consisting of 5.0 μL of 10 × PCR buffer, 5.0 μL of dNTP mixture (10 mmol·L−1), 0.5 μL of Taq polymerase (2.5 U), 2.5 μL each of forward and reverse primers (2.5 μmol·L−1), 5.0 μL of template DNA (20–30 ng), and 30.5 μL of double-distilled water (ddH2O). A no-template control without template DNA was included to exclude potential contamination. Before conducting PCR amplification, the annealing temperature was optimized in a gradient manner. The Tm values of the target primers were calculated using Primer Premier 6.0 software, and a gradient annealing temperature range of ±5 °C was set based on these values. The remaining reaction systems remained consistent for gradient PCR amplification. The amplified products were detected by 1.5% agarose gel electrophoresis (120 V, 25 min), and the annealing temperature range with clear target bands, no obvious non-specific bands, or primer dimers was screened out. The candidate temperatures were further verified by three replicate PCR amplifications, and 55 °C was finally determined as the optimal annealing temperature for the formal amplification. The PCR amplification program was: pre-denaturation at 94 °C for 3 min, followed by 30 cycles (each cycle consisted of denaturation at 94 °C for 30 s, annealing at 55 °C for 30 s, and extension at 72 °C for 1 min), and a final extension at 72 °C for 5 min. The amplified fragment of the 16S rDNA gene was 1.5 kb, and that of the nifH gene was 780 bp. The purity and concentration of DNA were detected by agarose gel electrophoresis; then, the appropriate amount of sample was taken in a centrifuge tube, and the sample was diluted to 1 ng/μL with sterile water. Using diluted genomic DNA as a template, New England Biolabs’ Phusion® High-Fidelity PCR Master Mix was employed with GC Buffer. PCR was performed with a highly efficient and high-fidelity enzyme to ensure amplification efficiency and accuracy. PCR amplification was performed using barcode-tagged primers targeting the 16S V4 region: 515F (5′-GTGCCAGCMGCCGCGGTAA-3′)–806R (5′-CCGTCAATTCCTTTGAGTTT-3′). PCR products were mixed at equal concentrations and then detected by 2% agarose gel electrophoresis for homogeneity verification and accurate screening of target-length amplification fragments. Qualified products were purified and recovered using a Thermo Scientific GeneJET Gel Purification Kit (Thermo Fisher Scientific, Waltham, MA, USA) combined with magnetic bead purification. The concentrations of the final purified PCR products were controlled to meet the following quality control criteria: ≥20 ng/μL, with a single sample volume of ≥20 μL (total mass ≥ 400 ng).
The library was constructed using a NEB Next® Ultra™ DNA Library Prep Kit (New England Biolabs, Ipswich, MA, USA) for Illumina, and the entire construction followed the official standard operating procedures of the kit to complete the entire process, which specifically included key steps such as end repair of PCR products, dA-tailing, sequencing adapter ligation, and product purification. The specific quality control criteria for the constructed libraries were as follows: the theoretical insert size was 400–450 bp, and the total library fragment size was 550 bp (including the Illumina standard sequencing adapters). The sequencing error rate threshold was set at an average sequencing error rate of less than 0.01%. Pre-quality control was conducted through the high-fidelity system of the kit before library loading, and the error rate of the first sequencing data was detected after loading. If the error rate exceeded the threshold, the library was re-prepared. The constructed library was subsequently subjected to Qubit fluorometric quantification and library quality assessment, and qualified libraries were sequenced on the MiSeq Sequencer after passing all relevant tests.
2.2.4. Sequencing Data Processing
Some interfering data were present in the raw sequencing data, so preprocessing was needed. Offline data were split into individual sample datasets by barcode sequences. Barcode and PCR amplification primer sequences were extracted. The two reads (R1 and R2) from raw paired-end reads were combined into a single longer contig using FLASH software (v1.2.11). This created the read sequences for each sample. After assembly, a quality filter retained only the qualified reads.
Raw Tags underwent QIIME 2 (version 2022.8) tag quality control processing to generate high-quality tag data (Clean Tags). The quality control workflow was as follows: Raw tag sequences were trimmed starting from the first low-quality base position. Trimming stopped when the number of consecutive low-quality bases reached the set threshold (default length = 3), with a default quality threshold ≤ 3. The trimmed tag dataset was further filtered to remove sequences where the length of consecutive high-quality bases was less than 75% of the total tag length. Common filtering criteria included: removing sequences with N bases > 1%; removing sequences with an average Q-value < 20; and removing sequences outside the specified length range (200–500 bp). The final tag sequences were then aligned against a gold-standard database to detect chimeric sequences, which were ultimately removed to yield the final Effective Tags.
The UPARSE algorithm (USEARCH v11) was used to cluster the quality-filtered and de-replicated sequences into Operational Taxonomic Units (OTUs) at a 97% identity threshold. The most abundant sequence of each OTU was extracted as the representative sequence and taxonomically classified with the RDP Classifier (version 2.11) based on the SILVA database, using a confidence threshold of 0.8. Sequences that could not be assigned with valid classification annotations were all classified into the “Others” category for subsequent analysis. The raw data were uploaded to the NCBI database (BioProject accession: PRJNA1328157).
After sequencing data were processed on the Illumina HiSeq platform, followed by sequence assembly, quality control, and chimera filtering, 53,607, 37,911, 22,930, 18,115, 25,949, 54,236, 30,964, and 23,146 effective Tags were obtained by Aa-Rp, Up-Rp, Fv-Rp, Ma-Fv, Aa, Up, Rp, and Fv, respectively. The rarefaction curve tended to be flat, indicating that the amount of sequencing data was reasonable, and more sequencing data contributed less to the discovery of new OTUs (Figure 1). All sequencing results achieved the desired result (effective rate ≥ 90%).
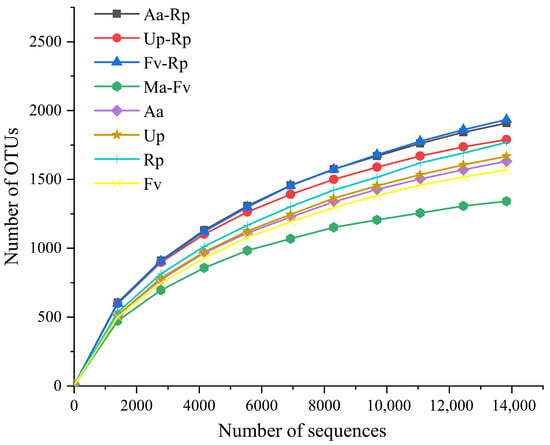
Figure 1.
Rarefaction curve analysis of OTUs. The termination criterion for the rarefaction curve is that the curve plateaus (the detected species number shows no significant increase with more sequencing reads and no obvious upward trend) and when the species discovery rate is ≥90% (the detected species account for over 90% of the sample’s potential total species).
2.3. Data Analysis
All sequencing data used for statistical analysis in this study were standardized using rarefaction to ensure data comparability and reliability (rarefaction is a random sampling without replacement process, where low-abundance taxa may be randomly excluded or show relative abundance biases due to extremely low initial reads). The sequencing data were first organized using Microsoft Excel 2016, followed by statistical analysis. The following analyses were performed using R software (Version 4.3.3). We conducted subsequent analyses with R packages ‘vegan’, ‘picante’, ‘ggplot2’, ‘doBy’, ‘ggalt’, ‘viridis’, ‘MASS’, and ‘dplyr’: generating rarefaction curves based on bacterial sequencing data; identifying differential indicator taxa of soil bacteria at the genus level; calculating α-diversity indices of bacterial communities; conducting principal coordinates analysis (PCoA) based on the Bray–Curtis distance to visualize and quantify differences in microbial community composition among different samples; performing redundancy analysis on soil environmental factors and bacterial community composition; and predicting bacterial community functions via the FAPROTAX method. Origin 2021 software was used to generate chord diagrams and heatmaps of relative abundances and perform one-way ANOVA on soil physicochemical properties and α-diversity indices, followed by Fisher’s least significant difference (LSD) test to detect significant differences between means at the significance level of p = 0.05.
3. Results
3.1. Analysis of Bacterial Community Structure
3.1.1. Relative Abundance Analysis at the Phylum Level
At the phylum level, the four mixed forests (Aa-Rp, Up-Rp, Fv-Rp and Ma-Fv) contained 30, 27, 28 and 30 phyla of bacteria, and the four pure forests (Aa, Up, Rp and Fv) contained 26, 28, 24 and 25 phyla of bacteria, respectively (Figure 2). Overall, mixed forest stands (except Up-Rp) increased the number of soil bacterial phyla. The three phyla Acidobacteria, Proteobacteria and Actinobacteria all had relative abundances exceeding 8%, accounting for 69% to 79% of the total abundance, thus representing the dominant taxa across all forest stands. The relative abundances of bacterial communities varied across different forest stands. Except for the mixed pattern of Aa-Rp, the other three mixed modes decreased the relative abundance of Acidobacteria. Ma-Fv significantly enhanced the relative abundance of the phyla Proteobacteria and Gemmatimonadetes. Up-Rp and Fv-Rp increased the abundance of Actinobacteria.
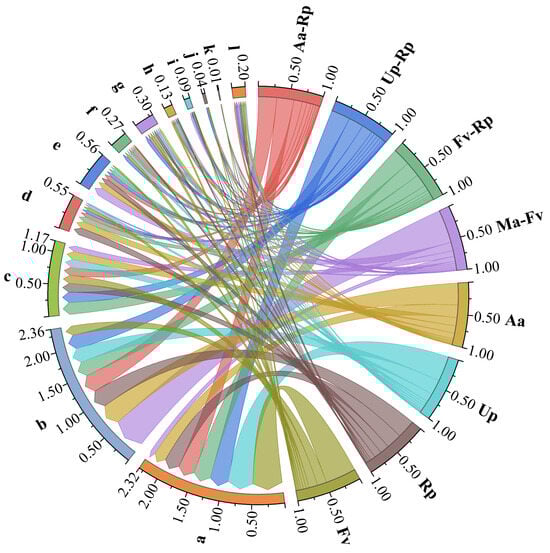
Figure 2.
Composition of bacterial communities at the phylum level. Note: a–l denote Acidobacteria, Proteobacteria, Actinobacteria, Nitrospirae, Gemmatimonadetes, Planctomycetes, Chloroflexi, Verrucomicrobia, Bacteroidetes, WS3, Firmicutes and Others, respectively. The segments of different colors on the circumference represent different groups (abbreviations of tree names) and categories (bacterial phyla represented by lowercase letters). The width of the colored ribbon connections between the segments reflects the association between different groups and categories (the wider the width, the greater the quantity involved).
3.1.2. Relative Abundance Analysis at the Genus Level
At the genus level, the four mixed forests (Aa-Rp, Up-Rp, Fv-Rp, and Ma-Fv) were clustered into 119, 109, 139, and 114 bacterial genera, and the four pure forests (Aa, Up, Rp, and Fv) were clustered into 95, 119, 113, and 105 bacterial genera, respectively (Figure 3). Overall, the forest mixtures (except Up-Rp) increased the number of soil bacterial genera. Among them, the relative abundance of Thermomonas, Rhodoplanes and Lysobacter bacterial groups was higher than 0.1%, which were the dominant microbial genera in the soil of the eight plantations. The mixed pattern of Aa-Rp increased the relative abundance of the genus DA101, Ma-Fv increased the relative abundance of the genus Lysobacter, and the relative abundance of the genus Thermomonas was decreased by the three mixed forests of R. pseudoacacia.
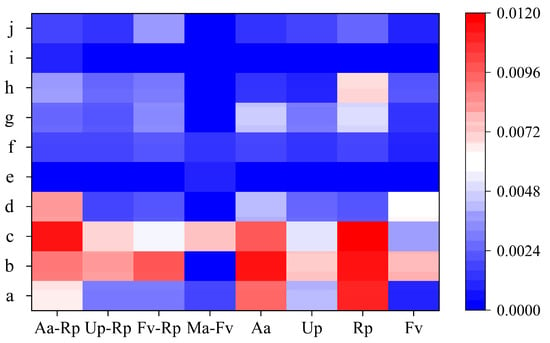
Figure 3.
Heatmap of bacterial community structures at the genus level. Note: a–j denote Thermomonas, Rhodoplanes, Lysobacter, DA101, Flavobacterium, Hydrogenophaga, Ramlibacter, Candidatus Nitrososphaera, KSA1 and Novosphingobium, respectively.
3.1.3. Identification of Differential Indicator Taxa of Soil Bacterial Genera
With the LDA threshold set at 1, a total of eight significantly differential bacterial genera were identified (Figure 4). The results showed that Kribbella and Streptomyces had high absolute loading values, suggesting that they played a key role in driving inter-group differences in community composition.
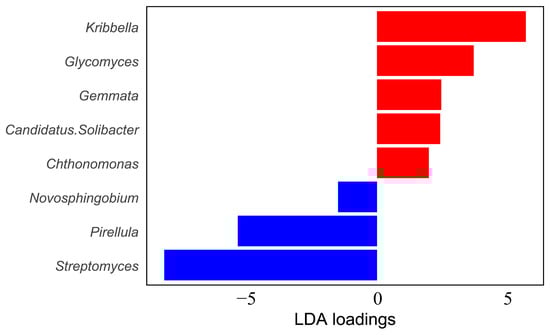
Figure 4.
Linear discriminant analysis of soil bacteria. Note: The larger the absolute value of the LDA loading, the stronger the ability of the taxon to distinguish between different forest stand groups.
3.2. Bacterial Diversity Analysis
3.2.1. Alpha Diversity Analysis
Compared with the pure forests, the mixed patterns of Aa-Rp and Fv-Rp increased the Chao1, ACE and Shannon indices, indicating that Aa-Rp and Fv-Rp could improve the diversity of soil bacterial communities (Table 3). Up-Rp and Ma-Fv decreased the Chao1 and ACE indices. All eight samples exhibited Simpson index values greater than 0.99, indicating a high evenness of the bacterial community. The observed species were between 1610 and 2850, and Fv-Rp had the highest number of observed species.
Table 3.
Analysis of alpha diversity of the bacterial community.
3.2.2. Beta Diversity Analysis
Based on 95% confidence intervals, principal coordinate analysis (PCoA) was used to determine bacterial diversity in different forest stands (Figure 5). Primary Coordinate 1 (PC1) accounted for 29.55% of the total variance, and PC2 explained 22.53%, with the two axes together contributing a cumulative 52.08% to the explanation of variations in sample composition. PC1 clearly distinguished Ma-Fv from the other forest stands, which was the main factor that caused the difference between the bacterial communities of Ma-Fv and the other forest stands. PC2 could distinguish Up from Up-Rp, indicating that the mixing of different tree species had a certain effect on bacterial communities.
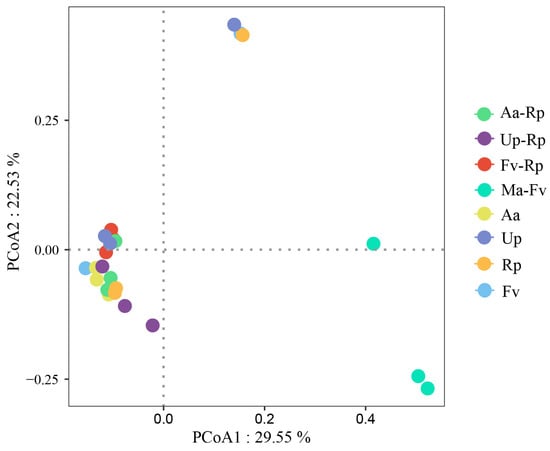
Figure 5.
Principal coordinate analysis (PCoA) of bacterial community structure calculated with Bray–Curtis distance. Note: A larger distance value indicates greater differences in the abundance of dominant species and significant dissimilarities in communities.
3.3. Correlation Analysis Between Soil Environmental Factors and Bacterial Community Composition
Redundancy analysis was conducted to assess the relationships between environmental factors of soil samples and bacterial phyla across the different forest stands (Figure 6). The first axis (RDA1) explained 78.4% of the total variance, while the second axis (RDA2) accounted for 13.7%, with a cumulative explanatory power exceeding 92%. The five soil physicochemical properties exhibited strong explanatory capacity for the variations in microbial community composition. SOM and BD were significantly positively correlated with RDA1 and RDA2, respectively, indicating that these factors exerted significant effects on the bacterial communities. The dominant phyla, Proteobacteria and Gemmatimonadetes, were primarily driven by SOM, whereas Acidobacteria showed a significant negative correlation with SOM. The Ma-Fv stand exhibited a high degree of dispersion from the other samples, and the ordination vector of the environmental factor EC pointed away from this sample point. Combined with the soil physicochemical properties presented in Table 1, it can be seen that the EC value of Ma-Fv was significantly lower than that of the pure forest.
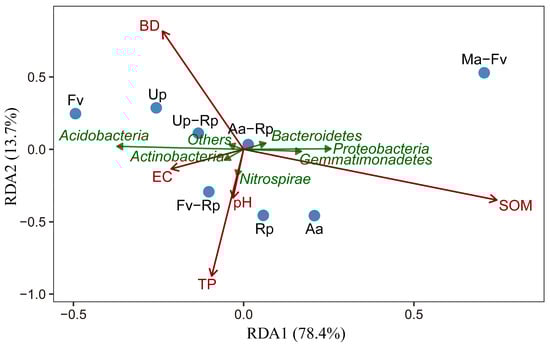
Figure 6.
Redundancy analysis between soil physicochemical properties and bacterial community composition. Note: Before conducting the redundancy analysis, multicollinearity screening was performed on the 6 measured soil environmental factors based on the variance inflation factor (VIF). The VIF values of each factor were calculated in RStudio (Version 4.3.3), with a threshold of VIF ≥ 10 used to identify severe multicollinearity, and the TN factor was excluded. Subsequently, the VIF values of the remaining factors were recalculated to confirm that all retained factors had a VIF < 5. These 5 factors that met the low multicollinearity criterion were incorporated into the subsequent RDA. Red arrows represent soil physicochemical factors; green arrows denote bacterial communities; blue dots indicate sample points. The spatial distribution of sample points reflects the similarity of community compositions as well as the filtering effects of environmental factors on them.
3.4. Bacterial Functional Prediction Analysis
The FAPROTAX database has established application precedents in numerous studies focusing on soil microorganisms in the saline–alkali soils of the Yellow River Delta [33,34]. This study was based on this database and conducted bacterial functional potential prediction and subsequent visualization analysis for the relatively abundant functional groups. The results indicated that the abundance of bacteria with annotated functional genes was higher in the mixed forests (except Up-Rp) than in the pure forests (Figure 7). Among all forest stands, bacteria with chemoheterotrophy and aerobic chemoheterotrophy functions were the most abundant, with abundance of 7.41–12.24% and 6.31–9.19%, respectively. Except for the mixed pattern of Aa-Rp, the other three mixed modes increased the abundance of these two functional types of bacteria. Ma-Fv suppressed the functional abundances of all human pathogens and human-associated groups. Overall, the four mixed patterns increased the abundance of functional bacteria, such as anaerobic chemoheterotrophy and fermentation, and decreased the abundance of functional bacteria, such as aerobic nitrite oxidation and nitrification.
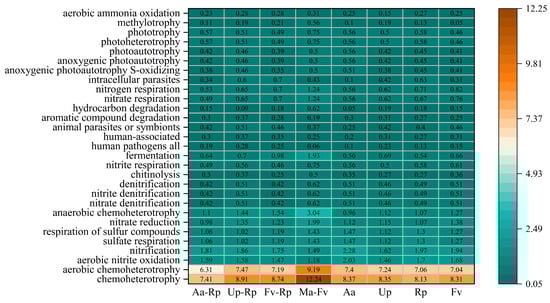
Figure 7.
Composition of bacterial community function predicted based on FAPROTAX. Note: The top 29 bacterial functions in terms of predicted abundance within the samples were classified into the six target functional modules. Carbon metabolism-related: chemoheterotrophy, aerobic chemoheterotrophy, anaerobic chemoheterotrophy, chitinolysis, aromatic compound degradation, hydrocarbon degradation, and fermentation. Nitrogen cycle-related: nitrification, aerobic nitrite oxidation, aerobic ammonia oxidation, nitrate reduction, nitrate denitrification, nitrite denitrification, denitrification, nitrate respiration, nitrogen respiration, and nitrite respiration. Sulfur cycle-related: sulfate respiration, respiration of sulfur compounds, anoxygenic photoautotrophy, and S-oxidizing. Host/environment interaction-related: all human pathogens, human-associated, animal parasites or symbionts, and intracellular parasites. Photosynthesis-related: anoxygenic photoautotrophy, photoautotrophy, photoheterotrophy, and phototrophy. Other specialized metabolism: methylotrophy.
4. Discussion
4.1. Mixed Plantation Changes Soil Bacterial Community Structure
Soil bacterial community structure varied among vegetation types, yet the phyla Acidobacteria, Proteobacteria and Actinobacteria consistently dominated all forest stands. This result aligns with the dominant microbial community composition observed in two forest types in the permafrost region of the Greater Xing’an Mountains [35], as well as with findings reporting soil microbiota responses to various soil management practices in 100-year-old agricultural fields [36]. Acidobacteria can degrade plant residues and participate in carbon metabolism [37,38]. Proteobacteria are involved in the carbon and nitrogen cycling processes of various organic compounds. Actinobacteria can degrade cellulose and aromatic compounds and have some preventive and curative effects on soil-borne diseases caused by long-term continuous cropping [39]. The persistent dominance of Acidobacteria, Proteobacteria, and Actinobacteria across all forest stands stems from their broad ecological amplitude [40], which buffers them against environmental fluctuations and enables them to thrive in soils worldwide as keystone taxa of most soil bacterial communities [41].
As oligotrophic bacteria, Acidobacteria exhibit a higher abundance in nutrient-deficient soils [42]. In this study, it was observed that the mixed forests of Up-Rp, Fv-Rp and Ma-Fv decreased the relative abundance of Acidobacteria. This may be ascribed to the mixed forests’ increased soil organic matter content, and Acidobacteria, as the dominant group, adjusted its abundance with the change in the soil environment, showing ecological disadvantages under nutrient enrichment conditions. Different from the other mixed patterns, the relative abundance of Acidobacteria increased in Aa-Rp, which was consistent with the findings of a study investigating bacterial community structure in Cunninghamia lanceolata–Betula luminifera mixed forests [43]. The reason could be the differences in the quantity and quality of litter and root exudates in different mixed forests, which provided heterogeneous nutrient substrates for bacteria [44], while different species of bacteria had preferences in the utilization of nutrients. Thus, forest composition was the key factor for the differential change trend in the abundance of Acidobacteria.
This study observed that Ma-Fv increased the abundance of the phylum Proteobacteria and the genus Lysobacter. Ma et al. found that the abundance of Proteobacteria increased during the successional process of artificial Pinus tabuliformis forests in Taiyue Mountain, and this change was significantly correlated with the accumulation of soil nitrogen [45]. This finding is consistent with this study. The results may be attributed to the mixed planting of M. azedarach and F. velutina, which could increase the content of soil nitrogen and easily decompose carbon, providing growth advantages for eutrophic bacteria such as Proteobacteria that prefer such carbon sources [46]. Many studies have shown that the genus Lysobacter can produce peptides with antimicrobial activity against bacteria and fungi, with prominent antagonistic effects on nematodes, pathogenic fungi and plant diseases [47,48], which indicates that the mixed pattern of Ma-Fv in this study enhanced the biological control function of the plantation to a certain extent. The result demonstrates that suitable mixed forests can inhibit the breeding of harmful organisms in the forest and help maintain the health of the plantation.
4.2. Mixed Plantation Affects Soil Bacterial Diversity
The diversity of bacteria can reflect the quality of soil and potentially impact soil ecological functions [49,50]. The mixed patterns of Aa-Rp and Fv-Rp could enhance the diversity of soil bacterial communities, consistent with previous observations that bacterial diversity was higher in Masson pine–Cinnamomum cassia mixed forests and Cunninghamia lanceolata mixed forests than in their respective pure forests [51,52]. This finding partially validates Hypothesis 1 that mixed-species forest management can increase the species diversity of bacterial communities, indicating that appropriate tree species mixing strategies contribute to sustaining a high level of soil microbial diversity. R. pseudoacacia can coexist with rhizobacteria for nitrogen fixation [53], thereby increasing the nitrogen content. Under nitrogen-enriched conditions, the strength of competition among bacterial communities for limited nutrient resources was reduced and survival pressure was alleviated, which increased the diversity of microbial communities [54]. In addition, compared with pure forests, the mixing of R. pseudoacacia with other tree species enriched the composition of litter and root exudates, which affected soil physicochemical properties and provided diverse nutrient substrates for a greater variety and number of bacteria [55].
Not all mixed planting patterns could enhance bacterial diversity; the effects of mixed patterns on soil bacteria were heterogeneous. Sawada et al. found that the bacterial diversity in a natural mixed forest was lower than in a pure forest of Cryptomeria japonica [56]. Similarly, the mixed pattern of Up-Rp reduced the Chao1 index and ACE index of soil bacteria in this study. Different mixed forest patterns drove divergent responses in bacterial diversity, showing both increases and decreases. This phenomenon may be due to the litter and root exudates of different mixed patterns showing specificity in chemical composition, physical structure and other characteristics, along with the distinct substrate preferences of bacterial communities [44]. Consequently, variations in tree species composition drive the bacterial community diversity to show different response modes. Apart from this, the leaf litter of U. pumila contains a variety of phenolic compounds [57], which can inhibit the growth of other plants, resulting in limited development of microbial diversity.
4.3. Mixed Plantation Regulates the Expression of Bacterial Functional Genes
The core functions of soil bacteria observed across all eight forests were identified as chemoheterotrophy and aerobic chemoheterotrophy, consistent with the results from salt-stressed rice rhizosphere in Hainan [58] and geyser fountain sediments in Chile [59]. As fundamental ecosystem functions shared by most microorganisms [60], these functional bacteria act as the key group driving carbon cycling [61]. Moreover, existing research has demonstrated that mixed patterns can regulate the proliferation of bacterial taxa associated with carbon and nitrogen cycles [46]. Here, three mixed patterns (except Aa-Rp) increased the abundances of bacteria with chemoheterotrophic and aerobic chemoheterotrophic functions, indicating that appropriate mixed patterns are conducive to enhancing the carbon cycling potential of forest ecosystems.
Forest mixed modes had various effects on the abundance of different functional bacteria; the expression of some functional genes was increased, while some were inhibited. In this study, four mixed modes could increase the abundance of bacteria with specific functional types, such as anaerobic chemoheterotrophy and fermentation. Prior studies on Pinus massoniana–Liquidambar formosana mixed forests and P. massoniana–Castanopsis hystrix mixed forests [62,63] have reported consistent results with the present study, which also provides supporting evidence for Hypothesis 2 that mixed management can regulate soil bacterial functional gene expression. This suggests that the mixed plantations may promote metabolic activities and the expression of functional genes in bacteria. The reason may be that mixed planting of various tree species fosters a diverse and complex soil microenvironment via their unique biological characteristics. This microenvironment is more conducive to the propagation and survival of specific functional bacteria and promotes the targeted increase in the expression of ecological function in the bacterial community [64,65]. The four mixed modes all reduced the abundance of bacteria with specific functional types, such as aerobic nitrite oxidation and nitrification. The presence and reproduction of pathogens in the soil environment have significant negative impacts on soil security and human health [66]. Ma-Fv exhibited a suppressive effect on the functional abundances of the all human pathogens group, indicating that this mixed pattern can inhibit pathogen proliferation and help mitigate the potential risks posed by soil-borne pathogens. The results indicated that the abundance of different functional types of bacteria showed inconsistent trends under the influence of mixed forests, and there should be a targeted selection of mixed patterns when constructing plantations.
4.4. Limitations and Future Research Perspectives
This study investigated the effects of plantation management mode on the bacterial community structure and functions in saline–alkali soils of the Yellow River Delta. It initially revealed that stand types can regulate the differentiation of bacterial communities and drive the targeted enrichment of specific functional groups. However, constrained by the research design and objective conditions, this work has certain limitations. First, this study adopted a single sampling method, which could reveal the differences in bacterial communities at a specific time point but could not verify whether the influence of mixed forests was permanent or an immediate response to short-term fluctuations, making it difficult to fully clarify the dynamic patterns of bacterial communities over time. Second, this study mainly relied on the FAPROTAX database alone for functional prediction. Despite the established application precedents of this database in the study area, we failed to integrate other predictive tools or empirical data, such as metagenomics and soil enzyme activities, for cross-validation. Therefore, the current conclusions regarding functional enrichment remain predictive inferences, and their reliability needs to be further strengthened through multi-dimensional evidence.
The aforementioned limitations of this study highlight the directions for improvement and expansion in future research. Subsequent studies will conduct more systematic and in-depth explorations from multiple dimensions. First, the fungal community will be incorporated into the research framework to expand the dimension of the research objects, thereby revealing the ecological effects of plantation management measures at the microbial level more comprehensively. Second, the temporal and spatial scales of the research will be extended. Continuous sampling and dynamic analysis will be carried out over multiple seasons and plantation plots. Different stand age stages will be included to systematically analyze the succession patterns and driving mechanisms of soil microbial communities with forest development and seasonal changes. Third, the functional characterization system will be improved by integrating multi-functional measured indicators, such as metagenomics and soil enzyme activities, so as to enhance the empirical reliability of the research conclusions.
5. Conclusions
The soil bacterial community structure of the plantation was changed by different tree mixing patterns; the Up-Rp, Fv-Rp and Ma-Fv mixtures decreased the relative abundance of Acidobacteria, while the Ma-Fv mixture increased the abundance of Proteobacteria. The effects of various mixed patterns on bacterial diversity were different; the Chao1, ACE and Shannon indices of bacteria were increased by Aa-Rp and Fv-Rp, and the Chao1 and ACE indices of bacteria were decreased by Up-Rp and Ma-Fv. Mixed planting patterns could regulate functional gene expression in soil bacteria. The four mixed patterns enhanced the abundance of functional bacterial groups associated with anaerobic chemoheterotrophy and fermentation and reduced the abundance of functional bacteria involved in aerobic nitrite oxidation and nitrification. This study revealed that mixed configuration patterns of tree species play a key role in shaping the bacterial community in plantation soils. Hence, targeted mixed planting patterns should be adopted during plantation establishment to improve the functionality and stability of the forest ecosystem.
Author Contributions
Conceptualization: X.D. and T.Y.; funding acquisition: T.Y.; investigation: Y.W., R.J. and Q.W.; data curation: R.J.; resources and project administration: T.Y.; formal analysis: Y.W.; writing—original draft: Y.W. and Q.W.; writing—review and editing: X.D. and T.Y. All authors have read and agreed to the published version of the manuscript.
Funding
This research was funded by the National Natural Science Foundation of China (42307552, 41701106 and 30970499) and the World Bank Loan Project (No. SEAP-KY-2).
Institutional Review Board Statement
Not applicable.
Informed Consent Statement
Not applicable.
Data Availability Statement
The datasets analyzed in the current study are available in the NCBI repository: https://www.ncbi.nlm.nih.gov/bioproject/PRJNA1328157 (accessed on 15 September 2025).
Acknowledgments
The smooth completion of this paper is inseparable from the support of many individuals and institutions. I would like to express my sincere gratitude to Fengyun Ma for the valuable guidance and encouragement he has provided me throughout the research process. Tianlong Yan and Yifei Wu contributed equally to this work and are co-first authors. I am also grateful to the members of my research team for their hard work, collaboration, and contributions to this project.
Conflicts of Interest
The authors declare no conflicts of interest.
References
- Hopmans, J.W.; Qureshi, A.S.; Kisekka, I.; Munns, R.; Grattan, S.R.; Rengasamy, P.; Ben-Gal, A.; Assouline, S.; Javaux, M.; Minhas, P.S.; et al. Critical Knowledge Gaps and Research Priorities in Global Soil Salinity. In Advances in Agronomy; Sparks, D.L., Ed.; Elsevier Academic Press Inc.: San Diego, CA, USA, 2021; Volume 169, pp. 1–191. ISBN 978-0-12-824590-3. [Google Scholar]
- Egamberdieva, D.; Wirth, S.; Bellingrath-Kimura, S.D.; Mishra, J.; Arora, N.K. Salt-Tolerant Plant Growth Promoting Rhizobacteria for Enhancing Crop Productivity of Saline Soils. Front. Microbiol. 2019, 10, 2791. [Google Scholar] [CrossRef] [PubMed]
- Chen, D.; Chen, W.; Zhu, X.; Xie, S.; Du, P.; Chen, X.; Lv, D. Multi-Scenario Simulation and Restoration Strategy of Ecological Security Pattern in the Yellow River Delta. Sustainability 2025, 17, 9061. [Google Scholar] [CrossRef]
- Yu, B.; Zang, Y.; Wu, C.; Zhao, Z. Spatiotemporal Dynamics of Wetlands and Their Future Multi-Scenario Simulation in the Yellow River Delta, China. J. Environ. Manag. 2024, 353, 120193. [Google Scholar] [CrossRef]
- Wingfield, M.J.; Brockerhoff, E.G.; Wingfield, B.D.; Slippers, B. Planted Forest Health: The Need for a Global Strategy. Science 2015, 349, 832–836. [Google Scholar] [CrossRef]
- Pati, P.K.; Kaushik, P.; Khan, M.L.; Khare, P.K. Stand Structure, Species Composition, Diversity, Biomass, and Carbon Stock Variability in Three Differently Managed Forests of Central India: Exploring Ecosystem Responses to Management. Environ. Monit. Assess. 2025, 197, 1292. [Google Scholar] [CrossRef]
- Liu, Z.; Wang, X.; Jia, G.; Jiang, J.; Liao, B. Introduction of Broadleaf Tree Species Can Promote the Resource Use Efficiency and Gross Primary Productivity of Pure Forests. Plant Cell Environ. 2024, 47, 5252–5264. [Google Scholar] [CrossRef]
- Pandey, N.C.; Upadhyay, G.; Koranga, S.; Khatri, K.; Tewari, L.M.; Joshi, G.C.; Tewari, G.; Chaturvedi, R.K. Variation in Soil Physico-Chemical Properties and Species Composition across the Altitudinal Gradient in Different Forests of Uttarakhand, India. Environ. Monit. Assess. 2025, 197, 790. [Google Scholar] [CrossRef]
- Roper, W.R.; Acosta-Martinez, V.; Veum, K.S.; Burgess, C.J.; Moore, J.M.; Manter, D.K.; Stewart, C.E.; Emmett, B.D.; Liebig, M.A.; Fischel, M.H.H.; et al. Unraveling Edaphic, Environmental, and Management Drivers of Soil Microbial Communities via Ester-Linked Fatty Acid Methyl Esters Using a Multilocation Agroecosystem Study. Geoderma 2025, 453, 117158. [Google Scholar] [CrossRef]
- Zheng, M.; Liang, X.; Han, Z.; Kang, J.; Chen, Y. Effects of Different Improvement Measures on the Diversity of Soil Bacteria Communities in Salt-alkali Soil. Acta Agrestia Sin. 2021, 29, 1200–1209. [Google Scholar] [CrossRef]
- He, M.-Y.; Shen, C.; Zhang, J.-H.; Wang, Y.-D. Effects of Continuous Cropping on the Physiochemical Properties, Pesticide Residues, and Microbial Community in the Root Zone Soil of Lycium barbarum. Huan Jing Ke Xue 2024, 45, 5578–5590. [Google Scholar] [CrossRef] [PubMed]
- Dukunde, A.; Schneider, D.; Schmidt, M.; Veldkamp, E.; Daniel, R. Tree Species Shape Soil Bacterial Community Structure and Function in Temperate Deciduous Forests. Front. Microbiol. 2019, 10, 1519. [Google Scholar] [CrossRef]
- Garcia-Pausas, J.; Romanya, J.; Casals, P. Post-Fire Recovery of Soil Microbial Functions Is Promoted by Plant Growth. Eur. J. Soil. Sci. 2022, 73, e13290. [Google Scholar] [CrossRef]
- Sniegocki, R.; Moon, J.B.; Rutrough, A.L.; Gireneus, J.; Seelan, J.S.S.; Farmer, M.C.; Weindorf, D.C.; Naithani, K. Recovery of Soil Microbial Diversity and Functions along a Tropical Montane Forest Disturbance Gradient. Front. Environ. Sci. 2022, 10, 853686. [Google Scholar] [CrossRef]
- Cao, J.; Liu, H.; Zhao, B.; Peng, R.; Liang, B.; Anenkhonov, O.A.; Korolyuk, A.Y.; Sandanov, D.V. Mixed Forest Suffered Less Drought Stress than Pure Forest in Southern Siberia. Agric. For. Meteorol. 2022, 325, 109137. [Google Scholar] [CrossRef]
- Brockerhoff, E.G.; Barbaro, L.; Castagneyrol, B.; Forrester, D.I.; Gardiner, B.; Ramon Gonzalez-Olabarria, J.; Lyver, P.O.; Meurisse, N.; Oxbrough, A.; Taki, H.; et al. Forest Biodiversity, Ecosystem Functioning and the Provision of Ecosystem Services. Biodivers. Conserv. 2017, 26, 3005–3035. [Google Scholar] [CrossRef]
- Walkiewicz, A.; Bieganowski, A.; Rafalska, A.; Khalil, M.; Osborne, B. Contrasting Effects of Forest Type and Stand Age on Soil Microbial Activities: An Analysis of Local Scale Variability. Biology 2021, 10, 850. [Google Scholar] [CrossRef]
- Iwachido, Y.; Kaneko, M.; Sasaki, T. Mixed Coastal Forests Are Less Vulnerable to Tsunami Impacts than Monoculture Forests. Nat. Hazards 2024, 120, 1101–1112. [Google Scholar] [CrossRef]
- Huuskonen, S.; Lahtinen, T.; Miina, J.; Uotila, K.; Bianchi, S.; Niemisto, P. Growth Dynamics of Young Mixed Norway Spruce and Birch Stands in Finland. Forests 2023, 14, 56. [Google Scholar] [CrossRef]
- Seliger, A.; Ammer, C.; Kreft, H.; Zerbe, S. Diversification of Coniferous Monocultures in the Last 30 Years and Implications for Forest Restoration: A Case Study from Temperate Lower Montane Forests in Central Europe. Eur. J. For. Res. 2023, 142, 1353–1368. [Google Scholar] [CrossRef]
- Sun, C.; Wang, Z.; Pan, C.; Song, Y.; Yu, Y. Effects of Cunninghamia lanceolata and Schima superba Mixed Forest on Soil Nutrients and Enzyme Activities. Acta Agric. Univ. Jiangxiensis 2023, 45, 517–525. [Google Scholar] [CrossRef]
- Feng, Y.; Schmid, B.; Loreau, M.; Forrester, D.; Fei, S.; Zhu, J.; Tang, Z.; Zhu, J.; Hong, P.; Ji, C.; et al. Multispecies Forest Plantations Outyield Monocultures across a Broad Range of Conditions. Science 2022, 376, 865. [Google Scholar] [CrossRef]
- Almeida, I.; Roesch, C.; Saha, S. Converting Monospecific into Mixed Forests: Stakeholders’ Views on Ecosystem Services in the Black Forest Region. Ecol. Soc. 2021, 26, 28. [Google Scholar] [CrossRef]
- Deng, J.; Zhou, Y.; Yang, L.; Zhang, S.; Li, H.; Wei, Y.; Deng, J.; Qin, S.; Zhu, W. Effects of mixed Fraxinus mandshurica and Larix olgensis plantation on the function diversity of soil microbial community. Shengtaixue Zazhi 2016, 35, 2684–2691. [Google Scholar] [CrossRef]
- Yang, C.; Sun, J. Soil Salinity Drives the Distribution Patterns and Ecological Functions of Fungi in Saline-Alkali Land in the Yellow River Delta, China. Front. Microbiol. 2020, 11, 594284. [Google Scholar] [CrossRef] [PubMed]
- Wang, H.; Chi, Y.; Zhong, Y.; Wang, Q. Habitat Suitability Dynamics of Yellow River Delta Nature Reserves for Rare Waterbirds. Sustainability 2025, 17, 5326. [Google Scholar] [CrossRef]
- Ni, X.; Zhao, G.; White, J.R.; Yao, P.; Xu, K.; Sapkota, Y.; Liu, J.; Zheng, H.; Su, D.; He, L.; et al. Source and Degradation of Soil Organic Matter in Different Vegetations along a Salinity Gradient in the Yellow River Delta Wetland. Catena 2025, 248, 108603. [Google Scholar] [CrossRef]
- Ma, Z.; Zhang, M.; Xiao, R.; Cui, Y.; Yu, F. Changes in Soil Microbial Biomass and Community Composition in Coastal Wetlands Affected by Restoration Projects in a Chinese Delta. Geoderma 2017, 289, 124–134. [Google Scholar] [CrossRef]
- Liu, W.; Wang, L.; Xia, J.; Lu, Y.; Zong, X. Short-Term Effects of Thinning on the Growth and Soil Improvement of Typical Stands in the Yellow River Delta. Front. Microbiol. 2025, 16, 1585176. [Google Scholar] [CrossRef]
- Bao, S.D. Soil and Agricultural Chemistry Analysis; China Agriculture Press: Beijing, China, 2000. [Google Scholar]
- Zhu, P.; Li, Y.; Gao, Y.; Yin, M.; Wu, Y.; Liu, L.; Du, N.; Liu, J.; Yu, X.; Wang, L.; et al. Insight into the Effect of Nitrogen-Rich Substrates on the Community Structure and the Co-Occurrence Network of Thermophiles during Lignocellulose-Based Composting. Bioresour. Technol. 2021, 319, 124111. [Google Scholar] [CrossRef]
- Liu, L.; He, X.Y.; Xie, Q.; Wang, K.L. Genetic Diversity of Rhizobia Isolated from Common Legumes in the Karst Area, Northwest Guangxi. Chin. J. Appl. Ecol. 2015, 26, 3663–3669. [Google Scholar]
- Gao, Y.; Jiang, X.; Liu, Y.; Wei, K.; Zhang, L.; Wang, X.; Wang, F.; Liu, J.; Cheng, S. Structural Changes and Assembly Mechanisms of Microbial Communities during Rapid Sedimentation of Yellow River Sediments. Environ. Technol. Innov. 2024, 35, 103702. [Google Scholar] [CrossRef]
- Yao, H.; Cheng, Y.; Kong, Q.; Wang, X.; Rong, Z.; Quan, Y.; You, X.; Zheng, H.; Li, Y. Variation in Microbial Communities and Network Ecological Clusters Driven by Soil Organic Carbon in an Inshore Saline Soil Amended with Hydrochar in Yellow River Delta, China. Environ. Res. 2025, 264, 120369. [Google Scholar] [CrossRef]
- Song, D.; Cui, Y.; Ma, D.; Li, X.; Liu, L. Spatial Variation of Microbial Community Structure and Its Driving Environmental Factors in Two Forest Types in Permafrost Region of Greater Xing′an Mountains. Sustainability 2022, 14, 9284. [Google Scholar] [CrossRef]
- Gorska, E.B.; Stepien, W.; Hewelke, E.; Lata, J.-C.; Gworek, B.; Gozdowski, D.; Sas-Paszt, L.; Bazot, S.; Lisek, A.; Gradowski, M.; et al. Response of Soil Microbiota to Various Soil Management Practices in 100-Year-Old Agriculture Field and Identification of Potential Bacterial Ecological Indicator. Ecol. Indic. 2024, 158, 111545. [Google Scholar] [CrossRef]
- Singh, B.K.; Munro, S.; Potts, J.M.; Millard, P. Influence of Grass Species and Soil Type on Rhizosphere Microbial Community Structure in Grassland Soils. Appl. Soil. Ecol. 2007, 36, 147–155. [Google Scholar] [CrossRef]
- Wang, G.; Liu, J.; Yu, Z.; Wang, X.; Jin, J.; Liu, X. Research Progress of Acidobacteria Ecology in Soils. Biotechnol. Bull. 2016, 32, 14–20. [Google Scholar] [CrossRef]
- Yue, S.; Feng, C.; Yang, Y.; Chen, L.; Guo, Y.; Zheng, R.; Su, J. Analysis of microbial community structure and diversity in selenium-sand melon soil under different continuous cropping years. Agric. Res. Arid. Areas 2020, 38, 230–236. [Google Scholar] [CrossRef]
- Zhu, P.; Yang, S.; Wu, Y.; Ru, Y.; Yu, X.; Wang, L.; Guo, W. Shifts in Soil Microbial Community Composition, Function, and Co-Occurrence Network of Phragmites Australis in the Yellow River Delta. Front. Microbiol. 2022, 13, 858125. [Google Scholar] [CrossRef] [PubMed]
- Hu, L.; Cao, L.; Zhang, R. Bacterial and Fungal Taxon Changes in Soil Microbial Community Composition Induced by Short-Term Biochar Amendment in Red Oxidized Loam Soil. World J. Microbiol. Biotechnol. 2014, 30, 1085–1092. [Google Scholar] [CrossRef]
- Ward, N.L.; Challacombe, J.F.; Janssen, P.H.; Henrissat, B.; Coutinho, P.M.; Wu, M.; Xie, G.; Haft, D.H.; Sait, M.; Badger, J.; et al. Three Genomes from the Phylum Acidobacteria Provide Insight into the Lifestyles of These Microorganisms in Soils. Appl. Environ. Microbiol. 2009, 75, 2046–2056. [Google Scholar] [CrossRef]
- Zhang, Y.; Ding, K.; Sun, Q.; Lu, M.; Liu, Q.; Yang, Q.; Tong, Z.; Zhang, J. Soil Multifunctionality and Nutrient Cycling-Related Genes in Cunninghamia lanceolata Plantations: Metagenomic Perspective Insights into Ecological Restoration. Ind. Crop. Prod. 2024, 222, 119608. [Google Scholar] [CrossRef]
- Joly, F.-X.; Fromin, N.; Kiikkila, O.; Hattenschwiler, S. Diversity of Leaf Litter Leachates from Temperate Forest Trees and Its Consequences for Soil Microbial Activity. Biogeochemistry 2016, 129, 373–388. [Google Scholar] [CrossRef]
- Ma, Y.; Cao, Y.; Niu, M.; Zhang, M.; Cheng, M.; Wen, Y. Investigation of Soil Microbial Characteristics During Stand Development in Pinus tabuliformis Forest in Taiyue Mountain. Environ. Sci. 2024, 45, 2406–2416. [Google Scholar] [CrossRef]
- Pereira, A.P.A.; Durrer, A.; Gumiere, T.; Goncalves, J.L.M.; Robin, A.; Bouillet, J.-P.; Wang, J.; Verma, J.P.; Singh, B.K.; Cardoso, E.J.B.N. Mixed Eucalyptus Plantations Induce Changes in Microbial Communities and Increase Biological Functions in the Soil and Litter Layers. For. Ecol. Manag. 2019, 433, 332–342. [Google Scholar] [CrossRef]
- Panthee, S.; Hamamoto, H.; Paudel, A.; Sekimizu, K. Lysobacter Species: A Potential Source of Novel Antibiotics. Arch. Microbiol. 2016, 198, 839–845. [Google Scholar] [CrossRef]
- Hayward, A.C.; Fegan, N.; Fegan, M.; Stirling, G.R. Stenotrophomonas and Lysobacter: Ubiquitous Plant-Associated Gamma-Proteobacteria of Developing Significance in Applied Microbiology. J. Appl. Microbiol. 2010, 108, 756–770. [Google Scholar] [CrossRef] [PubMed]
- Bakker, M.G.; Chaparro, J.M.; Manter, D.K.; Vivanco, J.M. Impacts of Bulk Soil Microbial Community Structure on Rhizosphere Microbiomes of Zea mays. Plant Soil. 2015, 392, 115–126. [Google Scholar] [CrossRef]
- Bickel, S.; Or, D. Soil Bacterial Diversity Mediated by Microscale Aqueous-Phase Processes across Biomes. Nat. Commun. 2020, 11, 116. [Google Scholar] [CrossRef]
- Yu, S.; She, G.; Li, Y.; Chen, L.; Li, L.; Ye, S. The influences of mixing with Cinnamomum cassia after different cutting intensities in a masson pine forest on soil microbial functional diversity. Chin. J. Ecol. 2017, 36, 2438–2446. [Google Scholar] [CrossRef]
- Liu, L.; Xu, M.; Wang, S.; Zhang, Q.; Wang, N.; Pan, H.; Hu, J. Effect of different Cunninghamia lanceolata plantation soil qualities on soil microbial community structure. Acta Ecol. Sin. 2013, 33, 4692–4706. [Google Scholar] [CrossRef]
- Medina-Villar, S.; Castro-Diez, P.; Alonso, A.; Cabra-Rivas, I.; Parker, I.M.; Perez-Corona, E. Do the Invasive Trees, Ailanthus altissima and Robinia pseudoacacia, Alter Litterfall Dynamics and Soil Properties of Riparian Ecosystems in Central Spain? Plant Soil 2015, 396, 311–324. [Google Scholar] [CrossRef]
- Zeng, J.; Liu, X.; Song, L.; Lin, X.; Zhang, H.; Shen, C.; Chu, H. Nitrogen Fertilization Directly Affects Soil Bacterial Diversity and Indirectly Affects Bacterial Community Composition. Soil. Biol. Biochem. 2016, 92, 41–49. [Google Scholar]
- Chabrerie, O.; Laval, K.; Puget, P.; Desaire, S.; Alard, D. Relationship between Plant and Soil Microbial Communities along a Successional Gradient in a Chalk Grassland in North-Western France. Appl. Soil. Ecol. 2003, 24, 43–56. [Google Scholar] [CrossRef]
- Sawada, K.; Inagaki, Y.; Sugihara, S.; Funakawa, S.; Ritz, K.; Toyota, K. Impacts of Conversion from Natural Forest to Cedar Plantation on the Structure and Diversity of Root-Associated and Soil Microbial Communities. Appl. Soil. Ecol. 2021, 167, 104027. [Google Scholar] [CrossRef]
- Esther Perez-Corona, M.; De Las Heras, P.; Vazquez De Aldana, B.R. Allelopathic Potential of Invasive Ulmus pumila on Understory Plant Species. Allelopath. J. 2013, 32, 101–111. [Google Scholar]
- Zhou, Y.; He, Z.; Lin, Q.; Lin, Y.; Long, K.; Xie, Z.; Hu, W. Salt Stress Affects the Bacterial Communities in Rhizosphere Soil of Rice. Front. Microbiol. 2024, 15, 1505368. [Google Scholar] [CrossRef] [PubMed]
- Zhang, Q.; Campos, M.; Larama, G.; Acuna, J.J.; Valenzuela, B.; Solis, F.; Zamorano, P.; Araya, R.; Sadowsky, M.J.; Jorquera, M.A. Composition and Predicted Functions of the Bacterial Community in Spouting Pool Sediments from the El Tatio Geyser Field in Chile. Arch. Microbiol. 2021, 203, 389–397. [Google Scholar] [CrossRef]
- Rivett, D.W.; Bell, T. Abundance Determines the Functional Role of Bacterial Phylotypes in Complex Communities. Nat. Microbiol. 2018, 3, 767. [Google Scholar] [CrossRef] [PubMed]
- Esposito, A.; Del Duca, S.; Vitali, F.; Bigiotti, G.; Mocali, S.; Semenzato, G.; Papini, A.; Santini, G.; Mucci, N.; Padula, A.; et al. The Great Gobi a Strictly Protected Area: Characterization of Soil Bacterial Communities from Four Oases. Microorganisms 2024, 12, 320. [Google Scholar] [CrossRef]
- Gao, Z.; Xu, Z.; Li, Y.; Chang, L.; Li, N.; Liao, Y.; Meng, W.; Sun, H.; Huang, L. Shifts in Dominant Tree Species Modulate phyllosphere Microbial Diversity and Function in Successional Forests. BMC Microbiol. 2025, 25, 195. [Google Scholar] [CrossRef] [PubMed]
- Liang, Y.; Ming, A.-G.; He, Y.-J.; Luo, Y.-H.; Tan, L.; Qin, L. Structure and Function of Soil Bacterial Communities in the Monoculture and Mixed Plantation of Pinus massoniana and Castanopsis hystrix in Southern Subtropical China. Ying Yong Sheng Tai Xue Bao 2021, 32, 878–886. [Google Scholar] [CrossRef] [PubMed]
- Bai, Y.; Zhou, Y.; Du, J.; Zhang, X.; Feng, J.; Feng, J. Tree Species Influence Microbiome-Mediated Nutrient Sequestration in Soil Aggregates of Subtropical Plantations in China. Appl. Soil. Ecol. 2025, 209, 106034. [Google Scholar] [CrossRef]
- Berg, G.; Smalla, K. Plant Species and Soil Type Cooperatively Shape the Structure and Function of Microbial Communities in the Rhizosphere. FEMS Microbiol. Ecol. 2009, 68, 1–13. [Google Scholar] [CrossRef] [PubMed]
- Li, M.; Chen, L.; Zhao, F.; Tang, J.; Bu, Q.; Feng, Q.; Yang, L. An Innovative Risk Evaluation Method on Soil Pathogens in Urban-Rural Ecosystem. J. Hazard. Mater. 2023, 459, 132286. [Google Scholar] [CrossRef]
Disclaimer/Publisher’s Note: The statements, opinions and data contained in all publications are solely those of the individual author(s) and contributor(s) and not of MDPI and/or the editor(s). MDPI and/or the editor(s) disclaim responsibility for any injury to people or property resulting from any ideas, methods, instructions or products referred to in the content. |
© 2026 by the authors. Licensee MDPI, Basel, Switzerland. This article is an open access article distributed under the terms and conditions of the Creative Commons Attribution (CC BY) license.