Abstract
As lakes contribute significant amounts of methane (CH4) to the atmosphere, they account for a significant share of the global greenhouse gases (GHGs) budget. Since lakes are ecosystems where physical and biological processes influencing CH4 formation are concentrated, the study focuses on atmospheric CH4 column concentrations over lake areas. This study aims to analyze the temporal variation in atmospheric CH4 column concentrations (XCH4) over Lake Eğirdir and Lake Burdur in Türkiye in 2023 and 2025 as well as the relationship between XCH4 and environmental parameters such as Water Surface Temperature (WST), Normalized Difference Chlorophyll Index (NDCI), and Floating Algae Index (FAI). The temporal variability of XCH4 observed over both lakes showed statistically significant positive correlations with lake-area-averaged WST, NDCI, and FAI (Pearson r = 0.49–0.65, p < 0.01). This outcome indicates consistent temporal patterns between XCH4 and environmental conditions at the lake scale. Furthermore, time-series graphs show that monthly average XCH4 values in both lakes reached their highest levels during the summer and autumn months. During these periods, XCH4 concentrations exceeded 1860 ppb in Lake Eğirdir and 1900 ppb in Lake Burdur. The areas of land use/land cover (LULC) classes surrounding the lakes were evaluated together with XCH4, and relatively higher XCH4 values were observed over agricultural areas, which constitute the dominant class in the basins of both lakes. The distribution of XCH4 throughout the lake depth showed higher values in the shallow and mid-depth zones and lower values in the deeper areas beyond 20 m, indicating that the distribution of XCH4 varies throughout lake depth. The results obtained underline the importance of remote sensing data in monitoring XCH4 in lake ecosystems.
1. Introduction
Methane (CH4) is defined as a greenhouse gas (GHG) with a higher global warming potential than carbon dioxide when evaluated over a 100-year time period [1]. Atmospheric CH4 concentrations were approximately 1700 ppb in the 1990s and since then have shown a continuous increasing trend, reaching levels of around 1940 ppb recently [2]. This continued increase highlights the need to better understand the relative contributions of natural and anthropogenic CH4 sources. Natural sources generally include anaerobic environments, such as wetlands and freshwater systems [3]. Within the global CH4 budget, aquatic ecosystems represent a significant portion of both natural and human-induced emissions [4]. For example, lakes constitute key elements of natural ecosystems and contribute substantially to CH4 emissions [5,6,7,8]. Recent studies suggest that global CH4 emissions from lakes and reservoirs are projected to increase by approximately 24–91% during the period 2080–2099 under the IPCC Shared Socioeconomic Pathway (SSP) climate scenarios [9]. Lakes represent prominent ecosystems in which CH4 dynamics are closely linked with environmental processes and are influenced by seasonal temperature variability and changes in organic matter accumulation.
Spatial and temporal variations in CH4 emissions in lakes are not only due to fundamental physical processes but are also influenced by region-specific environmental conditions and anthropogenic pressures. Previous studies have shown that increasing temperatures in lakes accelerate microbial activity leading to increased CH4 emissions; therefore, temperature stands out as one of the key driving factors affecting CH4 emissions [7,10,11]. CH4 is not only the most important GHG emitted from areas like lakes but its emissions also increase exponentially with the concentration of chlorophyll-a (Chl-a) in lakes [12]. In addition to Chl-a, algal activity in lakes also affects CH4 emissions. Algal growth further strengthens these emissions [13,14]. Previous studies have shown that shallow lakes are major contributors to lake-derived CH4 emissions on a global scale, and that depth is a significant determinant of the spatial distribution of CH4 [15,16]. CH4 is influenced both by in-lake processes and terrestrial conditions in the surrounding basin. Studies have demonstrated links between CH4 emissions in lakes and land use/land cover (LULC) [17,18]. As such, these studies suggest that lake CH4 emission patterns reflect the combined influence of in-lake processes and surrounding environmental and land-use conditions, rather than a single controlling factor.
Quantitative determination of CH4 emissions from lakes is challenging as direct flux measurements such as floating chambers and eddy covariance methods have limited spatial coverage and high logistic requirements [19]. However, remote sensing (RS) technology enables long-term and large-scale monitoring of CH4 concentrations [20]. Sentinel-5 Precursor (Sentinel 5P) with TROPOMI (Tropospheric Monitoring Instrument) provide global observations of the column-averaged dry-air mixing ratio (XCH4-Atmospheric CH4). XCH4 concentrations derived from Sentinel 5P TROPOMI represent the integrated effects of regional background CH4 contributions, atmospheric transport and mixing processes, as well as potential local enhancements. Accordingly, XCH4 is not interpreted as a direct measure of CH4 fluxes or emissions from lakes but is evaluated within a regional and contextual framework over the study area. In this study, the temporal changes in XCH4 observed over and surrounding Lake Eğirdir and Lake Burdur in Türkiye during the 2023–2025 period using Sentinel 5P TROPOMI data was investigated. In addition, the temporal variations in lake-scale environmental parameters, including Water Surface Temperature (WST) derived from Landsat 8 and indicators of Chl-a and algae activity obtained from Sentinel 2, were jointly evaluated with the temporal changes in XCH4.
The main hypothesis of this study is that the temporal variations in XCH4 observed over the lakes may exhibit co-variability with WST, RS-derived proxies of Chl-a, algae activity, lake bathymetry (depth zones), and basin-scale LULC characteristics that are defined as “environmental parameters”. This approach allows the potential relationships between in-lake physical characteristics and basin-scale environmental conditions and the observed XCH4 variability to be evaluated in a holistic manner. The novelty of this study stems from the joint temporal evaluation of Sentinel 5P TROPOMI-derived XCH4 observations and lake-basin-scale environmental indicators retrieved from medium-resolution satellite data. While most studies focus either on emission estimates based on direct in situ measurements or on regional-scale XCH4 patterns, this study is among the limited number of investigations that jointly examine XCH4 changes over medium-sized lakes in relation to WST, Chl-a, algal presence, bathymetry, and basin-scale LULC. In this respect, the study highlights the potential of RS-based data for monitoring lake–atmosphere interactions and provides a methodological basis for future emission-oriented, model-supported studies.
2. Materials and Methods
2.1. Study Area
Lake Burdur (37°44′1″ N 30°10′41″ E) is one of the deepest lakes in Türkiye with an average surface area of approximately 153 km2 and an elevation of 845 m (Figure 1). The lake water is saline, brackish, and contains arsenic [21]. Lake Eğirdir (37°59′37″ N 30°53′18″ E), on the other hand, is a freshwater lake formed by tectonic and karstic processes. Its average surface area is approximately 468 km2, and its elevation is 916 m [21].
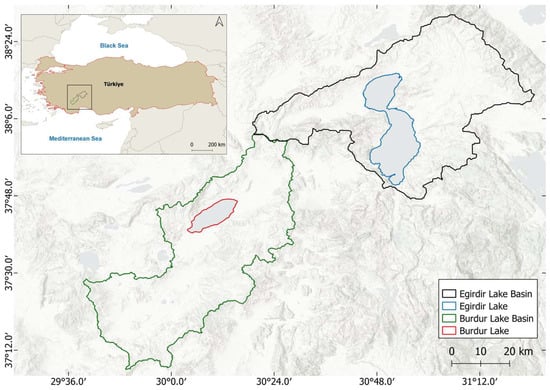
Figure 1.
The map on the upper left corner shows the geographical location of Türkiye where both lake basins are shown. The main map illustrates Eğirdir and Burdur Lakes and their basin boundaries.
2.2. Satellite Data
In this study, XCH4 concentration data obtained from Sentinel 5P satellite were used. The TROPOMI on Sentinel 5P is an imaging spectrometer that enables the detection of atmospheric components from space and provides XCH4 concentrations by using SWIR bands. Since August 2019, the TROPOMI on Sentinel 5P has been providing data at a spatial resolution of 3.5 × 5.5 km2 [22]. WST was obtained from the thermal band of the Landsat-8 satellite. Launched in 2013, Landsat 8 is equipped with the Operational Land Imager (OLI) and the Thermal Infrared Sensor (TIRS). OLI collects data across the visible, near-infrared (NIR), and SWIR regions of the spectrum, while TIRS records Land Surface Temperature (LST) in two thermal bands. It offers a spatial resolution of 30 m for the visible, NIR, and SWIR bands, and 100 m for the TIR bands [23]. Chl-a concentration and floating algae in lakes can be analyzed using satellite data. In this study, the Normalized Difference Chlorophyll Index (NDCI) [24] was used to analyze Chl-a concentration, and the Floating Algae Index (FAI) [25] was used to determine algal activity. Both indices were calculated using Sentinel 2 satellite imagery in operation since 2018. It has 13 spectral bands, and collects data every 5 days with a spatial resolution of 10 m in the visible and NIR regions, and 20 m in the red-edge and SWIR regions [26].
2.3. Methodology Used
In this study, the extractions of XCH4 (ppb) from the Sentinel 5P satellite, NDCI and FAI from the Sentinel 2 satellite, and WST from the Landsat 8 satellite were carried out using the Google Earth Engine (GEE) platform. Monthly time series covering the period of 2023–2025 were generated for each parameter to characterize their temporal variability. Monthly mean XCH4 values were exported from GEE as GeoTIFF files and subsequently used to produce seasonal composite XCH4 maps in the QGIS (version: 3.16) environment through enabling the spatial visualization of XCH4 variability over the lakes. In parallel, monthly area-averaged Sentinel 5P XCH4 values, interpreted as indicators of regional XCH4 background, were extracted. Lake-related variables, including WST, NDCI, and FAI, were spatially averaged over the entire lake surface. All variables were exported as tabular data (CSV format) and then analyzed in a Python (version: 3.10.13) environment to generate time-series graphs and to explore temporal relationships between regional XCH4 and integrated lake environmental parameters. Correlation analyses were conducted using monthly averaged time-series data to determine the linkage between XCH4 variability and WST, NDCI, and FAI.
Additionally, the relationship between lake depth and XCH4 was examined using bathymetric data, and LULC maps were generated using the ESRI (Environmental Systems Research Institute) Sentinel 2 Land Cover dataset to assess the potential influence of LULC classes on lake XCH4 dynamics. Accordingly, the spatial distribution of LULC classes was analyzed, and the impact of each class on XCH4 was evaluated. Figure 2 summarizes the methodological framework of the study.
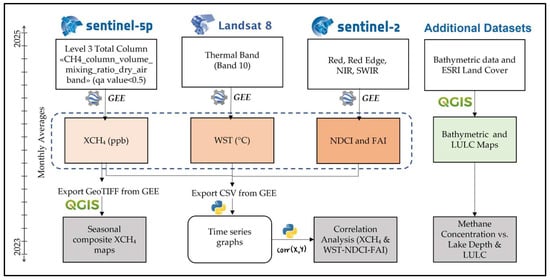
Figure 2.
Methodological framework of the study.
2.3.1. XCH4 Retrieval and Calculation of WST, NDCI, and FAI
The GEE platform was used to obtain XCH4 from Sentinel 5P. Level 2 (L2) data acquired from the Sentinel 5P satellite is converted into 1.1 km2 Level 3 (L3) products using the harpconvert tool integrated into the GEE platform. OFFL (offline) data, which are up-to-date and of high quality, were utilized to analyze CH4 emissions. The “qa_value” (quality assurance value) parameter in the TROPOMI dataset was considered to ensure data quality. This parameter is a quality indicator varying between 0 (no data) and 1 (high-quality data). Pixels with a qa_value below 0.5 were filtered out and excluded from further processing to include only highly reliable data in the analysis [27]. CH4 data products from the Sentinel 5P satellite for the 2023–2025 period were examined, and Sentinel 5P L3 data products, directly accessible via GEE, were used in the analyses.
LST calculations were utilized to estimate WST from Landsat-8 images. For this purpose, LST was calculated using Brightness Temperature (BT) values obtained from the thermal band (Band 10) and surface emissivity (ε) [28]. The general formula is given in Equation (1):
LST = (BT/(1 + (0.00115 × BT/1.4388) × 𝐿𝑛(ε)))
NDCI is frequently used to derive Chl-a from satellite data. Makwinja et al. [29] reported that Chl-a concentrations derived from Sentinel 2 data were consistent with in situ data, and that NDCI algorithm predicted Chl-a concentrations with acceptable accuracy in their lake study. The red-edge bands of Sentinel 2 bands were utilized in this study and are shown in Equation (2).
NDCI = (Red Edge − Red)/(Red Edge + Red)
FAI has been used to determine algal activities in lakes. It was applied to Sentinel 2 and Landsat 8 satellite images to analyze the spatial and seasonal changes in floating algal activity in lakes, and the findings demonstrated that these satellite data are an effective and useful tool for monitoring aquatic environments in the study of Liu et al. [30]. Equation (3) shows the corresponding FAI formula [25].
FAI = Rrc,NIR − R′rc,NIR
Rrc,Red, Rrc,NIR, and Rrc,SWIR represent the Rayleigh-corrected reflectance values of Sentinel 2’s red, NIR and SWIR bands, respectively.
2.3.2. Statistical Analysis
Correlation analysis was conducted to examine the relationship between NDCI, FAI and WST variables and XCH4. The correlations between these parameters and XCH4 levels were evaluated over monthly average values covering the entire lake. Correlation coefficients were calculated to assess the relationship between each parameter and XCH4. The correlation coefficient formula is shown in Equation (5) [31].
r: Pearson correlation coefficient x; y: values in the datasets; n: number of observations.
2.4. Cross-Validation with TCCON Ground-Based Observations
Ground-based measurements obtained from the TCCON (Total Carbon Column Observing Network) Nicosia station (35.141° N, 33.381° E, Nicosia), which is the closest to the study area, were used solely to evaluate the consistency and quality of Sentinel 5P TROPOMI XCH4 observations at a regional scale. This validation does not aim to attribute the observed spatial/temporal variability in XCH4 over the lakes, or to provide validation of lake-specific emission processes. TCCON is a global observation network, currently consisting of 28 stations, that uses Fourier Transform Spectrometer measurements to measure the column-average dry-air mole fractions of atmospheric GHGs with high sensitivity [32,33]. TCCON data are widely used as an important reference source for validating CH4 measurements obtained from Sentinel 5P [34]. The validation process was based on the method applied by Prajesh et al. [35]. Sentinel 5P TROPOMI XCH4 values were obtained from a buffer zone defined around the TCCON station, thereby allowing a comparison between satellite data and ground-based measurements. Since the TCCON XCH4 data covers the period 1 September 2019–25 October 2024, the Sentinel 5P measurements were temporally matched to this time interval. Following the approach used by Prajesh et al. [35], validation was performed using temporally matched observation pairs; the matching window was optimized to preserve temporal consistency while ensuring a sufficient number of paired observations. For each valid TCCON measurement, all TROPOMI observations within the selected time interval and buffer zone were combined using the inverse distance weighted (IDW) method, thus giving higher weight to satellite pixel values closer to the station. The temporally matched TCCON–TROPOMI pairs obtained through this process enabled validation analysis by allowing the calculation of metrics such as annual averages, bias, correlation coefficients, and mean absolute error (MAE).
3. Results
3.1. Seasonal Composite XCH4 Maps
Seasonal composite maps were generated to illustrate the spatial distribution of XCH4 concentrations over Lake Eğirdir and Lake Burdur for the period of 2023–2025. For each year, XCH4 observations derived from Sentinel 5P TROPOMI were aggregated into seasonal composites corresponding to winter (December, January, February; DJF), spring (March, April, May; MAM), summer (June, July, August; JJA), and autumn (September, October, November; SON) based on monthly averaged data availability. In these maps, each pixel represents the seasonal mean XCH4 concentration expressed in parts per billion (ppb). The color scale (blue to red) indicates increasing XCH4 concentrations, with cooler colors representing relatively lower XCH4 values, and warmer colors representing relatively higher XCH4 values. White areas indicate locations where valid satellite observations were unavailable for the corresponding season, primarily due to data gaps or quality filtering. The resulting seasonal composite XCH4 maps for Lake Eğirdir are presented in Figure 3.
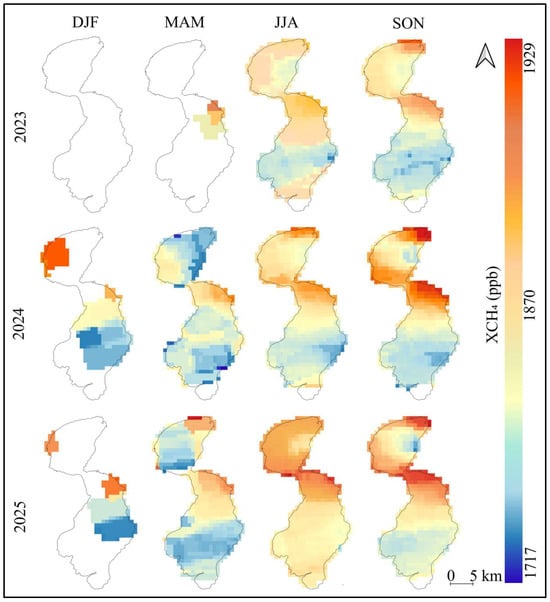
Figure 3.
Seasonal composite maps of XCH4 over and around Lake Eğirdir for 2023–2025. Columns represent seasons (DJF, MAM, JJA, SON), while rows correspond to 2023 (top), 2024 (middle), and 2025 (bottom).
Seasonal composite maps indicate a clear seasonal variability in XCH4 over Lake Eğirdir during 2023–2025. Higher maximum XCH4 values generally occur during summer and autumn while lower or more heterogeneous values are observed in winter and spring. In 2023, XCH4 ranged from 1756 to 1877 ppb in summer and increased to 1767–1901 ppb in autumn. During 2024, the lowest minimum value (1717 ppb) was observed in spring, whereas the highest seasonal maximum (1919 ppb) occurred in autumn. In 2025, the seasonal pattern persisted, with relatively elevated minimum values in summer (1813 ppb) and the highest maximum in spring (1929 ppb). The recurrent occurrence of higher XCH4 values in summer and spring highlights a consistent seasonal signal in XCH4 variability. Local news reports from August 2024 documented CH4-related phenomena, including surface bubbling, smoke, and fire incidents in drying reed-bed areas, particularly in the northern part of the lake [36,37]. These observations temporally coincided with the XCH4 enhancements observed during the late summer to early autumn 2024 period.
Maps illustrating the spatial distribution of seasonal composite XCH4 concentrations over the same period for Lake Burdur are presented in Figure 4.
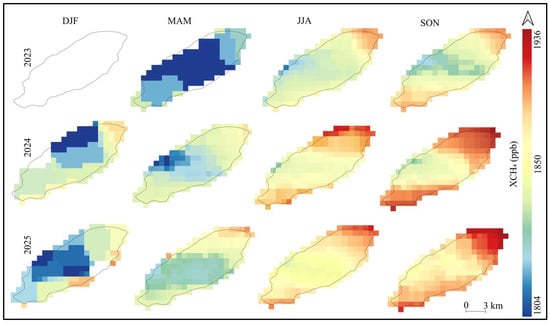
Figure 4.
Seasonal composite maps of XCH4 over and around Lake Burdur for 2023–2025. Columns represent seasons (DJF, MAM, JJA, SON), while rows correspond to 2023 (top), 2024 (middle), and 2025 (bottom).
Similar to Lake Eğirdir, Lake Burdur also appears to exhibit a significant seasonality in XCH4 concentrations during the 2023–2025 period. In 2023, XCH4 values ranged from 1812 to 1872 ppb in spring, 1834–1911 ppb in summer, and 1851–1918 ppb in autumn, with relatively higher levels observed during the summer and autumn seasons. Similarly, in 2024, XCH4 levels increased during summer (1862–1916 ppb) and particularly during autumn (1860–1936 ppb). In 2025, elevated XCH4 values were again evident in summer (1873–1920 ppb) and autumn (1885–1931 ppb). The repeated occurrence of elevated XCH4 levels during the warmer seasons points out a persistent seasonal pattern in XCH4 variability.
Seasonal composites obtained for Lake Burdur show higher XCH4 ranges, especially during the summer and autumn periods, compared to Lake Eğirdir. This situation indicates different spatial and temporal patterns regarding XCH4 concentrations between the two lakes.
3.2. Relationship Between Lake Depth and XCH4
The bathymetry of both lakes was analyzed (Figure 5), and XCH4 values were quantitatively evaluated across three depth classes. To support the spatial interpretation, XCH4 observations were grouped into bathymetric depth intervals (Table 1).
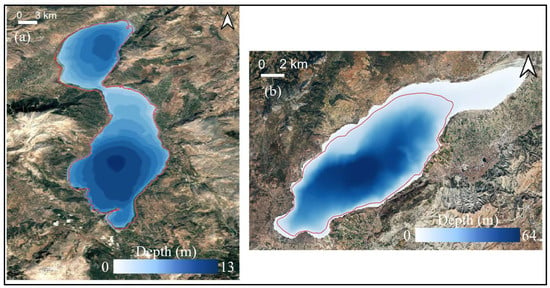
Figure 5.
Bathymetric map of (a) Lake Eğirdir and (b) Lake Burdur. The base map is the Google Satellite imagery obtained via QGIS. The red line indicates the lake boundaries.

Table 1.
Mean annual (2025) XCH4 concentrations observed over Lake Eğirdir and Lake Burdur as a function of water depth classes.
When the XCH4 maps and bathymetric maps are examined together, comparatively higher XCH4 levels are apparent over the shallower lake zones. These zones correspond primarily to the northern and central parts of Lake Eğirdir, and to the nearshore areas of Lake Burdur. For both lakes, the depth-binned analysis indicates that the mean XCH4 values peak in the shallowest zones and reach maximum levels within shallow-to-intermediate depth ranges. Mean XCH4 values in Lake Eğirdir decrease with increasing water depth, from 1862 ppb in the 0–5 m class to 1826 ppb in depths higher than 10 m. A comparable depth-related decline is observed in Lake Burdur, where mean XCH4 decreases from 1898 ppb in the 0–20 m class to 1885 ppb in waters deeper than 40 m.
3.3. Relationship Between LULC and XCH4
A combination of natural conditions and human activities may influence XCH4 variability observed over the lake systems. Therefore, examining LULC characteristics within the lake basins provides an important spatial context for understanding observed XCH4 patterns. In the study, LULC classes within the basins of both lakes were analyzed using the 2024 ESRI Sentinel 2 Land Cover dataset [38] that included classes such as water, trees (forestry), crops (agricultural area), built-up areas, bare ground (barren land), and rangeland. LULC classes for both lakes are presented in Figure 6. The dominant LULC classes within the basins of both lakes were identified to support the background evaluation of the observed XCH4 variability. To characterize the LULC conditions surrounding the lakes, a 1 km buffer zone was delineated around each lake boundary, and the areas occupied by the LULC classes within this buffer were calculated (Table 2).
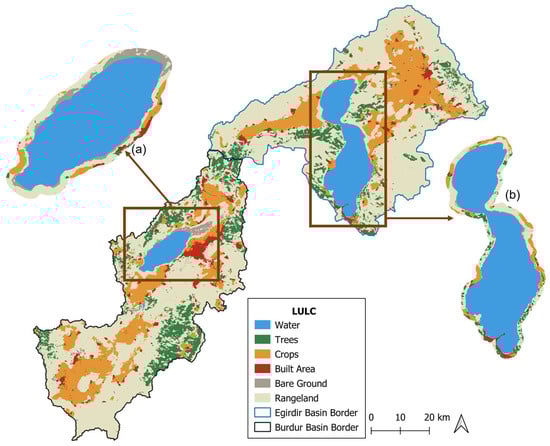
Figure 6.
LULC classes of the Eğirdir and Burdur Lake basins based on the 2024 Esri Sentinel 2 Land Cover dataset (1 km buffer zones of (a) Lake Burdur and (b) Lake Eğirdir).
Table 2.
LULC classes within basin borders and 1 km buffer zone.
It was determined that the dominant LULC classes in the basins of both lakes are rangelands and agricultural areas, respectively, accounting for approximately 65.2–59.0% and 23.0–21.6% of the basin area. The rangeland areas surrounding the lakes largely correspond to regions covered by natural vegetation. In the Lake Eğirdir basin, agricultural areas are predominantly concentrated around the northern and central parts of the lake. These areas spatially coincide with regions where relatively higher XCH4 values are observed in the seasonal composite maps. Lake basin agricultural activities, particularly fruit cultivation that require intensive use of fertilizers and pesticides, together with untreated domestic wastewater pose the main pollution threat, while there is no notable industrial pollution [39]. Similarly, the dominant LULC classes surrounding Lake Burdur were identified as rangelands and agricultural areas. Agricultural lands are primarily concentrated in the eastern and southern parts of the basin, with additional agricultural activities present in the northern and western surroundings. Areas characterized by intensive agricultural activities spatially coincide with regions where relatively higher XCH4 values are observed. The annual mean XCH4 values calculated for each LULC class provide a comparative framework for assessing the distribution of XCH4 concentrations observed over different land cover types (Table 3). Since the LULC dataset corresponds to the year 2024, annual mean XCH4 values for 2024 were used in the analysis. An examination of the XCH4 values indicates that agricultural areas, one of the dominant land cover classes, are characterized by relatively higher mean XCH4 levels.
Table 3.
Annual average XCH4 concentrations by class.
3.4. Time-Series and Correlation Analysis of XCH4, WST, NDCI, and FAI
This section investigates the temporal variability of XCH4 and lake-related environmental conditions using a lake-averaged time-series approach. Sentinel 5P regional XCH4 observations are evaluated together with mean WST, NDCI, and FAI to examine their co-temporal behavior over the study period. Due to the coarse spatial resolution of Sentinel 5P, XCH4 is interpreted as a regional XCH4 background indicator rather than a direct measure of lake-scale emissions. Lake-related variables (WST, NDCI, and FAI) were spatially averaged over the entire lake surface, and the resulting time series were used to assess the temporal correlations between variations in regional XCH4 and integrated lake conditions. Time series derived from monthly mean values for the 2023–2025 period is presented in Figure 7 for Lake Eğirdir and Burdur. The missing months in the XCH4 time series are due to the lack of Sentinel-5P XCH4 data with sufficient spatial and temporal coverage during those periods; therefore, only months with adequate coverage were included in the analyses.
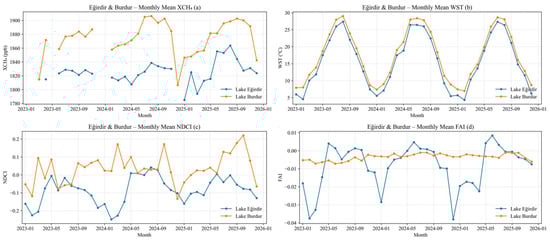
Figure 7.
Monthly time series of XCH4 background and lake-averaged variables for Lake Eğirdir and Burdur (2023–2025): (a) mean XCH4, (b) mean WST, (c) mean NDCI, (d) mean FAI.
The monthly time series indicate a clear seasonal pattern in lake-averaged WST for both Lake Eğirdir and Lake Burdur, with higher temperatures occurring during late spring and summer and lower values in winter, consistent with regional climate. Throughout the study period, Lake Burdur generally exhibits slightly higher WST values than Lake Eğirdir. In contrast, lake-averaged NDCI and FAI display more episodic and irregular temporal variations, particularly during warmer months. These variations are more pronounced in Lake Eğirdir, which shows higher short-term variability in both indices, whereas Lake Burdur is characterized by comparatively more stable NDCI and FAI patterns. In Lake Eğirdir, pronounced fluctuations in NDCI and FAI are particularly evident during the late summer and autumn months, coinciding with periods of increased biological activity and low water levels. By contrast, Lake Burdur exhibits smoother seasonal transitions in both indices, with less pronounced short-term variability. Periods of relatively elevated XCH4 values are predominantly observed during warm seasons in both lakes, with Lake Burdur exhibiting consistently higher XCH4 levels than Lake Eğirdir across most months.
Based on the observed temporal co-variations among the analyzed variables, correlation analyses were conducted using the lake-averaged monthly time series. Table 4 summarizes the Pearson correlation coefficients between XCH4 and WST, NDCI, and FAI for Lake Eğirdir and Lake Burdur, respectively, along with the corresponding significance levels and sample sizes.
Table 4.
Pearson correlation coefficients between XCH4 and environmental parameters (WST, NDCI, and FAI) for Lake Eğirdir and Lake Burdur based on monthly time series (2023–2025).
The correlation analysis shows statistically significant positive relationships between XCH4 and the examined environmental parameters for both Lake Eğirdir and Lake Burdur (p < 0.01). For both lakes, positive links are observed between XCH4 and WST, NDCI, and FAI, with the strongest relations consistently found for WST. While the correlation strengths differ between the two lakes, positive relationships are consistently observed for all examined parameters.
3.5. Validation of Sentinel 5P TROPOMI-Derived XCH4 Using TCCON Ground-Based Measurements
Since TCCON XCH4 data has been available since 2019, all matching XCH4 measurements for the 2019–2024 period have been included in the validation analysis. However, as this study focuses on 2023, 2024, and 2025, the table highlights 2023 and 2024 in particular. Since TCCON measurements for 2025 have not yet been published, this year was excluded in the analysis (Table 5). The validation table has been confirmed using a dataset containing 3869 matched pairs.
Table 5.
Validation analysis created based on matched pairs. 2023 and 2024 have been highlighted in gray.
In 2019, the correlation between TCCON and TROPOMI was low, and the MAE was high; however, towards 2024, the correlations increased while the MAE showed a marked decrease. Although bias remained positive throughout the entire period, it exhibited a consistent downward trend indicating that TROPOMI systematically retrieved higher XCH4 values than TCCON but substantially reduced this offset over time. Indeed, as in the study by Prajesh et al. [35], bias declined by approximately 70%, reaching 5–6 ppb in 2023 and 2024, with MAE values around 10 ppb between 2019 and 2024. Consequently, TROPOMI observations demonstrated clear improvements in both accuracy and consistency. These findings indicate that the agreement between the two datasets has progressively improved and that TROPOMI can be considered a reliable data source for long-term XCH4 monitoring.
4. Discussion
In this study, the temporal variability of XCH4 over Lakes Eğirdir and Burdur was jointly evaluated in relation to WST, NDCI, FAI, lake depth, and basin-scale LULC characteristics. These variables were considered to represent key environmental conditions associated with CH4 dynamics in lake systems. It has been reported that CH4 in lakes tends to increase with rising Chl-a and water temperature [40]. In addition, high Chl-a values are associated with algal blooms, which enhance organic matter availability and favor anoxic conditions, thereby indirectly stimulating CH4 production [41,42]. Although CH4 fluxes originating directly from the lake surface were not measured in this study, contextual variations in XCH4 concentrations were evaluated under suitable atmospheric conditions, in line with parameters established in previous studies. In this context, NDCI associated with Chl-a and FAI, representing algal activity, were used to investigate the potential effects of biological processes in lake ecosystems on XCH4 variability.
The analysis shows that XCH4 observed over the lakes exhibits pronounced seasonal variability. XCH4 concentrations over the investigated lakes generally reach their highest levels during summer and decrease to minimum values in winter, indicating that CH4 dynamics are largely governed by temperature-sensitive processes. Indeed, previous studies have also demonstrated that increases in temperature enhance CH4 concentrations [43,44]. For both lakes, the seasonal XCH4 composite maps produced also reveal that higher XCH4 values are repeatedly observed during the summer and autumn seasons throughout the 2023–2025 period. These findings are generally consistent with previous studies reporting increased XCH4 concentrations during warmer periods [45,46]. Especially during the summer and autumn months, the recurrent high XCH4 values temporally coincide with periods of intensified microbial activity in lake ecosystems associated with increasing temperatures. The differences in XCH4 levels observed between the two lakes suggest that lake-specific morphological, hydrodynamic, and basin-scale conditions may be influential in determining the magnitude and spatial distribution of XCH4 patterns. In this context, the pronounced decline in water level and the drying tendency observed in Lake Burdur in recent years [47] are considered to be contributing factors to the generally higher XCH4 levels observed over the lake. Indeed, studies report that increasing drought conditions lead to the drying of lakes and other inland water systems, thereby expanding the surface area of exposed aquatic sediments, a process that may increase CH4 concentrations originating from dry inland water systems at the global scale [48].
Previous studies have reported that higher CH4 emissions are commonly observed in shallow zones of lake ecosystems [5,49]. Similarly, in this study, mean XCH4 values for both lakes are generally higher within shallow and intermediate depth ranges. In contrast, relatively lower XCH4 values are observed at depths of 20 m and greater. Although Sentinel 5P measures XCH4 rather than direct lake CH4 emissions, the consistent decrease in mean XCH4 values from shallow to deeper depth classes observed in both lakes indicates a systematic association between XCH4 signals over lake surfaces and water depth. This pattern reflects the combined influence of depth-related lake CH4 processes and regional atmospheric background conditions.
LULC characteristics within the lake basins provide an important spatial context for interpreting the observed XCH4 patterns. When basin-scale LULC distributions are evaluated together with the seasonal XCH4 composite maps, areas exhibiting relatively higher XCH4 values are found to spatially coincide with regions dominated by agricultural land. Such areas, in turn, represent the land cover type associated with the highest XCH4 concentrations within the basins. Studies have shown that agricultural activities (e.g., fertilizer application and related diffuse pollution loads) are associated with increased CH4 concentrations [50,51]. Therefore, this spatial relationship observed across the lakes is considered as a valuable finding that points to the potential indirect effects of agricultural activities on the distribution of XCH4.
The monthly time series show that XCH4 values are elevated during the summer months when WST is high. This observation is quantitatively supported by the positive correlations identified between XCH4 and WST. Particularly during the summer and autumn periods, increasing temperatures are considered to accelerate physical and biochemical processes in lake ecosystems, which may coincide with increases in XCH4 concentrations. In contrast, the temporal behavior of NDCI and FAI differs markedly between the two lakes. In the deep, algae-dominated Lake Burdur [52], these indices exhibit relatively smooth seasonal patterns, indicating that remotely sensed algal signals primarily reflect phytoplankton dynamics. However, Lake Eğirdir is a shallow, macrophyte-dominated lake, where water levels reach their minimum during autumn [53]. During these low-water-level periods, rooted submerged macrophytes can approach or reach the water surface, thereby contributing more strongly to surface reflectance. Previous remote sensing studies have demonstrated that emergent or floating macrophytes and surface algal blooms exhibit similar spectral characteristics, making them difficult to distinguish using single spectral indices [54]. Accordingly, the pronounced short-term variability observed in NDCI and FAI over Lake Eğirdir during late summer and autumn may partly be explained by the enhanced contribution of macrophytes to the remotely sensed signal under low-water-level conditions, rather than indicating proportional changes in algae biomass or chl-a concentrations. Notably, periods of increased NDCI and FAI values, especially during summer and early autumn, temporally coincide with rises in XCH4. The moderate positive correlations observed between XCH4 and both NDCI and FAI support these observations. The literature highlights that increasing Chl-a and floating algal activity and macrophyte presence influence XCH4 dynamics consistent with these results [55,56].
Additionally, validation results obtained through TCCON ground-based observations indicate that TROPOMI XCH4 observations for 2023 and 2024 are highly consistent and compatible with TCCON data; these years show a significant improvement in MAE, bias, and correlation indicators compared to previous years.
5. Conclusions and Recommendations
This study demonstrates the importance of jointly evaluating satellite-based XCH4 concentrations with environmental parameters associated with lake ecosystems, using Lakes Eğirdir and Burdur as case study areas. The analyses show that XCH4 values are relatively higher in shallow and shallow-to-intermediate depth zones and lower in deeper areas, while at the basin scale, higher XCH4 levels spatially coincide with regions dominated by agricultural land. In addition, XCH4 concentrations are found to exhibit statistically significant positive relationships with WST and with NDCI and FAI, which represent biological activity. These results indicate that XCH4 concentrations vary in accordance with thermal and biological processes valid in lake ecosystems. For both lakes, XCH4 concentrations display pronounced seasonality, reaching higher levels during summer and autumn and declining to minimum values in winter.
CH4 formation and its transfer to the atmosphere in lake ecosystems occur under the combined influence of numerous physical, chemical, and biological processes. Therefore, a more comprehensive assessment of CH4-related processes requires the adoption of multivariate approaches rather than focusing on a limited number of environmental parameters. In this study, the analyses are restricted to satellite-based RS data, which offer important advantages by providing consistent, repeatable observations over large spatial extents.
Nevertheless, considering that column-averaged atmospheric measurements such as XCH4 do not directly represent CH4 fluxes originating from lake surfaces, the integration of in situ measurements with RS data is of particular interest for future studies. Especially in lake ecosystems, CH4 concentrations are directly related to processes such as microbial activity, oxygen conditions, organic matter accumulation, and sediment characteristics; therefore, supporting these components with field observations—together with information on surrounding land-use, including agricultural and livestock activities—will enhance the reliability of spatial and temporal assessments. In this context, field studies integrated with RS data will contribute to a more accurate interpretation of satellite-derived results and a more comprehensive understanding of CH4 dynamics.
With the increasing number and diversity of satellite sensors capable of monitoring CH4 in the future, RS-based studies are expected to play a more effective role in tracking CH4-related processes in lake ecosystems. Such multi-scale and interdisciplinary approaches will contribute to strengthening the scientific basis for the more sustainable management of lake ecosystems in the context of climate change.
Author Contributions
Conceptualization, G.N.K.N. and N.M.; Methodology, G.N.K.N.; Data collection and materials provision, G.N.K.N.; Software and Analysis, G.N.K.N.; Writing—Original draft, G.N.K.N. and N.M.; Supervision, N.M., M.K. and A.G.T.; Verification of results, N.M., M.K. and A.G.T.; Writing—Review and Editing, N.M., M.K. and A.G.T. All authors have read and agreed to the published version of the manuscript.
Funding
This research received no external funding.
Institutional Review Board Statement
Not applicable.
Informed Consent Statement
Not applicable.
Data Availability Statement
The original contributions presented in this study are included in the article. Further inquiries can be directed to the corresponding author.
Acknowledgments
This research is part of the ongoing doctoral dissertation of the first author at Istanbul Technical University, Graduate School. The authors would like to acknowledge the European Space Agency (ESA) for providing Sentinel 2 and Sentinel 5P data, the U.S. Geological Survey (USGS) for Landsat-8 data, and ESRI for providing the Sentinel 2 Land Cover dataset.
Conflicts of Interest
The authors declare no conflicts of interest.
References
- IPCC. Climate Change 2022: Mitigation of Climate Change. Contribution of Working Group III to the Sixth Assessment Report of the Intergovernmental Panel on Climate Change; Shukla, P.R., Skea, J., Slade, R., Khourdajie, A.A., Hasija, A., Malley, J., Fradera, R., Belkacemi, M., Lisboa, G., McCollum, D., et al., Eds.; Cambridge University Press: Cambridge, UK; New York, NY, USA, 2022. [CrossRef]
- Lan, X.; Thoning, K.W.; Dlugokencky, E.J. Trends in Globally-Averaged CH4, N2O, and SF6 Determined from NOAA Global Monitoring Laboratory Measurements. Version 2026-01. Available online: https://gml.noaa.gov/ccgg/trends_doi.html (accessed on 21 January 2026).
- Kirschke, S.; Bousquet, P.; Ciais, P.; Saunois, M.; Canadell, J.G.; Dlugokencky, E.J.; Bergamaschi, P.; Bergmann, D.; Blake, D.R.; Bruhwiler, L.; et al. Three Decades of Global Methane Sources and Sinks. Nat. Geosci. 2013, 6, 813–823. [Google Scholar] [CrossRef]
- Rosentreter, J.A.; Borges, A.V.; Deemer, B.R.; Holgerson, M.A.; Liu, S.; Song, C.; Melack, J.; Raymond, P.A.; Duarte, C.M.; Allen, G.H.; et al. Half of Global Methane Emissions Come from Highly Variable Aquatic Ecosystem Sources. Nat. Geosci. 2021, 14, 225–230. [Google Scholar] [CrossRef]
- Bastviken, D.; Cole, J.; Pace, M.; Tranvik, L. Methane Emissions from Lakes: Dependence of Lake Characteristics, Two Regional Assessments, and a Global Estimate. Glob. Biogeochem. Cycles 2004, 18, 1–12. [Google Scholar] [CrossRef]
- Sieczko, A.K.; Thanh Duc, N.; Schenk, J.; Pajala, G.; Rudberg, D.; Sawakuchi, H.O.; Bastviken, D. Diel Variability of Methane Emissions from Lakes. Proc. Natl. Acad. Sci. USA 2020, 117, 21488–21494. [Google Scholar] [CrossRef] [PubMed]
- Sanches, L.F.; Guenet, B.; Marinho, C.C.; Barros, N.; de Assis Esteves, F. Global Regulation of Methane Emission from Natural Lakes. Sci. Rep. 2019, 9, 255. [Google Scholar] [CrossRef] [PubMed]
- Johnson, M.S.; Matthews, E.; Du, J.; Genovese, V.; Bastviken, D. Methane Emission from Global Lakes: New Spatiotemporal Data and Observation-Driven Modeling of Methane Dynamics Indicates Lower Emissions. J. Geophys. Res. Biogeosci. 2022, 127, e2022JG006793. [Google Scholar] [CrossRef]
- Bastviken, D.; Johnson, M.S. Future Methane Emissions from Lakes and Reservoirs. Nat. Water 2025, 3, 1397–1410. [Google Scholar] [CrossRef]
- Berkeley Lab News Center. Berkeley Lab Methane Emissions from Wetlands Increase Significantly over High Latitudes. Available online: https://newscenter.lbl.gov/2024/02/15/methane-emissions-from-wetlands-increase-significantly-over-high-latitudes/ (accessed on 19 June 2025).
- Xiao, Q.; Zhang, M.; Hu, Z.; Gao, Y.; Hu, C.; Liu, C.; Liu, S.; Zhang, Z.; Zhao, J.; Xiao, W.; et al. Spatial Variations of Methane Emission in a Large Shallow Eutrophic Lake in Subtropical Climate. J. Geophys. Res. Biogeosci. 2017, 122, 1597–1614. [Google Scholar] [CrossRef]
- DelSontro, T.; Beaulieu, J.J.; Downing, J.A. Greenhouse Gas Emissions from Lakes and Impoundments: Upscaling in the Face of Global Change. Limnol. Oceanogr. Lett. 2018, 3, 64–75. [Google Scholar] [CrossRef]
- Zhang, L.; He, K.; Wang, T.; Liu, C.; An, Y.; Zhong, J. Frequent Algal Blooms Dramatically Increase Methane While Decrease Carbon Dioxide in a Shallow Lake Bay. Environ. Pollut. 2022, 312, 120061. [Google Scholar] [CrossRef] [PubMed]
- Wang, J.; Wei, Z.P.; Chu, Y.X.; Tian, G.; He, R. Eutrophic Levels and Algae Growth Increase Emissions of Methane and Volatile Sulfur Compounds from Lakes. Environ. Pollut. 2022, 306, 119435. [Google Scholar] [CrossRef] [PubMed]
- Li, M.; Peng, C.; Zhu, Q.; Zhou, X.; Yang, G.; Song, X.; Zhang, K. The Significant Contribution of Lake Depth in Regulating Global Lake Diffusive Methane Emissions. Water Res. 2020, 172, 115465. [Google Scholar] [CrossRef] [PubMed]
- Kyzivat, E.D.; Smith, L.C.; Garcia-Tigreros, F.; Huang, C.; Wang, C.; Langhorst, T.; Fayne, J.V.; Harlan, M.E.; Ishitsuka, Y.; Feng, D.; et al. The Importance of Lake Emergent Aquatic Vegetation for Estimating Arctic-Boreal Methane Emissions. J. Geophys. Res. Biogeosci. 2022, 127, e2021JG006635. [Google Scholar] [CrossRef]
- Patel, L.; Singh, R.; Thottathil, S.D. Land Use Drivers of Riverine Methane Dynamics in a Tropical River Basin, India. Water Res. 2023, 228, 119380. [Google Scholar] [CrossRef]
- Beaulieu, J.J.; DelSontro, T.; Downing, J.A. Eutrophication Will Increase Methane Emissions from Lakes and Impoundments during the 21st Century. Nat. Commun. 2019, 10, 1375. [Google Scholar] [CrossRef]
- Schubert, C.J.; Diem, T.; Eugster, W. Methane Emissions from a Small Wind Shielded Lake Determined by Eddy Covariance, Flux Chambers, Anchored Funnels, and Boundary Model Calculations: A Comparison. Environ. Sci. Technol. 2012, 46, 4515–4522. [Google Scholar] [CrossRef]
- Wan, Y.; Chen, F.; Fan, L.; Sun, D.; He, H.; Dai, Y.; Li, L.; Chen, Y. Conversion of Surface CH4 Concentrations from GOSAT Satellite Observations Using XGBoost Algorithm. Atmos. Environ. 2023, 301, 119694. [Google Scholar] [CrossRef]
- Firatli, E.; Tanik, A.; Musaoglu, N.; Engin, G. A Methodology Developed for Assessing the Potential Drivers of Water Losses in Natural Lakes at Country-Scale: Status of Türkiye. Water Environ. J. 2025, 39, 523–536. [Google Scholar] [CrossRef]
- Copernicus Sentinel-5 Precursor Mission Status. Available online: https://share.google/2uU2d4iO5eXVAn43u (accessed on 12 January 2026).
- Landsat 8/U.S. Geological Survey. Available online: https://www.usgs.gov/landsat-missions/landsat-8 (accessed on 27 August 2025).
- Mishra, S.; Mishra, D.R. Normalized Difference Chlorophyll Index: A Novel Model for Remote Estimation of Chlorophyll-a Concentration in Turbid Productive Waters. Remote Sens. Environ. 2012, 117, 394–406. [Google Scholar] [CrossRef]
- Hu, C. A Novel Ocean Color Index to Detect Floating Algae in the Global Oceans. Remote Sens. Environ. 2009, 113, 2118–2129. [Google Scholar] [CrossRef]
- Copernicus Sentiwiki S2 Mission. Available online: https://sentiwiki.copernicus.eu/web/s2-mission (accessed on 19 June 2025).
- S5P MPC Product Readme Methane TROPOMI Level 2 Methane Total Column. TROPOMI Level 2 Methane Total Column. 2023. Available online: https://share.google/xrn4nGuZ0vac0vV2q (accessed on 12 January 2026).
- Kumar, B.P.; Babu, K.R.; Anusha, B.N.; Rajasekhar, M. Geo-Environmental Monitoring and Assessment of Land Degradation and Desertification in the Semi-Arid Regions Using Landsat 8 OLI/TIRS, LST, and NDVI Approach. Environ. Chall. 2022, 8, 100578. [Google Scholar] [CrossRef]
- Makwinja, R.; Inagaki, Y.; Sagawa, T.; Obubu, J.P.; Habineza, E.; Haaziyu, W. Monitoring Trophic Status Using in Situ Data and Sentinel-2 MSI Algorithm: Lesson from Lake Malombe, Malawi. Environ. Sci. Pollut. Res. 2022, 30, 29755–29772. [Google Scholar] [CrossRef] [PubMed]
- Liu, M.; Ling, H.; Wu, D.; Su, X.; Cao, Z. Sentinel-2 and Landsat-8 Observations for Harmful Algae Blooms in a Small Eutrophic Lake. Remote Sens. 2021, 13, 4479. [Google Scholar] [CrossRef]
- Pearson, K., VII. Mathematical Contributions to the Theory of Evolution.—III. Regression, Heredity, and Panmixia. Philos. Trans. R. Soc. Lond. Ser. A 1896, 187, 253–318. [Google Scholar] [CrossRef]
- TCCON. Data Archive. Available online: https://tccondata.org/ (accessed on 11 December 2025).
- Sha, M.K.; Langerock, B.; Blavier, J.F.L.; Blumenstock, T.; Borsdorff, T.; Buschmann, M.; Dehn, A.; De Mazière, M.; Deutscher, N.M.; Feist, D.G.; et al. Validation of Methane and Carbon Monoxide from Sentinel-5 Precursor Using TCCON and NDACC-IRWG Stations. Atmos. Meas. Tech. 2021, 14, 6249–6304. [Google Scholar] [CrossRef]
- Lindqvist, H.; Kivimäki, E.; Häkkilä, T.; Tsuruta, A.; Schneising, O.; Buchwitz, M.; Lorente, A.; Martinez Velarte, M.; Borsdorff, T.; Alberti, C.; et al. Evaluation of Sentinel-5P TROPOMI Methane Observations at Northern High Latitudes. Remote Sens. 2024, 16, 2979. [Google Scholar] [CrossRef]
- Prajesh, P.J.; Ragunath, K.; Gordon, M.; Neethirajan, S. Satellite-Based Seasonal Fingerprinting of Methane Emissions from Canadian Dairy Farms Using Sentinel-5P. Climate 2025, 13, 135. [Google Scholar] [CrossRef]
- Eğirdir Gölü’nde “Metan Gazı” Yangını | Isparta Haberleri. Yeni Şafak. Available online: https://www.yenisafak.com/gundem/Eğirdir-golunde-metan-gazi-yangini-4639385 (accessed on 11 December 2025). (In Turkish)
- Eğirdir Gölü’nde “metan Gazı” Yangını - Son Dakika Haberleri. Available online: https://www.hurriyet.com.tr/video/egirdir-golunde-metan-gazi-yangini-42506593 (accessed on 11 December 2025). (In Turkish)
- Esri/Sentinel-2 Land Cover Explorer. Available online: https://livingatlas.arcgis.com/landcoverexplorer/#mapCenter=28.71471%2C42.45767%2C6.65741130826159&mode=step&timeExtent=2017%2C2024&year=2024 (accessed on 14 May 2025).
- Kaçikoç, M.; Beyhan, M. Hydrodynamic and Water Quality Modeling of Lake Eğirdir. Clean Soil Air Water 2014, 42, 1573–1582. [Google Scholar] [CrossRef]
- Duan, H.; Xiao, Q.; Qi, T.; Hu, C.; Zhang, M.; Shen, M.; Hu, Z.; Wang, W.; Xiao, W.; Qiu, Y.; et al. Quantification of Diffusive Methane Emissions from a Large Eutrophic Lake with Satellite Imagery. Environ. Sci. Technol. 2023, 57, 13520–13529. [Google Scholar] [CrossRef]
- Bartosiewicz, M.; Maranger, R.; Przytulska, A.; Laurion, I. Effects of Phytoplankton Blooms on Fluxes and Emissions of Greenhouse Gases in a Eutrophic Lake. Water Res. 2021, 196, 116985. [Google Scholar] [CrossRef] [PubMed]
- Xiao, Q.; Duan, H.; Qin, B.; Hu, Z.; Zhang, M.; Qi, T.; Lee, X. Eutrophication and Temperature Drive Large Variability in Carbon Dioxide from China’s Lake Taihu. Limnol. Oceanogr. 2022, 67, 379–391. [Google Scholar] [CrossRef]
- Sepulveda-Jauregui, A.; Hoyos-Santillan, J.; Martinez-Cruz, K.; Walter Anthony, K.M.; Casper, P.; Belmonte-Izquierdo, Y.; Thalasso, F. Eutrophication Exacerbates the Impact of Climate Warming on Lake Methane Emission. Sci. Total Environ. 2018, 636, 411–419. [Google Scholar] [CrossRef] [PubMed]
- Jansen, J.; Thornton, B.F.; Wik, M.; MacIntyre, S.; Crill, P.M. Temperature Proxies as a Solution to Biased Sampling of Lake Methane Emissions. Geophys. Res. Lett. 2020, 47, e2020GL088647. [Google Scholar] [CrossRef]
- Xu, J.; Li, W.; Xie, H.; Wang, Y.; Wang, L.; Hu, F. Long-Term Trends and Spatiotemporal Variations in Atmospheric XCH4 over China Utilizing Satellite Observations. Atmosphere 2022, 13, 525. [Google Scholar] [CrossRef]
- Nisbet, E.G.; Manning, M.R.; Dlugokencky, E.J.; Fisher, R.E.; Lowry, D.; Michel, S.E.; Myhre, C.L.; Platt, S.M.; Allen, G.; Bousquet, P.; et al. Very Strong Atmospheric Methane Growth in the 4 Years 2014–2017: Implications for the Paris Agreement. Glob. Biogeochem. Cycles 2019, 33, 318–342. [Google Scholar] [CrossRef]
- Abujayyab, S.K.M.; Almotairi, K.H.; Alswaitti, M.; Amr, S.S.A.; Alkarkhi, A.F.M.; Taşoğlu, E.; Hussein, A.M. Effects of Meteorological Parameters on Surface Water Loss in Burdur Lake, Turkey over 34 Years Landsat Google Earth Engine Time-Series. Land 2021, 10, 1301. [Google Scholar] [CrossRef]
- Paranaíba, J.R.; Aben, R.; Barros, N.; Quadra, G.; Linkhorst, A.; Amado, A.M.; Brothers, S.; Catalán, N.; Condon, J.; Finlayson, C.M.; et al. Cross-Continental Importance of CH4 Emissions from Dry Inland-Waters. Sci. Total Environ. 2022, 814, 151925. [Google Scholar] [CrossRef]
- Encinas Fernández, J.; Peeters, F.; Hofmann, H. On the Methane Paradox: Transport from Shallow Water Zones Rather than in Situ Methanogenesis Is the Major Source of CH4 in the Open Surface Water of Lakes. J. Geophys. Res. Biogeosci. 2016, 121, 2717–2726. [Google Scholar] [CrossRef]
- Smith, P.; Reay, D.; Smith, J. Agricultural Methane Emissions and the Potential Formitigation. Philos. Trans. R. Soc. A Math. Phys. Eng. Sci. 2021, 379, 20200451. [Google Scholar] [CrossRef]
- Smith, K.A. The Impact of Agriculture and Other Land Uses on Emissions of Methane and Nitrous and Nitric Oxides. Environ. Sci. 2005, 2, 101–108. [Google Scholar] [CrossRef]
- Kokal, A.T.; Kacikoc, M.; Musaoglu, N.; Tanik, A. Remote Sensing Application in Water Quality of Lake Burdur, Türkiye. Photogramm. Eng. Remote Sens. 2024, 90, 85–87. [Google Scholar] [CrossRef]
- Kacikoc, M.; Mesta, B.; Karaaslan, Y. Evaluating Changes in Water Levels during Periods of Normal Flow and Drought with a Specific Emphasis on Water Withdrawal. J. Water Clim. Change 2025, 16, 1073–1097. [Google Scholar] [CrossRef]
- Xue, K.; Ma, R.; Cao, Z.; Shen, M.; Hu, M.; Xiong, J. Monitoring Fractional Floating Algae Cover Over Eutrophic Lakes Using Multisensor Satellite Images: MODIS, VIIRS, GOCI, and OLCI. IEEE Trans. Geosci. Remote Sens. 2022, 60, 4211715. [Google Scholar] [CrossRef]
- Liang, X.; Zhang, X.; Sun, Q.; He, C.; Chen, X.; Liu, X.; Chen, Z. The Role of Filamentous Algae Spirogyra Spp. in Methane Production and Emissions in Streams. Aquat. Sci. 2015, 78, 227–239. [Google Scholar] [CrossRef]
- Hilt, S.; Grossart, H.P.; McGinnis, D.F.; Keppler, F. Potential Role of Submerged Macrophytes for Oxic Methane Production in Aquatic Ecosystems. Limnol. Oceanogr. 2022, 67, S76–S88. [Google Scholar] [CrossRef]
Disclaimer/Publisher’s Note: The statements, opinions and data contained in all publications are solely those of the individual author(s) and contributor(s) and not of MDPI and/or the editor(s). MDPI and/or the editor(s) disclaim responsibility for any injury to people or property resulting from any ideas, methods, instructions or products referred to in the content. |
© 2026 by the authors. Licensee MDPI, Basel, Switzerland. This article is an open access article distributed under the terms and conditions of the Creative Commons Attribution (CC BY) license.