Abstract
As the largest exporter in the global solid tire market, Sri Lanka’s natural rubber supply chain plays a critical role in global production, yet its social dimension remains largely unaddressed. Our study aims to assess the social performance of a Sri Lankan natural rubber supply chain in solid tire manufacturing using social life cycle assessment (S-LCA) in a cradle-to-gate approach. Study adapts “More Good and Less Bad” method which captures both positive and negative social impacts, addressing traditional S-LCAs’ focus on negative impacts solely. It applies to updated methodological sheets to distinguish “good” and “bad” social conditions across subcategories based on baseline compliance. Social impacts were quantified using a Social Performance Index (SPI), calculated by multiplying social performance levels by working hours at the organizational level, comprising SPIgood for good social impacts and SPIbad for bad social impacts. Data was collected through stakeholder interviews, with working hours calculated using a “working hour model”. Results showed mixed social performance across 39 subcategories, identifying six social hotspots: promoting social responsibility (27.67% less bad, 72.32% more good), wealth distribution (26.87% less bad, 73.13% more good), commitment to sustainability issues (100% less bad), social benefits (100% less bad), safe and healthy living conditions (100% less bad), and hours of work (88.74% less bad, 11.26% more good).
1. Introduction
Sri Lanka was the world’s largest solid tire exporter in 2023, with 28% of the world’s solid tire exports and being 3.61% of Sri Lanka’s total exports [1,2,3]. This global position is strongly supported by the Sri Lankan natural rubber supply chains, which produce key upstream products of solid tires, i.e., ribbed smoked sheets (RSS), through a production system dominated by smallholder operations alongside state-owned and private estates [4]. The supply chain involves multiple actors from latex tappers to RSS processors, brokers and tire manufacturers. While environmental sustainability initiatives exist, systematic social sustainability assessment remains largely absent in the sector. The RSS manufacturing supply chain, starting from upstream to downstream, consumes over hundreds of natural and synthetic raw materials, fuel, water, electricity and manpower [5]. As a result, the solid tire manufacturing industry is highly vulnerable to a wide range of both environmental and social impacts throughout its entire life cycle, from raw material extraction to the end-of-life stage. For instance, its upstream raw material manufacturing processes, like natural rubber production, generate pollutants like nitrogen oxides (NOX), benzene and polycyclic aromatic hydrocarbons (PAH), which threaten human health and the environment [6]. Additionally, the solid tire manufacturing process consumes lots of water for cooling and electricity for machinery. These causes can lead to environmental impacts.
Apart from environmental impacts, social impacts on relevant stakeholders, such as human health issues, child labor, forced labor, other violations of labor and human rights, unethical market practices and consumer safety can negatively impact social sustainability. For instance, in the Sri Lankan context, most people who engage in upstream primary rubber product processing receive a low income, making them more vulnerable to labor exploitation [7,8]. Also, wastewater generated from the raw rubber processing contains lots of chemicals that can affect society in a harmful way, and there are incidents and reported conflicts regarding this pollution [7]. When we move away from the Sri Lankan context that produces primary rubber materials and focus on the global context that brings in other raw materials, in 2020, over 160 million children aged 5 to 17 years engaged in child labor, and 79 million of them engaged in hazardous work [9]. Furthermore, 27.6 million people are trapped in forced labor at any given time; meanwhile, more than 3.3 million of the total forced labor are children [10]. Furthermore, it should be noted that once the tires have completed their used phase and reach the end-of-life stage, they still have lots of environmental and social impacts [11,12]. For instance, trades in used tires remain unhindered between countries due to the lack of recognition under the Basel Convention [13], and unfortunately, the majority of used-tire trade flows toward developing countries, compelling them to take responsibility for the environmental and social hazards coming from waste [14,15]. These facts demonstrate that the entire life cycle of tires, from raw material extraction to their end-of-life, results in significant environmental and social impacts and that urgent attention is necessary.
With these social concerns, which can lead to climate change and limited resource availability, the world today is at a critical point in thinking about the long-term environmental and social sustainability of global supply chains. Consequently, sustainable development has become a focal point worldwide. The main objective of sustainable development is to fulfill and sustain the needs of the present generation without affecting the ability to meet the needs of future generations [16,17].
When addressing the sustainability of products, processes and services, life cycle thinking approaches all three pillars of sustainability and provides a comprehensive assessment of the environmental, social and economic impacts of a product, process or service, along with its life cycle from raw material extraction to the end-of-life phase [18,19]. The same as Social Life Cycle Assessment is a tool that is used to systematically assess the social impacts of a product throughout all of its life cycle stages, from raw material extraction to its disposal [7,20,21,22]. Following the analysis of the existing scenario, E-LCA studies such as Dong et al. [6]; Katarzyna et al. [23]; Piotrowska et al. [24]; Shanbag and Manjare [25]; and Sun et al. [26] have already addressed the environmental sustainability aspect of tire manufacturing. However, a critical research gap exists in the social sustainability assessment of natural rubber supply chains. While the E-LCA studies have addressed the environmental impacts of tire manufacturing [6,23,24,25,26], the social pillar remains underexplored.
With the growing consumer preference for environmentally and socially sustainable tires [27,28], driven by increased awareness of natural resource depletion and climate change, addressing challenges on social and environmental pillars has become vitally important in the solid tire manufacturing industry. Being one of the largest solid tire exporters in the world, it is crucial to conduct studies to assess both environmental and social impacts on the Sri Lankan solid tire value chain for adopting “Environmental, Social, and Governance” strategies, which can ensure alignment with global sustainability standards and improve supply chain traceability and sustainability [29].
However, supply chain sustainability cannot be defined solely by environmental performance, as social issues such as inequality, labor exploitation and human rights violations undermine true sustainability. The UNEP/SETAC guidelines (2009) [30] provide a robust framework for S-LCA, proposing 40 subcategories across six key stakeholder groups—workers, local communities, society, children, value chain actors and consumers—to measure social performance. Yet, existing S-LCA frameworks predominantly focus on negative social impacts, limiting their ability to capture the full spectrum of social performance across complex agricultural-industrial supply chains characterized by high informality and limited traceability, which was a context prevalent across rubber-producing regions.
This study focuses on the social impact associated with the Sri Lankan natural rubber supply chain in the context of industrial solid tire manufacturing. The “More Good and Less Bad” method described in Dunuwila et al. [31] was applied in this assessment to capture the positive and negative aspects of the supply chain (see Section 2 for details). We believe that taking the first step, as the largest exporter, to initiate comprehensive social assessments towards solid tire manufacturing and identifying hotspots may influence and serve as an example to other regions as well, which may lead to identifying region-specific social hotspots and adopting true sustainability strategies for the solid tire industry.
2. Materials and Methods
2.1. More Good and Less Bad Method
The “More Good and Less Bad” method serves as the conceptual foundation for this study. The concept of the “More Good and Less Bad” method proposed by Dunuwila et al. [31] identifies that the whole social status of an organization or a supply chain can be identified through its performance in three social domains, i.e., basic requirement, good social domain, and bad social domain (see Figure 1). The basic requirement shows the threshold criteria to avoid any social issues in an organization. The good domain stands for the performance of an organization beyond the basic requirements; meanwhile, the bad domain stands for the unfulfillment of the basic requirements.
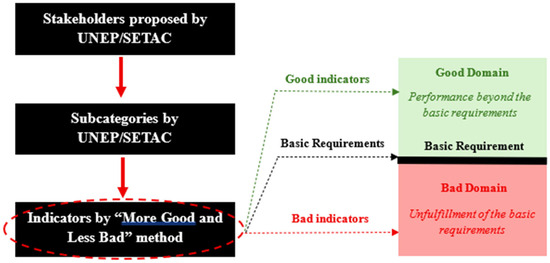
Figure 1.
Social domains proposed in the “More Good and Less Bad” mehtod in Dunuwila et al. [31].
Impacts are evaluated using the Social Performance Index (SPI), which is obtained by multiplying the social performance level by the corresponding working hours [31]. SPI values are proposed to separately calculate the magnitude of social performances in good and bad social domains, which are represented by SPIgood and SPIbad, respectively. Social performance level is determined using a decision tree proposed by Dunuwila et al. [31]. The decision tree assesses the subcategories with respect to the performance of the indicators. The decision tree evaluates the performance of indicators at seven levels, with a respective marking scheme of −3, −2, −1, 0, +1, +2 and +3. Working hours are calculated through the “working hour model” proposed in Pucciarelli et al. [32].
The “More Good and Less Bad” method complements the ISO 14075:2024 [33,34] framework and is implemented through the following steps:
- Goal and scope definition
- Inventory analysis
- Impact assessment
- Interpretation
Going beyond the core framework, we added “Hotspot Analysis” to prioritize improvement efforts (see Figure S13 for more details on the framework).
2.2. Goal and Scope Definition
The goal of this study is to evaluate the social footprint of the natural rubber (RSS) supply chain within industrial solid tire manufacturing. The functional unit is defined as “manufacturing one tonne of solid industrial tires.” Since the tire factory does not classify or record data separately by tire type, quantifying impacts for each specific type (resilient, cured-on and press-on) is impractical. Therefore, the product system is defined as industrial solid tires as a whole, rather than disaggregating by type.
The scope of the study follows a cradle-to-gate approach (see Figure 2). It covers all processes from latex tapping at plantations, through primary rubber processing (RSS production), industrial solid tire manufacturing and packaging. Due to the lack of reliable data, the distribution of ribbed smoked sheets (RSS) and industrial solid tires to final destinations is excluded from the system boundary.
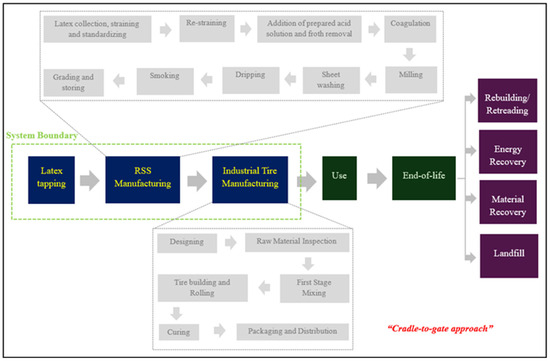
Figure 2.
Product life cycle of industrial solid tires and the considered system boundary for the study.
“Working hours” serve as the activity variable in this study. They represent the labor input associated with each unit process in the supply chain and enable aggregation of social impacts across processes [31,32,35].
2.3. Inventory Analysis
Inventory analysis is the phase in which data collection is performed [36,37].
2.3.1. Supply Chain Mapping
Our study identified that the true origin of ribbed smoked sheets (RSS) that come from a tire factory cannot be traced in a practical, real-world scenario for the Sri Lankan context. Therefore, the study adapted a hypothetical supply chain based on interviews with the scientists from the Rubber Research Institute, Sri Lanka, and the respective tire factory. According to the structured interviews, the production and supply of Ribbed Smoked Sheets (RSS) come from 100% Sri Lankan natural rubber supply chains. This RSS purchasing is dominated by smallholder manufacturing, which contributes ca. 70% of the total RSS purchase of the tire factory. In comparison, factory-level RSS manufacturing accounts for only 30%.
The representative hypothetical supply chain is derived using one tire factory, two factory-level RSS manufacturers with their two respective plantations, and five smallholder RSS manufacturers with their five respective plantations. An assumption is made that the two factory-level RSS manufacturing has an equal contribution to the 30% allocated for RSS factories, and that the five smallholder RSS manufacturing has an equal contribution to the 70% allocated for RSS smallholders. This means each factory-level RSS manufacturing makes a 15% contribution (0.15 of the contribution score) to the supply chain, and each smallholder-level RSS manufacturing makes a 14% contribution (0.14 of the contribution score) to the supply chain. The contribution score is a value given to each supply chain actor based on their contribution to the solid tire supply chain.
2.3.2. Element Selection
Following UNEP/SETAC guidelines [30], the “More Good and Less Bad” method identifies six potential stakeholder groups for tracing the social performance of the solid industrial tire supply chain: workers, local community, society, children, value chain actors and consumers. Relevant subcategories for each group were first identified using the UNEP/SETAC S-LCA methodological sheets [30], then refined through expert consultation and a review of the scholarly literature (see Table 1 and Table 2). For more details, please refer to Table 3 and Table S2.

Table 1.
Experts consulted regarding tire manufacturing.
Table 2.
Experts consulted regarding RSS manufacturing.
Table 3.
Applicability of subcategories.
Experts were chosen using a purposive sampling strategy that aimed to guarantee technical competence while reducing bias, with selection criteria that required at least five years of practical experience in relevant fields such as rubber cultivation, RSS processing, or tire manufacturing, active participation in operational or managerial decision-making and proven understanding of social and environmental sustainability matters within their industry; to mitigate bias, we implemented three safeguards, first of which involved recruiting experts from a range of organizations, including research institutions, industry associations and manufacturing plants, to capture different viewpoints.
The six stakeholder groups considered in this study were defined as follows. The workers category included rubber tappers, RSS factory workers, tire factory laborers and non-executive staff; however, for smallholders, this category was not applicable as production is carried out solely by household owners without hired labor or formal employer–employee relationships (i.e., hence, we can disregard all subcategories under the “workers” category in the smallholder context). The local community was defined, following Dunuwila et al. [8], as individuals residing within a 6 km radius of the respective plantation or factory, with factory workers living in the community and their family members excluded to minimize bias. The society category encompassed populations beyond this 6 km boundary. Value chain actors comprised factory managers, state managers, suppliers, brokers and owners of smallholder RSS units. Children were defined as individuals under 18 years of age within both the local community and society, although this category was not applicable to smallholders. The consumer category was limited to directly traceable buyers, since most RSS is sold to brokers and collection centers. Tire factories were identified as essential consumers of RSS; however, Factory 02 did not sell directly to buyers, and in the plantations latex was sold directly to in-house RSS facilities, making the consumer category inapplicable at these stages.
Two subcategories were identified as not applicable to the scope of this study: “Respect for indigenous rights” under the local community (because indigenous populations in Sri Lanka do not reside within the 6 km local community boundary defined for this study) and “Health issues for children as consumers” under consumers (because industrial solid tires are not consumer products used by children). The applicability of all other subcategories was determined at the organizational level, with non-relevant subcategories excluded accordingly; once excluded, their associated indicators were also considered not applicable. Nonetheless, even within applicable subcategories, some indicators were found to be irrelevant to the industrial solid tire supply chain in Sri Lanka. For example, subcategories/indicators proposed under the “More Good and Less Bad” framework are less suitable for the upstream stages of the supply chain, where RSS manufacture is dominated by smallholders who lack formal organizational structures. Indicators that assume structured management practices (i.e., documented policies, formal training programs or third-party certifications and so on) are therefore not meaningful in this context. Similarly, certain indicators applied to tire manufacturing require careful consideration, as their methodological approaches may not align with the Sri Lankan setting. To address these limitations, indicator selection was refined at an early stage, and the applicability of each indicator was validated through expert consultation via semi-structured interviews (see Table 1 and Table 2).
2.3.3. Data Collection
Data collection for the applied model was carried out in two parts. The first phase focused on gathering information for the “working hour model”. Data for the “working hour model” were extracted through field interviews and organization-specific reports (see Table 4, Sections S1 and S3). The second phase involved collecting data for the evaluation of inventory indicators.
Table 4.
Data input and their data source for the “working hour model”.
Data collection for the applied model was carried out in two phases. The first phase focused on gathering information for the working hour model through field interviews and organization-specific reports. The second phase involved collecting data to evaluate inventory indicators.
For the indicator evaluation, both primary and secondary data sources were used [42]. Primary data collection included management interviews, stakeholder interviews and site observations for verification. Secondary data sources comprised reports and documents from online platforms.
The evaluation process began with management interviews to assess indicator fulfillment. These assessments were then cross-validated through stakeholder interviews, site observations and supporting documentation (i.e., certifications, training records and payroll documentation) where applicable. The evaluation methodology followed the questionnaire proposed by Dunuwila et al. [31]. In the first stage, the assessment determined whether basic requirements were met—indicators meeting requirements were marked as “yes,” while those not meeting them were marked as “no.” If all basic requirements were fulfilled, the assessment proceeded to evaluate the “good” indicators. Conversely, if basic requirements were not met, the process moved to assess the “bad” indicators (see Figure 3 and Figure S1 and Section S3).
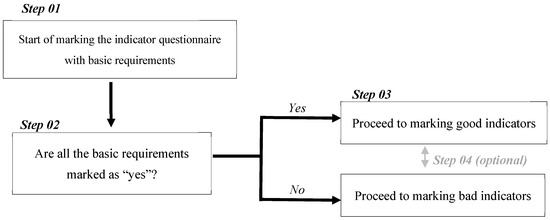
Figure 3.
Overview of methodological steps for indicator assessment.
2.4. Impact Assessment
In this phase, the magnitude of social impacts across the supply chain was calculated [36]. First, the social impacts at the organizational level were assessed. Secondly, these impacts were aggregated to quantify the overall social impact across the entire natural rubber supply chain.
2.4.1. Calculation of Social Performance Index (SPI)
The magnitude of the social impact was evaluated following the Social Performance Index (SPI). The SPI is calculated as follows:
The “More Good and Less Bad” method proposes two types of SPI values to separately calculate the magnitude of social performances in good and bad social domains, i.e., SPIgood (see Equation (2)) and SPIbad (see Equation (3)) [31].
- : Summation of good SPIs along the subject supply chain at subcategory k.
- : Good SPI of the ith actor of the subject supply chain at subcategory k.
- : Summation of bad SPIs along the subject supply chain at subcategory k.
- : Bad SPI of the ith actor of the subject supply chain at subcategory k.
- : Total number of actors along the subject supply chain.
Working hours per unit are calculated at the organizational level by substituting the collected data from audited factories into the “working hour model” [31]. Social performance levels are evaluated using the novel decision tree proposed by Dunuwila et al. [31]. An illustrative example at the organizational level is provided in Dunuwila et al. [31] for audited RSS factory 01.
2.4.2. Aggregation of Social Impacts
At the RSS processing level, the SPI quantifies social performance per unit of RSS (1 tonne of RSS) processed. However, since the production of industrial solid tires requires varying quantities of RSS, directly using the SPI per unit of RSS would not accurately represent the contribution of RSS processing to the overall social performance of the final product. To address this, the SPI is multiplied by a derived weighting factor (see Equation (4) and Figure 4) that accounts for the proportion of RSS incorporated into our defined functional unit (one tonne of industrial solid tires), thereby ensuring that the social performance at the RSS stage is appropriately scaled relative to one tonne of industrial solid tires.
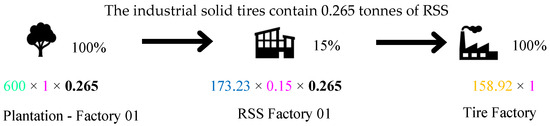
Figure 4.
An example of aggregation (Factory level RSS manufacturing—RSS Factory 01): Stakeholder—Local Community; Subcategory—Access to material resources. Pink, green, blue and orange colors show the contribution score at each level, calculated SPIgood values at the plantation stage, calculated SPIgood values at the RSS processing stage and calculated SPIgood values at the tire factory, respectively. (Given that 0.265 tonnes of RSS are utilized in the production of 1 tonne of solid tires, the Social Performance Index (SPI) values associated with 1 tonne of RSS were multiplied by 0.265 to obtain the aggregated SPI from the upstream RSS supply chain per 1 tonne of industrial solid tires).
The objective of this step is to derive an aggregated SPIgood and/or SPIbad value for each subcategory that represents the overall social performance across the entire supply chain. This involves integrating the organizational-level SPI values (calculated for each entity under each subcategory) to the supply chain level for industrial solid tire production.
Through this aggregation process, a single SPIgood and/or SPIbad value is obtained for each subcategory, reflecting the cumulative social performance of the natural rubber supply chain in Sri Lankan industrial solid tire manufacturing. Critically, SPIgood and/or SPIbad values are aggregated separately throughout this process to prevent the neutralization of positive and negative social impacts along the supply chain.
When a supply chain actor sources from multiple suppliers, the SPI values from these suppliers are averaged (see Equation (5)). In this study, two RSS factories supply factory-level manufactured RSS to the tire factory, while five smallholders supply smallholder-level manufactured RSS. Accordingly, the SPI values from the two factory-level suppliers were averaged to obtain a mean factory-level SPI, and the values from the five smallholder suppliers were averaged separately to obtain a mean smallholder-level SPI.
where n: number of RSS suppliers (In our study’s supply chain, n = 2 for factory-level RSS manufacturing and n = 5 for smallholder level RSS manufacturing)
The two averaged SPIgood/bad values obtained from factory-level RSS manufacturing and smallholder-level RSS manufacturing were then added to the SPI value of the tire manufacturing factory to calculate the final aggregated SPIgood/bad values for the entire supply chain (see Equation (6)).
2.5. Hotspot Analysis
Social hotspot analysis was conducted to identify supply chain processes with the most significant “bad” social impacts. This analysis reveals processes with higher negative SPI values, indicating areas of concern, and employed Pareto analysis, a decision-making tool based on the principle that approximately 80% of effects stem from 20% of causes. To implement this, SPIbad values for each subcategory were ranked in descending order, and cumulative percentages were calculated to determine which processes collectively accounted for the majority of negative social impacts.
Once social hotspots are identified, the analysis can be traced back to the indicator level to understand the root causes of negative organizational performance. This traceability reveals which basic requirements are unfulfilled and which indicators trigger the ‘bad’ classification, resulting in negative SPI values. Based on these findings, improvement options are proposed to address the identified deficiencies. These improvements aim to shift the organization’s performance from the ‘bad’ domain to the ‘good’ domain by meeting or exceeding basic requirements. The potential pathways for improvement are described using four novel concepts from the ‘More Good and Less Bad’ method (see Table 5).
Table 5.
Novel concepts proposed for the improvement of movements in the “More Good and Less Bad” method by Dunuwila et al. [31].
2.6. Interpretation
This is the final step of the framework. This step analyzes and interprets the outcomes of each stage in the methodology [37]. This is an iterative approach.
3. Results and Discussion
The aggregated SPI results reveal both ‘good’ and ‘bad’ social impacts across stakeholder groups in the natural rubber supply chain for industrial solid tire manufacture. While the majority of subcategories show positive SPI values, critical gaps persist in specific social dimensions.
According to the final aggregated values (see Figure 5, Tables S3 and S4), our findings reveal that the downstream of the supply chain (solid tire manufacturing) has more sustainability-oriented manufacturing initiatives than the upstream of the supply chain (latex tapping and RSS processing). Only 2 subcategories out of 39 go towards the bad domain in tire manufacturing, while a considerable number of subcategories in the upstream processes move towards the bad domain.
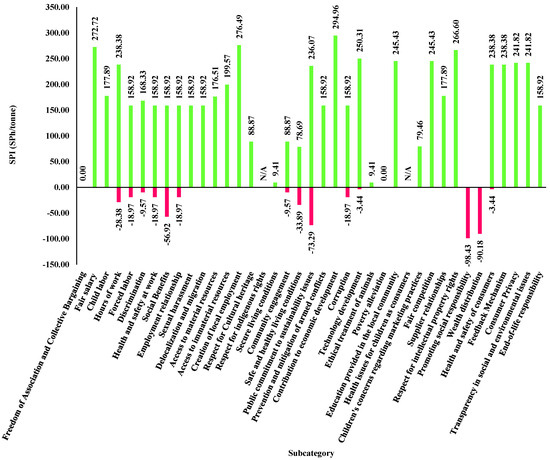
Figure 5.
Final aggregated SPI values for the considered system boundary (SPI and SPh stand for social performance index and social performance hours, respectively).
The structural differences between the upstream and downstream segments reflect the deeper sociocultural and institutional realities of the studied supply chain. Smallholder dominance in RSS manufacturing (70% contribution) creates specific challenges. Labor informality is prevalent, as smallholder operations function as household production units where family members perform all tasks without formal employer–employee relationships, wage arrangements or contractual protections. Smallholders typically lack the administrative infrastructure, technical expertise and financial resources to implement structured sustainability programs. Rural smallholder areas often have limited access to government extension services, labor inspections and social welfare programs, reflecting reduced state presence in these regions. Smallholders typically sell to brokers and collection centers rather than directly to end-users, insulating them from downstream sustainability requirements and pressures. Limited exposure to global sustainability frameworks means that many smallholders remain unaware of emerging requirements such as EUDR. As Sri Lanka dominates the global solid tire market, Sri Lankan manufacturers face intense competition to maintain their market position. Social sustainability has become a critical component of this competitive advantage, driving manufacturers to prioritize performance improvements in this area.
In contrast, the exact opposite scenario can be seen in the RSS manufacturing sector in Sri Lanka. Sri Lankan RSS manufacturing is dominated by smallholders. They do not pay much attention to structured sustainability issues. This shows in the results of the subcategory “Public commitments to sustainability issues” for smallholders. All five smallholders hold the “worst (−3)” social performance level, and none of the factory-level RSS manufacturing proceeded to the good domain; meanwhile, the downstream holds the “best (+3)” social performance level for this subcategory. This depicts that there is less accountability for the upstream for implementing sustainability goals and the exact opposite is true for the downstream. The downstream not only implement sustainability goals, but they also influence other supply chain actors (for more details, see good indicators under subcategory “Public commitment to sustainability issues” available in Dunuwila et al. [31]) to achieve sustainability. However, we have identified that this may change soon with the implementation of more environmental regulations, like the European Union’s Regulation on Deforestation (EUDR), because these regulations not only make companies trace their non-transparent supply chains but also establish the fact that true sustainability does not solely depend on one downstream product system but goes beyond that. In addition to influencing the downstream to trace their source materials, regulations like EUDR encourage smallholders to be more accountable towards sustainable initiatives, contributing to the fight against climate change and social issues that are rapidly arising globally.
Workers experience substantial positive impacts in key areas such as fair salary and child labor, indicating effective wage structures and compliance with child labor prevention measures across the supply chain. However, negative scores in six subcategories, most notably social benefits (−56.92 SPh/tonne), suggest shortcomings in employee welfare provisions, particularly at the RSS factory level. Freedom of Association (0) indicates that collective bargaining rights remain unaddressed, potentially limiting workers’ ability to negotiate for better conditions. For the “Local Community”, the supply chain positively influences local employment creation (276.49 SPh/tonne) and resource access. Nonetheless, negative performance in safe and healthy living conditions (−33.89 SPh/tonne) and community engagement (−9.57 SPh/tonne) highlights a lack of adequate environmental health safeguards and insufficient participatory engagement processes. The “Society” shows exceptionally high positive contributions in economic development (300.65 SPh/tonne) and technology development, reflecting the industry’s role in advancing innovation and macroeconomic growth. However, significant negative impacts in public commitment to sustainability issues (−73.29 SPh/tonne) show the need for companies’ transparency, sustainability communication and alignment with broader societal goals. For “Children”, the results are entirely positive, with strong performance in education provided in the local community (245.43 SPh/tonne), suggesting active investment in educational access. “Value Chain Actors” show positive SPI values in respect for intellectual property rights (266.60 SPh/tonne) and fair competition, which contrast sharply with the two worst negative impacts across the entire supply chain: promoting social responsibility (−98.43 SPh/tonne) and wealth distribution (−90.18 SPh/tonne). “Consumers” generally benefit from positive impacts across all assessed subcategories, with consistent SPIgood values. The minimal negative score for health and safety of consumers (−3.44 SPh/tonne) suggests that safety concerns are relatively minor but still present.
The greater negative SPIs in ‘Promoting social responsibility’ and ‘Wealth distribution’ reflect deep power imbalances within the supply chain. Smallholders operate in a market structure where brokers and collection centers control prices with little transparency. Without storage facilities, market information or collective bargaining power, smallholders have limited ability to negotiate fair terms. Despite doing the labor-intensive work of cultivation and tapping, they receive only a small fraction of the final product’s value.
The social responsibility problem goes beyond missing formal commitments—it reflects the lack of any practical way for studied smallholders to demonstrate or verify their social performance. Tire manufacturers can create auditable sustainability programs because they work in formal business settings with access to third-party certifications. Smallholders, however, have no access to such verification systems, cannot afford certification, and see no economic benefit from improving social performance since buyers do not pay more for it.
Our study identifies that one of the biggest concerns of studying the natural rubber supply chains in Sri Lanka is identifying the true origin of the primary rubber product, i.e., RSS. Being unable to trace the true origin of RSS is not only a challenge for researchers but also a critical issue for organizations to ensure ethical sourcing and supply chain transparency [43]. Therefore, we have derived a hypothetical supply chain based on the procurement ratios of the tire factory. However, with regulations like the European Union Deforestation Regulation (EUDR), which are going to be implemented in the rubber sector by the end of this year, 30 December 2025 for large operators and traders, while micro and small companies will have to apply it as of 30 June 2026 [44], organizations will soon have no other choice but to trace the true origins of their RSS. In that case, the supply chain will be transparent in the near future for the rubber sector, and organizations can implement the same procedure to implement our methodology to evaluate the social footprint of their own supply chains. This may only increase accuracy at the organizational level.
Also, one of the key concerns we identified during our study is the omission of the “worker” stakeholder category in the smallholder sector. We have considered the “worker” category as the person who gets paid a daily or monthly wage. However, in the smallholder sector, the owner operates the whole manufacturing procedure as well as the latex tapping. Therefore, based on our consideration, workers are excluded at the smallholder level of RSS manufacturing. However, once the stakeholder category gets excluded, the subcategories under that particular stakeholder automatically become not applicable. In that case, we have identified that the subcategory “Health and safety at work” gets eliminated automatically as well. Even though the owner is not considered a worker, they have their own health and safety at work. However, we argue that one’s own safety is not something that should be provided by a third party on a household basis; it is something that a person should follow for his/her sake. In contrast, we observed in our field interviews that no smallholder follows proper safety measures in latex taping or RSS processing. Therefore, we identify this as a limitation because of the structure of the UNEP/SETAC guidelines. A similar kind of scenario occurs for the subcategory “Respect for indigenous property rights” proposed under the stakeholder category, local community. This subcategory becomes not applicable because it comes under the local community, and we have set our geographic boundary following the published literature, like Dunuwila et al. [8], which determines that the local community includes people who live within a 6 km radius from the organization, and society includes people who live beyond that 6 km radius. Therefore, indigenous people do not live in the local community in the Sri Lankan context. If this subcategory came under “Society”, then it would be applicable to our scenario.
Furthermore, when comparing the not applicable subcategories and the subcategories such as “Freedom of association and collective bargaining” which have a “Basic (0)” performance level, they have the same contribution to the supply chain. In simple terms, when a subcategory is not applicable, it does not bring an SPI value to the supply chain, and when a subcategory has a “Basic” performance level, it brings the SPI value of 0 SPh/tonne, which does not have any power to increase or decrease the performance level in the supply chain.
Natural rubber supply chains in Indonesia exhibit remarkably similar market structure problems [45]. Indonesian smallholders also face limited price transmission from consumers to producers, with intermediaries capturing most of the marketing margins, i.e., a pattern that mirrors our ‘Wealth distribution’ hotspot. However, there is a key difference: Indonesian rubber farmers have better access to cooperative arrangements and government support programs than their Sri Lankan counterparts. This suggests that the informal nature of the studied Sri Lankan smallholder sector may create particularly severe social sustainability challenges.
The scope of this study lies within the “Cradle-to-gate” approach. However, in order to get a more comprehensive idea of the natural rubber supply chain of solid tire manufacturing, the whole supply chain, including the use phase and end-of-life phase, should be analyzed, which leads to a “Cradle-to-cradle” approach. We believe that our research study has taken the initial step, while the latter approach should be covered through future research.
Once the social hotspot is identified through the Pareto analysis (see Figure S2), we can trace it back to the indicator level and identify the underlying causes. After that, the unfulfillment of basic requirement(s) and receiving a “yes” on the bad indicators result in a bad social state and lead to negative SPI values; improvement options are proposed after. These improvement options may lead to moving the organization’s current condition from the bad domain into the good domain, crossing the basic requirement by making a decision or reaching the basic requirement. These movements can be described based on four novel concepts proposed in the “More Good and Less Bad” method (see Table 5).
According to the Pareto analysis results, the hotspots are identified as the most influential negative SPI values and as the negative social impacts within the solid tire supply chain at the subcategorical level. Here, we propose improvement options and calculate the expected outcomes on the social impacts of the industrial solid tire supply chain.
Addressing Hotspot 01—Promoting Social Responsibility
We have identified that the highest SPIbad value comes from the tire factory by expanding the final aggregated SPIbad value. However, the factory-level RSS also brings negative values for the supply chain. If we assume that these organizations will make decisions (for instance, introducing an explicit code of conduct that protects the human rights of value chain actors, including their workers) to further improve, the fulfillment of basic requirements will occur. Therefore, the degree of improvement can be calculated as in Figure 6 and Figure 7.
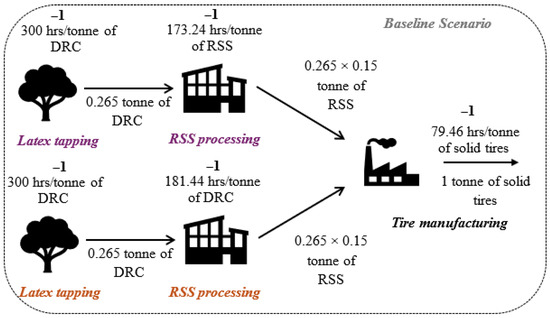
Figure 6.
Information required for the calculation at the baseline scenario. The social performance level for “Promoting social responsibility” is mentioned in bold letters, while working hours per output of each process are mentioned underneath that for each process. One tonne of industrial solid tires is produced from 0.265 tonnes of ribbed smoked sheets (RSS) that are produced from fresh latex containing 0.265 tonnes of dry rubber content (DRC). Purple and orange colors show the RSS factories 01 and 02, respectively.
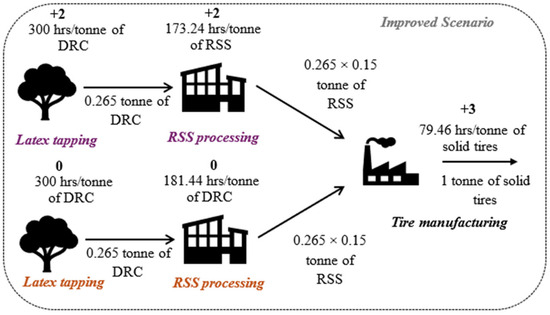
Figure 7.
Information required for the calculation at the improved scenario. The social performance level for “Promoting social responsibility” is mentioned in bold letters, while working hours per output of each process are mentioned underneath that for each process. One tonne of industrial solid tires is produced from 0.265 tonnes of ribbed smoked sheets (RSS) that are produced from fresh latex containing 0.265 tonnes of dry rubber content (DRC). Purple and orange colors show the RSS factories 01 and 02, respectively.
As per the baseline scenario,
After proposing the decisions to fulfill the basic requirement and then marking the indicators again, social performance levels are predicted to change and move to the positive domain.
As per the improved scenario,
As a result of the improvement, has become 257.19 SPh from the SPI of −98.43 SPh; overall, this change can be deemed 27.67% less bad and 72.32% more good movement of impacts.
The improvement options and expected outcomes for the remaining identified social hotspots are discussed in a similar manner, included in the Supplementary Materials (see Sections S3–S8). The following Figure 8 shows the expected outcome results for all six identified social hotspots: promoting social responsibility, wealth distribution, public commitment to sustainability issues, social benefits, safe and healthy living conditions and hours of work.
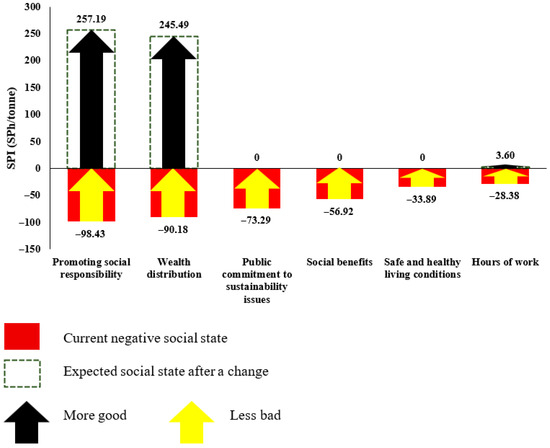
Figure 8.
The outcomes for improvement options proposed herein after the implementation of improvement options. SPI and SPh refer to the social performance index and social performance hours, respectively.
This study acknowledges several methodological and contextual limitations that should be considered when interpreting results and planning future research.
As we could not trace the actual origin of the RSS purchased by the tire factory, we constructed a hypothetical supply chain based on procurement patterns (70% from smallholders, 30% from factories). While this approach was necessary and validated through expert interviews, it introduces three important limitations. First, the 70:30 ratio accurately reflects our studied factory’s procurement pattern, as confirmed by the Rubber Research Institute and factory managers, but this ratio may differ for other tire manufacturers. We also assumed that all smallholder operations perform similarly to each other and all factory operations perform similarly to each other. In reality, significant variation likely exists within these groups—some smallholders may perform much better or worse than others. Our approach, therefore, provides an average picture but may miss important variations. Second, without knowing which specific plantations and factories actually supplied the RSS, we cannot verify those exact operations’ social performance. This introduces uncertainty in the geographic distribution of impacts and in our working hour calculations at the plantation level, which are estimates rather than actual measurements. Third, while our results can be reliably compared within this study, direct comparison with other S-LCA studies using fully traced supply chains requires caution, since those studies measured actual suppliers while we used representative averages.
While we propose improvement options for identified social hotspots, our study does not examine implementation feasibility, associated costs or governance mechanisms. Future research should address who would fund these changes, who would enforce compliance and what realistic timeframes exist for smallholders with limited resources to adopt improvements.
Our methodological challenges are similar to those described in a recent study on the use of ecosystem valuation in European territorial planning [46,47]. Both approaches struggle with the same core issue: how to turn complex technical information into practical decisions when working across fragmented systems and stakeholders with very different levels of expertise. The Mapping and Assessment of Ecosystems and their Services framework proposed therein shows the value of using flexible and scalable tools. This insight is highly relevant for S-LCA in smallholder-based supply chains, where conditions vary widely. This reinforces the need for sustainability assessment methods that can adapt to different contexts, scales and data realities.
Despite these limitations, the hypothetical supply chain approach was a practical necessity given the current traceability challenges in Sri Lanka’s rubber sector. This challenge will likely be resolved soon, as the European Union Deforestation Regulation (EUDR) mandates traceability by December 2025 [44]. Once companies implement traceability systems for EUDR compliance, future researchers can apply our methodology with organization-specific data from actual suppliers, potentially revealing greater variation in social performance across different locations and operations than our averaged approach could detect. This creates a strategic opportunity for forward-thinking industries: a comprehensive traceability infrastructure developed for EUDR compliance can simultaneously serve social sustainability monitoring. The same technologies required for environmental compliance, i.e., GPS mapping of plantations, digital transaction records and chain-of-custody systems, provide the foundation for systematic S-LCA implementation. Organizations that proactively build integrated traceability systems will gain dual advantages: regulatory compliance and the ability to credibly demonstrate social performance to increasingly sustainability-conscious markets.
The assessment of background processes beyond natural rubber represents a significant data gap. Industrial solid tire manufacturing requires synthetic rubber, carbon black, chemical additives, steel cord and energy from diverse supply chains that were not evaluated. These background processes carry their own social footprints that may mask significant hotspots. A comprehensive S-LCA would require site-specific primary data from all material suppliers and energy providers.
The cradle-to-gate system boundary excludes distribution, use phase and end-of-life stages, where significant social impacts likely occur, particularly in disposal and recycling activities. Our identified hotspots—promoting social responsibility, wealth distribution and sustainability commitments—are concentrated in the production stages and reflect structural characteristics that would remain priorities regardless of downstream stages. However, this boundary limitation means our conclusions apply specifically to the production system, and complete tire sustainability assessment requires extending to use and end-of-life stages in future research. Additionally, this snapshot assessment does not capture temporal variations in social performance due to economic conditions, policy changes or seasonal patterns.
Our findings are based on a single tire factory’s supply chain and may not represent all Sri Lankan tire manufacturers or the broader rubber sector. Future research should investigate multiple supply chains across different manufacturers and regions to assess whether the identified social hotspots and structural patterns are consistent sector-wide or vary by geographic location, factory size and sourcing arrangements. Such an attempt may confirm the generalizability of results.
Despite these limitations, this study demonstrates the feasibility and value of systematic social performance assessment in the natural rubber supply chain of Sri Lanka. The identified constraints highlight important directions for future research.
4. Conclusions
Our study shows an initial effort in applying the Social Life Cycle Assessment (S-LCA) methodology to evaluate the social performance of a Sri Lankan industrial solid tire supply chain, addressing a critical knowledge gap in the social sustainability assessment of one of the country’s key export sectors. Through the implementation of the “More Good and Less Bad” methodological framework, our research has successfully shown both the feasibility and necessity of comprehensive social impact assessment within the Sri Lankan rubber industry context. Our methodology successfully captured both good and bad social impacts without neutralization of bad and good social impacts, providing a clear understanding of the natural rubber supply chain’s social performance within the industrial solid tire manufacturing context. The highest good social performance occurs in “Contribution to economic development” (300.65 SPh/tonne), while the most significant bad impact is observed in “Promoting social responsibility” (−98.43 SPh/tonne). Our findings lead to proposing improvement options for industry stakeholders, identifying specific improvement pathways that can transition social performance from “unfulfillment of basic requirements” to “fulfillment of basic requirements” and beyond the performance of basic requirements. The proposed improvement strategies for the six hotspot subcategories offer the enhancement of social sustainability, with some interventions potentially achieving both bad impact reduction and good impact enhancement, simultaneously, along the solid tire supply chain.
Our industry engagement revealed that most organizations’ sustainability goals concentrate primarily on environmental aspects, such as carbon emission reduction, without addressing the broader sustainability picture. However, as global sustainability discourse evolves beyond environmental metrics, social dimensions are gaining prominence in regulatory frameworks and market expectations. The recent launch of the world’s first social product declaration based on S-LCA under the International EPD System signals a new era for comprehensive sustainability performance disclosure [43].
Translating these findings into action requires coordinated effort across stakeholders. Tire manufacturers should extend social auditing to smallholder suppliers, establish price premiums for verified social performance and invest in digital traceability that serves both EUDR compliance and social monitoring. Smallholders can strengthen their position through cooperatives that provide shared administrative capacity, training programs on safety and documentation, and simple record-keeping systems. Government institutions should develop mandatory traceability regulations aligned with the EUDR, expand extension services to smallholder communities and create verification systems suited to smallholder contexts rather than imposing requirements designed for large enterprises. International buyers should provide technical and financial assistance for traceability infrastructure, allow transitional compliance pathways to avoid excluding vulnerable producers and coordinate requirements across regulations (EUDR, CSRD, social due diligence) to reduce compliance complexity. These coordinated actions can transform current challenges into opportunities for building more equitable and transparent rubber supply chains.
Our study provides a methodological foundation for Sri Lankan rubber sector industries to advance from voluntary CSR activities toward systematic, measurable social sustainability performance. In doing so, this work translates the aspirations of the UN 2030 Agenda into actionable pathways for the rubber sector, i.e., creating decent work through improved labor assessments (SDG 8), building responsible production systems through transparent supply chain evaluation (SDG 12) and reducing entrenched inequalities through equitable value distribution (SDG 10). As sustainability considerations increasingly influence international trade regulations, supply chain due diligence requirements and consumer preferences, the rubber sector’s proactive engagement with social performance evaluation and improvement will be crucial for maintaining market access and long-term competitiveness.
Supplementary Materials
The following supporting information can be downloaded at: https://www.mdpi.com/article/10.3390/su18020950/s1, Figure S1: Tracing the social performance level of stakeholders: workers, freedom of association and collective bargaining at RSS processing state in the audited factory 01; Figure S2: Pareto analysis results; Figures S3, S5, S7, S9 and S11: Information required for the calculation at baseline scenario; Figures S4, S6, S8, S10 and S12: Information required for the calculation at improved scenario; Table S1: Working hours per unit; Table S2: Justifications for the omitted subcategories; Table S3: Resulted SPI values after aggregation of latex tapping and RSS processing (positive values depict SPIgood and negative values depict SPIbad. SPIgood and SPIbad values are calculated in separate and have not aggregated together at any point in the supply chain, per 1 tonne of industrial solid tires); Table S4: SPI values for RSS manufacturing (factory level and smallholder level) and industrial solid tire sectors for all the stakeholder categories (per 1 tonne of industrial solid tires).
Author Contributions
Conceptualization, P.D., I.D., V.H.L.R., K.S. and K.T.; methodology, P.D., I.D., V.H.L.R., K.S. and K.T.; software, D.J.T.S.L., W.G. and P.D.; validation, P.D., I.D., V.H.L.R., K.S., K.T. and T.H.; formal analysis, D.J.T.S.L., W.G. and P.D.; investigation, I.D., V.H.L.R., K.S. and K.T.; resources, I.D., K.T. and T.H.; data curation, D.J.T.S.L., W.G., E.M. and P.D.; writing—original draft preparation, D.J.T.S.L.; writing—review and editing, P.D., I.D., V.H.L.R., E.M., K.S. and K.T.; visualization, D.J.T.S.L.; supervision, P.D., I.D., V.H.L.R. and K.T.; project administration, I.D., K.T. and T.H.; funding acquisition, I.D., K.T. and T.H. All authors have read and agreed to the published version of the manuscript.
Funding
This work was supported by the New Energy and Industrial Technology Development Organization (NEDO) (grant numbers: 19100258-a and 23200311-0) and the JST-Mirai Program (grant number JPMJMI21I5).
Institutional Review Board Statement
Not applicable.
Informed Consent Statement
Not applicable.
Data Availability Statement
The data supporting the findings of this study are available in the article and its Supplementary Materials.
Acknowledgments
The authors gratefully acknowledge all academic and industry experts who contributed to this study. Their valuable insights and support made our study a success.
Conflicts of Interest
Author Koichi Shobatake was employed by the company TCO2 Co., Ltd. The remaining authors declare that the research was conducted in the absence of any commercial or financial relationships that could be construed as a potential conflict of interest.
References
- Sri Lanka Rubber Industry Master Plan 2017–2026. Sri Lanka Rubber Secretariat Ministry of Plantation Industries. Available online: https://www.srilankabusiness.com/blog/sri-lanka-rubber-industry-master-plan.html (accessed on 7 May 2025).
- Sri Lanka Export Development Board (SLEDB). Sri Lanka’s Rubber Industry. 2025. Available online: https://www.srilankabusiness.com/ebooks/business-lanka-2025-1.pdf (accessed on 7 May 2025).
- Export Development Board, Sri Lanka. Industry Capability Report–Rubber & Rubber Based Products 2024. 2024. Available online: https://www.srilankabusiness.com/ebooks/industry-capability-report-rubber-2024.pdf (accessed on 7 May 2025).
- Sri Lanka Export Development Board. Industry Capability of Sri Lankan Rubber & Rubber Products Sector. 2025. Available online: https://www.srilankabusiness.com/rubber/about/industry-capability.html (accessed on 7 May 2025).
- Dunuwila, P.; Rodrigo, V.; Goto, N. Assessing the Financial and Environmental Sustainability in Raw Rubber Processing; a Case Study with Ribbed Smoked Sheet Manufacture in Sri Lanka. Indones. J. Life Cycle Assess. Sustain. 2018, 2, 1–7. Available online: https://ijolcas.ilcan.or.id/index.php/IJoLCAS/article/view/55 (accessed on 7 May 2025). [CrossRef]
- Dong, Y.; Zhao, Y.; Hossain, M.d.U.; He, Y.; Liu, P. Life cycle assessment of vehicle tires: A systematic review. Clean. Environ. Syst. 2021, 2, 100033. [Google Scholar] [CrossRef]
- Dunuwila, P.; Rodrigo, V.H.L.; Daigo, I.; Goto, N. Social Sustainability of Raw Rubber Production: A Supply Chain Analysis under Sri Lankan Scenario. Sustainability 2023, 15, 11623. [Google Scholar] [CrossRef]
- Dunuwila, P.; Rodrigo, V.H.L.; Daigo, I.; Goto, N. Social impact improving model based on a novel social life cycle assessment for raw rubber production: A case of a Sri Lankan rubber estate. J. Clean. Prod. 2022, 338, 130555. [Google Scholar] [CrossRef]
- Unicef, I. Child Labour Global Estimates 2020, Trends and the Road Forward. 2021. Available online: https://data.unicef.org/resources/child-labour-2020-global-estimates-trends-and-the-road-forward/ (accessed on 7 May 2025).
- ILO. Global Estimates of Modern Slavery Forced Labour and Forced Marriage. 2022. Available online: https://www.ilo.org/sites/default/files/wcmsp5/groups/public/%40ed_norm/%40ipec/documents/publication/wcms_854733.pdf (accessed on 7 May 2025).
- Ortíz-Rodríguez, O.; Ocampo-Duque, W.; Duque-Salazar, L. Environmental Impact of End-of-Life Tires: Life Cycle Assessment Comparison of Three Scenarios from a Case Study in Valle Del Cauca, Colombia. Energies 2017, 10, 2117. [Google Scholar] [CrossRef]
- Valentini, F.; Pegoretti, A. End-of-Life Options of Tyres. A Review. Adv. Ind. Eng. Polym. Res. 2022, 5, 203–213. [Google Scholar] [CrossRef]
- Geddie, J.; Varadhan, S.; Brock, J. Trading Tyres: How the West Fuels a Waste Crisis in Asia. 2019. Available online: https://www.reuters.com/article/world/trading-tires-how-the-west-fuels-a-waste-crisis-in-asia-idUSKBN1WX0LD/ (accessed on 7 May 2025).
- Maga, D.; Aryan, V.; Blömer, J. A comparative life cycle assessment of tyre recycling using pyrolysis compared to conventional end-of-life pathways. Resour. Conserv. Recycl. 2023, 199, 107255. [Google Scholar] [CrossRef]
- Secretariat of the Basel Convention on the Control of Transboundary Movements of Hazardous Wastes and Their Disposal (UNEP). Technical Guidelines on The environmentally Sound Management of [Used and] Waste Pneumatic Tyres. May 2025. Available online: https://www.basel.int/Portals/4/download.aspx?d=UNEP-CHW.17-INF-10-Rev.1.English.pdf (accessed on 7 May 2025).
- Mangukiya, R.D.; Sklarew, D.M. Analyzing three pillars of sustainable development goals at sub-national scales within the USA. World Dev. Sustain. 2023, 2, 100058. [Google Scholar] [CrossRef]
- United Nations—Department of Economic and Social Affairs. Transforming Our World: The 2030 Agenda for Sustainable Development. 2015. Available online: https://sdgs.un.org/2030agenda#:~:text=A%20world%20which%20invests%20in,other%20living%20species%20are%20protected (accessed on 7 May 2025).
- Life Cycle Initiative. What is Life Cycle Thinking?—Life Cycle Initiative. 2023. Available online: https://www.lifecycleinitiative.org/activities/what-is-life-cycle-thinking/ (accessed on 7 May 2025).
- Dunuwila, P.; Rodrigo, V.H.L.; Goto, N. Sustainability of natural rubber processing can be improved: A case study with crepe rubber manufacturing in Sri Lanka. Resour. Conserv. Recycl. 2018, 133, 417–427. [Google Scholar] [CrossRef]
- Franze, J.; Ciroth, A. A comparison of cut roses from Ecuador and the Netherlands. Int. J. Life Cycle Assess. 2011, 16, 366–379. [Google Scholar] [CrossRef]
- Toboso-Chavero, S.; Madrid-López, C.; Villalba, G.; Durany, X.G.; Hückstädt, A.B.; Finkbeiner, M.; Lehmann, A. Environmental and social life cycle assessment of growing media for urban rooftop farming. Int. J. Life Cycle Assess. 2021, 26, 2085–2102. [Google Scholar] [CrossRef]
- Petti, L.; Serreli, M.; Di Cesare, S. Systematic literature review in social life cycle assessment. Int. J. Life Cycle Assess. 2018, 23, 422–431. [Google Scholar] [CrossRef]
- Katarzyna, P.; Izabela, P.; Patrycja, B.-W.; Weronika, K.; Andrzej, T. LCA as a Tool for the Environmental Management of Car Tire Manufacturing. Appl. Sci. 2020, 10, 7015. [Google Scholar] [CrossRef]
- Piotrowska, K.; Kruszelnicka, W.; Bałdowska-Witos, P.; Kasner, R.; Rudnicki, J.; Tomporowski, A.; Flizikowski, J.; Opielak, M. Assessment of the Environmental Impact of a Car Tire throughout Its Lifecycle Using the LCA Method. Materials 2019, 12, 4177. [Google Scholar] [CrossRef]
- Shanbag, A.; Manjare, S. Life Cycle Assessment of Tyre Manufacturing Process. J. Sustain. Dev. Energy Water Environ. Syst. 2020, 8, 22–34. [Google Scholar] [CrossRef]
- Sun, X.; Liu, J.; Hong, J.; Lu, B. Life cycle assessment of Chinese radial passenger vehicle tire. Int. J. Life Cycle Assess. 2016, 21, 1749–1758. [Google Scholar] [CrossRef]
- IMARC Group. Sustainable Tire Market Size, Share, Trends and Forecast by Material Type, Vehicle Type, and Region, 2025–2033. 2025. Available online: http://imarcgroup.com/sustainable-tire-market (accessed on 7 May 2025).
- Trudsø, L.L.; Nielsen, M.B.; Hansen, S.F.; Syberg, K.; Kampmann, K.; Khan, F.R.; Palmqvist, A. The need for environmental regulation of tires: Challenges and recommendations. Environ. Pollut. 2022, 311, 119974. [Google Scholar] [CrossRef]
- Bjørnbet, M.M.; Vildåsen, S.S. Life Cycle Assessment to Ensure Sustainability of Circular Business Models in Manufacturing. Sustainability 2021, 13, 11014. [Google Scholar] [CrossRef]
- Benoît-Norris, C.; Vickery-Niederman, G.; Valdivia, S.; Franze, J.; Traverso, M.; Ciroth, A.; Mazijn, B. Introducing the UNEP/SETAC methodological sheets for subcategories of social LCA. Int. J. Life Cycle Assess. 2011, 16, 682–690. [Google Scholar] [CrossRef]
- Dunuwila, P.; Daigo, I.; Rodrigo, V.H.L.; Liyanage, D.J.T.S.; Gong, W.T.; Hatayama, H.; Shobatake, K.; Tahara, K.; Hoshino, T. Social Life Cycle Assessment Methodology to Capture “More-Good” and “Less-Bad” Social Impacts—Part 1: A Methodological Framework. Sustainability 2025, 17, 4830. [Google Scholar] [CrossRef]
- Pucciarelli, M.; Traverso, M.; Lettieri, P. Social hotspots life cycle assessment: A case study on social risks of an antimicrobial keyboard cover. J. Clean. Prod. 2021, 311, 127787. [Google Scholar] [CrossRef]
- Traverso, M.; Petti, L.; D’Eusanio, M.; Tragnone, B.M.; Mankaa, R.N. Finally, an international standard on social life cycle assessment: ISO 14075. Int. J. Life Cycle Assess. 2025. [Google Scholar] [CrossRef]
- ISO 14075:2024 ; Environmental Management—Principles and Framework for Social Life Cycle Assessment. International Organization for Standardization (ISO): Geneva, Switzerland, 2024. Available online: https://www.iso.org/obp/ui/en/#iso:std:iso:14075:ed-1:v1:en (accessed on 7 May 2025).
- Zamani, B.; Sandin, G.; Svanström, M.; Peters, G.M. Hotspot identification in the clothing industry using social life cycle assessment—Opportunities and challenges of input-output modelling. Int. J. Life Cycle Assess. 2016, 23, 536–546. [Google Scholar] [CrossRef]
- Dunuwila, P.; Rodrigo, V.H.L.; Daigo, I.; Goto, N. Environmental Lifecycle Assessment to Address the Hotspots in Natural Rubber Manufacturing; a Case Study with Information Gathered from Concentrated Latex Manufacturing in Sri Lanka. Environmental and Earth Sciences. 2023. Available online: https://www.preprints.org/manuscript/202309.0521/v1 (accessed on 7 May 2025).
- Bouillass, G.; Blanc, I.; Perez-Lopez, P. Step-by-step social life cycle assessment framework: A participatory approach for the identification and prioritization of impact subcategories applied to mobility scenarios. Int. J. Life Cycle Assess. 2021, 26, 2408–2435. [Google Scholar] [CrossRef]
- ISO TC/207; Environmental Management. ISO: Geneva, Switzerland, 1993. Available online: https://www.iso.org/committee/54808.html (accessed on 12 January 2026).
- ISO 9001:2015; Quality Management Systems—Requirements. ISO: Geneva, Switzerland, 2015. Available online: https://www.iso.org/standard/62085.html (accessed on 12 January 2026).
- ISO 14001:2015; Environmental Management Systems—Requirements with Guidance for Use. ISO: Geneva, Switzerland, 2015. Available online: https://www.iso.org/standard/60857.html (accessed on 12 January 2026).
- ISO 45001:2018; Occupational Health and Safety Management Systems—Requirements with Guidance for Use. ISO: Geneva, Switzerland, 2018. Available online: https://www.iso.org/standard/63787.html (accessed on 12 January 2026).
- Benoît Norris, C.; Traverso, M.; Finkbeiner, M. Guidelines for Social Life Cycle Assessment of Products and Organisations 2020 [Internet]; United Nations Environment Programme (UNEP)/Life Cycle Initiative: Paris, France, 2020. Available online: https://www.lifecycleinitiative.org/wp-content/uploads/2021/01/Guidelines-for-Social-Life-Cycle-Assessment-of-Products-and-Organizations-2020-22.1.21sml.pdf (accessed on 7 May 2025).
- The World’s First Social Product Declaration. EPD International/The International EPD System. 2023. Available online: https://www.environdec.com/news/the-worlds-first-social-product-declaration (accessed on 7 May 2025).
- Commission Notice–Guidance Document for Regulation (EU) 2023/1115 on Deforestation-Free Products (C/2025/4524). European Commission, Directorate-General for Environment: Brussels, Belgium, 2025 Aug. Report No.: C/2025/4524. Available online: https://eur-lex.europa.eu/legal-content/EN/TXT/PDF/?uri=OJ:C_202504524 (accessed on 7 May 2025).
- Arifin, B. Supply-Chain of Natural Rubber in Indonesia. J. Manaj. Agribus. 2005, 2, 1–16. [Google Scholar] [CrossRef]
- Hernández, R.C.; Camerin, F. The application of ecosystem assessments in land use planning: A case study for supporting decisions toward ecosystem protection. Futures 2024, 161, 103399. [Google Scholar] [CrossRef]
- Iqbal, M.; Ma, J.; Ahmad, N.; Ullah, Z.; Hassan, A. Energy-efficient supply chains in construction industry: An analysis of critical success factors using ISM-MICMAC approach. Int. J. Green Energy 2023, 20, 265–283. [Google Scholar] [CrossRef]


Disclaimer/Publisher’s Note: The statements, opinions and data contained in all publications are solely those of the individual author(s) and contributor(s) and not of MDPI and/or the editor(s). MDPI and/or the editor(s) disclaim responsibility for any injury to people or property resulting from any ideas, methods, instructions or products referred to in the content. |
© 2026 by the authors. Licensee MDPI, Basel, Switzerland. This article is an open access article distributed under the terms and conditions of the Creative Commons Attribution (CC BY) license.