Abstract
In the field of the road transportation industry, quantitative research on the relationship between artificial intelligence (AI) technology and corporate sustainable development is relatively scarce. This disparity has led to discussions about whether artificial intelligence technology can truly promote the sustainable development level of the highway maintenance industry. Therefore, this study aims to quantify the relationship between artificial intelligence technology and the sustainable development of the highway maintenance industry, and to analyze the reasons behind the current controversies. The research results show: (1) Each exogenous variable has an impact on sustainable development, although the degree of influence varies, especially the economic development level (ED) has the strongest direct effect on sustainable development, followed by the level of market demand (MD), the level of policy support (PS), and the level of enterprise capital (EC); (2) Moderating variables can enhance this direct impact, among which the moderating effect of ED on the relationship between ED and sustainable development is the strongest; (3) Artificial intelligence technology has different impacts on enterprises at different positions in the industrial chain, thereby explaining the controversy over whether to adopt it or not. These conclusions highlight the value of artificial intelligence technology and provide a reasonable explanation for the existing controversies in the industry and research field.
1. Introduction
Developing and maintaining a robust highway network is not only important for the economic development of a nation and the improvement of living standards, but also presents a formidable sustainability challenge, as evidenced by the Chinese context. To address escalating demands, strategies prioritizing highway investment have been implemented in China, establishing a self-reinforcing mechanism: (a) prioritizing highway investment leads to highway network expansion, (b) expanded highway network strengthens regional connectivity, (c) improved accessibility stimulates economic activities to drive fiscal revenue growth, and (d) subsequent fiscal revenue growth enables further highway network development.
The expansion of highway networks has precipitated a disproportionate surge in maintenance expenditures. Data released by the Ministry of Transport of the People’s Republic of China reveal that between 2013 and 2021, the total highway mileage increased from 4.35 million km to 5.28 million km (+25.53%), whereas corresponding maintenance costs escalated from 39.04 billion yuan to 73.91 billion yuan (+89.32%). The annual growth rate of maintenance expenditures exceeded highway mileage expansion by a factor of 3.5 [1,2,3,4]. Concurrently, the shift from high-speed to medium-speed economic growth phases has reduced public funding allocated to transport infrastructure [5]. Consequently, a widening gap has emerged between available fiscal resources and actual maintenance requirements. Empirical studies suggest that underfunded maintenance systems operate at only 75% −80% of optimal cost-efficiency thresholds [6]. In several regions, this imbalance has disrupted the infrastructure development nexus, initiating a degenerative cycle: (a) Chronic underfunding of maintenance systems triggers progressive deterioration of highways, (b) degraded road serviceability impedes freight mobility efficiency, suppressing regional economic output, (c) contracted fiscal revenues from diminished economic activity exacerbate budgetary constraints, and (d) worsening budgetary constraints accelerate the progressive deterioration of highways. Highway maintenance in China is becoming economically unsustainable.
In some traditional industries, the adoption of AI technologies has effectively reduced production costs, thereby ensuring the profitability necessary to maintain essential outputs [7]. Some studies suggest that the application of AI technology in the highway maintenance industry can substantially lower costs, enhance efficiency, and promote sustainable development [8]. For example, the application of digital twin technology and AI technology enables highway maintenance contractors to promptly identify the damage conditions of designated sections. By performing timely repairs before the deterioration worsens, higher costs associated with extensive damage can be avoided [9,10]. Additionally, Building Information Modeling (BIM) technology enables maintenance clients to predict the severity and characteristics of future damages on responsible sections. This predictive capability assists in the targeted selection of maintenance contractors whose technical expertise aligns with specific project requirements, thereby reducing maintenance costs while enhancing the quality of maintenance activities [11]. However, some studies indicate that although AI technologies may be beneficial for highway maintenance in certain aspects, the unique characteristics of the highway maintenance industry mean that the introduction of such technologies may lead to new problems. Scholars point to risks such as overinvestment leading to financial strain [12], process transformations resulting in insufficient experience risks [13,14], and new job characteristics causing inadequate employee training [15]. This divergence in findings underscores a significant lack of consensus; it remains unclear whether AI application ultimately alleviates or exacerbates the economic sustainability challenges facing the highway maintenance industry. Merely listing technological benefits, as some studies do, fails to address the core issue of how these technologies interact with the complex economic and operational realities of the sector.
Therefore, the relationship between AI technology application and sustainable development in highway maintenance requires deeper empirical verification that moves beyond technological optimism or scepticism. The existing contradictions in literature likely stem from an oversimplified view of the impact mechanism. While extensive research has explored AI’s impact in various industrial contexts, a critical gap exists in quantitatively understanding its specific pathways and contingent effects within the socio-technical system of highway maintenance. This study argues that a more nuanced understanding is needed, one that quantitatively investigates the pathways through which AI application influences sustainability outcomes in this specific domain. To bridge this gap, this study employs a Structural Equation Model (SEM) to elucidate the complex impact mechanism of AI technology on sustainable development. The theoretical contribution of this work is not primarily methodological but conceptual, focusing on modeling and testing the industry-specific impact pathways (e.g., the moderating role of AI maturity) that have been underexplored in the general AI literature. By doing so, it aims not only to verify the net effect but also to identify the fundamental causes underlying the current controversies. The findings are expected to provide practical guidance for industry practitioners and enable governmental bodies to formulate targeted policies that leverage AI’s benefits while mitigating its risks, thereby facilitating sustainable industry advancement.
The paper is divided into several sections. Section 2 provides a literature review, summarizing relevant studies. Section 3 outlines the design of the survey questionnaire and proposes the hypothetical model. Section 4 introduces the data collection process and conducts a rationality (validity) test of the model. Section 5 examines the research hypotheses, while Section 6 discusses the results of hypothesis testing and explains the underlying reasons for the findings. Section 7 presents the main conclusions of the study. Finally, Section 8 presents the shortcomings and future scope of this study.
2. Literature Review
2.1. Key Factors Affecting the Sustainable Development of the Highway Maintenance Industry
Highway maintenance is critical for the effective functioning of transportation systems. Globally, countries have developed extensive highway networks to meet specific needs, creating a vast market for the highway maintenance industry [16]. Drawing on extensive engineering practices, numerous studies have investigated the key factors influencing the sustainable development of the highway maintenance industry, providing valuable insights referenced in this paper. However, a comprehensive review reveals that while these factors are frequently cited, the literature remains predominantly qualitative, with limited empirical quantification of their relative impacts. Antoniou asserted that market demand forms the foundation of industrial development, with large-scale highway maintenance demand being essential for sustainability [17]. Short & Kopp emphasized that the government acts as the initiator and a crucial participant in highway maintenance projects, highlighting the pivotal role of policy support in industry development [18]. Polyzos & Tsiotas observed that economic development has increased the mileage of highway construction, generating substantial market demand for highway maintenance [19]. Zhao et al. noted that the quality of personnel, equipment levels, and management capabilities in highway maintenance enterprises are key factors affecting industrial development [20]. These four factors—market demand, policy support, economic development, and enterprise capital—are consistently identified as primary drivers of sustainable development in the highway maintenance industry. This alignment with industry characteristics and economic principles underscores their theoretical relevance. The industry is typically market-driven, with government oversight and enterprise implementation of projects to meet demands fueled by economic growth [21].
Morishima (1974) noted that Marxist economic theory posits that for an industry to survive long-term and remain competitive, the socially necessary labor time must decrease or remain low [22]. Increased market demand attracts more enterprises, enhancing production efficiency, optimizing resource allocation, and fostering technological innovation, thereby reducing socially necessary labor time [23]. Supportive policies lower individual labor time within enterprises, contributing to this reduction [24]. Enhanced enterprise capital generates economies of scale, optimizing resource utilization and reducing average production costs, further lowering socially necessary labor time [25]. Economic development increases overall purchasing power, reducing the relative costs of highway maintenance and decreasing socially necessary labor time [26]. From a qualitative analysis perspective, market demand, policy support, economic development, and enterprise capital are recognized as factors that positively impact the sustainable development of the highway maintenance industry. However, limited quantitative research makes it difficult to determine the intensity of their effects and their interrelationships. To achieve sustainable development in this industry, quantitative analyses are crucial to accurately measure and compare these key contributions. The absence of quantitative studies makes it difficult to determine the intensity of their effects, their interdependencies, and which factors should be prioritized for policy intervention. This gap limits the ability to design targeted strategies for sustainable development. Therefore, quantitative analyses are crucial to accurately measure and compare the contributions of these key factors, which is a central aim of this study.
2.2. The Impact of AI Technology on the Development of the Highway Maintenance Industry
In the context of highway maintenance, the application of artificial intelligence typically involves technologies such as automated pavement damage detection technology [27], AI-enhanced cloud computing frameworks [28], and digital twin models provided by Internet of Things sensors for real-time health monitoring of infrastructure [29]. Much research suggests that AI technology exerts no direct influence on the sustainable development of the highway maintenance industry. AI technology does not impact key metrics of individual highway maintenance projects, such as cost, duration, or quality [30]. AI technology nevertheless plays a crucial role in enhancing the overall efficiency of highway operation and maintenance [31]. However, numerous studies have observed that highway maintenance enterprises with a high level of intelligentization are more likely to survive in market competition [32]. Although digitalization may not directly reduce product costs, it exerts its influence through various indirect pathways [33]. Many researchers have proposed such pathways, yet few have quantified them, leaving the exact mechanisms unclear. This gap has prevented the effective use of AI technology applications to achieve sustainable development in highway maintenance. More importantly, numerous studies grounded in economic theory have demonstrated that application of AI technology can indirectly promote the development of the highway maintenance industry [30,34]. Nevertheless, some research suggests that application of AI technology may also hinder industry growth [13,15]. For instance, the effective integration of artificial intelligence is severely constrained by data quality, availability and representativeness. Poor-quality, non-representative or biased data not only undermine model performance, but also may lead to unfair resource allocation decisions, thereby exacerbating existing inequalities within the industry and hindering fair development [14,35]. AI technology is often regarded as a “black box”, with its decision-making process being difficult to explain, which reduces the trust and willingness to adopt of asset managers [36,37]. Moreover, the application of some technologies has undermined the trust of stakeholders in AI decisions, thereby restricting the steady accumulation of knowledge in this field and the reliable promotion of the technology [38,39]. As a result, highway maintenance enterprises often struggle to make sound strategic decisions and may miss valuable opportunities for growth. Therefore, it is imperative to analyze the roots of this conflict and employ quantitative methods to substantiate the findings. Therefore, in this study, the moderating variable of artificial intelligence technology maturity was introduced within the framework of the structural equation model. By quantifying the indirect effect and moderating effect of artificial intelligence, our aim is to provide a detailed understanding of how artificial intelligence technology influences the sustainable development of the highway maintenance industry.
3. Latent Construct Design and Hypothesis Model Construction
Based on a comprehensive literature review of existing research, this study identifies three primary gaps. First, there is a lack of quantitative analysis regarding the direct effects of factors on the sustainable development of the highway maintenance industry. Second, few studies have investigated the indirect effect of AI technology applications on this industry’s sustainable development. Third, insufficient attention has been paid to quantitatively verifying the underlying reasons behind the debate over whether AI technology can facilitate sustainable development in the highway maintenance industry.
To address these gaps, this study selects market demand, policy support, economic development, and enterprise capital as exogenous variables, while treating the sustainable development of the highway maintenance industry as the endogenous variable. The AI technology maturity of highway maintenance engineering is introduced as a moderating variable. Data are collected from industry practitioners via a questionnaire survey. By analyzing survey data, the direct impacts of factors on sustainable development and the indirect impacts of AI technology applications can be quantified. Additionally, through group comparison analysis, this study uncovers the fundamental reasons behind the debate on the role of AI technology in achieving sustainable development in the highway maintenance industry and quantitatively verifies the credibility of these reasons.
This study verifies the relationship among market demand, policy support, economic development, enterprise capability, intelligence level of highway maintenance engineering, and the sustainable development of the highway maintenance industry. Although the magnitude of these factors (e.g., market demand or enterprise capability) can vary considerably across different highway maintenance projects and enterprises, there is no universally standardized unit to measure these differences. As such, these factors are treated as latent variables, meaning they cannot be directly measured by a single observed indicator. Instead, they must be inferred from multiple observed indicators (e.g., survey responses, financial data) that collectively represent each underlying construct.
Structural equation modeling (SEM) is well suited for analyzing latent variables because it allows researchers to incorporate multiple observed indicators for each variable, evaluate measurement errors, and estimate the relationships among multiple constructs within a single comprehensive framework [40]. In SEM, the validity of the research conclusions depends largely on developing an appropriate latent construct and research hypotheses that accurately capture the theoretical relationships among these factors. Consequently, this section constructs the research framework and hypotheses in line with the study’s objectives.
3.1. Questionnaire Design
The questionnaire was designed to measure six latent constructs: market demand level, policy support level, economic development level, enterprise capability level, intelligence level of highway maintenance engineering, and the sustainable development level of the highway maintenance industry. Likert scales are broadly applied in the measurement of attitudes and perceptions and have been shown to enhance discrimination and reliability [41]. A 7-point Likert scale was employed in this study. Compared with scales containing fewer response categories (for instance, 3 or 5), the 7-point format provides finer distinctions in responses, thus capturing more nuanced variations in rating data [42]. Although scales with more points (for instance, 9 or 11) theoretically offer superior performance, they tend to impose greater cognitive burdens on respondents. Consequently, few studies employ Likert scales with more than seven points in survey design [43].
When designing the questionnaire, the questionnaire design was based on the questionnaire design methods of Zielińska, Wang, and Durdyev [44,45,46]. Especially, following the guidelines by Hair et al. (2006), each latent construct was measured with at least four items to ensure adequate coverage, enhance reliability and validity, and allow for over-identification in SEM [47]. Hair (2006) pointed out that models employing only two items per latent construct are typically just-identified (with zero degrees of freedom), making it impossible to evaluate overall fit or refine the measurement model [47]. In contrast, including four or more items per construct results in an over-identified model, enabling the assessment of goodness-of-fit and facilitating further refinement. Furthermore, the items in this study were newly developed rather than adapted from existing scales, and using four or more items helps ensure the accuracy and stability required for robust SEM analyses.
A 7-point Likert scale was utilized, adhering to the principle of at least four survey questions per latent construct. To ensure the survey accurately reflected the study’s key constructs, a comprehensive preliminary investigation was conducted, involving interviews with 15 professionals: 3 representatives from highway construction contracting enterprises, 4 from highway operation and management government departments, 3 from highway construction machinery manufacturers, and 5 academic researchers. These interviews provided insights into six critical constructs: market demand, policy support, economic development, enterprise capability, intelligentization of highway maintenance engineering, and sustainable development of the highway maintenance industry. Grounded theory methodology was applied to analyze the interview data qualitatively. The process involved open coding to generate initial concepts, axial coding to categorize these concepts into themes, and selective coding to integrate the themes around the core constructs. This analytical process ensured that the survey items were derived directly from the practical experiences and insights of the experts. Initially, this process generated 8 potential items for each of the 6 constructs, resulting in a 48-item preliminary questionnaire. To improve the questionnaire and enhance its psychometric characteristics, we conducted a preliminary study on 200 respondents. The reduction from the initial 48 projects to the final 26 projects was achieved through a statistical screening process based on data from pilot studies. Based on the convergence and discriminant validity tests of the pre-survey data, this study identifies and eliminates the poorly performing questions. A more concise yet robust final questionnaire, consisting of 26 items, was generated through the problem improvement process for formal data collection.
3.2. Hypothesis Model Construction
Addressing research gaps 1 and 2 requires establishing appropriate research hypotheses. These hypotheses quantitatively examine whether market demand, policy support, economic development, and enterprise capital directly promote the sustainable development of the highway maintenance industry, and whether AI technology applications exert an indirect positive effect on that development. In particular, AI technology can enhance overall operational efficiency and management capacity, helping the industry meet future demands. To test this indirect effect, the intelligentization level of highway maintenance engineering is introduced as a moderating variable. If these variable exhibits one or more positive moderating effects on the relationships between the aforementioned factors and sustainable development, it confirms that AI technology applications make indirect contributions to sustainability (research gap 2). Furthermore, such results also validate that these factors themselves influence sustainable development (research gap 1). Accordingly, based on existing studies, this research proposes the following hypotheses to substantiate these theoretical links.
Conclusions drawn from the literature review indicate that market demand levels positively impact the sustainable development of the highway maintenance industry. However, this conclusion is not universally applicable to all research subjects. There are studies that presented cases where highway maintenance market exists but the highway maintenance industry’s development is inadequate [48,49]. This occasionally absent correlation between market demand levels and the sustainable development level of the highway maintenance industry has been noted by numerous studies, which offer a variety of explanations including regional differences, disparities in economic development, and variations in labour costs [50,51]. This study posited that the observed variations arise from the differing intelligentization level of highway maintenance engineering among the subjects studied. This leads to an unstable relationship between market demand levels and the sustainable development level of the highway maintenance industry. Consequently, research hypothesis H1 is proposed.
H1:
As the intelligentization level of highway maintenance engineering increases, the positive relationship between market demand and the sustainable development of the highway maintenance industry becomes more pronounced.
The positive impact of regional economic development on the transportation infrastructure maintenance industry is thoroughly discussed in the literature review section. However, some studies have noted a disconnect between economic development levels and infrastructure maintenance quality. For instance, Ribreau (2004) highlighted that developed countries such as the United States and the United Kingdom have lower highway maintenance standards compared to developing countries such as China [52]. Many studies attribute this to the decline of the highway maintenance industry in developed nations [53], which is indicative of moderating variables that diminish the positive impact of economic development on infrastructure maintenance. Therefore, hypothesis H2 is proposed.
H2:
As the intelligentization level of highway maintenance engineering increases, the positive relationship between economic development and the sustainable development of the highway maintenance industry becomes more pronounced.
In regions with the same policy implementation, it can be observed that the development levels of highway maintenance companies vary. This discrepancy has led some studies to conclude that there is no clear relationship between policy support and the development of the highway maintenance industry [54]. However, some studies comparing the operational health of maintenance companies across different policy implementation regions have found that companies in areas with higher policy support generally exhibit more optimal overall development [55]. This contradiction indicates that the relationship between policy support and the sustainable development of the highway maintenance industry is influenced by certain moderating factors. Therefore, hypothesis H3 is proposed.
H3:
As the intelligentization level of highway maintenance engineering increases, the positive relationship between policy support and the sustainable development of the highway maintenance industry becomes more pronounced.
The question—whether capital enables a company to achieve long-term survival—has been a controversial topic in business management [56]. Although capital-intensive companies are often perceived as more resilient to economic difficulties, some studies propose that large capital bases can hinder flexibility and adaptability to market changes [57]. Highway maintenance companies, being labour-intensive and asset-heavy, have difficulty becoming asset-light due to industry characteristics and national development needs [58]. Identifying controllable moderating variables that create a positive correlation between company capital and sustainable development is crucial for both corporate and national progress. Therefore, hypothesis H4 is proposed.
H4:
As the intelligentization level of highway maintenance engineering increases, the positive relationship between enterprise capital and the sustainable development of the highway maintenance industry becomes more pronounced.
To address research gap 3—insufficient attention to quantitatively verifying the underlying reasons for debates on whether AI technology can facilitate sustainable development in highway maintenance—this study posits that enterprises across industry chain segments have varying needs for AI technology applications. Practitioners in different segments perceive AI adoption from distinct perspectives, identified as a primary source of ongoing controversies [51,59]. Consequently, to determine whether practitioners in different highway maintenance segments hold divergent views on the relationship between AI technology applications and sustainable development, this study proposes the following research hypothesis:
H5:
There are differences in perceptions between different groups of practitioners regarding the direct relationship between the intelligentization level of highway maintenance engineering and the sustainable development level of the highway maintenance industry.
Based on the research assumptions, the research hypothesis model constructed herein is illustrated in Figure 1.
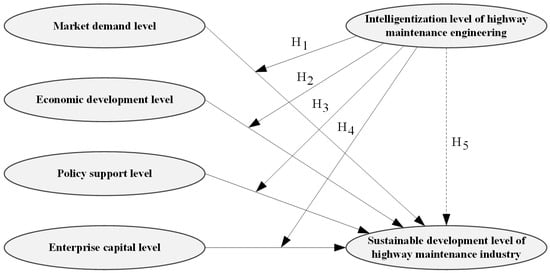
Figure 1.
Research hypothesis model.
4. Data Collection and Model Testing
4.1. Data Collection
This study employed a structured questionnaire to collect data on latent constructs and demographic variables (e.g., gender, age, education, working years). The survey was conducted from 1 January to 30 June 2023. Given the professional depth of questions related to AI technology and sustainable development, the target population was defined as practitioners with substantial expertise in the highway maintenance industry. To ensure data accuracy and credibility, a purposive sampling strategy was adopted, focusing on individuals capable of providing informed responses. Data were collected through a two-phase approach. During scheduled field research visits to enterprises, practitioners were invited to participate. They completed the questionnaire face-to-face using an online platform on a provided device, with a researcher present to clarify any queries. Industry experts with deep experience were additionally invited via professional networks to complete the same online questionnaire. This hybrid approach ensured access to a knowledgeable and relevant sample while maintaining methodological rigor.
In this questionnaire survey, 480 questionnaires were collected, and 473 valid questionnaires were obtained after excluding incomplete questionnaires, with an effective recovery rate of 98.54%. Hair (2006) recommended that each questionnaire item (variable) should comprise 5–10 valid samples [47]. Therefore, if the questionnaire contains p items (variables), the total sample size n should be 5p-10p. However, considering the potential for invalid responses or incomplete answers, it is generally advisable to increase the sample size further to ensure sufficient valid data for analysis. Drawing on Wang’s (2023) experience, questionnaires with fewer items are more easily accepted by respondents but may pose a risk of inadequate construct representation [60]. To mitigate this issue, it is recommended to collect more questionnaires; thus, methods such as bootstrapping and group comparisons can be utilized to validate the research hypotheses. Setting the sample size to 15 times the number of items is optimal if questions have fewer items than 30. The questionnaire utilized herein includes 26 questions, and the number of effective questionnaires should exceed 390, which meets this suggestion.
4.2. Model Test
In Structural Equation Modeling (SEM), tests for convergent validity, discriminant validity, and model fit must be conducted using survey data to ensure the reliability of the research conclusions. Only when all tests meet satisfactory thresholds can the model-derived conclusions possess sufficient credibility.
4.2.1. Convergence Validity Test
Convergent validity means that each item in each aspect of SEM can more optimally reflect the connotation of latent variables. To ensure that the latent constructs utilized herein effectively measure the corresponding latent variables, a convergent validity test was conducted for each latent construct, and the results are illustrated in Table 1. The standards recommended by Jöreskog and Sörbom (1982) were utilized to test the convergent validity of the collected data [61].

Table 1.
Calculation results of the convergence validity index.
The results indicate that the Unstandardized Estimate (Unstd.), which represents the estimated value of the model parameters in their original units, ranges from 0.933 to 1.131. This concentrated range indicates that each item has strong consistency. The Standard Error (S.E.) is less than or equal to 0.05, thus indicating high precision in the estimated values for each item. The absolute value of the t-value exceeds 1.96, which indicates that the corresponding test parameters for each item are significant. The p-value (p) is less than 0.001, which indicates a high probability of significance for the estimated parameters of the questionnaire items. The Standardized Estimate (Std.), ranging from 0.831 to 0.916, is the standardized result of the unstandardized estimates. The Squared Multiple Correlations (SMCs) are all greater than 0.7, thereby indicating that the proportion of explained variance for the measurement indicators corresponding to the questionnaire items meets the requirements. The Cronbach’s Alpha (Cronbach α) is greater than 0.8, which indicates ideal internal consistency among the items within each construct. The Composite Reliability (CR) is greater than 0.7, thus indicating that the latent variables have strong relationships and consistency. The Average Variance Extracted (AVE) is greater than 0.7, thus indicating that the proportion of explained variance for the latent variables meets the requirements.
These results collectively ensure the reliability and validity of the research conclusions derived from the model calculations.
4.2.2. Discriminant Validity Test
Discriminant validity refers to the distinctiveness of items associated with different constructs in SEM. In SEM, it is crucial for items within the same construct to exhibit strong convergent validity, whereas items from different constructs must demonstrate sufficient discriminant validity. This distinction prevents mutual interference between constructs, thus ensuring accurate and valid measurement results for the model.
To assess the discriminant validity among the latent constructs, multiple complementary criteria were employed. First, discriminant validity was examined using the Fornell–Larcker criterion (Table 2).
Table 2.
Discriminant Validity Results Based on the Fornell–Larcker Criterion.
Although the square root of the AVE for most constructs exceeded their inter-construct correlations, several construct pairs (e.g., EC–PS and HI–PS) exhibited correlations slightly higher than the corresponding diagonal values, indicating potential limitations of the Fornell–Larcker criterion in this context [62]. Given that prior research has noted the sensitivity and conservative nature of this criterion, discriminant validity was further evaluated using the heterotrait–monotrait ratio (HTMT), which has been shown to provide a more reliable assessment. As reported in Table 3, all HTMT values are below the recommended threshold of 0.90, thereby confirming satisfactory discriminant validity among the constructs.
Table 3.
Discriminant Validity Results Based on the Heterotrait–Monotrait Ratio.
4.2.3. Model Fit Test
In structural equation modeling (SEM), a model demonstrating smaller discrepancies between the model-implied covariance matrix and the observed sample covariance matrix exhibits superior fit. Reliable conclusions can only be drawn when employing a well-fitting model. Herein, several model fitting indices were selected, including χ2, χ2/df, model fit index (GFI), adjusted fit index (AGFI), average error approximation (RMSEA), non-standard fit index (NNFI), value-added model fit index (IFI), and comparative fit index (CFI), to test the hypothetical model’s fit degree. As presented in Table 4, all indices satisfy the psychometric criteria outlined by [63]. When these indices conform to established thresholds (e.g., CFI > 0.90, RMSEA < 0.08), it indicates that the hypothesized model aligns closely with the observed data, thereby confirming the theoretical framework’s robustness. A satisfactory χ2/df ratio suggests a good balance between model complexity and data fit, while high GFI and AGFI values reflect the model’s overall explanatory power. Low RMSEA values denote a minimal discrepancy between the model and the data, enhancing confidence in the model’s predictive capabilities. Furthermore, strong NNFI, IFI, and CFI values signify that the model improves upon baseline comparisons, demonstrating superior fit. Collectively, these fit indices ensure that the SEM provides reliable and valid insights into the relationships among constructs, thereby supporting the study’s conclusions and enhancing the credibility of the research findings.
Table 4.
Model fit test results.
5. Hypothesis Testing
5.1. Moderating Effect Test
This study employs the hierarchical regression method proposed by Cho and Chung (2012) to examine whether the intelligentization level of highway maintenance engineering (HI) moderates the positive relationships between market demand level (MD), economic development level (ED), policy support level (PS), enterprise capital level (EC), and the sustainable development level of the highway maintenance industry (SI) [64]. The methodology involves initially constructing a Hierarchy 1 model that includes independent variables: MD, ED, PS, and EC; a moderating variable: HI; and the dependent variable: SI. Data are input into the model using AMOS 28 and SPSS 26 software to obtain calculation results. The Hierarchy 1 model calculates model fit indicators F and p-value to assess the model’s overall fit. Upon confirming that the model fit meets the standards, the model computes the unstandardized coefficient indicators B Estimate and standardized coefficient indicators Beta Distribution to describe the direct impact of independent variables on the dependent variable, to reflect the accuracy of the estimates. The significance of the relationships between variables is indicated by t-values and p values.
Subsequently, the study introduces interaction terms DM × HI, ED × HI, PS × HI, and EC × HI between independent variables and the moderating variable into the Hierarchy 1 model, thereby forming the Hierarchy 2 model. Using the same methodology, F, p-value, B Estimate, Standard Error, Beta Distribution, t, and p indicators are calculated. If the interaction terms in Hierarchy 2 relate to the dependent variable, based on impacts observed in Hierarchy 1, this substantiates a moderation effect of HI on the relationships between MD, ED, PS, EC, and SI.
After these steps, the calculation results are illustrated in Table 5. In Hierarchy 1, the B Estimate values for MD, ED, PS, EC, and HI are 0.212, 0.497, 0.185, 0.09, and 0.092, respectively. This indicates that when the values of MD, ED, PS, EC, and HI each increase by one unit, the expected SI will increase by 0.212, 0.497, 0.185, 0.09, and 0.092 units, respectively. The values of the Standardized Coefficient are the same because all variables were standardized before the regression analysis, making both values identical. The p-values corresponding to MD, ED, PS, EC, and HI are all less than 0.05, indicating that the variable relationships shown by the B Estimate and Standardized Coefficient are valid.
Table 5.
Moderating effect test results.
In Hierarchy 2, the B Estimate values for MD, ED, PS, EC, and HI are 0.16, 0.557, 0.081, 0.072, and 0.123, respectively. This indicates that when the values of MD, ED, PS, EC, and HI each increase by one unit, the expected SI will increase by 0.16, 0.557, 0.081, 0.072, and 0.123 units, respectively. The values of the Standardized Coefficient are the same.
The B Estimate values for the interaction terms MD × HI, ED × HI, PS × HI, and EC × HI are 0.18, 0.297, 0.096, and 0.081, indicating that HI strengthens the positive impact of MD, ED, PS, and EC on SI. When HI increases by 1 unit, the impact of MD, ED, PS, and EC on SI will increase by 0.18, 0.297, 0.096, and 0.081 units, respectively. Since the interaction terms (e.g., MD × HI) are obtained by multiplying two standardized variables, the product of two standardized variables is not necessarily standardized. The standard deviation of the interaction terms is not necessarily unique. Therefore, the B Estimate values and Standardized Coefficient values of the interaction terms are different. The Standardized Coefficient values of MD × HI, ED × HI, PS × HI, and EC × HI are 0.121, 0.23, 0.069, and 0.057, respectively, indicating that when HI increases by one standardized unit, the impact of MD, ED, PS, and EC on SI will increase by 0.121, 0.23, 0.069, and 0.057 standardized units, respectively. The p-values corresponding to MD, ED, PS, EC, HI, MD × HI, ED × HI, PS × HI, and EC × HI are all less than 0.05, indicating that the variable relationships shown by the B Estimate and Standardized Coefficient are valid. HI has a positive moderating effect on the relationships between MD and SI, ED and SI, PS and SI, and EC and SI. Therefore, hypotheses H1–H4 are supported.
To more clearly demonstrate the moderating effect of HI on the relationships between the independent variables (MD, ED, PS, and EC) and the dependent variable (SI), this study employs the method proposed by Aiken and West (1991) to plot the moderation effect [65]. This method enables the illustration of the relationships between the independent variables (MD, ED, PS, and EC) and the dependent variable (SI) within groups characterized by high HI levels (1 standard deviation above the HI average value) and low HI levels (1 standard deviation below the HI average value). The results are presented in Figure 2, Figure 3, Figure 4 and Figure 5.
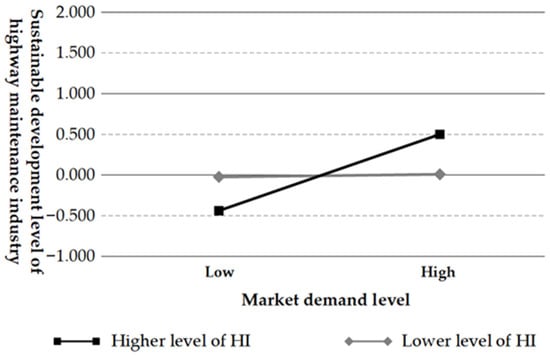
Figure 2.
HI moderator effect for the relationship between MD and SI.
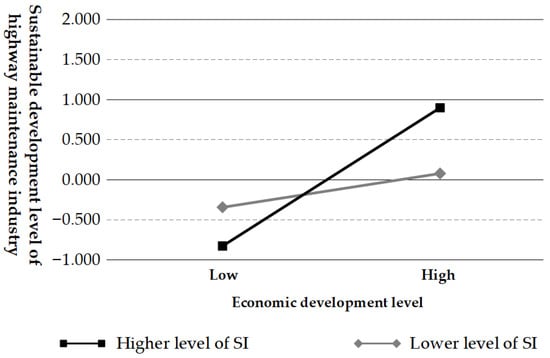
Figure 3.
HI moderator effect for the relationship between ED and SI.
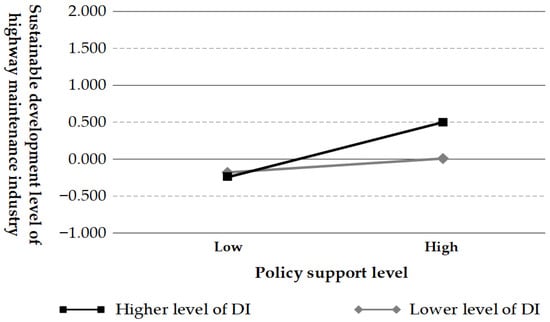
Figure 4.
HI moderator effect for the relationship between PS and SI.
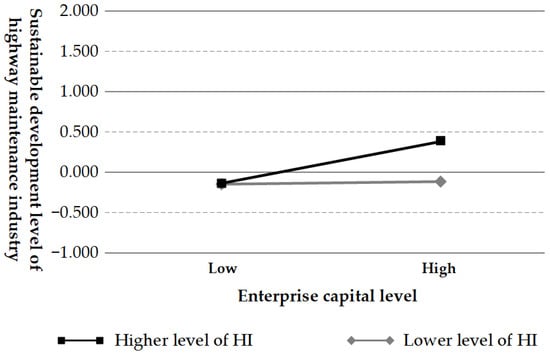
Figure 5.
HI moderator effect for the relationship between EC and SI.
Figure 2 illustrates the moderating effect of HI on the relationship between MD and SI. For both high and low HI groups, the y-values for members with low MD levels (1 standard deviation below the MD average value) and high MD levels (1 standard deviation above the MD average value) were calculated and plotted on the line graph. The black line represents high HI, whereas the grey line represents low HI, and there is an intersection point between these lines. This observation indicates that with an increase in HI, the relationship between MD and SI changes (slope increased by 0.18 and p < 0.001), thereby supporting Hypothesis 1.
Figure 3 depicts the moderating effect of HI on the relationship between ED and SI. Similar to Figure 2, there is an intersection point in Figure 3, which indicates that with an increase in HI, the relationship between ED and SI changes (slope increased by 0.297 and p < 0.001), thus supporting Hypothesis 2.
Figure 4 illustrates the moderating effect of HI on the relationship between PS and SI. There is also an intersection point in Figure 4, which indicates that with an increase in HI, the relationship between PS and SI changes (slope increased by 0.096 and p < 0.001), thereby supporting Hypothesis 3.
Figure 5 illustrates the moderating effect of HI on the relationship between EC and SI. There is also an intersection point in Figure 5, which indicates that with an increase in HI, the relationship between EC and SI changes (slope increased by 0.081 and p < 0.001), thus supporting Hypothesis 4. Furthermore, while the graphical plots of the moderating effects (e.g., Figure 2 for MD and Figure 5 for EC) may appear visually similar, indicating a comparable reinforcing mechanism, the strengths of these effects differ. The weaker moderating effect may be attributed to the high homogeneity and asset-heavy nature of Chinese highway maintenance enterprises.
5.2. Direct Effect Group Difference Test
Based on the characteristics of the respondents’ work, this study classifies the questionnaires filled out by the respondents into two categories: participants involved in the construction phase of the highway maintenance industry and participants involved in the non-construction phase of the highway maintenance industry. The method proposed by Pousette was utilized to compare the group differences between the two groups of questionnaires, and the results were illustrated in Table 6 [66]. The results of the unconstrained model indicated that the measurement weights were invariant (p = 0.408 > 0.05). This establishes that workers from both phases interpret the HI and SI dimensions in a similar manner, fulfilling a critical prerequisite for meaningful group comparison. Subsequently, under the measurement weight constrained hypothesis model, we examined the difference in the relationship between HI and SI across the two groups. The results revealed a significant difference (p < 0.001), indicating that while workers from both phases share a broad understanding of HI and SI concepts (as confirmed by the invariance test), the structural relationship between these two dimensions is perceived differently depending on their work phase. This finding provides support for our hypothesis H5, which postulated a difference in the understanding of the HI-SI relationship between the two groups [67]. Table 5 also provides the values for seven indicators: DF (Degrees of Freedom), CMIN (Chi-Square Minimum), p (p-value), NFI (Normed Fit Index), IFI (Incremental Fit Index), RFI (Relative Fit Index), and TLI (Tucker–Lewis Index). These values are presented to demonstrate that the data for each group, after splitting, still fit the original model.
Table 6.
The results of a group differences test between participants involved in the construction phase of the highway maintenance industry and participants involved in the non-construction phase of the highway maintenance industry.
6. Discussion
Based on the existing research conclusions, this study posits that the reasons for the phenomena corresponding to the research hypotheses in the highway maintenance industry and specific highway maintenance engineering are as follows:
Addressing research gap 1, which highlights the lack of quantitative analysis on the direct effects of various factors on the sustainable development of the highway maintenance industry, this study quantitatively examined the impacts of market demand level (MD), economic development level (ED), policy support level (PS), and enterprise capital level (EC) on the sustainable development level of the highway maintenance industry (SI). The results indicate that a one-unit increase in MD, ED, PS, and EC leads to an expected increase in SI by 0.212, 0.497, 0.185, and 0.09 units, respectively. These findings suggest that ED is the most important factor influencing SI. This is primarily because highway maintenance funding is predominantly derived from government investment, which is directly affected by overall economic development. Given the current economic slowdown, government investment alone is insufficient to meet the demand for highway maintenance, thereby making economic development the most critical factor. While MD and PS also impact SI, their effects are comparatively smaller. This is attributed to the industry’s current inability to fully meet high market demand and the existing supportive policies already satisfying the basic requirements for sustainable development. Conversely, EC exhibits the least impact, likely due to the severe homogenization among highway maintenance enterprises in China, which restricts variability in EC, thereby diminishing its direct effect on SI.
These results demonstrate that although qualitative analyses identify numerous factors influencing SI, quantitative analysis reveals that only key factors exert substantial effects. This underscores the necessity of quantitative analyses for helping stakeholders focus on critical factors, thereby preventing resource dispersion and wastage. The findings provide actionable insights for decision-makers to prioritize economic development and strategic policy support.
Addressing research gap 2, this study identifies the lack of quantitative analysis regarding the indirect effects of AI technology applications on sustainable development in highway maintenance. During the validation of hypotheses H1 through H4, the indirect impacts of HI on the SI were quantitatively assessed. The results indicate that HI strengthens the positive impact of MD, ED, PS, and EC on SI. Specifically, a one-unit increase in HI enhances the effect of MD, ED, PS, and EC on SI by 0.18, 0.297, 0.096, and 0.081 units, respectively.
From the perspective of engineering practice, AI technologies—such as digital twins and predictive machine learning models—improve the operational efficiency of highway maintenance, thereby reinforcing the relationship between MD and SI. For example, AI-supported predictive maintenance enables more effective resource planning to fulfill market demands. Similarly, by facilitating more scientific decision-making, HI strengthens the link between ED and SI. Computer vision systems, for instance, help optimize maintenance priorities, ensuring that limited funds are directed to the most critical needs, thus maximizing maintained highway mileage without raising direct costs. In terms of policy support (PS), the adoption of AI can serve as a key performance indicator, increasing the likelihood that highly digitalized enterprises will qualify for and benefit from subsidies. Furthermore, in a homogenized industry context, the use of advanced AI analytics helps differentiate enterprises (EC), stimulate competition, and raise overall industry efficiency (SI). Additionally, HI enhances the effect of ED on SI by supporting government departments and contractors in making better-informed decisions—such as in prioritizing maintenance schedules and projects—which improves resource allocation efficiency without additional direct costs. Finally, by fostering differentiation among firms in a competitive landscape, HI also promotes healthy competition, which in turn elevates SI and helps align outcomes with policy objectives (PS).
To address research gap 3, the group comparison revealed significant differences (p < 0.001) between construction-phase and non-construction-phase practitioners. The core of the controversy is the uneven benefit distribution: construction-phase entities bear high AI adoption costs without immediate financial gains, while non-construction entities benefit from improved decision-making (e.g., reduced emergency repairs by 30%). This disparity explains the reluctance in AI adoption and underscores the need for collaborative solutions, such as cost-sharing mechanisms, to ensure equitable implementation and industry-wide sustainability.
In summary, this discussion provides a nuanced analysis of the quantitative results, linking them to practical implications and theoretical debates, thereby offering a foundation for evidence-based strategies.
7. Conclusions
This study takes highway maintenance industry practitioners as the research subjects and quantitatively analyzes the market demand level, the economic development level, policy support level, and enterprise capital level, as well as the intelligentization level of highway maintenance engineering and the sustainable development level of the highway maintenance industry and the relationship between them through SEM. The survey data obtained from the questionnaire reflect the road maintenance industry practitioners’ views on the industry’s current development status, which can considerably reflect the current development status of the road maintenance industry, and the research has strong process credibility and conclusion credibility. Based on the quantitative analysis results, this study draws the following conclusions:
(1) AI technology has become the key for the industry to effectively utilize favourable policies to achieve sustainable development. Although China continues to uphold policy backing for transportation infrastructure, such support is unlikely to intensify amid the current economic slowdown. In this context, enhancing the intelligentization level of highway maintenance engineering exerts a positive moderating effect on the relationship between government support and sustainable industry development. By improving intelligentization, policy support can be more efficiently translated into tangible industrial growth momentum.
(2) Industrial development policy formulation must be complemented by empirical investigations and quantitative analyses. While prior studies have identified a range of factors affecting sustainability through theoretical and economic evaluations, this study’s quantitative results reveal substantial variations in the magnitude and pathways (direct vs. indirect) of their impacts. Overreliance on qualitative assessment in policy-making risks resource dispersion and neglect of indirect effects. Thus, beyond the highway maintenance sector, other industries should also strengthen evidence-based policy design through quantitative research to promptly identify and address implementation gaps.
(3) The issue of uneven benefit distribution within the industry chain should be given due consideration in the formulation of development policies. In highway maintenance, AI applications disproportionately benefit non-construction entities (e.g., transportation management departments and maintenance agencies), while construction-phase enterprises bear additional costs with limited financial returns. This imbalance fuels debate over AI adoption and hinders implementation, despite its sustainability potential. As policies often affect value-chain segments differently, entities gaining more from transformation should provide reasonable subsidies to those bearing higher costs. Only through such balanced mechanisms can policies be implemented effectively, promoting sustainable development industry-wide.
8. Shortcomings and Future Research Directions
Future research should focus on addressing the core limitations of this study: Although we independently verified the moderating effect of the level of intelligence (HI) on the relationship between various driving factors (MD, ED, PS, EC) and sustainability (SI), these factors in engineering practice are interrelated and synergistic. To be closer to reality, subsequent research needs to develop and apply new methods capable of testing the combined and interactive effects of multiple variables, such as using structural equation models with latent variable interaction terms, moderated mediation models, or system dynamics simulations. Exploring how MD, ED, PS and EC jointly and interactively affect SI at different HI levels will lead to a more refined and practical understanding. In our subsequent research, we will systematically collect and integrate objective data (such as actual maintenance costs, equipment operation logs, material consumption indicators, etc.), thereby promoting the paradigm evolution of this field from the current situation description to deep mechanism verification. Furthermore, in future research, more detailed questionnaire design and continuous data collection periods were employed to ensure that the data were more in line with the real situation. This will ultimately provide more integrated and operational policy and management recommendations for engineering practice.
Author Contributions
Conceptualization, C.W., J.G. and J.Z.; methodology, J.G., J.Z. and C.W.; software, J.G. and C.W.; validation, J.Z., C.W. and P.Q.; formal analysis, J.Z. and J.G.; investigation, J.G. and J.Z.; resources, J.G. and P.Q.; data curation, J.Z., P.Q. and C.W.; writing—original draft preparation, J.G., J.Z. and C.W.; writing—review and editing, J.G., J.Z., C.W. and P.Q.; visualization, J.G.; supervision, P.Q.; project administration, J.G., J.Z., C.W. and P.Q. funding acquisition, J.G. and P.Q. All authors have read and agreed to the published version of the manuscript.
Funding
The Fundamental Research Funds for Central Universities of China University of Mining and Technology (Grant No. 2024QN11014), the Ministry of Education Humanities and Social Sciences Youth Fund (Application Number: Grant No. 25YJC630031) and the General Program of the China Postdoctoral Science Foundation (Grant No. 2024M753534).
Institutional Review Board Statement
Our study qualifies for an exemption from ethical approval according to the official Chinese legislation ”Ethical Review Measures for Life Sciences and Medical Research Involving Humans”.
Informed Consent Statement
Informed consent was obtained from all subjects involved in the study.
Data Availability Statement
Some or all data, models, or codes that support the findings of this study are available from the corresponding author upon reasonable request via e-mail: qp66092025@163.com.
Acknowledgments
The second author of this paper has made an equal contribution to that of the first author. Therefore, it is hereby declared that the first and second authors of this paper are joint first authors.
Conflicts of Interest
The authors declare no conflicts of interest.
Abbreviations
The following abbreviations are used in this manuscript:
| AI | Artificial Intelligence |
| MD | Market demand level |
| ED | Economic development level |
| PS | Policy support level |
| EC | Enterprise capital level |
| HI | Intelligentization level of highway maintenance engineering |
| SI | Sustainable development level of the highway maintenance industry |
References
- Ministry of Transport of the People’s Republic of China. National Toll Highway Statistical Bulletin. 2013. Available online: https://www.gov.cn/xinwen/2014-12/23/content_2795415.htm (accessed on 29 April 2025).
- Ministry of Transport of the People’s Republic of China. National Toll Highway Statistical Bulletin. 2021. Available online: https://xxgk.mot.gov.cn/2020/jigou/glj/202211/t20221111_3707993.html (accessed on 29 April 2025).
- Ministry of Transport of the People’s Republic of China. Statistical Bulletin on the Development of the Transportation Industry in 2013. Available online: http://cn.chinagate.cn/economics/2014-06/05/content_32582328.htm (accessed on 29 April 2025).
- Ministry of Transport of the People’s Republic of China. Statistical Bulletin on the Development of the Transportation Industry in 2021. Available online: https://www.gov.cn/xinwen/2022-05/25/content_5692174.htm (accessed on 29 April 2025).
- Li, G.; Wei, W. Financial Development, Openness, Innovation, Carbon Emissions, and Economic Growth in China. Energy Econ. 2021, 97, 105194. [Google Scholar] [CrossRef]
- Magazzino, C.; Mele, M. On the Relationship between Transportation Infrastructure and Economic Development in China. Res. Transp. Econ. 2021, 88, 100947. [Google Scholar] [CrossRef]
- Dedrick, J. Green IS: Concepts and Issues for Information Systems Research. Commun. Assoc. Inf. Syst. 2010, 27, 11. [Google Scholar] [CrossRef]
- Xia, H.; Liu, Z.; Efremochkina, M.; Liu, X.; Lin, C. Study on City Digital Twin Technologies for Sustainable Smart City Design: A Review and Bibliometric Analysis of Geographic Information System and Building Information Modeling Integration. Sustain. Cities Soc. 2022, 84, 104009. [Google Scholar] [CrossRef]
- Nishant, R.; Kennedy, M.; Corbett, J. Artificial Intelligence for Sustainability: Challenges, Opportunities, and a Research Agenda. Int. J. Inf. Manag. 2020, 53, 102104. [Google Scholar] [CrossRef]
- Sabeti, S.; Shoghli, O.; Baharani, M.; Tabkhi, H. Toward AI-Enabled Augmented Reality to Enhance the Safety of Highway Work Zones: Feasibility, Requirements, and Challenges. Adv. Eng. Inform. 2021, 50, 101429. [Google Scholar] [CrossRef]
- Costin, A.; Adibfar, A.; Hu, H.; Chen, S.S. Building Information Modeling (BIM) for Transportation Infrastructure—Literature Review, Applications, Challenges, and Recommendations. Autom. Constr. 2018, 94, 257–281. [Google Scholar] [CrossRef]
- Winch, G. Models of Manufacturing and the Construction Process: The Genesis of Re-Engineering Construction. Build. Res. Inf. 2003, 31, 107–118. [Google Scholar] [CrossRef]
- Wheat, P. Scale, Quality and Efficiency in Road Maintenance: Evidence for English Local Authorities. Transp. Policy 2017, 59, 46–53. [Google Scholar] [CrossRef]
- Tamagusko, T.; Gomes Correia, M.; Ferreira, A. Machine Learning Applications in Road Pavement Management: A Review, Challenges and Future Directions. Infrastructures 2024, 9, 213. [Google Scholar] [CrossRef]
- Deng, Y.; Ji, F. Research on the Construction and Maintenance of Ordinary Highways: From the Perspective of Financial Investment. Public Financ. Res. 2013, 04, 54–57. [Google Scholar] [CrossRef]
- Zhao, N.; Liu, Y.; Chen, H. A Hybrid Approach to Investigating Major Management Factors for Effective Highway Preventive Maintenance. Sci. Rep. 2024, 14, 25455. [Google Scholar] [CrossRef] [PubMed]
- Antoniou, F.; Aretoulis, G.; Konstantinidis, D.; Papathanasiou, J. Choosing the Most Appropriate Contract Type for Compensating Major Highway Project Contractors. J. Comput. Optim. Econ. Financ. 2014, 6, 77. [Google Scholar]
- Short, J.; Kopp, A. Transport Infrastructure: Investment and Planning. Policy and Research Aspects. Transp. Policy 2005, 12, 360–367. [Google Scholar] [CrossRef]
- Polyzos, S.; Tsiotas, D. The Contribution of Transport Infrastructures to the Economic and Regional Development: A Review of the Conceptual Framework. Theor. Empir. Res. Urban Manag. 2020, 15, 5–23. [Google Scholar]
- Zhao, J.; Fu, X.; Zhang, Y. Research on Risk Assessment and Safety Management of Highway Maintenance Project. Procedia Eng. 2016, 137, 434–441. [Google Scholar] [CrossRef]
- Ansell, M.; Holmes, M.; Evans, R.; Pasquire, C.; Price, A. Delivering Best Value in Highways Major Maintenance Schemes: Case Study. J. Constr. Eng. Manag. 2009, 135, 235–245. [Google Scholar] [CrossRef]
- Morishima, M. Marx in the Light of Modern Economic Theory. Econometrica 1974, 42, 611–632. [Google Scholar] [CrossRef]
- Postone, M. Time, Labor, and Social Domination: A Reinterpretation of Marx’s Critical Theory; Cambridge University Press: Cambridge, UK, 1993; ISBN 978-0-521-56540-0. [Google Scholar]
- Arboledas-Lérida, L. A Marxist Analysis of the Metrification of Academic Labor: Research Impact Metrics and Socially Necessary Labor Time. Sci. Soc. 2024, 88, 573–600. [Google Scholar] [CrossRef]
- Bober, M.M. Marx and Economic Calculation. Am. Econ. Rev. 1946, 36, 344–357. [Google Scholar]
- Smith, M.E.G. Productivity, Valorization and Crisis: Socially Necessary Unproductive Labor in Contemporary Capitalism. Sci. Soc. 1993, 57, 262–293. [Google Scholar] [CrossRef]
- Huang, L.-L.; Lin, J.-D.; Huang, W.-H.; Kuo, C.-H.; Huang, M.-Y. Application of Automated Pavement Inspection Technology in Provincial Highway Pavement Maintenance Decision-Making. Appl. Sci. 2024, 14, 6549. [Google Scholar] [CrossRef]
- Tavakoli Dastjerdi, M.H.; Liu, Z.; Azmoon, B.; Yuan, X. Enhancing Winter Road Maintenance via Cloud Computing. IEEE Internet Comput. 2023, 27, 6–14. [Google Scholar] [CrossRef]
- Li, S.; Liu, Y.; Zhou, J.; Han, R.; Kong, X.; Xu, R. Real-Time Edge AI Algorithm for Road Defects Detection. Road Mater. Pavement Des. 2025, 26, 2588–2606. [Google Scholar] [CrossRef]
- Hatamzad, M.; Pinerez, G.C.P.; Casselgren, J. Intelligent Cost-Effective Winter Road Maintenance by Predicting Road Surface Temperature Using Machine Learning Techniques. Knowl. Based Syst. 2022, 247, 108682. [Google Scholar] [CrossRef]
- Anastasopoulos, P.C.; McCullouch, B.G.; Gkritza, K.; Mannering, F.L.; Sinha, K.C. Cost Savings Analysis of Performance-Based Contracts for Highway Maintenance Operations. J. Infrastruct. Syst. 2010, 16, 251–263. [Google Scholar] [CrossRef]
- Fallah-Fini, S.; Rahmandad, H.; Triantis, K.; de la Garza, J.M. Optimizing Highway Maintenance Operations: Dynamic Considerations. Syst. Dyn. Rev. 2010, 26, 216–238. [Google Scholar] [CrossRef]
- Babina, T.; Fedyk, A.; He, A.; Hodson, J. Artificial Intelligence, Firm Growth, and Product Innovation. J. Financ. Econ. 2024, 151, 103745. [Google Scholar] [CrossRef]
- Han, C.; Ma, T.; Xu, G.; Chen, S.; Huang, R. Intelligent Decision Model of Road Maintenance Based on Improved Weight Random Forest Algorithm. Int. J. Pavement Eng. 2022, 23, 985–997. [Google Scholar] [CrossRef]
- Baxter, J. A Model of Inductive Bias Learning. J. Artif. Intell. Res. 2000, 12, 149–198. [Google Scholar] [CrossRef]
- Pouyanfar, S.; Sadiq, S.; Yan, Y.; Tian, H.; Tao, Y.; Reyes, M.P.; Shyu, M.-L.; Chen, S.-C.; Iyengar, S.S. A Survey on Deep Learning: Algorithms, Techniques, and Applications. ACM Comput. Surv. 2018, 51, 36. [Google Scholar] [CrossRef]
- Buhrmester, V.; Münch, D.; Arens, M.; Buhrmester, V.; Münch, D.; Arens, M. Analysis of Explainers of Black Box Deep Neural Networks for Computer Vision: A Survey. Mach. Learn. Knowl. Extr. 2021, 3, 966–989. [Google Scholar] [CrossRef]
- Tamagusko, T.; Correia, M.G.; Huynh, M.A.; Ferreira, A. Deep Learning Applied to Road Accident Detection with Transfer Learning and Synthetic Images. Transp. Res. Procedia 2022, 64, 90–97. [Google Scholar] [CrossRef]
- Hossain, M.I.; Gopisetti, L.S.P.; Miah, M.S. International Roughness Index Prediction of Flexible Pavements Using Neural Networks. J. Transp. Eng. Part B Pavements 2019, 145, 04018058. [Google Scholar] [CrossRef]
- Lei, P.-W.; Wu, Q. Introduction to Structural Equation Modeling: Issues and Practical Considerations. Educ. Meas. Issues Pract. 2007, 26, 33–43. [Google Scholar] [CrossRef]
- Preston, C.C.; Colman, A.M. Optimal Number of Response Categories in Rating Scales: Reliability, Validity, Discriminating Power, and Respondent Preferences. Acta Psychol. 2000, 104, 1–15. [Google Scholar] [CrossRef]
- Dawes, J. Do Data Characteristics Change According to the Number of Scale Points Used? An Experiment Using 5-Point, 7-Point and 10-Point Scales. Int. J. Mark. Res. 2008, 50, 61–104. [Google Scholar] [CrossRef]
- Lietz, P. Research into Questionnaire Design: A Summary of the Literature. Int. J. Mark. Res. 2010, 52, 249–272. [Google Scholar] [CrossRef]
- Durdyev, S.; Ismail, S.; Kandymov, N. Structural Equation Model of the Factors Affecting Construction Labor Productivity. J. Constr. Eng. Manag. 2018, 144, 04018007. [Google Scholar] [CrossRef]
- Zielińska, A.; Lebuda, I.; Karwowski, M. Scaling the Creative Self: An Item Response Theory Analysis of the Short Scale of Creative Self. Creat. Res. J. 2022, 34, 431–444. [Google Scholar] [CrossRef]
- Wang, J.; Liu, Q.; Shang, J.; Li, X. Data as Evidence: Research on the Impacting Mechanisms of Dual Prevention Mechanism Construction in Chinese Coal Enterprise Based on SEM. Int. J. Inj. Control Saf. Promot. 2025, 32, 360–375. [Google Scholar] [CrossRef] [PubMed]
- Hair, J.F., Jr.; Black, W.C.; Babin, B.J.; Anderson, R.E. Multivariate Data Analysis, 6th ed.; Prentice Hall: Hoboken, NJ, USA, 2006; ISBN 978-0-13-813263-7. [Google Scholar]
- Lam, T.; Gale, K. Highway Maintenance: Impact of Framework Agreements on Contractor Performance. Eng. Constr. Archit. Manag. 2014, 21, 336–347. [Google Scholar] [CrossRef]
- Kim, J. Don’t Pass Deferred Maintenance Costs to the Next Generation! The Effects of Politics on State Highway Maintenance Spending. Public Work. Manag. Policy 2022, 27, 127–151. [Google Scholar] [CrossRef]
- Li, Y.; Fan, J.; Deng, H. Analysis of Regional Difference and Correlation between Highway Traffic Development and Economic Development in China. Transp. Res. Rec. J. Transp. Res. Board. 2018, 2672, 12–25. [Google Scholar] [CrossRef]
- Wang, P.; Liu, P.; Wang, C.; Wang, A.; Guan, H.; Li, S.; Xia, X. Optimal Dynamic Investment Allocation on Construction of Intelligent Transportation Infrastructure and Road Maintenance with Environmental Costs. J. Clean. Prod. 2021, 284, 124786. [Google Scholar] [CrossRef]
- Ribreau, N. Highway Maintenance Outsourcing Experience: Synopsis of Washington State Department of Transportation’s Review. Transp. Res. Rec. J. Transp. Res. Board. 2004, 1877, 3–9. [Google Scholar] [CrossRef]
- Guevara, J.; Garvin, M.J.; Ghaffarzadegan, N. Capability Trap of the U.S. Highway System: Policy and Management Implications. J. Manag. Eng. 2017, 33, 04017004. [Google Scholar] [CrossRef]
- Cowell, S.; Begg, K.; Clift, R. Support for Sustainable Development Policy Decisions A Case Study from Highway Maintenance. Int. J. Life Cycle Assess. 2006, 11, 29–39. [Google Scholar] [CrossRef]
- Friedman, S. Is Counter-Productive Policy Creating Serious Consequences? The Case of Highway Maintenance. Syst. Dyn. Rev. 2006, 22, 371–394. [Google Scholar] [CrossRef]
- Kronborg, D.; Thomsen, S. Foreign Ownership and Long-Term Survival. Strateg. Manag. J. 2009, 30, 207–219. [Google Scholar] [CrossRef]
- Chung, Y.P.; Na, H.S.; Smith, R. How Important Is Capital Structure Policy to Firm Survival? J. Corp. Financ. 2013, 22, 83–103. [Google Scholar] [CrossRef]
- Wang, Y.; Sukpasjaroen, K. Construction of Enterprise Performance Evaluation System Based on Sustainable Development Perspective: Evidence from Heavily Polluting Listed Companies in China. Migr. Lett. 2024, 21, 126–136. [Google Scholar]
- Wang, T.; Ma, X.; Li, H.; Dong, Z. Analysis Methodology and Assessment Indices of Vulnerability for Asphalt Pavement in Cold Regions. J. Infrastruct. Preserv. Resil. 2021, 2, 11. [Google Scholar] [CrossRef]
- Wang, D.; Huang, R.; Qiao, Y.; Sheng, Z.; Li, K.; Zhao, L. How Perceived Leader–Member Exchange Differentiation Affects Construction Workers’ Safety Citizenship Behavior: Organizational Identity and Felt Safety Responsibility as Mediators. J. Constr. Eng. Manag. 2023, 149, 04023110. [Google Scholar] [CrossRef]
- Jöreskog, K.G.; Sörbom, D. Recent Developments in Structural Equation Modeling. J. Mark. Res. 1982, 19, 404–416. [Google Scholar] [CrossRef]
- Grimm, L.G.; Yarnold, P.R. Reading and Understanding More Multivariate Statistics; Amer Psychological Assn: Washington, DC, USA, 2000; ISBN 978-1-55798-698-6. [Google Scholar]
- Weston, R.; Gore, P.A., Jr. A Brief Guide to Structural Equation Modeling. Couns. Psychol. 2006, 34, 719–751. [Google Scholar] [CrossRef]
- Cho, Y.; Chung, O.-B. A Mediated Moderation Model of Conformative Peer Bullying. J. Child. Fam. Stud. 2012, 21, 520–529. [Google Scholar] [CrossRef]
- Aiken, L.S.; West, S.G.; Reno, R.R. Multiple Regression: Testing and Interpreting Interactions; Sage: Thousand Oask, CA, USA, 1991. [Google Scholar]
- Pousette, A.; Hanse, J.J. Job Characteristics as Predictors of Ill-Health and Sickness Absenteeism in Different Occupational Types--a Multigroup Structural Equation Modelling Approach. Work Stress 2002, 16, 229–250. [Google Scholar] [CrossRef]
- Hagger, M.S.; Chatzisarantis, N.L.D.; Barkoukis, V.; Wang, J.C.K.; Hein, V.; Pihu, M.; Soós, I.; Karsai, I. Cross-Cultural Generalizability of the Theory of Planned Behavior among Young People in a Physical Activity Context. J. Sport Exerc. Psychol. 2007, 29, 2–20. [Google Scholar] [CrossRef]
Disclaimer/Publisher’s Note: The statements, opinions and data contained in all publications are solely those of the individual author(s) and contributor(s) and not of MDPI and/or the editor(s). MDPI and/or the editor(s) disclaim responsibility for any injury to people or property resulting from any ideas, methods, instructions or products referred to in the content. |
© 2026 by the authors. Licensee MDPI, Basel, Switzerland. This article is an open access article distributed under the terms and conditions of the Creative Commons Attribution (CC BY) license.